icma part ii - nmml.org
TRANSCRIPT

Leading Your OrganizationLeading Your OrganizationLeading Your OrganizationLeading Your Organization((and Elected Officialsand Elected Officials)) to to
Fiscal Health and WellnessFiscal Health and WellnessFiscal Health and WellnessFiscal Health and Wellnessthroughthrough
Priority Based Budgeting Priority Based Budgeting ((Part IIPart II))Priority Based Budgeting Priority Based Budgeting ((Part IIPart II))
Jon Johnson & Chris FabianJon Johnson & Chris FabianDecember 5, 2013
1

2
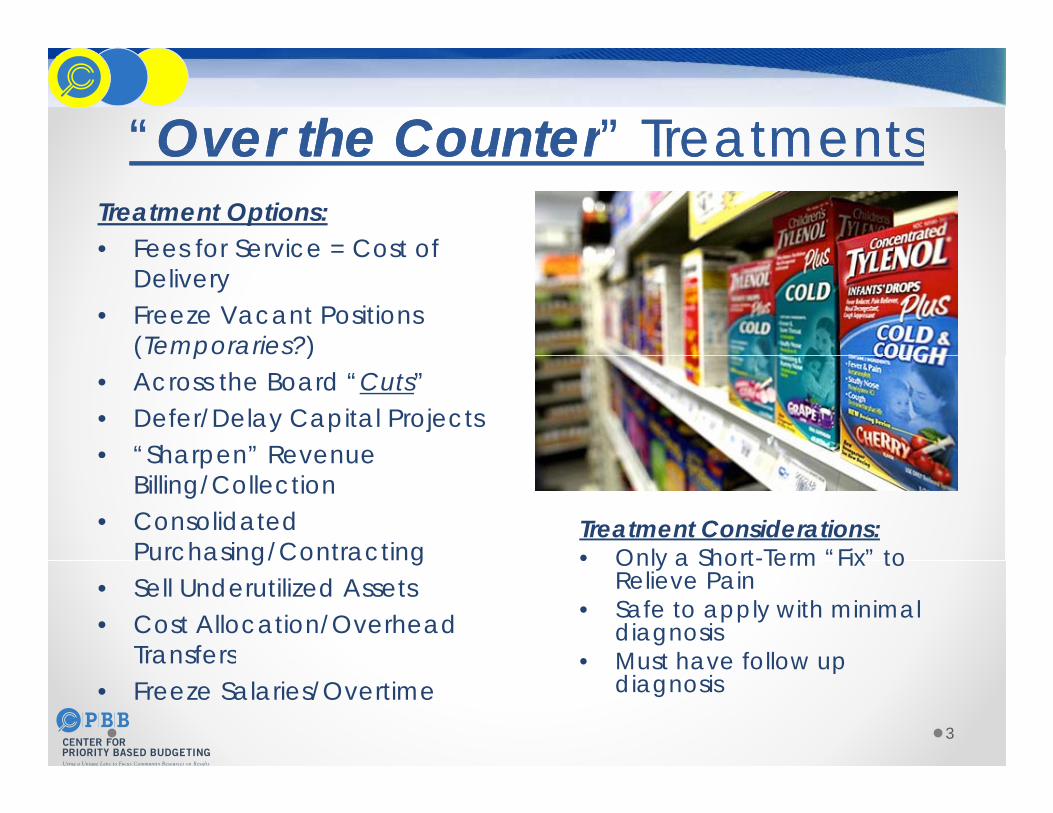
““Over the CounterOver the Counter” Treatments” TreatmentsOver the CounterOver the Counter Treatments TreatmentsTreatment Options:• Fees for Service = Cost of Fees for Service Cost of
Delivery• Freeze Vacant Positions
(Temporaries?)( p )• Across the Board “Cuts”• Defer/Delay Capital Projects• “Sharpen” Revenue Sharpen Revenue
Billing/Collection• Consolidated
Purchasing/ContractingTreatment Considerations:• Only a Short-Term “Fix” to u c as g/Co ac g
• Sell Underutilized Assets• Cost Allocation/Overhead
Transfers
Only a Short Term Fix to Relieve Pain
• Safe to apply with minimal diagnosis
• Must have follow up Transfers• Freeze Salaries/Overtime
3
• Must have follow up diagnosis

“Emergency“Emergency--RoomRoom” ” TreatmentsTreatmentsEmergencyEmergency RoomRoom TreatmentsTreatmentsTreatment Options:• Across the Board Budget
“Amputation”• Hiring Freeze/Furloughs• Reduction in Workforce• 4-Day work weeks• Reduce Services• Reduce Services• Spend “Savings” Reserves • Early Retirement
Incentives
Treatment Considerations:• Don’t apply without Incentives
• Outsourcing/Shared ServicesR i R t t
pp ydiagnosis
• Don’t be guilty of malpractice
4
• Resize or Restructurep
• Only to “Stop the Bleeding”
““CosmeticCosmetic” Treatments” Treatments((Not a Solution!!!Not a Solution!!!))
Accounting GimmicksShifting Operational Costs to Capital BudgetsShifting Operational Costs to Capital BudgetsDeferring CompensationUnderfund Accrued LiabilitiesUnderfund Accrued LiabilitiesShort –term borrowing“Distort” estimates or projectionsDistort estimates or projections
5

BRINGING VISION INTO FOCUSBRINGING VISION INTO FOCUSWITH A NEW “LENS”WITH A NEW “LENS”WITH A NEW LENSWITH A NEW LENS
6

Achieving Fiscal Health & WellnessAchieving Fiscal Health & Wellnessgg2 Strategic Initiatives2 Strategic Initiatives
Fiscal Health Long-term Fiscal Wellness
7

From 2007
Across the Board Cuts Address $14.5 Billion ShortfallCalifornia Governor’s Office: “Across-the-board California Governor s Office: Across the board approach spreads reductions as evenly as possible so no single program gets singled out.”
Reaction: “the governor’s approach would be like a family deciding to cuts its monthly mortgage payment, dining-out tab and Netflix subscription each p y , g pby 10%, rather than eliminating the restaurant and DVD spending in order to keep up the house payments.”
8
p y

According to Moody’s:According to Moody’s:According to Moody s:According to Moody s:Across-the-Board versus Targeted Budget Cutsg g
“Across-the-board cuts can be a way to avoid tough decisions”“Targeted cuts require a serious discussion of community values, relative benefits of different services, and long-term implications”services, and long term implications
Moody's wants to see how local governments plan for and respond to financial challenges p p gover the long term
“Making targeted cuts can demonstrate a more
9
strategic approach to managing the fiscal crisis”

“Across the board cuts spreads the pain evenly and also evenly spreads the mediocrity”spreads the mediocrity
- Budget Director for the State of Louisiana
10

Achieving Long-Term Fiscal Wellness Achieving Long Term Fiscal Wellness
11

STEPS to SUCCESS STEPS to SUCCESS –– Priority Based BudgetingPriority Based BudgetingS S o SUCC SS S S o SUCC SS o y ased udge go y ased udge g1. Determine Results
Accurate prioritization of programs, reflecting the organization’s statedobjectives, depends on the comprehensive identification of the Resultsj p pit is in business to achieve
2. Clarify Result DefinitionsPrecision in prioritization depends on the articulation of the cause andeffect relationship between a program and a Resulteffect relationship between a program and a ResultUsing clearly defined “Result Maps”, detailing the factors that influencethe way Results are achieved, the organization can minimize subjectivityin the process of linking programs with its Results
3 Identify Programs and Services3. Identify Programs and ServicesComparing individual programs and services as opposed to comparingdepartments that provide those services allows for better prioritization
4. Value Programs Based on ResultsgWith the right Results that are clearly defined, the organization can moreaccurately “value” a program relative to its influence on achievingResults
5 Allocate Resources Based on Priorities
12
5. Allocate Resources Based on PrioritiesUsing “Resource Alignment Diagnostic Tool”

Strategic Questions Strategic Questions 1. What are we in “business” to do?
13

What are “Results”What are “Results”What are ResultsWhat are Results• High-level and over-arching reasons the organization g g g
exists in the eyes of the community
• Remain consistent and unchanged over timeg
• Comprehensive
Di ti i h d f (i “R lt ” t )• Distinguished from (i.e. “Results” are not…)o Vision or Mission Statementso Organizational Values
• How we want to achieve our resultso “Marketing” statements
• Look and feel of the community
14
o Specific short-term, projects, goals or initiatives

Step 1Step 1: : Determine ResultsDetermine ResultsCity of Grand Island, Nebraska
Community ResultsCommunity Results• Used to Differentiate Programs Offered to the Community• Not All Programs Achieve these Results• Programs that Achieve Many Results with a High
Stewardship of the Environment
Safe Community
Strategic, Sustainable and Maintained • Programs that Achieve Many Results, with a High Degree of Influence, Achieve Highly in Prioritization (demonstrate high degree of relevance)
Q lit S i R lt
g ,Development
Mobility Options
Quality Service Results• Every Program Should Achieve these Results (though potentially, not every program does)• Not Used to Differentiate the Relevance of Programs
Efficient Services
Transparent Services
gin Prioritization
Governance Results• Used to Differentiate Programs Designed to Support
Financial Stewardship
High‐quality Workforce
15
• Used to Differentiate Programs Designed to Support GovernanceRegulatory Compliance

16

17

Validating ResultsValidating Results
18

Step 2: Clarify Result DefinitionsStep 2: Clarify Result Definitions((Result Maps)Result Maps)((Result Maps)Result Maps)
City of Boulder, CO Results
Accessible & Connected Community
Economically Vital Community
Healthy Environment & Community
Inclusive & Socially Thriving Community
Safe Community
19
Safe Community

Defining ResultsDefining ResultsR lt M i E iR lt M i E iResult Mapping ExerciseResult Mapping Exercise
20

Creating Result MapsCreating Result Maps
21

Identify and Define ResultsCity of Grand Island, NebraskaCity of Grand Island, Nebraska
Identify and Define ResultsManages and
mitigates factors that impact environmental
quality and sustainability
STEWARDSHIP
Encourages energy conservation and efficiency through
education, incentives and the provision of
Provides for the renewal of the
environment through recycling and reuse STEWARDSHIP
of the ENVIRONMENT
alternative solutions
Controls and abates threats to the
Promotes and regulates a clean,
orderly and
22
environment cased by nature
orderly and ecologically balanced
community

The City of Chandler, ArizonaThe City of Chandler, Arizona
Protects the Community by justly enforcing the
law, promptly responding to calls for responding to calls for
service and being prepared for all
emergency situations
l t
SAFE
Provides safe traffic flow, safe roads and a well-
maintained transportation system
Ensures regulatory compliance in order to protect property, the environment and the
lives of its residents and visitors SAFE
COMMUNITY
Fosters a feeling of personal safety through
a visible and approachable presence
Offers a variety of safe activities and safety d ti t
23
approachable presence that ensures proactive
prevention and responds to community concerns
education to engage with youth and families

The City of Wheat Ridge, ColoradoThe City of Wheat Ridge, Colorado
Offers and supports a variety of safe activities and facilities that provide for the physical health
and social well-being of the communitycommunity
Fosters a feeling of personal safety throughout the
community by establishing a visible, accessible presence that proactively provides for
prevention intervention safety
Provides for the protection and sustainability of the
environment through regulatory compliance, planning and effective
SAFE COMMUNITY
prevention, intervention, safety education, and community
involvement
planning and effective stormwater management
COMMUNITYOffers protection, enforces the
law and is well-prepared to promptly and effectively
Provides for a safe transportation network that is well-maintained, accessible,
enhances traffic flow and promptly and effectively respond to emergencies and
calls for service
Creates a secure, well-regulated, well-maintained
it th t i h lth
enhances traffic flow and offers safe mobility to motorists, cyclists and pedestrians alike
24
community that is healthy, clean, well-lit and visually
attractive

The Town of Christiansburg, VirginiaThe Town of Christiansburg, Virginia
Provides assurance of regulatory and policy
compliance to minimize and mitigate
risk
Protects and prudently manages its financial, human, physical and
Attracts, motivates and develops a high-quality workforce, dedicated
GOOD GOVERNANCE
, p ytechnology resourcesto public service
GOVERNANCE (Sound Financial Entity)
Enables and enhances transparency,
accountability,
Supports decision-making with timely and
accurate short term accountability, integrity, efficiency and
innovation in all operations
Responsive, accessible
accurate short-term and long-range
analysis
25
Responsive, accessible and courteous to its
customers

Role of the Council/BoardRole of the Council/Board• Have transparent access to listing of all programs
offered along with associated costs and FTE• Educate themselves on the variety and diversity of
programs offered programs offered
Role of the CitizensRole of the Citizens• Have transparent access to listing of all programs
offered along with associated costs and FTE• Be informed about the nature of the programs
offered to residents businesses and visitors
26

Strategic Questions Strategic Questions
1 Wh t i “b i ” t d ?1. What are we in “business” to do?2. What exactly do we do?
27

Identify “Programs” within DepartmentsIdentify “Programs” within Departments/ / y g py g pDivisionsDivisions
Departments develop their own “ ” i t i
CITY OF BOULDER, COLORADOD t t P I t“program” inventories
Comprehensive list of “what we do”
Department Program Inventory
Directions: For all of the programs and services in your department, identify the program name. When completed, please e‐mail the
Monday, July 26, 2010
Comparing relative value of programs, not relative value of departments
G ldil k & th Th B N t t
Fund No. Department Providing Program Program Name
010 Community Planning & Sustainability General Business Assistance010 Community Planning & Sustainability Business Retention and Expansion
Program Inventory back to Jim Reasor
Goldilocks & the Three Bears: Not too big, not too small, just right!
TOO BIG = Departments/DivisionsTOO SMALL = Tasks
010 Community Planning & Sustainability Business Retention and Expansion010 Community Planning & Sustainability Business Incentive Programs
010 Community Planning & SustainabilityBusiness Partnerships and Sponsorships
140 Community Planning & Sustainability Energy Decarbonization
JUST RIGHT = Measure relative size based on costs/people associated with program to more discretely demonstrate how resources are
140 Community Planning & Sustainability Green Job Creation140 Community Planning & Sustainability Climate Adaptation Planning
112 Community Planning & Sustainability Comprehensive Planning112 Community Planning & Sustainability Intergovernmental Relations
28
used 112 Community Planning & Sustainability Historic Preservation112 Community Planning & Sustainability Ecological Planning
City of Boulder, Colorado

OBJECTIVES for OBJECTIVES for Developing Developing Program InventoriesProgram InventoriesDeveloping Developing Program InventoriesProgram Inventories
Create a comprehensive listing of all servicesoffered by each operating division (to bothy p g (“external” and “internal” users)
Provide a better understanding of “what we do” tot ff d i i t ti l t d ffi i l d itistaff, administration, elected officials and citizens
Provide a framework to better understand howresources are used to support “what we do”resources are used to support what we doProvide a valuable tool for staff, management andelected officials to use when faced with budgetaryelected officials to use when faced with budgetary“choices” about how funds are distributed.
Allow for the preparation and discussion of a
29
p p“program budget” rather than a “line-item budget”

Defining ProgramsDefining ProgramsTo determine “just right”, look for “differences” thatmight help determine if an activity can be defined as a
e g og a se g og a s
g p y“stand-alone” program
“Who” are you doing the activity for?D it b fit ifi d hi l ti ?Does it benefit a specific demographic group or population?
“What” are you doing the service to?Does it affect a specific property or asset (infrastructure facilityDoes it affect a specific property or asset (infrastructure, facility,etc.)
“How” is it funded? – Is there someone paying for it?A th i t d di tl ith thAre there revenue sources associated directly with the program(“Program Revenues”)
What “type” of service are you providing?
30
Preventative, Replacement; Repair/Maintenance; Instruction;Protection; Informative; etc.

Defining ProgramsDefining Programse g og a se g og a s
Has someone told us we “have to do it?”Are there statutes, ordinances, resolutions, or other legislativedocuments that require us to provide the service?
Is there an “End Product” as a result of doing it?Is there an End Product as a result of doing it?Does the external or internal user get something tangiblewhen the service is delivered?
“Is there someone outside the organization thatIs there someone outside the organization that“does the same thing”?
Does a private business offer a similar service (“Yellow Pagestest”)test )
Do we “advertise” that we do it?Is there a separate phone directory or website reference tothe service?
31
the service?

How to How to How to How to Identify Program CostsIdentify Program Costs
1) Associate Salary & Benefit Costs with your Personnel
2) Assign Personnel to the Programs they ProvideProvide
3) Associate Non-Personnel Costs with ProgramsPrograms
4) Line item Budget is now expressed as a
32
Program Budget!

1) Associate Salary & Benefit Costs1) Associate Salary & Benefit Costsith P lith P lwith your Personnelwith your Personnel
• Key is understanding how personnel line items are distributed (per FTE, on a t f l b i t )
33
percentage of salary basis, etc.)

2) Assign Personnel to the 2) Assign Personnel to the P th P idP th P idPrograms they ProvidePrograms they Provide
• Estimate for a given year (this is not a time study!)• Accuracy not precision is the goal
34
• Accuracy, not precision, is the goal • Can’t allocate an FTE over 100% (no matter how overworked they think they are)

3) Associate Non3) Associate Non--Personnel Costs Personnel Costs with Programswith Programswith Programswith Programs
• Choose a reasonable allocation methodology:• Divide costs by FTE (i e supplies line item)
35
Divide costs by FTE (i.e. supplies line item)• Assign costs directly to program (i.e. annual audit)

Role of the Council/BoardRole of the Council/Board• Have transparent access to listing of all programs
offered along with associated costs and FTE• Educate themselves on the variety and diversity of
programs offered programs offered
Role of the CitizensRole of the Citizens• Have transparent access to listing of all programs
offered along with associated costs and FTE• Be informed about the nature of the programs
offered to residents businesses and visitors
36

Strategic Questions Strategic Questions 1. What are we in “business” to do?2 What exactly do we do?2. What exactly do we do?3. How do we figure out what is “core” OR
What is of the highest importance?What is of the highest importance?
37
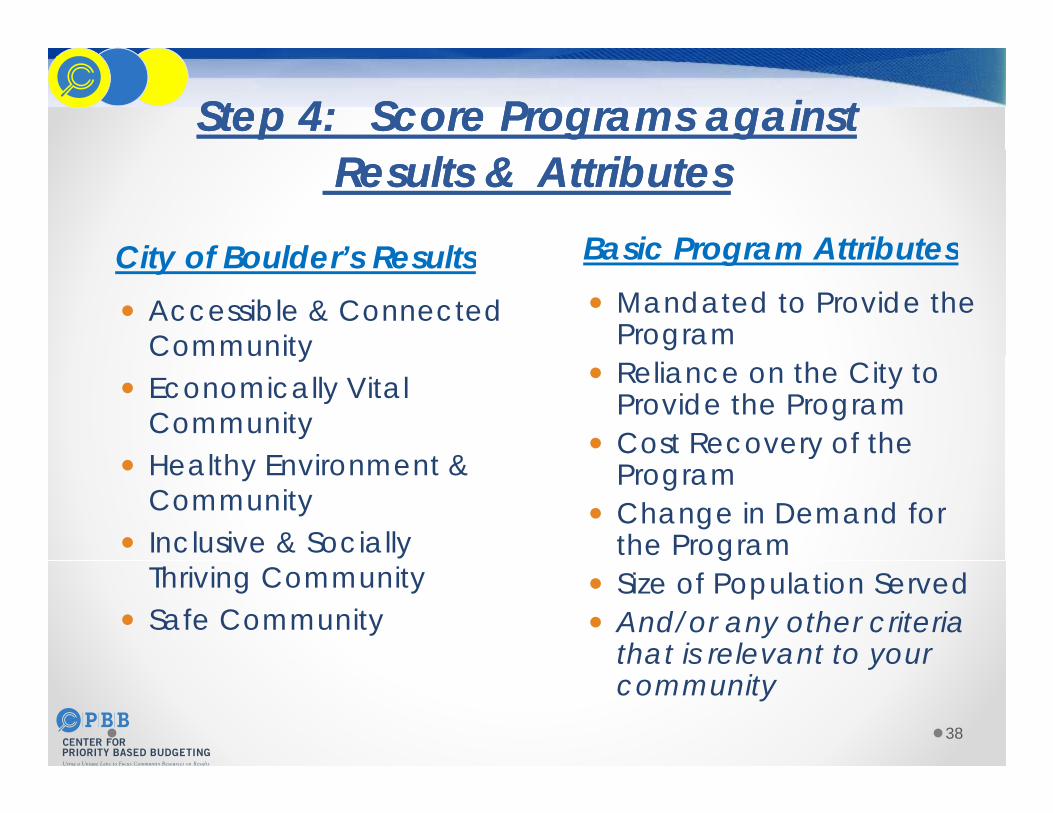
Step 4: Score Programs againstStep 4: Score Programs againstResults & AttributesResults & Attributes
City of Boulder’s Results Basic Program AttributesCity of Boulder’s Results Basic Program Attributes
Accessible & Connected Community
Mandated to Provide the ProgramCommunity
Economically Vital CommunityH lth E i t &
Reliance on the City to Provide the ProgramCost Recovery of the
Healthy Environment & CommunityInclusive & Socially
yProgram Change in Demand for the Program
Thriving CommunitySafe Community
gSize of Population ServedAnd/or any other criteria that is relevant to your
38
that is relevant to your community

Simple Scoring Scale Simple Scoring Scale ––“ ” “ ” f l t ltf l t lt“Degree” “Degree” of Relevance to a Resultof Relevance to a Result
4 = P h ti l iti l4 = Program has an essential or criticalrole in achieving Result
3 = Program has a strong influence on “High Degree” of Relevance3 Program has a strong influence on
achieving Result2 = Program has some degree of g g
influence on achieving Result1 = Program has minimal (but some)
i fl hi i R lt
“Lower Degree” of Relevance (still a clear connection)
influence on achieving Result0 = Program has no influence on
achieving Result No Clear Connection
39
achieving Result Connection

Basic Program AttributesBasic Program Attributes::M d t d t P id PM d t d t P id PMandated to Provide ProgramMandated to Provide Program
• Programs that are mandated by another level of government (i.e.federal state or county) will receive a higher score for this attributefederal, state or county) will receive a higher score for this attributecompared to programs that are mandated solely by the City orhave no mandate whatsoever.
• The grading criterion established to score programs on a 0 to 4• The grading criterion established to score programs, on a 0 to 4scale is as follows:o 4 = Required by Federal, State or County legislation
3 = Required by Charter or incorporation documents OR too 3 = Required by Charter or incorporation documents OR tocomply with regulatory agency standards
o 2 = Required by Code, ordinance, resolution or policy OR to fulfillexecuted franchise or contractual agreementexecuted franchise or contractual agreement
o 1 = Recommended by national professional organization tomeet published standards, other best practice0 N i t d t i t
40
o 0 = No requirement or mandate exists
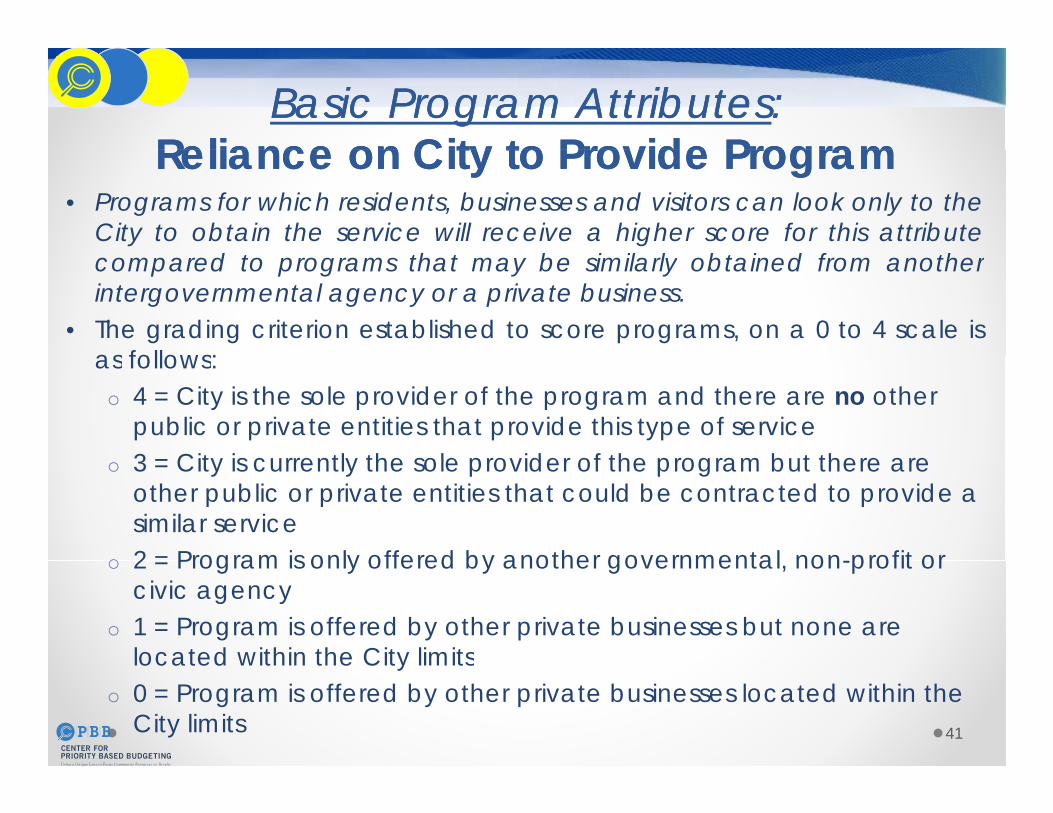
Basic Program AttributesBasic Program Attributes::Reliance on City to Provide ProgramReliance on City to Provide ProgramReliance on City to Provide ProgramReliance on City to Provide Program
• Programs for which residents, businesses and visitors can look only to theCity to obtain the service will receive a higher score for this attribute
d t th t b i il l bt i d f thcompared to programs that may be similarly obtained from anotherintergovernmental agency or a private business.
• The grading criterion established to score programs, on a 0 to 4 scale isas follows:as follows:
o 4 = City is the sole provider of the program and there are no other public or private entities that provide this type of service3 City is currently the sole provider of the program but there are o 3 = City is currently the sole provider of the program but there are other public or private entities that could be contracted to provide a similar service
o 2 = Program is only offered by another governmental non profit or o 2 = Program is only offered by another governmental, non-profit or civic agency
o 1 = Program is offered by other private businesses but none are located within the City limits
41
located within the City limitso 0 = Program is offered by other private businesses located within the
City limits

Basic Program AttributesBasic Program Attributes::Change in Demand for ProgramChange in Demand for ProgramChange in Demand for ProgramChange in Demand for Program
• Programs demonstrating an increase in demand or utilization will receive ahigher score for this attribute compared to programs that show no growthin demand for the program Programs demonstrating a decrease inin demand for the program. Programs demonstrating a decrease indemand or utilization will actually receive a negative score for thisattribute.
• The grading criterion established to score programs, on a -4 to 4 scale is asfollows:follows:o 4 = Program experiencing a SUBSTANTIAL increase in demand of 25% or
moreo 3 = Program experiencing a SIGNIFICANT increase in demand of 15%
to 24%to 24%o 2 = Program experiencing a MODEST increase in demand of 5% to 14% o 1 = Program experiencing a MINIMAL increase in demand of 1% to 4%o 0 = Program experiencing NO change in demand
i i i f % %o -1 = Program experiencing a MINIMAL decrease in demand of 1% to 4%o -2 =Program experiencing a MODEST decrease in demand of 5% to 14% o -3 =Program experiencing a SIGNIFICANT decrease in demand of 15%
to 24%
42
o -4 =Program experiencing a SUBSTANTIAL decrease in demand of 25% or more

Basic Program Attributes:Basic Program Attributes:Cost Recovery of ProgramCost Recovery of ProgramCost Recovery of ProgramCost Recovery of Program
• Programs that demonstrate the ability to “pay for themselves” throughuser fees intergovernmental grants or other user-based charges foruser fees, intergovernmental grants or other user-based charges forservices will receive a higher score for this attribute compared toprograms that generate limited or no funding to cover their cost.
• The grading criterion established to score programs, on a 0 to 4 scaleg g p g ,is as follows:o 4 = Fees generated cover 75% to 100% of the cost to provide the
programo 3 = Fees generated cover 50% to 74% of the cost to provide the
programo 2 = Fees generated cover 25% to 49% of the cost to provide the
programo 1 = Fees generated cover 1% to 24% of the cost to provide the
program0 N f t d th t th t t id th
43
o 0 = No fees are generated that cover the cost to provide the program

Basic Program AttributesBasic Program Attributes: : Portion of Community Served by ProgramPortion of Community Served by ProgramPortion of Community Served by ProgramPortion of Community Served by Program• Programs that benefit or serve a larger segment of the City’s
residents, businesses and/or visitors will receive a higher score forresidents, businesses and/or visitors will receive a higher score forthis attribute compared to programs that benefit or serve only asmall segment of these populations.
• The grading criterion established to score programs on a 0 to 4• The grading criterion established to score programs, on a 0 to 4scale is as follows:o 4 = Program benefits/serves the ENTIRE community (100%)
3 = Program benefits/serves a SUBSTANTIAL portion of theo 3 = Program benefits/serves a SUBSTANTIAL portion of thecommunity (at least 75%)
o 2 = Program benefits/serves a SIGNIFICANT portion of thecommunity (at least 50%)community (at least 50%)
o 1 = Program benefits/serves SOME portion of the community(at least 10%)
o 0 = Program benefits/serves only a SMALL portion of the
44
o 0 = Program benefits/serves only a SMALL portion of thecommunity (less than 10%)

Identify “Identify “ValueValue” of Program Based on ” of Program Based on yy ggtheir Influence on Resultstheir Influence on Results
Individual Department Program Scorecard
Directions: For all the programs in your department,
Thursday, January 28, 2010 Evaluation CriteriaBasic Program Attributes Priority Results
Mandated to Provide Program
Cost Recovery of Program
Change in Demand for Service
Reliance on City to Provide
ServiceSafe City
Prosperous Economy
Green, Sustainable
City
Attractive, Vibrant
Community
Reliable, Well‐
Maintained Infrastructur
‐4 to 4 Scale ('‐0 to 4 Scale
(4=Only City can
please rate how these programs score in the four Basic Attributes and they influence the City’s ability to achieve its Priority Results. When completed, please email the Program Scorecard back to [email protected]
0‐4 Scale (4=State/Federal
Mandate; 2=Charter; 1=Ordinance/Resolution; 0=No Mandate)
0‐4 Scale based on Percentage (4=75‐100%; 3=50‐74%; 2=25‐49%; 1=1‐
24%)
4=demand significantly decreasing; 4=demand significantly increasing)'
provide service; 2=Only public
entities can provide service; '0=other
entities can provide service)'
Department Program Enter Score Below Enter Score Below Enter Score Below Enter Score Below Enter Score Below Enter Score Below Enter Score Below Enter Score Below Enter Score BelowOffi f E i B i A i /
On a scale of 0 to 4 points, 0 = program has no influence on achieving the Result; 1 = program has some influence, though minimal; 2 = program
influences the Result; 3 = program has a strong influence on the Result; 4 = program is essential to achieving the Results
Office of Economic Development
Business Attraction/ Expansion Assistance 4 2 4 4 2 4 3 2 0
Office of Economic Development
International Business Relations/Sister City 0 1 2 2 0 2 1 1 0
Office of Economic Development
Economic Strategy, Policy and Analysis 1 2 4 2 0 3 3 2 0
Office of Economic Development
Downtown Management 1 2 4 4 3 2 0 3 4DevelopmentOffice of Economic
DevelopmentArts / Festival Grants and
Assistance 1 1 3 0 1 3 1 4 1
Office of Economic Development
K‐12 Arts Education 0 0 2 0 1 2 0 4 0
Office of Economic Development
Cultural Planning, Policy and Initiatives / Arts 1 0 2 4 1 3 1 4 1
Office of Economic Public Art Project 1 1 2 0 1 2 2 4 3
45
Developmentj
Management 1 1 2 0 1 2 2 4 3
Office of Economic Development
Public Art Master Plan Implementation and 1 1 3 0 1 2 1 4 2
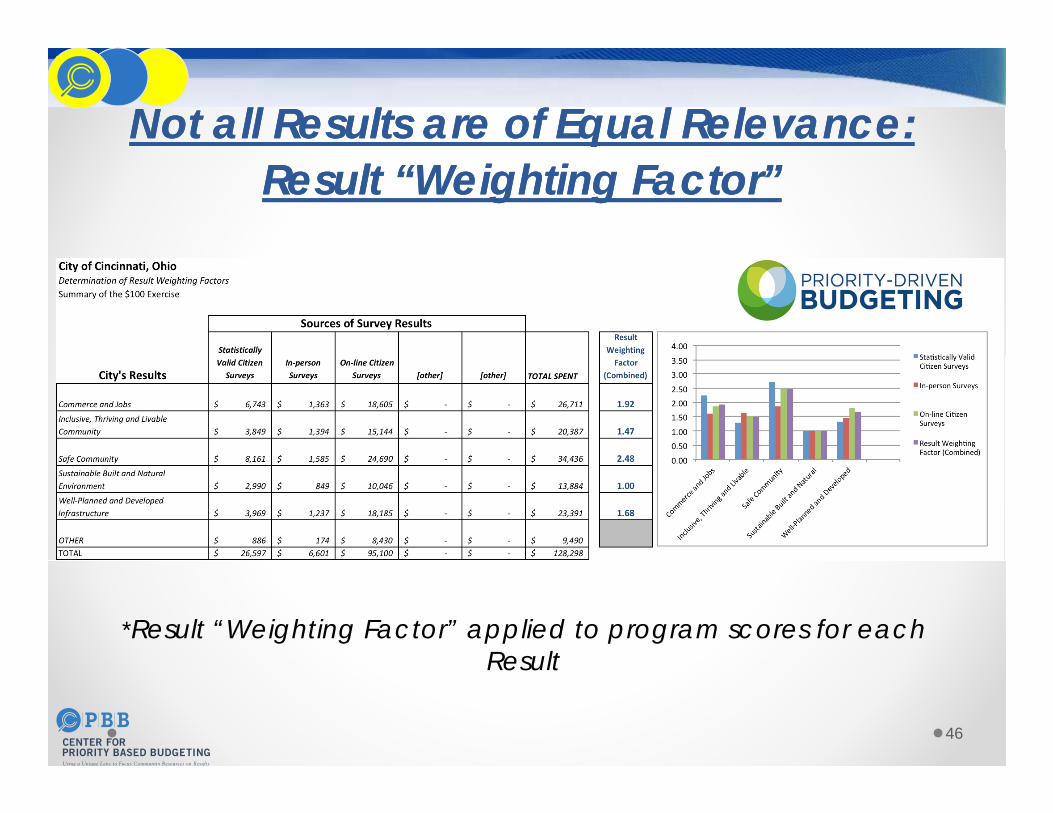
Not all Results are of Equal Relevance: Not all Results are of Equal Relevance: Result “Weighting Factor”Result “Weighting Factor”
*Result “Weighting Factor” applied to program scores for each Result
46
Result

Strategic Questions Strategic Questions Strategic Questions Strategic Questions
1. What are we in “business” to do?2. What exactly do we do?3. How do we figure out what is “core” OR What g
is of the highest importance?
4. How do we know we are successful?
47

Peer Review(Q lit C t l) P(Quality Control) Process
48

Role of the Council/BoardRole of the Council/Board• Have transparent access to listing of all programs
offered along with associated costs and FTE• Educate themselves on the variety and diversity of
programs offered programs offered
Role of the CitizensRole of the Citizens• Have transparent access to listing of all programs
offered along with associated costs and FTE• Be informed about the nature of the programs
offered to residents businesses and visitors
49
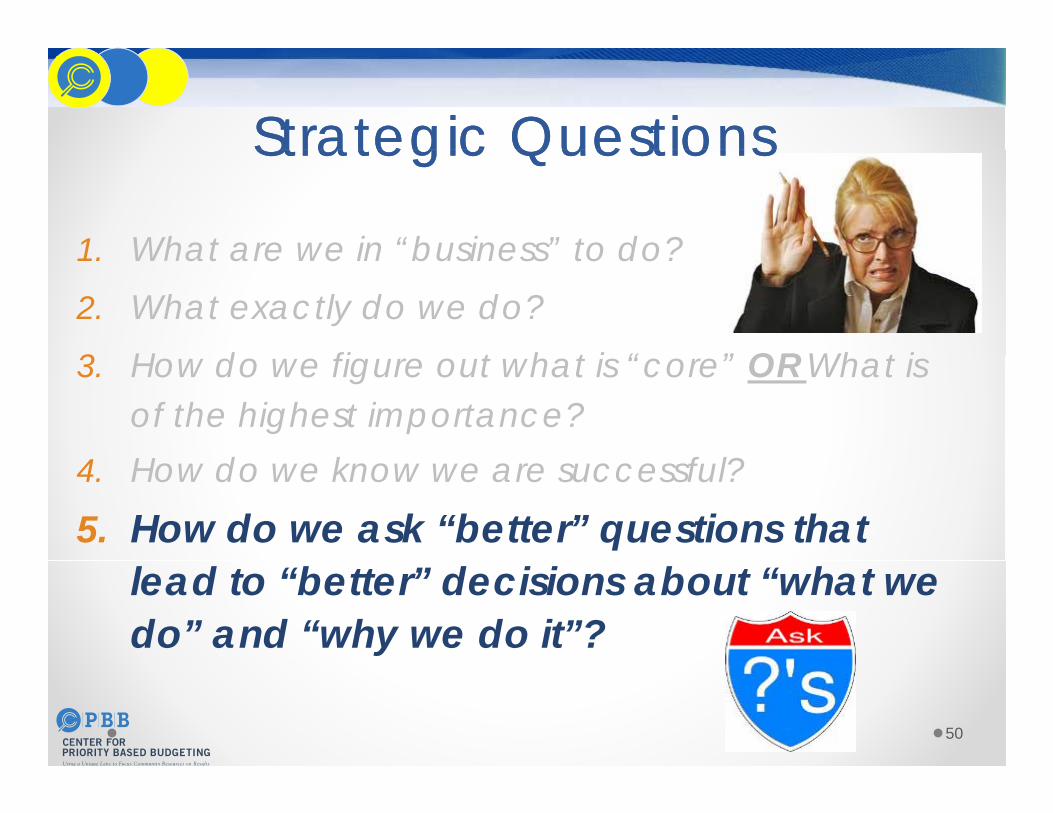
Strategic Questions Strategic Questions Strategic Questions Strategic Questions
1 What are we in “business” to do?1. What are we in business to do?2. What exactly do we do?3 H d fi t h t i “ ” OR Wh t i 3. How do we figure out what is “core” OR What is
of the highest importance?4 H d k f l? 4. How do we know we are successful?
5. How do we ask “better” questions that lead to “better” decisions about “what we do” and “why we do it”?
50

Defining Quartile GroupingsQ 1Q 2Q 3Q 4
0.0 10.0 20.0 30.0 40.0 50.0 60.0 70.0 80.0
147101013161922252831
Quartile 4:58 Programs
3134374043464952er
of P
rogram
s Quartile 1
Quartile 2
Quartile 3
Q til 45255586164677073
Total N
umbe Quartile 4
Quartile 1:79 Programs
76798285889194
Key:Programs are grouped into Quartiles (not ranked, one
Quartile 3:103 Programs
Quartile 2:103 Programs
51
97100103
versus the other)
City of Boulder, Colorado

Step 5: Allocate Resources Based on Step 5: Allocate Resources Based on Prioritization
$85,915,772 1g grams;
rams)
Prioritization Array: Combined City‐wide Programs
79 Programs
$51,726,155 2
le Ranking
hest Rated Prog
west Rated Prog
79 og a s
103 Programs
$21,505,297
$7,498,842
3
4
Quarti
(Quartile 1: Hig
Quartile 4: Low
103 Programs
58 Programs$7,498,842
$‐ $10,000,000 $20,000,000 $30,000,000 $40,000,000 $50,000,000 $60,000,000 $70,000,000 $80,000,000 $90,000,000 $100,000,000
4 58 Programs
52
City of Boulder, Colorado

“Looking Through the“Looking Through theLooking Through theLooking Through the“New Lens” “New Lens”
• Which programs are of the highest priority in terms of achieving what is expected by the community?
And which are of lesser importance?o And which are of lesser importance?
• Which programs are truly mandated for us to provideo And how much does it cost to provide them?
• Which programs are offered because they are “self-imposed” ?
• Which programs are offered for which there are no • Which programs are offered for which there are no other service providers?
• Are there programs might lend themselves to
53
p g gpublic/private partnerships?

“Looking Through the“Looking Through theLooking Through theLooking Through the“New Lens” “New Lens”
• Who in the private sector is offering programs that are similar in nature?o And should we consider” getting out of that business”?
• Which programs are experiencing an increasing level of demand from the community? level of demand from the community? o And which are experiencing a decreasing need?
• Are there programs offered that are not helping Are there programs offered that are not helping us achieve our intended “Results”?
• What are we spending to achieve our “Results”?
54
What are we spending to achieve our Results ?

“Resource Alignment Diagnostic Tool”Cit f B ld COCity of Boulder, CO
Funding Source: (Est. Budget, Gen Gov Revenue,
Program Revenues)
Prioritization Perspective: (City‐wide, Fund, Funds)
Choose Department: (All Departments, Specific)
Program Type: (All Programs, Governance,
Community‐oriented)
October 30, 2012
Community‐Oriented Programs
All Departments Total Estimated BudgetCity‐wide
$85 915 7721ms;
ms)
Priority Based Budgeting: Spending Array Perspectives
$85,915,772
$51,726,155
$21,505,297
1
2
3
artile Ranking
1: Highest R
ated
Progra
4: Lowest Rated
Program
Q til R ki P i A2012 13 P d B d t I (R d ) % I t 2012 13 T t B d t2011 B d t
$7,498,842
$‐ $10,000,000 $20,000,000 $30,000,000 $40,000,000 $50,000,000 $60,000,000 $70,000,000 $80,000,000 $90,000,000 $100,000,000
4
Qua
(Quartile 1
Quartile 4
Quartile Ranking Programs in ArrayQrt 1 88
Qrt 2 116
Qrt 3 110
Qrt 4 54
TOTALS 368$00.00%
0.00%
$0
$0
$85,915,772
$21,505,297
$51,726,155
0.00%
$0
$0
$0 $85,915,772
$51,726,155 0.00%
$0 $166 646 067 0 00% $0 $166 646 067
2012‐13 Proposed Budget Increase (Reduce) % Impact 2012‐13 Target Budget
$0
$0
2011 Budget
$7,498,842
$21,505,297
$7,498,842
55
TOTALS 368$0 $166,646,067 0.00% $0 $166,646,067

56

Role of the Council/BoardRole of the Council/Board• Have transparent access to listing of all programs
offered along with associated costs and FTE• Educate themselves on the variety and diversity of
programs offered programs offered
Role of the CitizensRole of the Citizens• Have transparent access to listing of all programs
offered along with associated costs and FTE• Be informed about the nature of the programs
offered to residents businesses and visitors
57

Strategic Questions Strategic Questions
1 What are we in “business” to do?1. What are we in business to do?2. What exactly do we do?3 How do we figure out what is “core” OR What is of 3. How do we figure out what is core OR What is of
the highest importance?4. How do we know we are successful? 4. How do we know we are successful? 5. How do we ask “better” questions that lead to
“better” decisions about “what we do” and “why we do it”?
6. What do you want to “keep” (not “What do you t t t”) THE ROLE OF CITIZENS
58
want to cut”) – THE ROLE OF CITIZENS

Keys to Public EngagementKeys to Public Engagement1.) Determine objective for engaging the Public
Is it a “Means to an End” or an “End in and of Itself”?
2.) Design the role of the Public so it will have a 2.) Design the role of the Public so it will have a meaningful influence
3 ) Ensure higher participation – GO TO THEM3.) Ensure higher participation – GO TO THEMUse the WebMail enclosures with Newsletters or Utility BillsAttend Community Meetings (i.e. Chamber of Commerce; Civic Groups; School Board; HOA Meetings)
59
Meetings)Set up kiosks at Library, Rec Center, Senior Center, etc.

Many Challenges Inherent to Engaging Public
Level of discussion
Engaging Public
too “Big Picture”Conversation is framed contentiously (and possibly with “fear”)Unclear about “how” citizens will be able to participate
60
p p

Engaging Public in New Discussion Aboutg g g“What They Want to Keep”
61
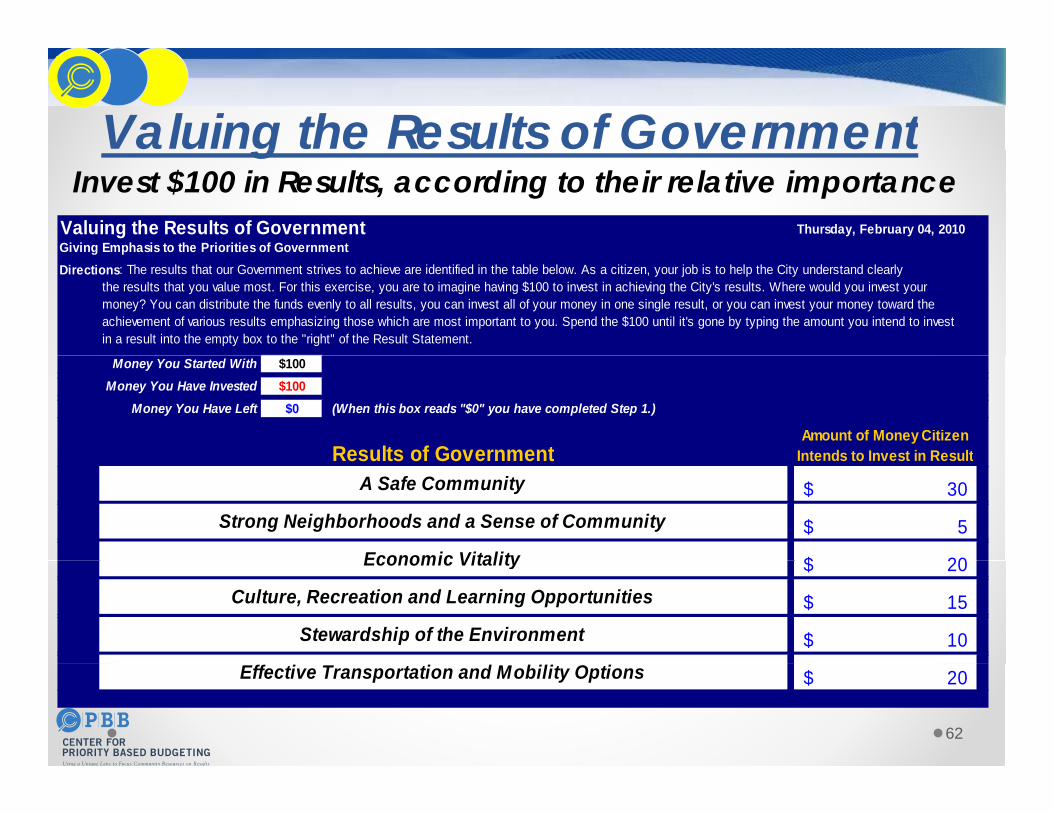
Valuing the Results of GovernmentgInvest $100 in Results, according to their relative importance
Valuing the Results of GovernmentGiving Emphasis to the Priorities of Government
Thursday, February 04, 2010g p
Directions: The results that our Government strives to achieve are identified in the table below. As a citizen, your job is to help the City understand clearlythe results that you value most. For this exercise, you are to imagine having $100 to invest in achieving the City's results. Where would you invest yourmoney? You can distribute the funds evenly to all results, you can invest all of your money in one single result, or you can invest your money toward the achievement of various results emphasizing those which are most important to you. Spend the $100 until it's gone by typing the amount you intend to invest in a result into the empty box to the "right" of the Result Statement.
Money You Started With $100Money You Have Invested $100
Money You Have Left $0 (When this box reads "$0" you have completed Step 1.)
Results of GovernmentAmount of Money Citizen
Intends to Invest in Result
Strong Neighborhoods and a Sense of Community
Economic Vitality
Results of Government
5$
20$
Intends to Invest in Result
30$ A Safe Community
Economic Vitality
Culture, Recreation and Learning Opportunities
Stewardship of the Environment
20$
15$
10$
62
Effective Transportation and Mobility Options 20$

On-Line Town ForumOn Line Town Forum
63
Th k Y !Thank You !
Jon Johnson, Co‐Founder Chris Fabian, Co‐Founder303‐909‐9052 (cell) 303‐520‐1356 (cell)[email protected] [email protected]
www.pbbcenter.orgCopyright ©2009 by Chris Fabian and Jon Johnson d/b/a the Center for Priority Based Budgeting,
64
Copyright ©2009 by Chris Fabian and Jon Johnson d/b/a the Center for Priority Based Budgeting,Denver, Colorado.