ics notes by polarao sir
TRANSCRIPT

7/29/2019 Ics Notes by Polarao Sir
http://slidepdf.com/reader/full/ics-notes-by-polarao-sir 1/184
ICS NOTES-1 UNIT-1
R.Pola Rao, Asso.Prof, Dept of ME,GMRIT-Rajam Page 1
Instrumentation and objective of instrumentation:
Instrumentation:
Instrumentation is a part of engineering science that involves continuous monitoring and
controlling of physical parameters to increase the safety in working areas. It also deals with' the
various methods used for measurement, measuring instruments employed and the problems
associated with the methods used for measurement.
Instrumentation plays a very vital role in both measuring and collecting information form
working areas (field) and changing the field parameters as required by the process.
Objectives
1. The major objective of instrumentation is to measure and control the field parameters to
increase safety and efficiency of the process.
2. To maintain the operation of the plant within the design expectations and to achieve a
good quality product.
3. To achieve automation or automatic control of process there by reducing human fatigue.
4. To perform manipulations on the collected data automatically.
5. To achieve, good quality control.
REFERENCE BOOKS:
1.A course on mechanical measurements and instrumentation- A.K Sawhney
2.Instrumentation and Control systems- S.Sudhakarreddy&P.Divakararao 3.Instrumentation Measurement & Analysis- B.C Nakra and K.K Choudhry
SANYASIRAO

7/29/2019 Ics Notes by Polarao Sir
http://slidepdf.com/reader/full/ics-notes-by-polarao-sir 2/184
ICS NOTES-2 UNIT-1
R.Pola Rao, Asso.Prof, Dept of ME,GMRIT-Rajam Page 2
Generalized configuration of measurement system with a neat block diagram:
General Input-output Configuration of Measuring Instruments and Measurement Systems
The general configuration of measuring instruments as three types of inputs.
They are as follows,1. Desired Inputs
2. Interfering Inputs
3. Modifying Inputs.
Figure: General Input output Configuration of Measurement Systems
Desired Inputs
The input quantity for which the measurement system is designed to measure and produce output
is known as desired input. The desired input is represented as rD According to the input-output
relationship of mathematical model, the output (CD) produced due to the desired input rD is given
by,
D D Dr GC =
Where
GD = Transfer function
i.e., it is a mathematical operation required to get the output from desired input. If the transfer
function of the system is G and the applied input is, 'r' then the output will be
C =Gr.
From this we can understand that the transfer function is a constant K, and it will be 'multiplied
with input rD to produce output CD =K rD. It is because to get an attenuated or amplified output in
SANYASIRAO

7/29/2019 Ics Notes by Polarao Sir
http://slidepdf.com/reader/full/ics-notes-by-polarao-sir 3/184
ICS NOTES-2 UNIT-1
R.Pola Rao, Asso.Prof, Dept of ME,GMRIT-Rajam Page 3
linear systems. Whereas in non linear systems, the transfer function will be represented by using
algebraic or transcendental function. If the inputs applied to the system are dynamic in nature,
then its input-output relationship will be represented by differential equations.
2. Interfering InputsInterfering input quantities are those which make the measurement system or instrument
unintentionally sensitive. The measurement systems or instruments respond to -the interfering
inputs and produces an output though they are not desired to respond. This occurs because of its
design, operating principle and some other factors like environments in which they are placed.
The interfering input is represented by r1 The method of producing output using referring input,
r1 and transfer function,. GI is similar to producing output using desired input, rD and transfer
function GD'
3. Modifying Inputs
The inputs which causes a change in the input output relationship of a measurement system for
both desired and interfering inputs or any of the inputs alone. Modifying input is represented by
rM which modifies both GD GI or anyone of these (i.e., GD or GI). The manner in w4ich rM affects
GD is represented by GMD and the manner in which rM affects GI is represented by GMI. The
interpretation of these GMD and GMI is same as
GD and GI
The instantaneous outputs due to desired, modifying and interfering inputs are given to the
summer or summing point which produces the sum of the instantaneous values. The
measurement system or instrument produces several outputs if it is subjected to several: inputs of
each of these three types. But in this case the: required block diagram will be more complex.
REFERENCE BOOKS:
1.A course on mechanical measurements and instrumentation- A.K Sawhney2.Instrumentation and Control systems- S.Sudhakarreddy&P.Divakararao 3.Instrumentation Measurement & Analysis- B.C Nakra and K.K Choudhry
SANYASIRAO
7/29/2019 Ics Notes by Polarao Sir
http://slidepdf.com/reader/full/ics-notes-by-polarao-sir 4/184
ICS NOTES-3 UNIT-1
R.Pola Rao, Asso.Prof, Dept of ME,GMRIT-Rajam Page 4
Method of measurements:
Depending on the requirement application, and the standards used the methods of measurement
are classified as,
1. Direct and indirect measurements.
2. Primary, secondary and tertiary measurements.
3. Mechanical, electrical and electronic instruments.
4. Absolute and secondary instruments.
5. Analog and digital instruments.
Among these methods the generally used methods of measurements are,
1. Direct and indirect measurement.
2. Primary, secondary and Tertiary measurements.
Direct Comparison Method
In direct comparison method of measurement, the physical quantity 'to be measured (measurand)
is directly compared with either primary or secondary standards and the result is obtained as a
number and a, unit. This method is employed for the measurement of physical parameters, like
length, time, mass etc. If the measurand is too small it is not possible to make direct comparison
accurately. Also it is not possible to distinguish wide margins of the quantity being measured.
Thus in some applications direct comparison method is not feasible and practicable.
Indirect Comparison Method
In indirect comparison method of measurement the measurand is indirectly compared with
secondary standards through calibration. This method employs a transducer.
The transducer converts the measurand into its equivalent electrical signal. This signal is then
processed in the remaining stages of the measurement system and produces an, output. Thus the
unknown quantity is first converted into some other form and then compared with' the standard.
2. Primary Measurements
In this method, the measurement of an unknown quantity is made by direct observation. i.e., a
physical Principle of Production of Eddy Currents If a conducting material is placed near a coil
carrying alternating currents, eddy currents are induced in the conducting material. This is the
basic principle of operation of these type of inductive transducer material produces its own
magnetic field which acts against the main magnetic field created by the coil resulting in the,
reduction of net flux linking with coil and so the inductance of the coil is reduced. As the
SANYASIRAO

7/29/2019 Ics Notes by Polarao Sir
http://slidepdf.com/reader/full/ics-notes-by-polarao-sir 5/184
ICS NOTES-3 UNIT-1
R.Pola Rao, Asso.Prof, Dept of ME,GMRIT-Rajam Page 5
distance b6tween the conducting material and the coil decreases more eddy current are induced
and thus higher is the reduction in the inductance of the coil. Thus, inductance of the coil
changes with the movement of the conducting material quantity is measured by comparing
directly with reference standard.
Example
Measuring the length of a cable by comparing with other cable (whose length is already known)
Secondary Measurements
In this method of measurement the output (final result) is obtained by one conversion of the
measurand.
Example:
Conversion for force or pressure into displacement. Tertiary Measurements
In this method of measurement the output is obtained by two conversions of the measurand.
Example
Measurement of temperature using thermocouple (Here to measure the temperature the unknown
temperature is first converted into voltage. This voltage is then converted into length).
REFERENCE BOOKS:
1.A course on mechanical measurements and instrumentation- A.K Sawhney2.Instrumentation and Control systems- S.Sudhakarreddy&P.Divakararao 3.Instrumentation Measurement & Analysis- B.C Nakra and K.K Choudhry
SANYASIRAO

7/29/2019 Ics Notes by Polarao Sir
http://slidepdf.com/reader/full/ics-notes-by-polarao-sir 6/184
ICS NOTES-4 UNIT-1
R.Pola Rao, Asso.Prof, Dept of ME,GMRIT-Rajam Page 6
Applications of measuring instruments:
The various applications of a measuring instrument are,
1. Measurement of Different Parameters of a Process
Measuring instruments are used to measure different unknown parameters related to a system ora process. A measuring instruments also provides the measured information in the form of
display, recording, registering, monitoring depending on the requirement.
2. Automatic Control Systems
A measuring instrument is an integral part of an automatic control system. Here a measuring
instrument not only used to measures a particular parameter but also controls and manipulates in
order to make the process to run at a predefined set point. Therefore it is used in all types of
automatic control systems such as chemical plants, oil refineries, textile mills to control
humidity, pressure, viscosity, flow rate, temperature and other relevant parameters.
3. Quality Control
Measuring instruments are used to test the quality of the material, to maintain the standards and
specifications of the products in industries.
A good quality product is made by continuously performing quality control tests on mass
produced industrial products. This act is accomplished by measuring instruments.
4. Experimental Studies
To gather information and to form certain empirical relations where sufficient theory is not
available, and to develop new theories, to innovate new phenomena and new products measuring
instruments are necessary. They can be used to verify the already existing physical phenomena
and scientific theories etc.
5. Simulation of Conditions of a Process
In order to reveal the actual behaviour of the process under different working conditions, it is
necessary to simulate true conditions of complex situations in a process experimentally. To
convert this experimental results into prototype analytical tools are required.
6. Measuring instrument is an essential tool of any measurement hence no measurement is
carried out without it. Thus it is used in all measurement processes 'and industries such as
process industries, power plants, automatic production machines automatic landing of aircraft,
radar tracking systems, missile guidance, autopilots etc.
SANYASIRAO

7/29/2019 Ics Notes by Polarao Sir
http://slidepdf.com/reader/full/ics-notes-by-polarao-sir 7/184
ICS NOTES-5 UNIT-1
R.Pola Rao, Asso.Prof, Dept of ME,GMRIT-Rajam Page 7
Types of performance characteristics of an instrument:
Performance characteristics
The performance characteristics of an instrumentation system is concluded by how accurately the
system measures the required input and how absolutely it rejects the undesirable inputs. Forchoosing the most suitable instrument for specific measuring task the performance characteristics
of an instruments are necessary. It can be generally divided into two distinct categories.
(a) Static characteristics
(b) Dynamic characteristics.
(a) Static Characteristics
When the measurand does not vary with time, static characteristics are determined. The static
characteristics of an instrument are determined by a process called static calibration in which the
relationship between the output signal and the quantity under study is experimentally
determined.
The important term which specifies the static characteristics are as follows.
(i) Accuracy
(ii) Precision
(iii) Sensitivity
(iv) Linearity
(v) Stability
(vi) Error
(vii) Threshold
(viii) Resolution
(ix) Hysteresis
(x) Dead space
(xi) Range and span
(xii) Reproducibility.
(xiii) Drift
(i)Accuracy :
The closeness of the measured value with respect to the true value is called as accuracy.
SANYASIRAO
7/29/2019 Ics Notes by Polarao Sir
http://slidepdf.com/reader/full/ics-notes-by-polarao-sir 8/184
ICS NOTES-5 UNIT-1
R.Pola Rao, Asso.Prof, Dept of ME,GMRIT-Rajam Page 8
Accuracy is influenced by the affects of disturbing inputs such as temperature, humidity and also
by the limits of intrinsic errors and instability of natural zero. Under certain operating conditions
accuracy can also be determined by calibrating.
The accuracy of the whole system depends upon the accuracies of each individual instruments inthat system. Generally, the accuracy of the instrument depends upon the natural limitations of the
instrument as well as on the shortcomings in the measurement process.
(ii) Precision
The instrument ability to reproduce a certain group of readings within a given accuracy is known
as precision i.e., if a number of measurements are made on the same true value, then the degree-
of closeness of these measurements is called precision.
Precision of an instrument depends upon the random errors. It refers to the ability of an
instrument to give its readings again and again in same manner for constant input signals.
Instruments having high accuracy should also be highly precise.
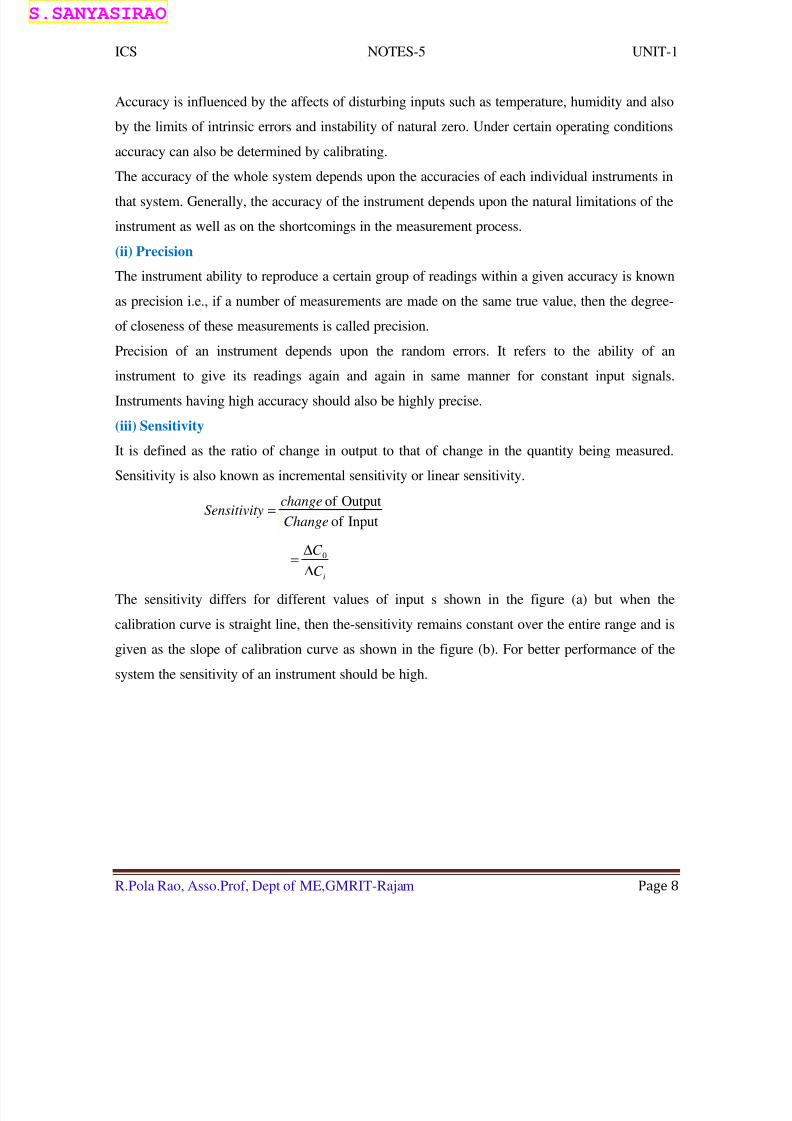
(iii) Sensitivity
It is defined as the ratio of change in output to that of change in the quantity being measured.
Sensitivity is also known as incremental sensitivity or linear sensitivity.
Inputof
Outputof
Change
change ySensitivit =
iC C ∆
∆=0
The sensitivity differs for different values of input s shown in the figure (a) but when the
calibration curve is straight line, then the-sensitivity remains constant over the entire range and is
given as the slope of calibration curve as shown in the figure (b). For better performance of the
system the sensitivity of an instrument should be high.
SANYASIRAO

7/29/2019 Ics Notes by Polarao Sir
http://slidepdf.com/reader/full/ics-notes-by-polarao-sir 9/184
ICS NOTES-5 UNIT-1
R.Pola Rao, Asso.Prof, Dept of ME,GMRIT-Rajam Page 9
Figure(a):Incremental Sensitivity
Figure(b):Linear Sensitivity
Linearity
It is expressed as a percentage of deviation from the linear value. .
It defines the proportionality between the measurand and output signal. The calibration curve is
said to be linear, when the sensitivity is constant for all values from lower scale to upper scale of
the measuring system.
The linear characteristics of the, calibration curve are shown in the figure (c).
SANYASIRAO

7/29/2019 Ics Notes by Polarao Sir
http://slidepdf.com/reader/full/ics-notes-by-polarao-sir 10/184
ICS NOTES-5 UNIT-1
R.Pola Rao, Asso.Prof, Dept of ME,GMRIT-Rajam Page 10
Figure(c): linear and Nonlinear Calibration Characteristic
(v) Stability
It is the ability of the instrument to have the same standard of performance over a prolonged
period of time. The need for calibrating the instrument frequently is less for a instrument having
high stability.
(vi) Error
In any device, when the measured value or indicated value of measurand differs from its true
value then this difference between the measured value and true value is referred as error.
In an ideal device the error is zero i.e., the output is always equal to the true value of the
measurand. When the measured value exceeds the true value of measurand the error is said to be
positive. By minimizing the error of the device, its accuracy can be increased.
(vii)Threshold
It is defined as the minimum input quantity required for a detectable change in the output signal
from the zero indication i.e., when the input to an instrument is gradually increased from zero,
then the input must reach to a certain minimum value, so that the change in the output can be
detected. This minimum value of the input refers to threshold.
(viii) Resolution
It is defined as the increment in the input of the instrument for which the output remains constant
i.e., when the input given to the instrument is slowly increased for which the output remains
same until the increment exceeds a definite value.
(ix) Hysteresis
SANYASIRAO
7/29/2019 Ics Notes by Polarao Sir
http://slidepdf.com/reader/full/ics-notes-by-polarao-sir 11/184
ICS NOTES-5 UNIT-1
R.Pola Rao, Asso.Prof, Dept of ME,GMRIT-Rajam Page 11
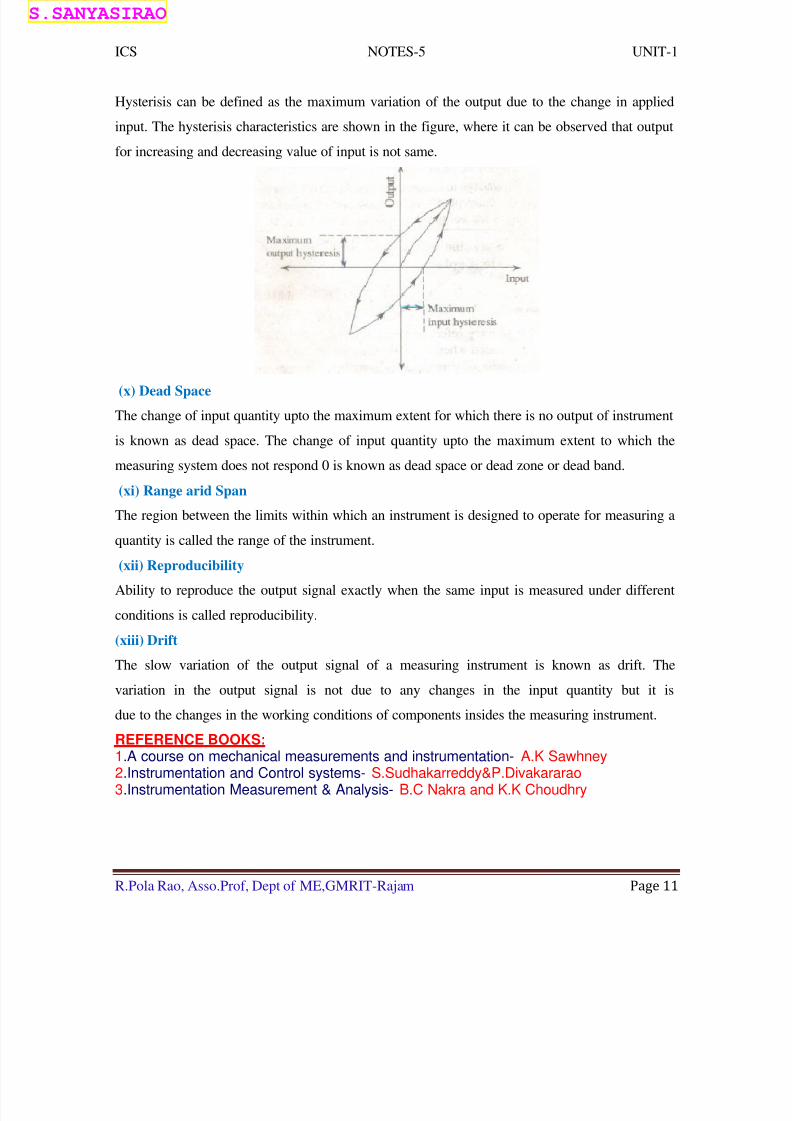
Hysterisis can be defined as the maximum variation of the output due to the change in applied
input. The hysterisis characteristics are shown in the figure, where it can be observed that output
for increasing and decreasing value of input is not same.
(x) Dead Space
The change of input quantity upto the maximum extent for which there is no output of instrument
is known as dead space. The change of input quantity upto the maximum extent to which the
measuring system does not respond 0 is known as dead space or dead zone or dead band.
(xi) Range arid Span
The region between the limits within which an instrument is designed to operate for measuring a
quantity is called the range of the instrument.
(xii) Reproducibility
Ability to reproduce the output signal exactly when the same input is measured under different
conditions is called reproducibility.
(xiii) Drift
The slow variation of the output signal of a measuring instrument is known as drift. The
variation in the output signal is not due to any changes in the input quantity but it is
due to the changes in the working conditions of components insides the measuring instrument.
REFERENCE BOOKS: 1.A course on mechanical measurements and instrumentation- A.K Sawhney2.Instrumentation and Control systems- S.Sudhakarreddy&P.Divakararao 3.Instrumentation Measurement & Analysis- B.C Nakra and K.K Choudhry
SANYASIRAO
7/29/2019 Ics Notes by Polarao Sir
http://slidepdf.com/reader/full/ics-notes-by-polarao-sir 12/184
ICS NOTES-6 UNIT-1
R.Pola Rao, Asso.Prof, Dept of ME,GMRIT-Rajam Page 12
Dynamic characteristics:
(i) Bandwidth
(ii) Dynamic range
(iii) Setting time(iv) Measurement lag
(v) Fidelity.
(i) Bandwidth
The satisfactory ratio of peak amplitude of output signal to that of input signal is known a
dynamic sensitivity. The dynamic sensitivity is obtained for certain range of frequencies and this
range of frequencies are known as bandwidth.
(ii) Dynamic Range
It is the range of signals for which the measuring system is possible to respond constantly under
dynamic conditions. It is generally demonstrated as the ratio of the amplitudes and the ratio is
generally expressed in dB.
(iii) Setting Time
Settling time is the time taken by a system after the application of a step input for the instrument
to reach and stay within a close range of steady state value.
(iv) Measurement Lag
It is the time delay in response of the output signal to the changes in the input signal.
Measurement lag is dependent on the characteristics of the system only. For different types of
input signal, measurement lag can be specified in different ways.
(v)Fidelity
For a time-varying input the quality of indication by the instrument is referred as fidelity. The
perfect fidelity is obtained only by a zero order system i.e., fidelity is the degree of nearness with
which the output reproduces the time varying input within a conversion factor. But for higher
order systems the output cannot reproduce the input signals constantly at all instant and for all
types of input time varying function. Under steady state conditions for sinusoidal input functions
the perfect fidelity of an instrument would indicate that the waveforms of the output and input
signals occur simultaneously with each other at all instants. Hence, there will be neither
amplitude error nor phase error. Fidelity requirements is generally associated to cover deficiency
In amplitude frequency characteristics and with the applications the fidelity requirements differ.
SANYASIRAO

7/29/2019 Ics Notes by Polarao Sir
http://slidepdf.com/reader/full/ics-notes-by-polarao-sir 13/184
ICS NOTES-6 UNIT-1
R.Pola Rao, Asso.Prof, Dept of ME,GMRIT-Rajam Page 13
It's specification is reduced, while describing. The working of electronic amplifiers and such
other electronic apparatus meant for entertainment. Thus, fidelity is maintained or a wider range
of frequencies.
REFERENCE BOOKS:
1.A course on mechanical measurements and instrumentation- A.K Sawhney2.Instrumentation and Control systems- S.Sudhakarreddy&P.Divakararao 3.Instrumentation Measurement & Analysis- B.C Nakra and K.K Choudhry
SANYASIRAO
7/29/2019 Ics Notes by Polarao Sir
http://slidepdf.com/reader/full/ics-notes-by-polarao-sir 14/184
ICS NOTES-7 UNIT-1
R.Pola Rao, Asso.Prof, Dept of ME,GMRIT-Rajam Page 14
Calibration:
It can be stated as a process of making a set of operations to establish a relationship between the
values indicated by the measuring system and the corresponding known value of the physical
quantity (or measurand).Procedure of Calibration
To calibrate an instrument initially adjust the instrument such that it produces null output hen on
input is applied. Then apply on accurately known value of measurand and adjust the instrument
again until its scale exactly indicates the value of measurand. This process of adjusting the
instrument is called calibration.
After calibrating an instrument, it should be used under those environmental conditions which
are identical to the conditions prevailing during calibration. Otherwise the instrument itself
becomes a source of error and can not provides an accurate value of the measurand. i.e., the
changes in environmental conditions affect the characteristics of instrument.
Calibration is very important especially in those cases where the sensing system and measuring
system of the instrument are different. In this case the calibration is done by considering the two
different systems as a whole.
REFERENCE BOOKS:
1.A course on mechanical measurements and instrumentation- A.K Sawhney2.Instrumentation and Control systems- S.Sudhakarreddy&P.Divakararao 3.Instrumentation Measurement & Analysis- B.C Nakra and K.K Choudhry
SANYASIRAO

7/29/2019 Ics Notes by Polarao Sir
http://slidepdf.com/reader/full/ics-notes-by-polarao-sir 15/184
ICS NOTES-8 UNIT-1
R.Pola Rao, Asso.Prof, Dept of ME,GMRIT-Rajam Page 15
Block diagram of measurement system and the functions of various blocks:
Measurement:
Measurement is the conversion of physical parameters in their corresponding numerical values.
In the measuring process, under certain conditions the object's property will be compared to astandard unit i.e., a unit which is already defined for that particular property. There are two
requirements which are to be satisfied to get good result form the measurement.
1. An accurately defined and accepted standard should be used for the comparison purposes.
2. The components or apparatus which are used for measurement and also the measuring
method should be provable.
The main objective of a measuring instrument or measurement system is to provide a numerical
value which is proportional to the quantity of the variable being measured.
The instrumentation system contains following functional elements. They are as follows,
1. Primary sensing elements2. Variables conversion element
3. Variables manipulation element
4. Data transmission element
5. Data storage and presentation element.
1. Primary Sensing Elements
The primary sensing element is that which first receives energy from measured medium and
produces an output depending on the measured quantity. The primary sensing element is
sensitive to the measured variable.
The measured is first detected by primary sensor, which converts the measurand into an,
analogous electrical sensor. This is done by a transducer. A transducer is a device which converts
one form of energy into another form. The first stage of a measurement System is known as a
detector transducer stage. An instrument always extracts some energy from the measured
SANYASIRAO

7/29/2019 Ics Notes by Polarao Sir
http://slidepdf.com/reader/full/ics-notes-by-polarao-sir 16/184
ICS NOTES-8 UNIT-1
R.Pola Rao, Asso.Prof, Dept of ME,GMRIT-Rajam Page 16
.medium. Thus the measured quantity is always disturbed by the act of measurement which
makes a perfect measurement impossible. Good instruments are designed to minimize this effect,
but it is always present to some degree.
2 Variables Conversion Element :The output of the primary sensing element may be physical variable such as displacement or
voltage. The output from the primary sensing element may not be suited for the further stages, in
such cases there is need for variable conversion element. The variable conversion element makes
the instrument to perform the desired function, by converting the variable to another more
suitable variable while preserving the information content of the original signal.
For example, suppose the output is in digital form and th~ 'next stage of the system accepts input
signals any in analog form and therefore, D/A converter is be used for converting signals from
digital to analog.
3. Variables Manipulation Element
To perform the intended task, an instrument may require that a signal represented by some
physical variable be manipulated in some way. Manipulation here mean specifically a change in
numerical value according to some definite rule but a preservation of the physical nature of the
variable. For example an electronic amplifier accepts a small voltage signal as input and
produces an output signal that is also a voltage but is some constant times the input. It is not
necessary that a variable manipulation element should follow the variable conversion element. A
fundamental process is to prevent signal being contaminated by unwanted, signals like noise due
to an extraneous source which may interfere with the original output signal. Another process is
that a weak signal may be distorted by processing equipment. The signal after being sensed
cannot be directly transmitted to \the next stage without removing the interfering sources as
otherwise highly distorted results may be obtained which are far from true. It becomes necessary
to perform certain operations on the signal before it is transmitted. These operations may be
linear or nonlinear. The linear operations performed on the signals may be amplification,
attenuation, integration, differentiation hopping etc. are also performed on the signal to bring it
to the desired form to be accepted by the next stag of measurement system.
This process of conversion is called signal conditioning. The signal conditioning includes
Amplification, Signal filtration, Signal compensation / Signal linearization, Signal averaging,
Signal sampling.
SANYASIRAO

7/29/2019 Ics Notes by Polarao Sir
http://slidepdf.com/reader/full/ics-notes-by-polarao-sir 17/184
ICS NOTES-8 UNIT-1
R.Pola Rao, Asso.Prof, Dept of ME,GMRIT-Rajam Page 17
Amplifier
The term amplification means increasing the amplitude of the signal without, affecting its
waveform. The reverse phenomenon attenuation i.e., reduction of the signal amplitude were
retaining its original waveform. Mechanic al amplifying elements such as levers, gears, or acombination of the two designed to have multiplying effect on the input transducer signal
hydraulic pneumatic amplifying elements employing various types of values or constructions,
such as venturimeter / orificemeter.
Signal Filtration
The term signal filtration means, the removal of unwanted noise signals that tend to obscure the
transducer signal. The signal filtration element could be mechanical filters, pneumatic filters,
electrical filters.
Data Transmission Element
When the elements of an instruments are actually physically separated, it becomes necessary to
transmit data from one to another. The element that performs this functions is called a Data
Transmission Element. The transmission element can be as simple as a shaft and bearing
assembly or as complicated as a telemetry system for transmitting signals from satellites to
ground equipment by radio.
Data Storage and Presentation Element
The storage in the form of pen/ink recording is often employed. Some applications requires a
distinct data storage/play back function which can easily recreate the stored data upon command.
The magnetic tape recorder / reproducer is the classical example. Modern instruments digitize
the electric signals and store them in a computer like digital memory.
The information about the quantity under measurement has to be conveyed to the personnel
handling the instrument or the system monitoring, control, or analysis purpose. The information
conveyed must be in a form intelligible to the 'personal or to the intelligent instrumentation
system. This function is done by data presentation element. In case data is to be monitored,
SANYASIRAO

7/29/2019 Ics Notes by Polarao Sir
http://slidepdf.com/reader/full/ics-notes-by-polarao-sir 18/184
ICS NOTES-8 UNIT-1
R.Pola Rao, Asso.Prof, Dept of ME,GMRIT-Rajam Page 18
visual display devices are needed. These devices may be analog or digital indicating instruments,
like ammeters, voltmeters etc. In case the data is to be recorded, recorders like magnetic tapes,
high speed camera and T.V. equipment storage type CRT, printers, analog and digital computers
or microprocessors may be used. For control and analysis purpose microprocessors or computersmay be used.
REFERENCE BOOKS:
1.A course on mechanical measurements and instrumentation- A.K Sawhney2.Instrumentation and Control systems- S.Sudhakarreddy&P.Divakararao 3.Instrumentation Measurement & Analysis- B.C Nakra and K.K Choudhry
SANYASIRAO

7/29/2019 Ics Notes by Polarao Sir
http://slidepdf.com/reader/full/ics-notes-by-polarao-sir 19/184
ICS NOTES-8 UNIT-2
R.Pola Rao, Asso.Prof, Dept of ME,GMRIT-Rajam Page 19
LVDT- Linear Variable Differential Transformer:
Linear Variable Differential Transformer (LVDT) consists of one primary winding (P) and two
secondary windings (S1 & S2) with equal number of turns wound on a cylindrical former. The
two secondary windings are connected in series opposition and are placed identically on eitherside of primary winding to which an AC excitation voltage is connected. A movable soft iron
core is placed within the cylindrical former. When the displacement to be measured is applied to
the arm of the core, the LVDT converts this displacement into in electrical signal.
The construction of LVDT is illustrated in figure (1)
Figure 1: Construction of LVDT
Figure :2- Circuit Diagram of a LVDT
The operating principle of LVDT depends on mutual inductance. When the primary winding is
supplied with A.C. supply voltage, it generates alternating magnetic field. Due to this magnetic
SANYASIRAO

7/29/2019 Ics Notes by Polarao Sir
http://slidepdf.com/reader/full/ics-notes-by-polarao-sir 20/184
ICS NOTES-8 UNIT-2
R.Pola Rao, Asso.Prof, Dept of ME,GMRIT-Rajam Page 20
field an alternating voltage will be induced in the two secondary windings. In the figure 2 eS1 is
the output voltage of secondary winding S1 and eS2 is the output voltage of secondary winding
S2, In order to get single differential output voltage two secondary windings are connected iQ
series opposition. Thus the differential output voltage is given by,eo= eS1 – eS2.
From figure (2), when the core is placed symmetrically with respect to two secondary windings
an equal amount of voltage will 1 & induced in both windings. Therefore
eS1 = eS2 and the output voltage is '0'. Hence, this position is known as null position.
Now if the core is moved towards up from null position, more magnetic field links with
secondary winding S1 and small field links with secondary winding S2, Therefore more voltage
will be induced in S1 and less in S2 i.e., eSl will be larger than eS2 Hence, the differential output
voltage is eo=eS1 - eS2 and is inphase with primary voltage.
But when the core is moved towards down from mill position more magnetic field links with
secondary winding S2 and small field links with secondary winding S1. Therefore more voltage
will be induced in S2 and less in S1 i.e., eS2 will be larger than eS1. Hence, the differential output
voltage is eo = eS2 – eS1 and is 1800 out of phase with primary voltage.
Thus the output voltage eo position of the core and hence the displacement applied to the arm of
the core.
Merits
(i) LVDT has good linearity i.e., it produces linear output voltages.
(ii) It can measure displacements of very high range usually from 1.25 mm to
250 mm.
(iii) It has high sensitivity.
(iv) Since it produces high output, it does not require amplification devices.
(v) It is simple and rugged in construction. Therefore it can withstand high degree of
shocks and vibrations.
(vi) It has no sliding contacts. Therefore there is no problem of friction.
(vii) It has low hysteresis.
(viii) It consumes less power (about < 1W).
SANYASIRAO
7/29/2019 Ics Notes by Polarao Sir
http://slidepdf.com/reader/full/ics-notes-by-polarao-sir 21/184
ICS NOTES-8 UNIT-2
R.Pola Rao, Asso.Prof, Dept of ME,GMRIT-Rajam Page 21
Demerits
(i) It is sensitive to stray magnetic fields.
(ii) The performance of LVDT is affected by variations in temperature.
(iii) It has limited dynamic response.(iv) To provide high differential output, it requires large displacements.
(v) It provides A.C. output. Therefore it requires a demodulator circuit if the receiving
device operates only on DC.
REFERENCE BOOKS:
1.A course on mechanical measurements and instrumentation- A.K Sawhney2.Instrumentation and Control systems- S.Sudhakarreddy&P.Divakararao 3.Instrumentation Measurement & Analysis- B.C Nakra and K.K Choudhry
SANYASIRAO

7/29/2019 Ics Notes by Polarao Sir
http://slidepdf.com/reader/full/ics-notes-by-polarao-sir 22/184
ICS NOTES-10 UNIT-2
R.Pola Rao, Asso.Prof, Dept of ME,GMRIT-Rajam Page 22
Variable Reluctance Displacement Transducer:
Transducers of variable reluctance type consists of a coil wound on a ferromagnetic core. The
displacement which is to be measured is applied to a ferromagnetic target. The core and the
target are separated by an air gap.
The self inductance of coil is given by,
gi R R
N L
+=
2
Ri = Reluctance of iron parts
Rg = Reluctance of air gap
As Ri <<Rg
g R
N L
2
=
But the reluctance of air gap is given by,
0. µ g
g
g A
l R =
lg = Length of air gap
Ag = Area of flux path
As µ0 and Ag are constant
g R∴ ∝ lg
L ∝ 1/lg
i.e. the self inductance of a coil is inversely proportional to the length of the area.
When the target is near the core, lg is small and hence 'L' is large.
SANYASIRAO

7/29/2019 Ics Notes by Polarao Sir
http://slidepdf.com/reader/full/ics-notes-by-polarao-sir 23/184
ICS NOTES-10 UNIT-2
R.Pola Rao, Asso.Prof, Dept of ME,GMRIT-Rajam Page 23
Since, it is the displacement which changes the length of area, the variation in the self
inductance is a function of displacement as lg ∝ x1
Therefore the input, output relation is non-linear.
REFERENCE BOOKS:
1.A course on mechanical measurements and instrumentation- A.K Sawhney2.Instrumentation and Control systems- S.Sudhakarreddy&P.Divakararao 3.Instrumentation Measurement & Analysis- B.C Nakra and K.K Choudhry
SANYASIRAO
7/29/2019 Ics Notes by Polarao Sir
http://slidepdf.com/reader/full/ics-notes-by-polarao-sir 24/184
ICS NOTES-11 UNIT-2
R.Pola Rao, Asso.Prof, Dept of ME,GMRIT-Rajam Page 24
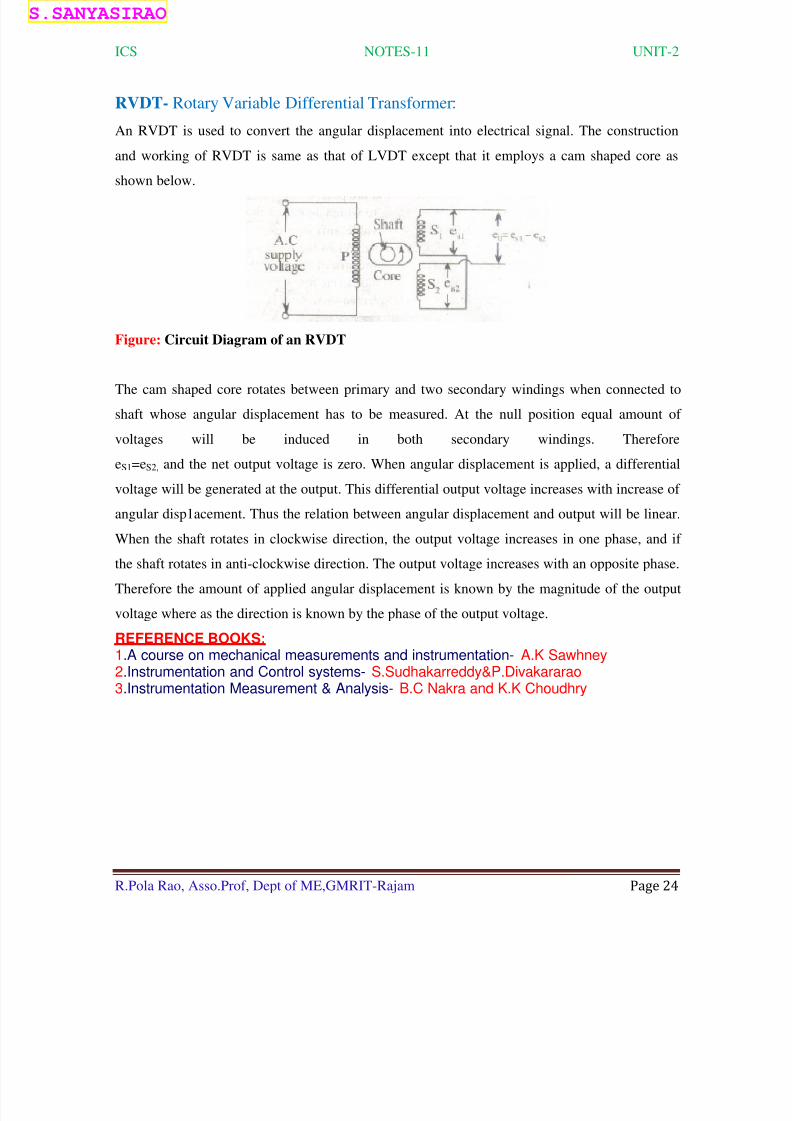
RVDT- Rotary Variable Differential Transformer:
An RVDT is used to convert the angular displacement into electrical signal. The construction
and working of RVDT is same as that of LVDT except that it employs a cam shaped core as
shown below.
Figure: Circuit Diagram of an RVDT
The cam shaped core rotates between primary and two secondary windings when connected to
shaft whose angular displacement has to be measured. At the null position equal amount of
voltages will be induced in both secondary windings. Therefore
eS1=eS2, and the net output voltage is zero. When angular displacement is applied, a differential
voltage will be generated at the output. This differential output voltage increases with increase of
angular disp1acement. Thus the relation between angular displacement and output will be linear.
When the shaft rotates in clockwise direction, the output voltage increases in one phase, and if
the shaft rotates in anti-clockwise direction. The output voltage increases with an opposite phase.
Therefore the amount of applied angular displacement is known by the magnitude of the output
voltage where as the direction is known by the phase of the output voltage.
REFERENCE BOOKS:
1.A course on mechanical measurements and instrumentation- A.K Sawhney2.Instrumentation and Control systems- S.Sudhakarreddy&P.Divakararao 3.Instrumentation Measurement & Analysis- B.C Nakra and K.K Choudhry
SANYASIRAO

7/29/2019 Ics Notes by Polarao Sir
http://slidepdf.com/reader/full/ics-notes-by-polarao-sir 25/184
ICS NOTES-12 UNIT-2
R.Pola Rao, Asso.Prof, Dept of ME,GMRIT-Rajam Page 25
Principle of Capacitive transducer:
Capacitive transducer operates on the principle of capacitance of a parallel plate capacitor which
is given by,
d AC ε = (or)
d
AC
r 0ε ε
= (1)
Where,
C = Capacitance of a capacitor (Farads)
ε = εr ε0 = Permittivity of medium (F/m)
εr = Relative permittivity (dielectric constant)
ε0 =Permittivity of free space (8.5 x 10⁻¹²
F/m)
d = Distance between two plates (m)
A = Overlapping area of two plates (m2) .
The capacitance of a capacitor varies when,
(a) The overlapping area (A) of the plates changes.
(b) The distance (d) between the two plates changes.
(c) The dielectric constant εr changes.
REFERENCE BOOKS:
1.A course on mechanical measurements and instrumentation- A.K Sawhney2.Instrumentation and Control systems- S.Sudhakarreddy&P.Divakararao 3.Instrumentation Measurement & Analysis- B.C Nakra and K.K Choudhry
SANYASIRAO

7/29/2019 Ics Notes by Polarao Sir
http://slidepdf.com/reader/full/ics-notes-by-polarao-sir 26/184
ICS NOTES-13 UNIT-2
R.Pola Rao, Asso.Prof, Dept of ME,GMRIT-Rajam Page 26
Measurement of displacement- Change in Capacitance Due to Change in
Overlapping Area of Plates.
Figure: Capacitive Transducer using the Principle of Change in Capacitance Due to
Change in Overlapping Area of Plates.
From equation (1) it is clear that the capacitance of the capacitor is directly proportional to the
area of plates. Hence, the capacitance varies linearly with the variation in the area of plates. The
area linearly varies with the applied displacement. Therefore the capacitive transducer using this
principle is used to measure linear displacements of about 1mm to 10 mm.
From Figure (1), the capacitance of parallel plate capacitor is,
Where,
d
AC
ε =
d
lbC
ε =
Where,
l = Length of overlapping area of plates
b =Width of overlapping area of plates.
REFERENCE BOOKS:
1.A course on mechanical measurements and instrumentation- A.K Sawhney2.Instrumentation and Control systems- S.Sudhakarreddy&P.Divakararao 3.Instrumentation Measurement & Analysis- B.C Nakra and K.K Choudhry
SANYASIRAO

7/29/2019 Ics Notes by Polarao Sir
http://slidepdf.com/reader/full/ics-notes-by-polarao-sir 27/184
ICS NOTES-14 UNIT-2
R.Pola Rao, Asso.Prof, Dept of ME,GMRIT-Rajam Page 27
Measurement of displacement -Capacitive Transducer using the Effect of
Variation of Distance between the Plates
Figure: Capacitive Transducer -Change in Capacitance Due to Change in Distance
Between Plates
The capacitor operates on the principle of variation of capacitance due to variation in distance
between plates use by two plates, one is fixed and the other is movable. From equation (1) it is
clear that the capacitance of the two plate capacitor is inversely proportional to the distancebetween the plates. When the movable plate moves towards the fixed plate or moves away from
the fixed plate w.r.t. applied displacement, the distance between the plates and hence capacitance
changes. In this case the response is non-linear. Hence, it is used to measure only small
displacements.
Capacitive Transducer using the Effect of Variation of Dielectric Constant
Figure: Capacitive Transducer using the Principle of Change in Capacitance Due to
Change in Dielectric Constant
The capacitive transducer working on the principle of change in capacitance due to variation of
dielectric constant w.r.t. linear displacement is shown in figure. It contains two fixed plates. A
dielectric material with relative permittivity εr moves between these two plates w.r.t applied
displacement.
At initial condition the capacitance of the transducer is,
SANYASIRAO

7/29/2019 Ics Notes by Polarao Sir
http://slidepdf.com/reader/full/ics-notes-by-polarao-sir 28/184
ICS NOTES-14 UNIT-2
R.Pola Rao, Asso.Prof, Dept of ME,GMRIT-Rajam Page 28
t
bl
t
blC
r
20
10 ε ε ε +=
( )210 lr
lt
bε ε +=
Where the dielectric material moves towards left by distance x, the capacitance varies from C to
∆C.
( ) ( ) xlt
b xl
t
bC C
r ++−=∆+∴ 2010 ε ε ε
[ ])( 210 xl xlt
b
r ++−= ε ε
−++= )1() 0210 r r
t
bxll
t
bε ε ε ε
)1(0 −+r
t
bxC ε ε
)1(0 −=∆r
t
bxC ε ε
Variation in capacitance is
)1(0 −=∆r t
t
bxC ε
Thus the variation of capacitance is directly proportional to applied displacement.
REFERENCE BOOKS:
1.A course on mechanical measurements and instrumentation- A.K Sawhney2.Instrumentation and Control systems- S.Sudhakarreddy&P.Divakararao 3.Instrumentation Measurement & Analysis- B.C Nakra and K.K Choudhry
SANYASIRAO

7/29/2019 Ics Notes by Polarao Sir
http://slidepdf.com/reader/full/ics-notes-by-polarao-sir 29/184
ICS NOTES-15 UNIT-2
[Type text] Page 29
R.Pola Rao, Asso.Prof, Dept of ME,GMRIT-Rajam
Temperature measuring instruments:
The temperature measuring instruments are classified into four different types based on the nature of
change, produced in the temperature sensing element. They are,
1. Expansion thermometers
2. Change of state thermometers
3. Measurement of temperature using electrical methods
4. Optical and radiation pyrometry.
Classification of Expansion Thermometers:
The expansion thermometers are classified into different types. They are,
Bimetallic thermometer
(i) Expansion of solids Solid-rod thermometers
Liquid-in-glass thermometers
(ii) Expansion of liquids . Liquid-in-metal thermometers
(iii) Expansion of gases - Gas thermometer
REFERENCE BOOKS:
1.A course on mechanical measurements and instrumentation- A.K Sawhney
2.Instrumentation and Control systems- S.Sudhakarreddy&P.Divakararao
3.Instrumentation Measurement & Analysis- B.C Nakra and K.K Choudhry
SANYASIRAO

7/29/2019 Ics Notes by Polarao Sir
http://slidepdf.com/reader/full/ics-notes-by-polarao-sir 30/184
ICS NOTES-15 UNIT-2
[Type text] Page 30
R.Pola Rao, Asso.Prof, Dept of ME,GMRIT-Rajam
SANYASIRAO

7/29/2019 Ics Notes by Polarao Sir
http://slidepdf.com/reader/full/ics-notes-by-polarao-sir 31/184
ICS NOTES-16 UNIT-2
R.Pola Rao, Asso.Prof, Dept of ME,GMRIT-Rajam Page 30
Bimetallic Thermometers:
Construction and Working Principle
Bimetallic thermometers are of solid expansion type of thermometers. When two different materials
which have different thermal expansion coefficient are joined together, then a bimetallic strip or
bimetallic thermometer (or) bimetallic sensor is formed. The two types of materials used are Brass and
Invar of these two, brass has high thermal expansion coefficient, and Invar has low thermal expansion
coefficient. The bimetallic strip can be available in helical, cantilever flat types and also in spiral shape.
(However the working principle of all these types are same)
A spiral shaped bimetallic thermometer is shown in the below figure..
Figure: Bimetalli Thermometer
One end of the spiral shaped bimetallic strip is fixed and the other end is left out free. A pointer is
attached at the free end of the bimetallic strip. Tile temperature which is to be measured is applied to
the bimetallic strip. As soon as the composite strip senses the temperature it will expand or contract
(depending on the range of temperature). When this happens the pointer attached to the free end of
the strip moves over the calibrated scale which indicates the value proportional to the applied
temperature.
SANYASIRAO

7/29/2019 Ics Notes by Polarao Sir
http://slidepdf.com/reader/full/ics-notes-by-polarao-sir 32/184
ICS NOTES-16 UNIT-2
R.Pola Rao, Asso.Prof, Dept of ME,GMRIT-Rajam Page 31
Applications of Bimetallic Thermometers
1. These are used in control devices in a process.
2. Bimetallic shaped strips (helical type) are widely used in oil burners, refineries, type vulcanizers
etc.
3. A spiral shaped strip find its applications in air conditioning thermostats.
Merits
1. Since the scale is calibrated in terms of temperature we can take the readings easily and
directly.
2. These are available in various types. Therefore we can choose anyone type depending upon the
requirement.
3. Simple construction
4. Simple operation
5. Fast response
6. Light weight
7. Cost is less.
Demerits
1. Cannot be used for measurement of high range of temperature.
2. Measurement of temperature at remote areas is not possible.
3. Low accuracy.
SANYASIRAO

7/29/2019 Ics Notes by Polarao Sir
http://slidepdf.com/reader/full/ics-notes-by-polarao-sir 33/184
ICS NOTES-16 UNIT-2
R.Pola Rao, Asso.Prof, Dept of ME,GMRIT-Rajam Page 32
Liquid-in-glass Thermometer
The basic schematic of liquid-in-glass thermometer is shown in figure.
It is the most frequently used temperature measuring instrument in different applications. It consist of a
temperature sensing bulb, a responsive fluid and a scale. One end of the capillary tube is connected to
safety bulb and other end is connected to temperature sensing bulb. The most widely used fluids in
liquid-in-glass thermometer is either mercury or alcohol. This fluid is obtained with in a temperature
sensing bulb and a capillary tube.
The quick transfer of heat is possible with the liquid-in-glass, when the temperature sensing bulb walls
should be thin. One end of the capillary is connected to safety bulb since the volume of the capillary
tube is less than the capacity of bulb. Alcohol, has higher coefficient of expansion than mercury hence it
is widely used than mercury. The higher temperature range of this instrument is 340DC.If the space
present above mercury is filled with corbondioxide or N2 at high pressure then the boiling point of
SANYASIRAO
7/29/2019 Ics Notes by Polarao Sir
http://slidepdf.com/reader/full/ics-notes-by-polarao-sir 34/184
ICS NOTES-16 UNIT-2
R.Pola Rao, Asso.Prof, Dept of ME,GMRIT-Rajam Page 33
mercury is increased hence the temperature range of this instrument is extended to 5600C. If we use
this type of thermometers under some optimum conditions, its accuracy cannot exceed
0.10C.When there is a necessity to increase the accuracy then the Beekman thermometer is used
through which we can obtain an accuracy of 0.0050C. Here the thermometer measurement range is
limited to 5 - 60C.
Gas Thermometer
When the pressure of a gas is maintained constant, as temperature increases the volume of the gas also
increases. Therefore, in case of constant pressure thermometer as temperature increases the volume of
the gas also increases. Here the pressure and mass of the gas are kept constant. When the volume of
the gas is maintained constant, as temperature increases the pressure of the gas also increases.
Therefore, in case of constant volume the thermometer as temperature increases the volume of the gas
also increases. Here the volume and mass of the gas are kept constant.
We know that at constant volume,
PT = Po (l+βl T) (.: as temperature increases the pressure of the gas also increases)
Where,
PT = pressure at Toe
Po = pressure at 00C
β1 = thermal coefficient of pressure
The pressure change in the gas pressure is given by
)( 1210 T T PP −=∆ β
T PP ∆=∆ 10 β
Where,
∆P = Pressure change
∆T = (T2-T1) = Change in temperature
SANYASIRAO

7/29/2019 Ics Notes by Polarao Sir
http://slidepdf.com/reader/full/ics-notes-by-polarao-sir 35/184
ICS NOTES-16 UNIT-2
R.Pola Rao, Asso.Prof, Dept of ME,GMRIT-Rajam Page 34
In equation (1), ∆P is proportional to ∆T
The basic schematic diagram of a gas thermometer is shown in figure. It consists of a sensing bulb, a
bourdon tube and a capillary tube. A bourdon tube is a pressure transducer which is used to measure
the change in the pressure of a gas.
Figure: Gas Thermometer
The bourdon tube calibrated directly on the basis of change in pressure corresponding to the
temperature of the bulb. The actuating power of the bourdon tube is limited due to the pressure change
in temperature is very small.
The volume of gas in the capillary is very small compared to that of volume of gas in the bulb since this
thermometer bulbs are made large. Therefore, the effect of ambient temperature is reduced, due to this
the dynamic response of the gas -thermometer for transient changes is also reduced.
REFERENCE BOOKS:
1.A course on mechanical measurements and instrumentation- A.K Sawhney
2.Instrumentation and Control systems- S.Sudhakarreddy&P.Divakararao
3.Instrumentation Measurement & Analysis- B.C Nakra and K.K Choudhry
SANYASIRAO

7/29/2019 Ics Notes by Polarao Sir
http://slidepdf.com/reader/full/ics-notes-by-polarao-sir 36/184
ICS NOTES-16 UNIT-2
R.Pola Rao, Asso.Prof, Dept of ME,GMRIT-Rajam Page 35
SANYASIRAO

7/29/2019 Ics Notes by Polarao Sir
http://slidepdf.com/reader/full/ics-notes-by-polarao-sir 37/184
ICS
R.Pola Rao, Asso.Prof, Dept of
Pressure- force exerted by a flui
Units of Pressure
1 Pascal =1
1 Bar =1
1 atm =1
=1
=7
=1
1 torr = 1
Absolute Pressure = Atmospheri
Vacuum Pressure = Atmospheri
NOTES-17
E,GMRIT-Rajam
on unit area
N/m2
05
N/m2
.013x 105Pa
.013 bars
60 mm 0f mercury
0.3 m of water
mm of Hg(1 mm of mercury)
pressure + Gauge pressure
pressure - Absolute pressure.
UNIT-3
Page 35
SANYASIRAO

7/29/2019 Ics Notes by Polarao Sir
http://slidepdf.com/reader/full/ics-notes-by-polarao-sir 38/184
ICS
R.Pola Rao, Asso.Prof, Dept of
Static Pressure: It is defined as t
parallel to the wall in a pipe.
Stagnation or Total Pressure: It
stream were brought to rest isent
REFERENCE BOOKS:
1.A course on mechanical me
2.Instrumentation and Control
3.Instrumentation Measurem
NOTES-17
E,GMRIT-Rajam
he pressure acting on the wall by a fluid at rest
is defined as the pressure that would be obtaine
ropically
asurements and instrumentation- A.K Saw
systems- S.Sudhakarreddy&P.Divakarara
nt & Analysis- B.C Nakra and K.K Choudh
UNIT-3
Page 36
r flowing
if the flu id
ney
y
SANYASIRAO
7/29/2019 Ics Notes by Polarao Sir
http://slidepdf.com/reader/full/ics-notes-by-polarao-sir 39/184
ICS NOTES-18 UNIT-3
R.Pola Rao, Asso.Prof, Dept of ME,GMRIT-Rajam Page 37
Classification of Pressure Measuring Devices
According to the Range of Pressure to be Measured:
(a) High pressure measuring instruments (above 700 atm).
(b) Moderate pressure measuring instruments.
(c) Low pressure measuring instruments (1 mm Hg or below).
According to the Principle of Operation:
I. Balancing the pressure by a column of liquid (or) dead weight
(a) Manometers
(b) Dead weight tester
(c) Mcleod gauge
2. By measuring elastic deformation caused by the pressure
(a) Bourdon tube pressure gauge
(b) Diaphragm pressure gauge
(c) Bellows pressure gauge
3. Special methods (By measuring change in electrical quantities that vary with pressure) .
(a) Pirani thermal conductivity gauge
(b) Ionization gauge
(c) Knudsen gauge
(d) Bridgman gauge
Pressure gauges and their applications:
SANYASIRAO

7/29/2019 Ics Notes by Polarao Sir
http://slidepdf.com/reader/full/ics-notes-by-polarao-sir 40/184
ICS NOTES-18 UNIT-3
R.Pola Rao, Asso.Prof, Dept of ME,GMRIT-Rajam Page 38
REFERENCE BOOKS:
1.A course on mechanical measurements and instrumentation- A.K Sawhney
2.Instrumentation and Control systems- S.Sudhakarreddy&P.Divakararao
3.Instrumentation Measurement & Analysis- B.C Nakra and K.K Choudhry
SANYASIRAO

7/29/2019 Ics Notes by Polarao Sir
http://slidepdf.com/reader/full/ics-notes-by-polarao-sir 41/184
ICS
R.Pola Rao, Asso.Prof, Dept of
Manometers
Devices used for measuring pres
fluid by balancing the column of
A simple manometer consists of end is connected to a point wher
1.Simple manometers.
• Piezomete
• U - Tube
• Single col
2. Differential manometers
• U - Tube
Operation of Pressure Measurin
• Manometers
• Bourdon tube
• Bellows gage
Manometers
1. Piezometer:
Used to measure the gauge p
One end of the manometer i
the other end is open to the a
NOTES-19
E,GMRIT-Rajam
sure at a point or difference of pressure betwee
fluid by the same or another column of the flu
a glass tube having one of its ends open to atmthe pressure is to be measured
r
anometer
mn manometer
ifferential Manometer:
Devices
Bourdon tube Bello
ressure at a point in the fluid.
s connected to the point where the pressure is t
mosphere
UNIT-3
Page 39
two points in a
id.
sphere and other
ws gage
be measure and
SANYASIRAO

7/29/2019 Ics Notes by Polarao Sir
http://slidepdf.com/reader/full/ics-notes-by-polarao-sir 42/184
ICS
R.Pola Rao, Asso.Prof, Dept of
If 'h' is the rise in liquid level
P = wh= ρ
where, w = Specific weight
ρ = density of the liq
2. U- Tube Manometer:
One end of the V-tube is open
the pressure is to be measured
The U-tube is generally fill
greater.
Than the specific gravity of th
3.Single Column Manometer:
It is a modified form of U-T
In which a reservoir of large
manometer
When the manometer is con
height 'h2
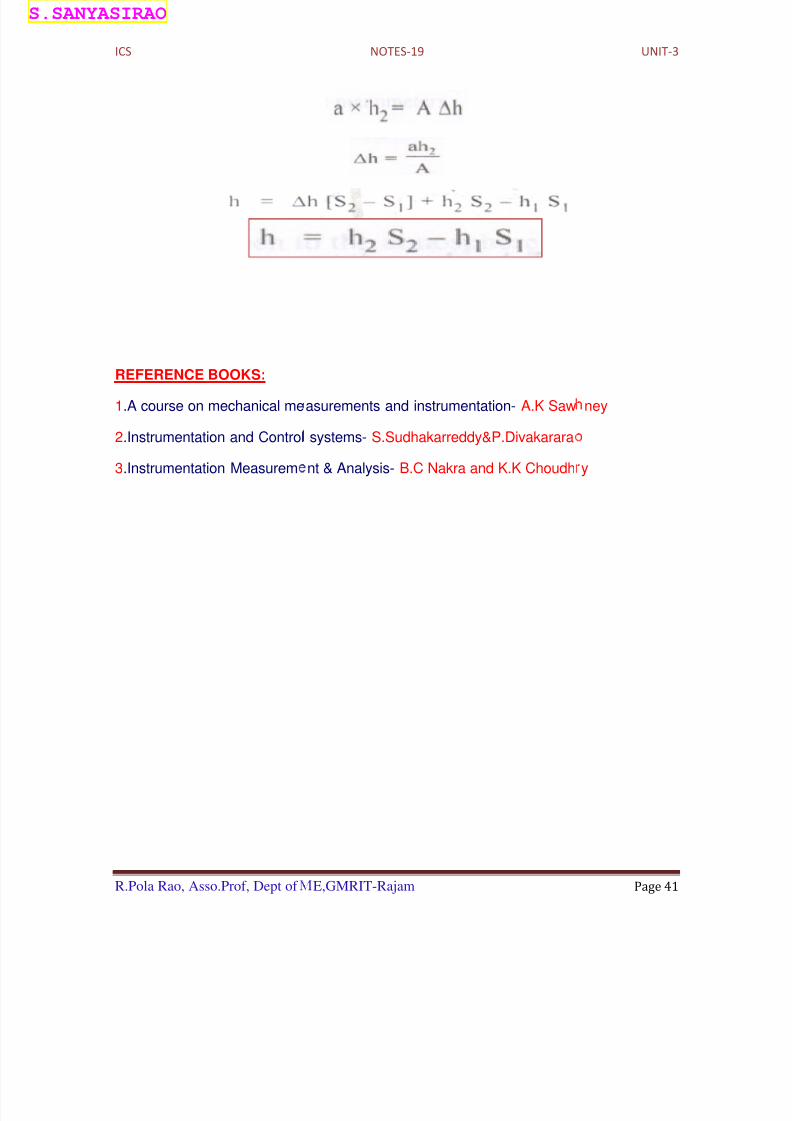
Let '∆h' be the fall in liqu
Rise of heavy liquid in right
NOTES-19
E,GMRIT-Rajam
gh
f liquid= ρg.
uid
It consists of a glass tube bent into U-shape.
to the atmosphere and other end is connected t
as shown.
d with mercury or any other liquid whose s
e liquid whose pressure is being measured.
h=h2s2-h1s1
P = wh= ρgh
be manometer
cross sectional area is connected to one of the li
ected to the pressure point, liquid in the right li
id level in the reservoir.
limb is equal to the fall of heavy liquid in the re
UNIT-3
Page 40
the point where
ecific gravity is
mbs of the
b is raised to a
servoir.
SANYASIRAO
7/29/2019 Ics Notes by Polarao Sir
http://slidepdf.com/reader/full/ics-notes-by-polarao-sir 43/184
ICS
R.Pola Rao, Asso.Prof, Dept of
REFERENCE BOOKS:
1.A course on mechanical me
2.Instrumentation and Control
3.Instrumentation Measurem
NOTES-19
E,GMRIT-Rajam
asurements and instrumentation- A.K Saw
systems- S.Sudhakarreddy&P.Divakarara
nt & Analysis- B.C Nakra and K.K Choudh
UNIT-3
Page 41
ney
y
SANYASIRAO

7/29/2019 Ics Notes by Polarao Sir
http://slidepdf.com/reader/full/ics-notes-by-polarao-sir 44/184
ICS
R.Pola Rao, Asso.Prof, Dept of
U - Tube Differential Manomet
Two ends of which are c
measured.
The U-Tube contains he
P A+1000
Advantages of the Manometers:
I. High accuracy and good sensit
2. Relatively inexpensive.
3. Easy to fabricate.
4. Suitable to measure low press
5. Simply by changing the mano
Limitations of the Manometers:
1. Fragile construction.
2. Readings are effected by chan
3. Surface tension of manometri
4. Recording is not possible.
5. High pressures cannot be mea
NOTES-20
E,GMRIT-Rajam
r:
nnected to two points whose pressure differenc
vy manometric liquid.
1g(x+y)-1000S 2gx-1000S 1gy=P B
ivity.
res.
metric liquid the sensitivity of the instrument ca
ges in gravity and temperature.
liquid creates capillary affects.
sured. (i.e., more than 2 atms).
UNIT-3
Page 42
e is to be
n be altered.
SANYASIRAO

7/29/2019 Ics Notes by Polarao Sir
http://slidepdf.com/reader/full/ics-notes-by-polarao-sir 45/184
ICS
R.Pola Rao, Asso.Prof, Dept of
Dead-weight Pressure Gauge
It is generally used for th
It consists of a piston wh
The chamber and the cyli
A pressure gauge which i
Operation-The oil is pres
are placed on the platfor
The pressure acting on th
PA=W
PA = W + Frictional force.
Applications:
I. It is used to calibrate all
engine indicators etc.
Advantages:
I. Simple in construction and eas
2. Wide range of instruments ca
3. Fluid pressure can be varied e
Disadvantages:
I. The accuracy of the instrumen
reduced by applying proper lubri
NOTES-21
E,GMRIT-Rajam
calibration purposes.
ch moves in a cylinder as shown in the figure.
nder are filled with oil.
s to be calibrated is fitted to the chamber.
surised with the help of a plunger and known st
of the piston until equilibrium is achieved
e piston
inds of pressure gauges such as industrial press
y to operate.
be calibrated
sily.
is limited due to friction. However frictional r
cation.
UNIT-3
Page 43
ndard weights
ure gauges,
sistance can be
SANYASIRAO

7/29/2019 Ics Notes by Polarao Sir
http://slidepdf.com/reader/full/ics-notes-by-polarao-sir 46/184
ICS
R.Pola Rao, Asso.Prof, Dept of
Elastic Transducers
Elastic elements get defo
The deflection / deforma
Bourdon Tube Pressure
It consists of an elastic t
a circular arc.
This tube is called bourd
One end of the tube is cl
pressure is to be measure
Systems of gears are pr
pointer on a graduated sc
Operation- When the op
point,
Fluid under pressure ente
to circular shape.
This change in sh
The change in cu
pointer which rotates on
Advantages:
1. Low cost and simple c
2. High accuracy
3. Rugged construction
NOTES-22
E,GMRIT-Rajam
rmed when subjected to pressure.
ion of the elastic element is measured by a con
Gauge:
be of steel or bronze which is of elliptical shap
on tube which acts as a pressure sensing eleme
sed and other end is open to allow the fluid int
d.
vided to magnify the deflection of the tube
ale.
n and the end of the bourdon tube is connecte
rs the tube and the elliptical shape of the tube g
ape causes the tube to straighten out slightly.
vature of the tube is transmitted through a syste
he graduated dial.
onstruction
UNIT-3
Page 44
enient method.
and is bent into
t.
o the tube whose
nd to rotate the
d to the pressure
radually changes
m of gears to the
SANYASIRAO

7/29/2019 Ics Notes by Polarao Sir
http://slidepdf.com/reader/full/ics-notes-by-polarao-sir 47/184
ICS
R.Pola Rao, Asso.Prof, Dept of
4. Wide range of measur
5. Portable size
6. Direct reading is obtai
Disadvantages:
1. It responds slowly to t
2. It exhibits hysteresis.
3. It is sensitive to shock
4. It requires amplificatio
Diaphragm Pressure Ga
Diaphragm is a thin plate
Diaphragms are made o
nickel alloys.
The diaphragm gets def
sides.
It always deflects towar
The deflection is then se
NOTES-22
E,GMRIT-Rajam
ment are possible
ed
e pressure changes
and vibration
n.
uges
of circular shape clamped firmly around its ed
elastic metal alloys such as bronze, stainless
lected in accordance with the pressure differe
s the low pressure side.
sed by an appropriate displacement transducer.
UNIT-3
Page 45
es.
teel and ferrous-
ntials across the
SANYASIRAO

7/29/2019 Ics Notes by Polarao Sir
http://slidepdf.com/reader/full/ics-notes-by-polarao-sir 48/184
ICS
R.Pola Rao, Asso.Prof, Dept of
An electrical-resistance s
deflection.
Other diaphragm defle
transducers.
Amplification of deflectilinkages.
Advantages:
I. They are available in s
2. They exhibit linearity
3. They can withstand ov
4. Absolute and different
5. Minimum hysteresis a
Limitations:
1. They need protection f 2. They cannot be used t
3. Difficult to repair thes
Applications:
]. They are used as low p
2. Used as draft gauges.
REFERENCE BOOKS:
1.A course on mechanical me
2.Instrumentation and Control
3.Instrumentation Measurem
NOTES-22
E,GMRIT-Rajam
train gauge may also be installed on the diaph
ction measuring transducers are capacitiv
on of the diaphragm can also be done by mea
all sizes and at low cost.
ver wide range.
er pressures.
ial pressures can be measured.
d no permanent zero shift.
rom vibration and shock.measure high pressures.
gauges.
ressure absolute gauges.
asurements and instrumentation- A.K Saw
systems- S.Sudhakarreddy&P.Divakarara
nt & Analysis- B.C Nakra and K.K Choudh
UNIT-3
Page 46
agm to sense the
and inductive
s of mechanical
ney
y
SANYASIRAO

7/29/2019 Ics Notes by Polarao Sir
http://slidepdf.com/reader/full/ics-notes-by-polarao-sir 49/184
ICS
R.Pola Rao,Asso.Prof,Dept of M
Bellows Pressure Gauge
Bellows gauge is made of a thin
Common bellows materials are t
copper.
When the pressure is applied at f
movable end is the measure of a
Bellows Differential pressure g
Advantages:
I. Simple and rugged constructio
NOTES-23 UNI
E
s
metallic tube having deep circumferential corru
rumpet brass, stainless steel, phosphor bronze a
ixed end of the bellows, it gets elongated. The
plied pressure
uge
n.
-3
Page 47
gations.
d beryllium
eflection of the
SANYASIRAO
7/29/2019 Ics Notes by Polarao Sir
http://slidepdf.com/reader/full/ics-notes-by-polarao-sir 50/184
ICS NOTES-23 UNIT-3
R.Pola Rao,Asso.Prof,Dept of ME Page 48
2. They can be used for the measurement of both gauge and differential pressures.
3. They can be used for low and moderate pressures.
4. Moderate cost.
Limitations:
I. Problems of hysteresis and zero shift.
2. Not suitable for dynamic measurements due to their large mass.
3. Temperature compensation is required.
4: Cannot be used for high pressure measurement.
REFERENCE BOOKS:
1.A course on mechanical measurements and instrumentation- A.K Sawhney
2.Instrumentation and Control systems- S.Sudhakarreddy&P.Divakararao
3.Instrumentation Measurement & Analysis- B.C Nakra and K.K Choudhry
SANYASIRAO
7/29/2019 Ics Notes by Polarao Sir
http://slidepdf.com/reader/full/ics-notes-by-polarao-sir 51/184
ICS
R.Pola Rao,Asso.Prof,Dept of M
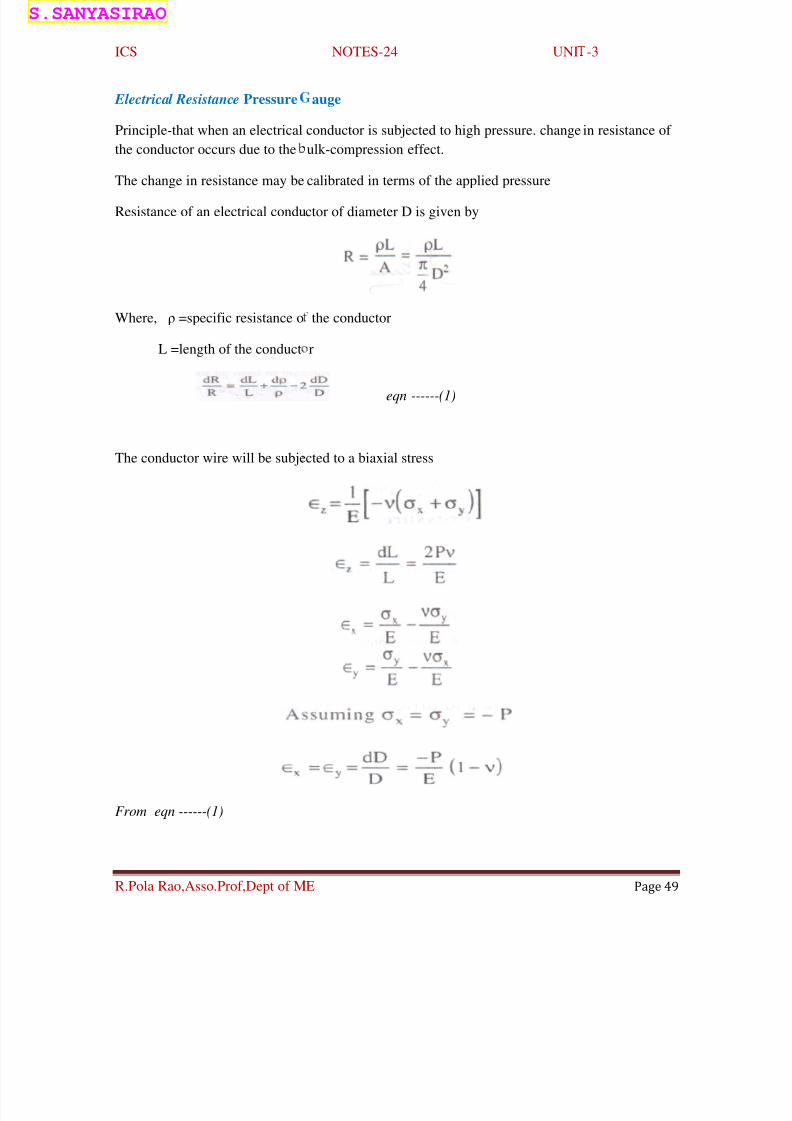
Electrical Resistance Pressure
Principle-that when an electrical
the conductor occurs due to the
The change in resistance may be
Resistance of an electrical condu
Where, ρ =specific resistance o
L =length of the conduct
The conductor wire will be subje
From eqn ------(1)
NOTES-24 UNI
E
auge
conductor is subjected to high pressure. change
ulk-compression effect.
calibrated in terms of the applied pressure
ctor of diameter D is given by
the conductor
r
eqn ------(1)
cted to a biaxial stress
-3
Page 49
in resistance of
SANYASIRAO
7/29/2019 Ics Notes by Polarao Sir
http://slidepdf.com/reader/full/ics-notes-by-polarao-sir 52/184
ICS
R.Pola Rao,Asso.Prof,Dept of M
If ρis independent of pressure, th
REFERENCE BOOKS:
1.A course on mechanical me
2.Instrumentation and Control
3.Instrumentation Measurem
NOTES-24 UNI
E
en
asurements and instrumentation- A.K Saw
systems- S.Sudhakarreddy&P.Divakarara
nt & Analysis- B.C Nakra and K.K Choudh
-3
Page 50
ney
y
SANYASIRAO

7/29/2019 Ics Notes by Polarao Sir
http://slidepdf.com/reader/full/ics-notes-by-polarao-sir 53/184
ICS
R.Pola Rao,Asso.Prof,Dept of M
Bridgman or Bulk mod
It consists of pressure se
Bellow is filled with kero
element.
Sensing element are mad
Thermal conductivity g
It measures the pressure throug
At low pressure there is a relatio
i.e., the heat conductivity decrea
The temperature of an elcurrent and the rate of he
If the current is-kept con
temperature is governed
The lower the gas pressu
higher the filament temp
NOTES-25 UNI
E
lus gauge:
sing wire which is enclosed in flexible bellows.
sene for transmitting the pressure to be measur
with magnanin and an alloy of gold and 2.1 %
uges:
a change in the thermal conductivity of the gas
nship between pressure and thermal conductivit
es with decreasing pressure
ctrically heated filament depends upon the magat dissipation from the filament.
tant, then the heat loss from the filament and h
y the conductivity of the surrounding gas medi
e, the lower the thermal conductivity and cons
rature for a given electric energy input.
-3
Page 51
d to the sensing
chromium.
.
y,
nitude of the
nce its
m.
quently the
SANYASIRAO

7/29/2019 Ics Notes by Polarao Sir
http://slidepdf.com/reader/full/ics-notes-by-polarao-sir 54/184
ICS NOTES-25 UNIT-3
R.Pola Rao,Asso.Prof,Dept of ME Page 52
Estimation of the gas pressure is made by measuring either temperature or resistance
variation of the filament.
REFERENCE BOOKS:
1.A course on mechanical measurements and instrumentation- A.K Sawhney
2.Instrumentation and Control systems- S.Sudhakarreddy&P.Divakararao
3.Instrumentation Measurement & Analysis- B.C Nakra and K.K Choudhry
SANYASIRAO

7/29/2019 Ics Notes by Polarao Sir
http://slidepdf.com/reader/full/ics-notes-by-polarao-sir 55/184
ICS
R.Pola Rao, Asso.Prof, Dept of
Cup and vane anemometers
Which measure the speed of
The devices essentially cons
velocity of flow
Which measure the speed of
The devices essentially cons
velocity of flow
The drag on the cup A is gre
The resultant torque rotates t
The number of revolutions i
of rotation gives a measure o
In a vane anemometer, vane
flow is parallel to the axis of
The rotor drives a low fric
wind speed
The cup type unit is best f
speeds more accurately.
Experiments indicate that pr
speed and angular velocity o
NOTES-26 UNI
E,GMRIT-Rajam
air movement.
ist of a rotating element whose speed of rotatio
air movement.
ist of a rotating element whose speed of rotatio
ter than that on cup B .
he assembly in the anticlockwise direction.
read from a dial for a given period of time, a
f the average speed of air in the region traverse
s of the wind mill type are mounted in a sup
rotation.
ion gear train which in turn drives a pointer
r relatively low speed whereas the vane typ
vided the wind speed is not too large, the relati
cup/vanes is linear.
-3
Page 53
n varies with the
n varies with the
nd the frequency
by the air.
ort so that fluid
hat indicates the
measures large
on between wind
SANYASIRAO

7/29/2019 Ics Notes by Polarao Sir
http://slidepdf.com/reader/full/ics-notes-by-polarao-sir 56/184
ICS
R.Pola Rao, Asso.Prof, Dept of
Current meters:
A current meter consists
vanes are fixed.
The unit is suspended i
tension) by a streamline
NOTES-27 UNI
E,GMRIT-Rajam
of a horizontal wheel on which conical buc
to the flow stream by suspension cable whic
weight.
-4
Page 54
ets or V-shaped
is held taut (in
SANYASIRAO
7/29/2019 Ics Notes by Polarao Sir
http://slidepdf.com/reader/full/ics-notes-by-polarao-sir 57/184
ICS
R.Pola Rao, Asso.Prof, Dept of
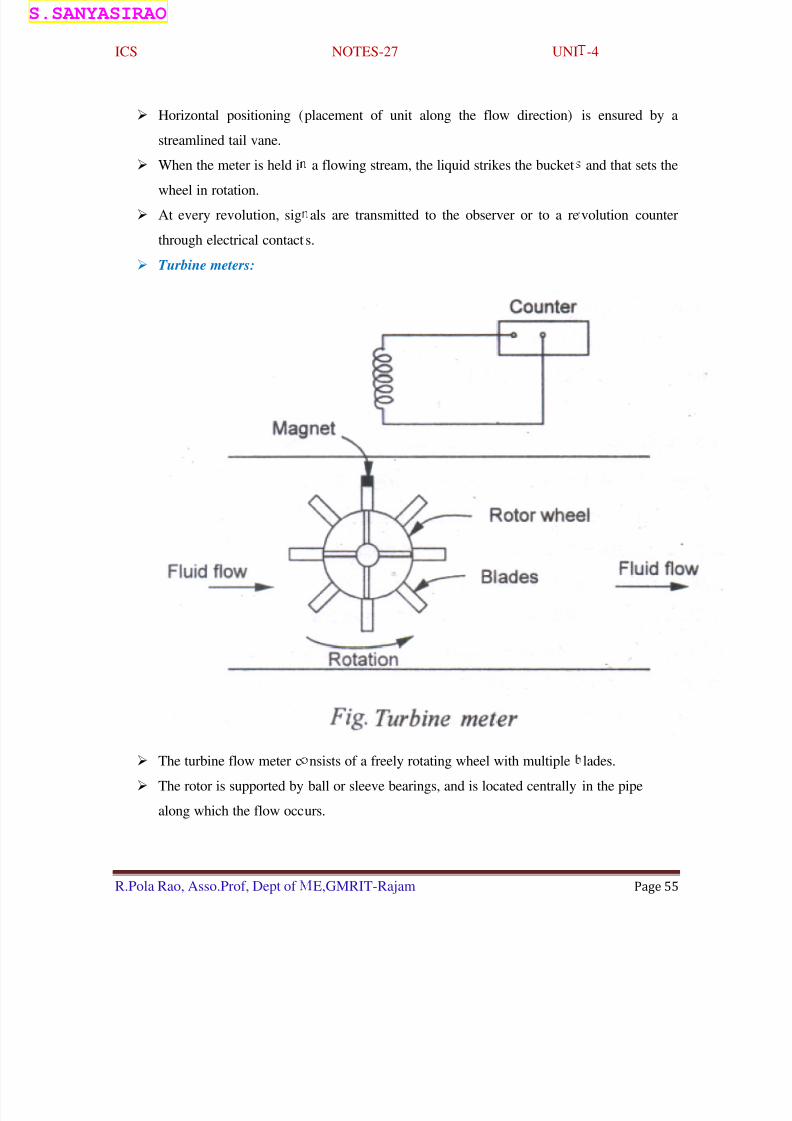
Horizontal positioning (
streamlined tail vane.
When the meter is held i
wheel in rotation.
At every revolution, sig
through electrical contact
Turbine meters:
The turbine flow meter c
The rotor is supported by
along which the flow occ
NOTES-27 UNI
E,GMRIT-Rajam
placement of unit along the flow direction)
a flowing stream, the liquid strikes the bucket
als are transmitted to the observer or to a re
s.
nsists of a freely rotating wheel with multiple
ball or sleeve bearings, and is located centrally
urs.
-4
Page 55
is ensured by a
and that sets the
volution counter
lades.
in the pipe
SANYASIRAO

7/29/2019 Ics Notes by Polarao Sir
http://slidepdf.com/reader/full/ics-notes-by-polarao-sir 58/184
ICS
R.Pola Rao, Asso.Prof, Dept of
The flowing fluid imping
and sets the rotor in moti
The rotor speed is measu
up and associated counte
The electro-magnetic, pi
one of the rotor blades w
As the magnet moves pa
The voltage pulse is pick
Faster the fluid flow, the
Each pulse represents a d
taken as an indication of
Where
f is the pulse freq
Q is the volume fl
K is the flow coef
Which depends on the fl
By minimizing the beari
linear output.
Advantages and limitati
Good accuracy, excellent
Low pressuredrop; good
Easy to install and maint
Good transient response
Relatively high cost and
Requires in-line mounti
NOTES-27 UNI
E,GMRIT-Rajam
ing on the turbine blades imparts a force on the
n with an angular speed proportional to the flu
red with a mechanical counter or with an electr
.
k up could be a small permanent magnet moun
th a coil being placed just outside the tube.
st the coil, an e.mf. is induced.
d up for each rotation of the wheel.
greater the count per second.
efinite flow quantity, and the total number of p
otal flow
ency,
ow rate and
ficient
w rate and the viscosity.
ng friction and other losses ,the device can be d
ons :
repeatability
emperature and pressure ratings
in adaptability to flow totalising and to digital
limited use for slurry applications
g and a straight run of pipe (15 diameters) ahea
-4
Page 56
blade surfaces
d velocity.
-magnetic pick
ed at the tip of
lses may be
signed to give a
lending systems
d of the meter.
SANYASIRAO

7/29/2019 Ics Notes by Polarao Sir
http://slidepdf.com/reader/full/ics-notes-by-polarao-sir 59/184
ICS
R.Pola Rao, Asso.Prof, Dept of
Rotameter (or)Variable Ar
The Rota meter consists
or active element (float)
This tapering tube is pro
The float or bob material
With increase in the flo
the annular area between
The float adjusts its posi
i.e., the float rises higher
The discharge equation f
Advantages and limitati
Simplicity of operation, e
Relatively low cost
NOTES-28 UNI
E,GMRIT-Rajam
a Meter (or) Area Meter
f a tapered metering glass tube, inside which is
f the rotor.
ided with suitable inlet and outlet connections.
has specific gravity higher than that of the fluid
rate, the float rises in the tube and there occuthe float and the tube.
ion in relation to discharge through the passage
or lower depending on the flow rate.
r flow through a Rota meter is given by
ns of a Rota meter:
ase of reading and installation
-4
Page 57
located the rotor
to be metered.
rs an increase in
SANYASIRAO
7/29/2019 Ics Notes by Polarao Sir
http://slidepdf.com/reader/full/ics-notes-by-polarao-sir 60/184
ICS
R.Pola Rao, Asso.Prof, Dept of
Handles wide variety of
Easily equipped with dat
Possibility of convenient
side by side
Glass tube subject to bre
Limited to small pipe siz
Less accurate compare to
Must be mounted vertica
Subject to oscillations in
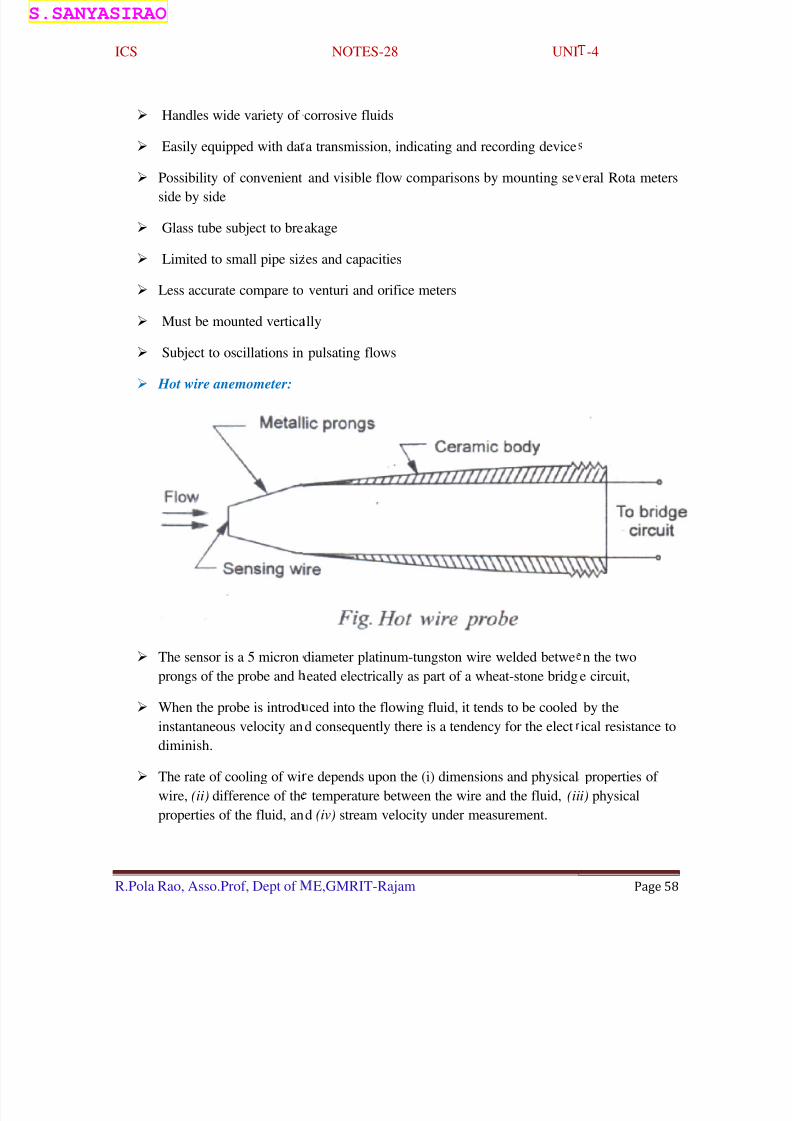
Hot wire anemometer:
The sensor is a 5 micron
prongs of the probe and
When the probe is introd
instantaneous velocity an
diminish.
The rate of cooling of wi
wire, (ii) difference of th
properties of the fluid, an
NOTES-28 UNI
E,GMRIT-Rajam
corrosive fluids
a transmission, indicating and recording device
and visible flow comparisons by mounting se
akage
es and capacities
venturi and orifice meters
lly
pulsating flows
diameter platinum-tungston wire welded betwe
eated electrically as part of a wheat-stone bridg
ced into the flowing fluid, it tends to be cooled
d consequently there is a tendency for the elect
e depends upon the (i) dimensions and physical
temperature between the wire and the fluid, (ii
d (iv) stream velocity under measurement.
-4
Page 58
eral Rota meters
n the two
e circuit,
by the
ical resistance to
properties of
i) physical
SANYASIRAO

7/29/2019 Ics Notes by Polarao Sir
http://slidepdf.com/reader/full/ics-notes-by-polarao-sir 61/184
ICS NOTES-28 UNIT-4
R.Pola Rao, Asso.Prof, Dept of ME,GMRIT-Rajam Page 59
For a simple hot wire anemometer the first three conditions are effectively constant and
the instrument response is then a direct measurement of the velocity.
REFERENCE BOOKS:
1.A course on mechanical measurements and instrumentation- A.K Sawhney 2.Instrumentation and Control systems- S.Sudhakarreddy&P.Divakararao
3.Instrumentation Measurement & Analysis- B.C Nakra and K.K Choudhry
SANYASIRAO

7/29/2019 Ics Notes by Polarao Sir
http://slidepdf.com/reader/full/ics-notes-by-polarao-sir 62/184
ICS
R.Pola Rao, Asso.Prof, Dept of
Electro-Magnetic flow
Principle:
Voltages generated when
From these measurement
The measurement of flo
law of electromagnetic in
When a pipe or tube carr
magnetic field an e.m.f.
This voltage gives the m
An electromagnetic flow
carry the flow whose vel
To the opposite sides of t
the fluid flow inside the
Now this pipe is placed b
that produces magnetic fi
Working :
When the conducting flui
pipe, it cuts the magnetic
NOTES-29 UNI
E,GMRIT-Rajam
eters
a conducting fluid flows through an applied m
s, the flow rate may be deduced.
rate using an electromagnetic flow meter depe
duction.
ing electrically conducting fluid is placed in a
ill be induced across the electrodes connected
asure of the velocity of the fluid or flow rate of
meter consists of a nonmagnetic and non condu
city or flow rate is to be determined.
his pipe a pair of insulated electrodes which are
ipe are connected.
etween the two poles of an electromagnet or pe
eld.
d whose flow rate is to be measured is made to
field causing some e.m.f. to be induced across
-4
Page 60
gnetic field.
ds on Faraday's
ransverse
o it.
the fluid.
cting pipe to
in contact with
manent magnet
flow through the
he electrodes.
SANYASIRAO

7/29/2019 Ics Notes by Polarao Sir
http://slidepdf.com/reader/full/ics-notes-by-polarao-sir 63/184
ICS
R.Pola Rao, Asso.Prof, Dept of
This induced voltage is g
The above equation impl
induced e.m.f. as long as
NOTES-29 UNI
E,GMRIT-Rajam
iven by,
es that the volume flow rate is directly proporti
the flux density remains constant.
-4
Page 61
onal to the
SANYASIRAO

7/29/2019 Ics Notes by Polarao Sir
http://slidepdf.com/reader/full/ics-notes-by-polarao-sir 64/184
ICS NOTES-29 UNIT-4
Page 62
R.Pola Rao, Asso.Prof, Dept of ME,GMRIT-Rajam
Magnetic Type Level Indicator :
Magnetic type level indicator is used to measure the level of liquids which contain
corrosive and toxic materials.
It contains a float in which a bar magnet is arranged and is placed in the chamber whose
liquid level is to be determined.
The float moves up and down with the increase and decrease in the level of liquid
respectively.
A magnetic shielding device and an indicator containing small wafers arranged in series
are attached to the sealed chamber.
These wafers are coated with luminous paint and rotates about 1800
to expose a
differently coloured surface.
SANYASIRAO

7/29/2019 Ics Notes by Polarao Sir
http://slidepdf.com/reader/full/ics-notes-by-polarao-sir 65/184
ICS NOTES-29 UNIT-4
Page 63
R.Pola Rao, Asso.Prof, Dept of ME,GMRIT-Rajam
As the level changes, the float moves (along with magnet) up and down.
Due to this movement of magnet ,the wafers rotate and present a black coloured surface
for the movement of float in one direction and an yellow coloured surface for themovement of float in opposite direction.
REFERENCE BOOKS:
1.A course on mechanical measurements and instrumentation- A.K Sawhney
2.Instrumentation and Control systems- S.Sudhakarreddy&P.Divakararao
3.Instrumentation Measurement & Analysis- B.C Nakra and K.K Choudhry
SANYASIRAO

7/29/2019 Ics Notes by Polarao Sir
http://slidepdf.com/reader/full/ics-notes-by-polarao-sir 66/184
ICS NOTES-30 UNIT-4
R.Pola Rao, Asso.Prof, Dept of ME,GMRIT-Rajam Page 64
Laser Doppler Anemometer (LDA)
Basic Principle :
Laser Doppler Anemometer (LDA) works on the principle of Doppler effect.
It states that whenever a laser beam passes through the moving fluid, frequency shift
takes place in the light scattered by the small particles present in that fluid .This shift in
the frequency of the beam is directly proportional to the velocity of the fluid flow.
Working: It consists a
He-Ne laser source,
Beam splitter,
Focusing and receiving lenses,
Photo detector,
Signal processing and Recording circuit.
SANYASIRAO

7/29/2019 Ics Notes by Polarao Sir
http://slidepdf.com/reader/full/ics-notes-by-polarao-sir 67/184
ICS NOTES-30 UNIT-4
R.Pola Rao, Asso.Prof, Dept of ME,GMRIT-Rajam Page 65
The beam splitter can be optical prism or rotating optical gating or half silvered mirror.
The beam splitter is placed at 45° to the laser beam.
The laser beam from laser source passes through the beam splitter which split the beam
into two parts.
These two parts of beam then passes to focusing lens L1 which focus the beam at a point
in the flow stream where the velocity is to be determined.
If the flow stream containing tiny tracer particles such as microscopic dust or dust
particles passes through the high intensity area, the particles scatter the light. Due to this
frequency shift occurs in the scattered light.
When this scattered light falls on the photo detector circuit which shows the varying
electrical signal.
The frequency of this signal is proportional to the rate at which the dust particles crosses
the interference fringes.
The spacing between the fringes can be expressed as,
Where,
λ - is wavelength of laser beam
θ- is angle between two converging beams.
Advantages :
1. This method does not disturbs the fluid flow.
2. It does not require any calibration to determine the flow. .
3. It does not require any physical contact with the fluid whose flow rate is to be
determined i.e., it is a non-contact type instrument
4. Accuracy is very high (approximately ± 0.2%).
5. It can be used to measure both liquid and gaseous flows.
Disadvantages :
1. It is suited for the measurement of flow passing through transparent channel only:
SANYASIRAO

7/29/2019 Ics Notes by Polarao Sir
http://slidepdf.com/reader/full/ics-notes-by-polarao-sir 68/184
ICS
R.Pola Rao, Asso.Prof, Dept of
2. It is not suited for the
3. A skilled operator is re
4. Cost is very high.
Rotating Vane Type Fl
It consist of an eccentric
The vanes move when th
rotor.
The inlet flow (flow com
Therefore a fixed volum
Thus the total number of
Advantages :
1. It can be used for liqui
2. Good accuracy of the
3. Permits low pressure d
Disadvantages :
1. It is expensive.
2. Bulky an heavy.
3. Accuracy tends to dec
NOTES-30 UNI
E,GMRIT-Rajam
lows of clean fluids.
quired to use this instrument.
w Meter:
rum as a rotor and spring loaded vanes.
rotor rotates radially in and out of the slots in
ing inside) rotates the rotor.
of fluid is trapped and delivered outside for ev
rotations of the rotor gives the volumetric flow.
s containing viscous materials.
rder of 0.5%.
rop.
ease for low flow rates.
-4
Page 66
he eccentric
ery rotation.
SANYASIRAO
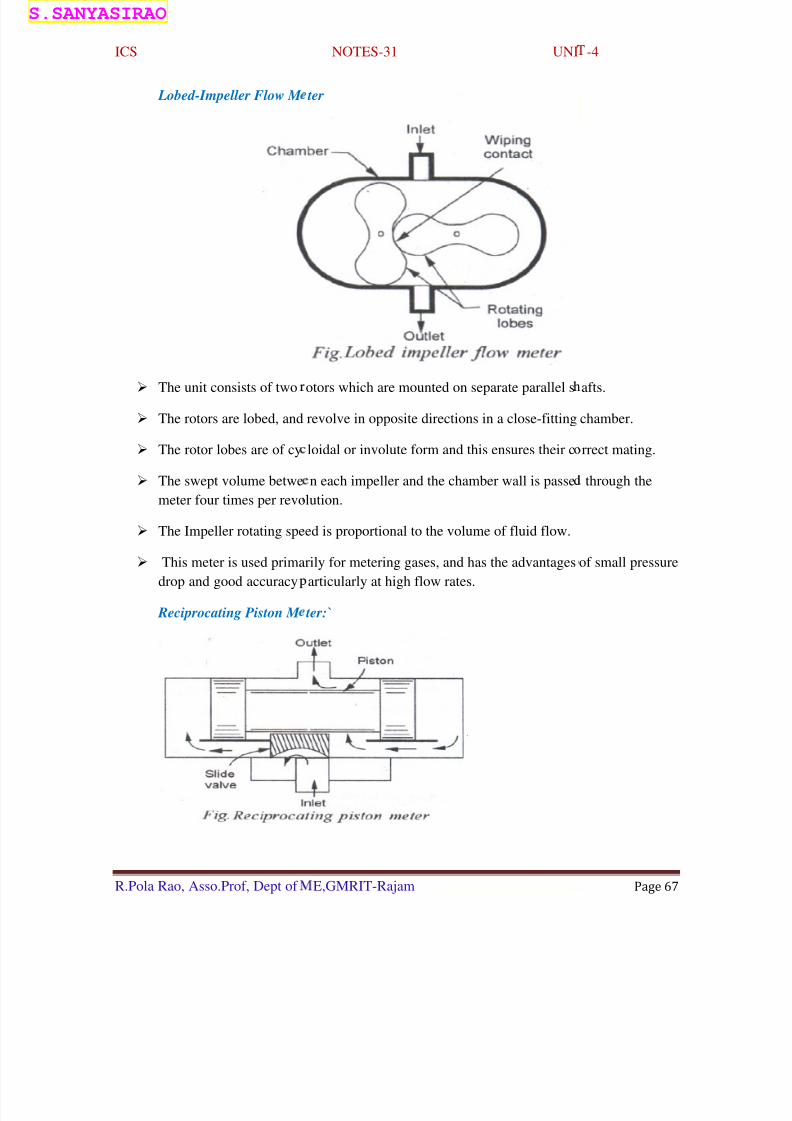
7/29/2019 Ics Notes by Polarao Sir
http://slidepdf.com/reader/full/ics-notes-by-polarao-sir 69/184
ICS
R.Pola Rao, Asso.Prof, Dept of
Lobed-Impeller Flow M
The unit consists of two
The rotors are lobed, and
The rotor lobes are of cy
The swept volume betwe
meter four times per revo
The Impeller rotating spe
This meter is used prima
drop and good accuracy
Reciprocating Piston M
NOTES-31 UNI
E,GMRIT-Rajam
ter
otors which are mounted on separate parallel s
revolve in opposite directions in a close-fitting
loidal or involute form and this ensures their c
n each impeller and the chamber wall is passe
lution.
ed is proportional to the volume of fluid flow.
rily for metering gases, and has the advantages
articularly at high flow rates.
ter:`
-4
Page 67
afts.
chamber.
rrect mating.
through the
of small pressure
SANYASIRAO

7/29/2019 Ics Notes by Polarao Sir
http://slidepdf.com/reader/full/ics-notes-by-polarao-sir 70/184
ICS NOTES-31 UNIT-4
R.Pola Rao, Asso.Prof, Dept of ME,GMRIT-Rajam Page 68
The meter essentially consists of a piston reciprocating inside a cylinder.
Inlet and outlet valves with their opening and closing being controlled by a slide valve;
and slide valve actuated by the piston movement.
With the motion of the piston, the fluid is passed from the inlet to outlet alternately
through each end of the cylinder.
The volume of the fluid flow is directly proportional to both the stroke length and the
piston speed.
The meter gives quite accurate measures of discharge in the range 10to1000 gpm. The
use is, however ,limited. to non-corrosive and low viscosity liquids
REFERENCE BOOKS:
1.A course on mechanical measurements and instrumentation- A.K Sawhney
2.Instrumentation and Control systems- S.Sudhakarreddy&P.Divakararao
3.Instrumentation Measurement & Analysis- B.C Nakra and K.K Choudhry
SANYASIRAO

7/29/2019 Ics Notes by Polarao Sir
http://slidepdf.com/reader/full/ics-notes-by-polarao-sir 71/184
ICS
R.Pola Rao, Asso.Prof, Dept of
Nutating Disk Meter:
It consists of an eccentric
The peculiar wobbling o
only a rotation but a swe
The top and bottom of th
chamber.
The chamber is thus seal
and emptied; each compa
The viscosity of the liqui
The compartments progr
liquid pressure; and thusoutlet.
For a known capacity of
quantity of fluid flow can
The motion of the disk c
can be directly calibrated
NOTES-32 UNI
E,GMRIT-Rajam
ally mounted disk which nutates in a hemisphe
r nutating motion of the disk implies that the di
ping motion also.
disk maintain tangential contact with the top a
d off into separate compartments which are suc
rtment holding a definite volume.
takes care both of sealing and lubrication.
ss from suction to discharge side as the disk w
cause a definite volume of liquid to be passed f
he chamber and the number of disk oscillations
be metered.
n be made to drive a recording and indicating
in terms of the liquid discharge.
-4
Page 69
rical chamber.
k provides not
nd bottom of the
cessively filled
bbles under
om inlet to
, the total
echanism which
SANYASIRAO

7/29/2019 Ics Notes by Polarao Sir
http://slidepdf.com/reader/full/ics-notes-by-polarao-sir 72/184
ICS
R.Pola Rao, Asso.Prof, Dept of
Classification:
1. Direct method
a. Liquid lev
b) Float type level-Ic) Float and shaft li
d) Float operated po
e) Hook type level i
2. Indirect method.
a) Hydrostati
b) Bubbler o
c) Float Ope
d) Capacitan
e) Ultrasonic
f) Radio Act
Liquid level sight glass :
It is frequently used visu
It is a tube made up of gl
NOTES-33 UNI
E,GMRIT-Rajam
el sight glass
dicatoruid level gauge
entiometer,
dicator.
c Pressure Level Measuring Devices
Purge System
ated Rheostat
e Liquid - Level Sensor
Level Indicator
ive or Gamma - Ray Liquid Level Indicator or
l type of level indicator is gauge glass .
ss and is fixed to one side of the tank or vessel.
-4
Page 70
ucleonic Gauge
SANYASIRAO

7/29/2019 Ics Notes by Polarao Sir
http://slidepdf.com/reader/full/ics-notes-by-polarao-sir 73/184
ICS NOTES-33 UNIT-4
R.Pola Rao, Asso.Prof, Dept of ME,GMRIT-Rajam Page 71
The tank is filled with liquid and the variation in the level of the liquid can be measured.
The liquid level inside the tank and the level inside the gauge glass are maintained at an
equal level or same level.
A scale is fixed to the gauge glass or some markings will be made on the gauge glass.
The calibrated scale shows the rising and falling level of the liquid inside the gauge glass
which in turn gives the level of the liquid inside the tank.
Application:
Can be used in the measurement of liquid level in a closed tank
Merits:
1. We can read the reading directly on the calibrated scale
2. This type of construction is simple
3. Inexpensive
Demerits:
1. Accuracy in measurement is achieved provided the liquid is clean.
2. It is not used to measure level of hot liquids because the glass will break.
3. Cannot be used with viscous fluids and slurry fluids
Float type level-Indicator :
SANYASIRAO

7/29/2019 Ics Notes by Polarao Sir
http://slidepdf.com/reader/full/ics-notes-by-polarao-sir 74/184
ICS
R.Pola Rao, Asso.Prof, Dept of
The float is dipped in the
Any corrosion resisting
The float is connected to
A pointer scale arrangem
As the level of the liquid
When the level increases
the pulley makes the pull
With this the pointer atta
the present level of the ta
Application :
Can be used to know the
Merits :
1. This arrangement is av
NOTES-33 UNI
E,GMRIT-Rajam
water tank whose level is to be measured.
aterial is used to make the float.
the pulley through a stainless steel cable.
ent is also attached to the pulley.
varies the position of the float varies
the float will be lifted up and the cable which is
ey to rotate.
ched to the pulley moves over a calibrated scal
nk.
level of liquids in sumps, reservoirs and in ope
ailable in different number of designs.
-4
Page 72
wound around
and indicates
tanks
SANYASIRAO
7/29/2019 Ics Notes by Polarao Sir
http://slidepdf.com/reader/full/ics-notes-by-polarao-sir 75/184
ICS NOTES-33 UNIT-4
R.Pola Rao, Asso.Prof, Dept of ME,GMRIT-Rajam Page 73
2. Can be used for liquids of high temperatures.
Demerits :
1. Wear-tear problems due to movable parts.
2. These are used for liquids only with moderate pressure
REFERENCE BOOKS:
1.A course on mechanical measurements and instrumentation- A.K Sawhney
2.Instrumentation and Control systems- S.Sudhakarreddy&P.Divakararao
3.Instrumentation Measurement & Analysis- B.C Nakra and K.K Choudhry
SANYASIRAO

7/29/2019 Ics Notes by Polarao Sir
http://slidepdf.com/reader/full/ics-notes-by-polarao-sir 76/184
ICS
R.Pola Rao, Asso.Prof, Dept of
Hook type level indicato
A-A -is the initial liquid l
B-B-Final liquid level.
The hook is adjusted in
A and B-B and the readi
The difference of the two
Bubbler or Purge System
NOTES-34 UNI
E,GMRIT-Rajam
evel.
uch a way that the tip of the hook is coincides
g is taken.
readings is the increase in the level of the liqui
:
-4
Page 74
ith the level A-
SANYASIRAO
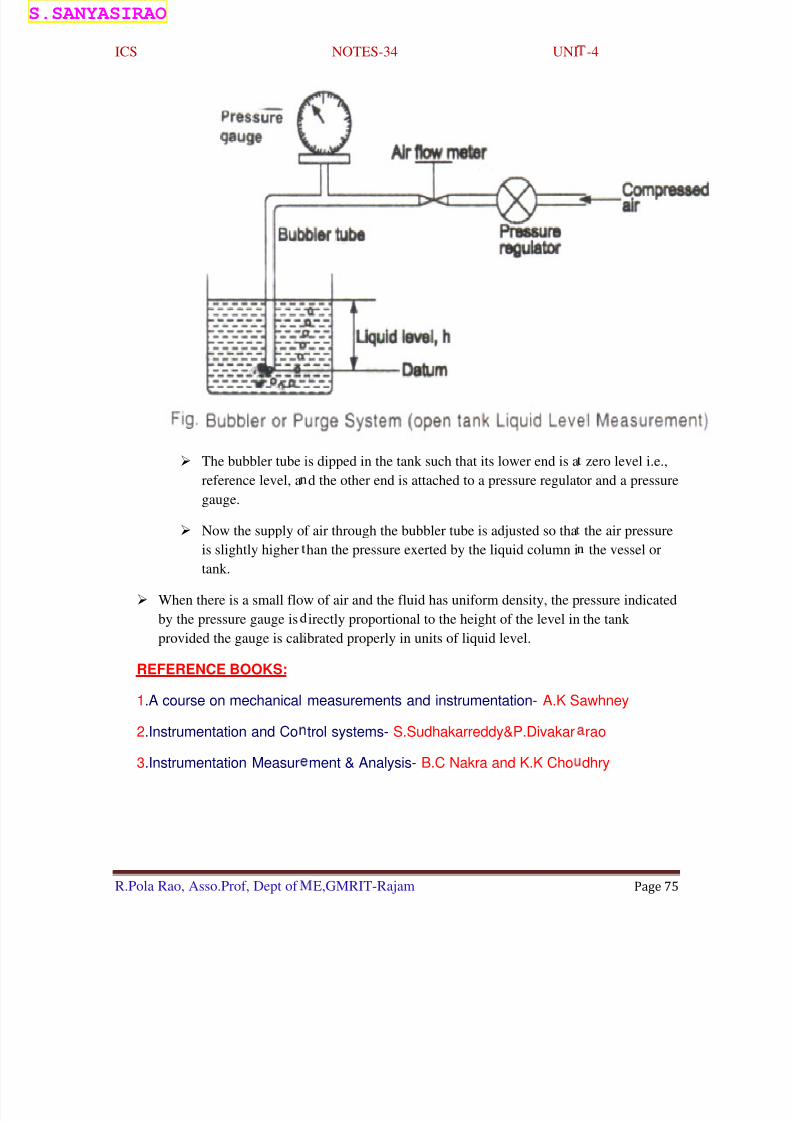
7/29/2019 Ics Notes by Polarao Sir
http://slidepdf.com/reader/full/ics-notes-by-polarao-sir 77/184
ICS
R.Pola Rao, Asso.Prof, Dept of
The bubbler tube
reference level, a
gauge.
Now the supply o
is slightly highertank.
When there is a small flo
by the pressure gauge is
provided the gauge is cal
REFERENCE BOOKS:
1.A course on mechanical
2.Instrumentation and Co
3.Instrumentation Measur
NOTES-34 UNI
E,GMRIT-Rajam
is dipped in the tank such that its lower end is a
d the other end is attached to a pressure regulat
f air through the bubbler tube is adjusted so tha
han the pressure exerted by the liquid column i
w of air and the fluid has uniform density, the p
irectly proportional to the height of the level in
ibrated properly in units of liquid level.
measurements and instrumentation- A.K S
trol systems- S.Sudhakarreddy&P.Divakar
ment & Analysis- B.C Nakra and K.K Cho
-4
Page 75
zero level i.e.,
or and a pressure
the air pressure
the vessel or
ressure indicated
the tank
awhney
rao
dhry
SANYASIRAO

7/29/2019 Ics Notes by Polarao Sir
http://slidepdf.com/reader/full/ics-notes-by-polarao-sir 78/184
ICS
R.Pola Rao, Asso.Prof, Dept of
Capacitance Liquid - Lev
Principle-Capacitance of
dielectric constant of it c
In this case the capacitan
change in area of plates i
Therefore when the heig
and output capacitance in
Similarly when the heigh
Merits :
1. This method of level
2. This method can be us
3. No problem of wear-te
NOTES-35 UNI
E,GMRIT-Rajam
el Sensor
the parallel plate capacitor varies or changes if
anges.
e varies as the height of the liquid changes i.e.,
used.
t of the liquid increases the area between the pl
creases.
t decreases the capacitance also decreases.
easurement is very sensitive.
d for small systems.
ar since it does not contain any movable parts.
-4
Page 76
he area or
the principle of
ates decreases
SANYASIRAO

7/29/2019 Ics Notes by Polarao Sir
http://slidepdf.com/reader/full/ics-notes-by-polarao-sir 79/184
ICS
R.Pola Rao, Asso.Prof, Dept of
4. It can be used with slu
Demerits :
1. The performance will
2. The connection and m
some errors may occur.
Ultrasonic Level Indicator :
Principle - Reflection of
The transmitter (T) sends
The waves get reflected f
receiver (R).
The time taken by the tra
back to the receiver gives
As the level of the liquid
back to receiver also cha
Thus the changes in the l
NOTES-35 UNI
E,GMRIT-Rajam
ry fluids.
e affected by the change in temperature.
unting of metal tank with the meter should be
sound wave from the surface of the liquid.
the ultrasonic waves towards the free surface o
rom the surface. These reflected waves are rece
nsmitted, wave to travel to the surface of the liq
the level of the liquid.
changes, the time taken to reach the surface of
ges.
vel of the liquid are determined accurately.
-4
Page 77
roper, otherwise
f the liquid.
ived by the
uid and then
liquid and then
SANYASIRAO

7/29/2019 Ics Notes by Polarao Sir
http://slidepdf.com/reader/full/ics-notes-by-polarao-sir 80/184
ICS NOTES-35 UNIT-4
R.Pola Rao, Asso.Prof, Dept of ME,GMRIT-Rajam Page 78
Advantages :
1. Operating principle is very simple.
2. It can be used for various types of liquids and solid substances.
Disadvantages :
1. Level measurement of this type requires very good experienced and skilled operator.
2. It is very expensive.
REFERENCE BOOKS:
1.A course on mechanical measurements and instrumentation- A.K Sawhney
2.Instrumentation and Control systems- S.Sudhakarreddy&P.Divakararao
3.Instrumentation Measurement & Analysis- B.C Nakra and K.K Choudhry
SANYASIRAO

7/29/2019 Ics Notes by Polarao Sir
http://slidepdf.com/reader/full/ics-notes-by-polarao-sir 81/184
ICS NOTES-36 UNIT-4
R.Pola Rao, Asso.Prof, Dept of ME,GMRIT-Rajam Page 79
Magnetic Type Level Indicator
Magnetic type level indicator is used to measure the level of liquids which contain
corrosive and toxic materials.
It contains a float in which a bar magnet is arranged and is placed in the chamber whose
liquid level is to be determined.
The float moves up and down with the increase and decrease in the level of liquid
respectively.
A magnetic shielding device and an indicator containing small wafers arranged in series
are attached to the sealed chamber.
These wafers are coated with luminous paint and rotates about 1800 to expose a
differently coloured surface.
As the level changes, the float moves (along with magnet) up and down.
Due to this movement of magnet ,the wafers rotate and present a black coloured surface
for the movement of float in one direction and an yellow coloured surface for the
movement of float in opposite direction.
Advantages :
1. Direct method of level measurement shows actual level of the fluid directly.
2. It is a very simple method of liquid level measurement.
3. It does not require any compensation for variations in level due to temperature.
SANYASIRAO

7/29/2019 Ics Notes by Polarao Sir
http://slidepdf.com/reader/full/ics-notes-by-polarao-sir 82/184
ICS NOTES-36 UNIT-4
R.Pola Rao, Asso.Prof, Dept of ME,GMRIT-Rajam Page 80
4. Liquid level measurement 'Using direct method does not require any calibration.
Limitations :
1. This method is not suitable for corrosive and viscous liquids.
2. It is not possible to determine liquid levels of tanks located at remote areas.
3. It is not possible to record/the output for future use.
4. The glass gauges are fragile and liable to break.
5. Is not suited for the level measurement of very high tanks.
6. Cannot be used for high pressure ranges.
REFERENCE BOOKS:
1.A course on mechanical measurements and instrumentation- A.K Sawhney
2.Instrumentation and Control systems- S.Sudhakarreddy&P.Divakararao
3.Instrumentation Measurement & Analysis- B.C Nakra and K.K Choudhry
SANYASIRAO

7/29/2019 Ics Notes by Polarao Sir
http://slidepdf.com/reader/full/ics-notes-by-polarao-sir 83/184
ICS NOTES-37 UNIT-5
R.Pola Rao, Asso.Prof, Dept of ME,GMRIT-Rajam Page 81
Tachometers:
Tachometers are the devices which are commonly used for measuring the angular speed.
Tachometer may be defined as "an instrument which either continuously indicates the value of
rotary speed or continuously displays a reading of average speed over short intervals of time“.
Mechanical tachometers :
Vibrating reed tachometer
Centrifugal force tachometer
Slipping clutch tachometer
Hand speed indicator.
Electrical Tachometer :
Electrical tachometers
Drag cup tachometer
Commutated capacitor tachometer
Tachogenerators
Contactless tachometers.
REFERENCE BOOKS:
1.A course on mechanical measurements and instrumentation- A.K Sawhney
2.Instrumentation and Control systems- S.Sudhakarreddy&P.Divakararao
3.Instrumentation Measurement & Analysis- B.C Nakra and K.K Choudhry

7/29/2019 Ics Notes by Polarao Sir
http://slidepdf.com/reader/full/ics-notes-by-polarao-sir 84/184
ICS NOTES-38 UNIT-5
R.Pola Rao, Asso.Prof, Dept of ME,GMRIT-Rajam Page 82
Vibrating reed tachometer
When the tachometer base plate is kept in contact with any non moving part or the
machine reed turned to resonance with the machine vibration frequency.
The indicated reed vibration frequency is the direct measure of speed of the machine, if
the reed frequency is-calibrated in terms of speed.
It operates on the principle that, 'Centrifugal force is proportional to the speed of
rotation‘.
The main advantage of this tachometer is, it can be used to measure speeds of different
ranges simply by changing the gear train & linkages.
Centrifugal tachometers are used to ,measure speeds up to 40,000 rpm with an Accuracy
of I%.
Slipping Clutch Tachometer
7/29/2019 Ics Notes by Polarao Sir
http://slidepdf.com/reader/full/ics-notes-by-polarao-sir 85/184
ICS NOTES-38 UNIT-5
R.Pola Rao, Asso.Prof, Dept of ME,GMRIT-Rajam Page 83
Friction material is placed between slipping clutch and input shaft.
The spiral spring is placed between slipping clutch and indicator shaft.
The indicating shaft is driven by the rotating shaft through a slip clutch and hence,
named is called as slipping clutch tachometer.
REFERENCE BOOKS:
1.A course on mechanical measurements and instrumentation- A.K Sawhney
2.Instrumentation and Control systems- S.Sudhakarreddy&P.Divakararao
3.Instrumentation Measurement & Analysis- B.C Nakra and K.K Choudhry

7/29/2019 Ics Notes by Polarao Sir
http://slidepdf.com/reader/full/ics-notes-by-polarao-sir 86/184
ICS
R.Pola Rao, Asso.Prof, Dept of
Hand speed indicator.
It consists of an integral
The spindle operates whe
But the counter does not
watch. .
The instrument indicates
designed to indicate the s
Electrical Tachometer
Contact type tachometers:
Eddy current (or)
Tachometer Gene
(b) A.C. T
Non-Contact type tachometers:
Inductive pick -u
Capacitive pick -
NOTES-39 UNI
E,GMRIT-Rajam
top watch and counter with automatic disconne
n meshed with shaft.
unction until the start and wind button is press
the average speed over a short interval of time
peed directly in rpm.
drag cup tachometer
rators:
(a) D.C. Tachometer generator.
achometer generator.
tachometer (Toothed rotor tachometer).
up tachometer.
-5
Page 84
ct.
d to start the
nd the dial is

7/29/2019 Ics Notes by Polarao Sir
http://slidepdf.com/reader/full/ics-notes-by-polarao-sir 87/184
ICS
R.Pola Rao, Asso.Prof, Dept of
Eddy current (or) drag cup tac
When the permanent ma
eddy current is induced i
This eddy current produc
spring.
When the permanent ma
eddy current is induced i
This eddy current produc
spring.
The disc rotates in the di
spring .
D.C. Tachometer generator.
It consists of a small arm
horse type magnet.
NOTES-40 UNI
E,GMRIT-Rajam
hometer :
net along with the steel cup is coupled to the ro
the aluminum cup.
es a torque which rotates the cup against the tor
net along with the steel cup is coupled to the r
the aluminum cup.
es a torque which rotates the cup against the tor
ection of the which rotates the cup against the t
ature which is coupled to the rotating shaft and
-5
Page 85
tating shaft an
ue of the
otating shaft an
ue of the
rque of the
permanent

7/29/2019 Ics Notes by Polarao Sir
http://slidepdf.com/reader/full/ics-notes-by-polarao-sir 88/184
ICS NOTES-40 UNIT-5
R.Pola Rao, Asso.Prof, Dept of ME,GMRIT-Rajam Page 86
When the armature rotates along with the shaft, a pulsating D.C. voltage which is
roportional to the speed of the shaft is generated.
A.C. Tachometer Generator:
Consists of a rotating permanent magnet which is coupled to the shaft whose speed is
to be measured
An a.c voltage is induced in the stator coil when the shaft rotates .
Frequency and amplitude of the induces voltage is proportional to the speed of the shaft.
REFERENCE BOOKS:
1.A course on mechanical measurements and instrumentation- A.K Sawhney
2.Instrumentation and Control systems- S.Sudhakarreddy&P.Divakararao
3.Instrumentation Measurement & Analysis- B.C Nakra and K.K Choudhry

7/29/2019 Ics Notes by Polarao Sir
http://slidepdf.com/reader/full/ics-notes-by-polarao-sir 89/184
ICS
R.Pola Rao, Asso.Prof, Dept of
Inductive pick -up tachometer
When the toothed gear
which will produce a cha
Due to this, the magneti
The frequency of the vol
speed of rotation.
Capacitive pick - up tachomete
NOTES-41 UNI
E,GMRIT-Rajam
(Toothed rotor tachometer).
otates, the air gap between the magnet and t
nge in the reluctance of the magnetic circuit.
field expands and collapses and a voltage is in
age pulses depends upon the number of teeth o
r.
-5
Page 87
he rotor changes
uced in the coil.
the rotor and its

7/29/2019 Ics Notes by Polarao Sir
http://slidepdf.com/reader/full/ics-notes-by-polarao-sir 90/184
ICS NOTES-41 UNIT-5
R.Pola Rao, Asso.Prof, Dept of ME,GMRIT-Rajam Page 88
When the vane comes in between the two capacitor plates, the capacitance of the circuit
changes and its pulses differs when vane is not present between the plates.
The pulses thus produced are amplified, squared and finally fed to the pulse counter.
REFERENCE BOOKS:
1.A course on mechanical measurements and instrumentation- A.K Sawhney
2.Instrumentation and Control systems- S.Sudhakarreddy&P.Divakararao
3.Instrumentation Measurement & Analysis- B.C Nakra and K.K Choudhry

7/29/2019 Ics Notes by Polarao Sir
http://slidepdf.com/reader/full/ics-notes-by-polarao-sir 91/184
ICS
R.Pola Rao, Asso.Prof, Dept of
Optical Tachometers
Optical Shaft Encoders:
Photoelec
Rotating
Photoelectric Tachometer :
When a light beam hits t
obtained .
And the reflected light is
The frequency of electric
speed of the rotating shaf
Rotating Disc Photoelectric Ta
NOTES-42 UNI
E,GMRIT-Rajam
tric Tachorneter :
isc Photoelectric Tachometer:
e reflecting surface on the rotating shaft, light
focussed on to the photoelectric cell.
al output pulses from photoelectric cell is propo
t.
chometer
-5
Page 89
ulses are
rtional to the
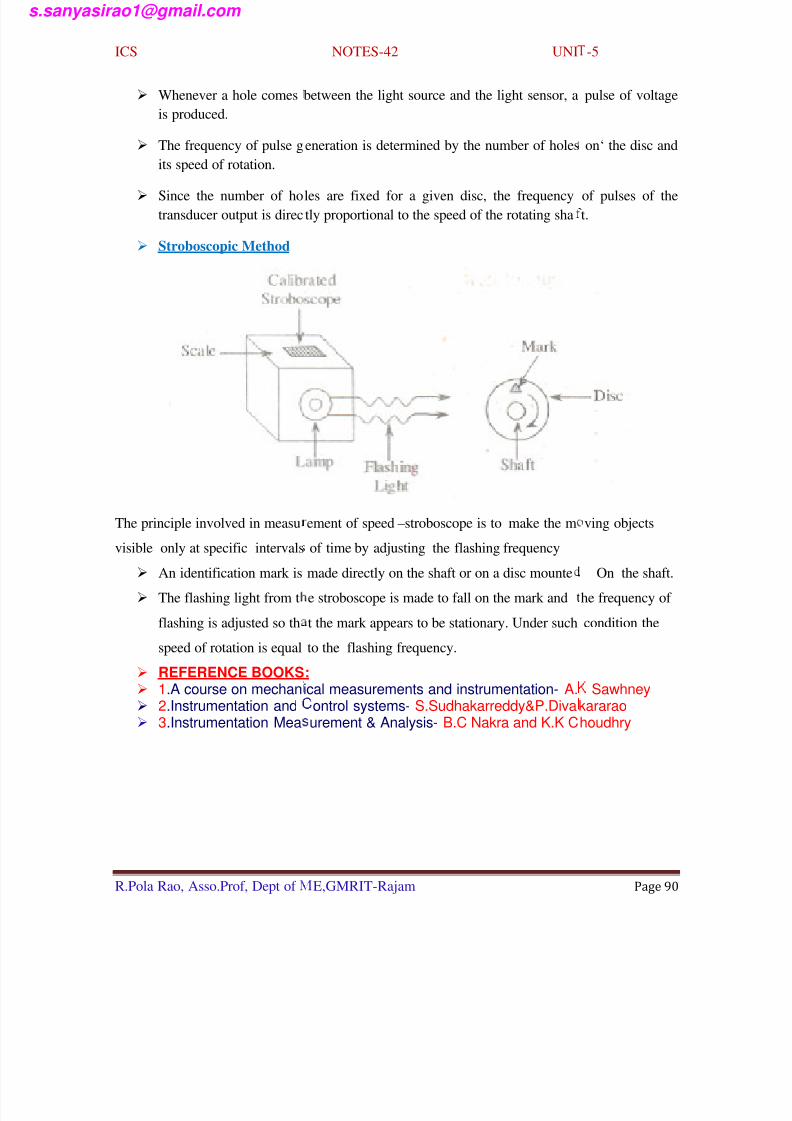
7/29/2019 Ics Notes by Polarao Sir
http://slidepdf.com/reader/full/ics-notes-by-polarao-sir 92/184
ICS
R.Pola Rao, Asso.Prof, Dept of
Whenever a hole comes
is produced.
The frequency of pulse g
its speed of rotation.
Since the number of ho
transducer output is direc
Stroboscopic Method
The principle involved in measu
visible only at specific intervals An identification mark is
The flashing light from t
flashing is adjusted so th
speed of rotation is equal
REFERENCE BOOKS
1.A course on mechan 2.Instrumentation and 3.Instrumentation Mea
NOTES-42 UNI
E,GMRIT-Rajam
between the light source and the light sensor, a
eneration is determined by the number of holes
les are fixed for a given disc, the frequency
tly proportional to the speed of the rotating sha
ement of speed –stroboscope is to make the m
of time by adjusting the flashing frequencymade directly on the shaft or on a disc mounte
e stroboscope is made to fall on the mark and
t the mark appears to be stationary. Under such
to the flashing frequency.
:
ical measurements and instrumentation- A.ontrol systems- S.Sudhakarreddy&P.Divaurement & Analysis- B.C Nakra and K.K C
-5
Page 90
pulse of voltage
on‘ the disc and
of pulses of the
t.
ving objects
On the shaft.
he frequency of
condition the
Sawhneykararao houdhry

7/29/2019 Ics Notes by Polarao Sir
http://slidepdf.com/reader/full/ics-notes-by-polarao-sir 93/184
ICS NOTES-43 UNIT-5
R.Pola Rao,Asso.Prof,Dept of ME Page 91
Vibration :
If the displacement - time variation is continuous with some degree of repetitive nature, then the
type of motion is called Vibration.
Measurement of motion and vibration parameters are very important
In predicting the fatigue failure of machine components or a structure. Measurement of vibration
parameters are also useful in reducing the structure vibration or noise level.
Motion Measuring Instruments:
1. Relative Motion Measurement Devices:
measure the motion of a body with respect to a fixed reference.
2.Absolute Motion Measurement Devices:
Measurement of motion of a bridge
e.g. Seismic instrument.
Vibrometers :
which gives an output usually voltage, that is proportional to either displacement or velocity.
Accelerometers:
Out put is a function of acceleration.
Simple Vibrometers
Vibrating Wedge:
Cantilever (or) Reed Vlbrometer
Simple Accelerometer:
Acceleration Level Indicator
1.Vibrating Wedge:

7/29/2019 Ics Notes by Polarao Sir
http://slidepdf.com/reader/full/ics-notes-by-polarao-sir 94/184
ICS
R.Pola Rao,Asso.Prof,Dept of M
Used to measure the vibr
When the member is vib
By observing the locatio
Amplitude of vibration
2.Cantilever (or) Reed Vi
NOTES-43 UNI
E
ation when amplitude of vibration is greater tha
ating, the wedge successively assumes two extr
of the point where the images overlap,
brometer :
-5
Page 92
0.8 mm.
eme positions

7/29/2019 Ics Notes by Polarao Sir
http://slidepdf.com/reader/full/ics-notes-by-polarao-sir 95/184
ICS
R.Pola Rao,Asso.Prof,Dept of M
It consists of a small cant
vibrating surface whose
In operation, the length o
until resonance occurs.
At resonance, the natural
body. ,
The natural frequency of
Acceleration Level Indi
Instrument actual
been reached or n
It consists of a pre loade
In operation, when the e
preload setting, electrical
some form of indicator.
NOTES-43 UNI
E
ilever beam mounted on the block which is pla
requency is to be measured.
f the beam is slowly adjusted by means of a scr
frequency of the beam is equal to the frequenc
the beam is given by
ator :
y indicates whether the predetermined level of
ot.
cantilever-spring and an electrical contact
fect of inertia forces acting on the spring and
contact will be broken, and this action may th
-5
Page 93
ed against the
w arrangement
of the vibrating
cceleration has
ass exceeds the
n be used to trip

7/29/2019 Ics Notes by Polarao Sir
http://slidepdf.com/reader/full/ics-notes-by-polarao-sir 96/184
ICS
R.Pola Rao,Asso.Prof,Dept of M
The Seismic Instrumen
It consists of a mass whi
damper to the housing fr
The base of the housing
characteristics are to stud
A displacement transduc
housing.
By proper selection of sp
used to measure either ac
NOTES-44 UNI
E
:
h is connected through the parallel arrangemen
me.
rame is attached to the vibrating body whose v
ied.
r is used to measure the relative motion betwe
ring-mass and damper combinations, the relativ
celeration or displacement of a vibrating body.
-5
Page 94
of spring &
bration
n mass and the
motion may be

7/29/2019 Ics Notes by Polarao Sir
http://slidepdf.com/reader/full/ics-notes-by-polarao-sir 97/184
ICS
R.Pola Rao,Asso.Prof,Dept of M
Strain Gauge Accelerometer:
It consists of a cantilever
One end of the cantilever
mass 'm'.
A viscous fluid is filled i
When the attachment is
mass occurs which produ
The strain of the cantile
The strain gauges mount
vibration /acceleration if
NOTES-44 UNI
E
, mass and strain gauges.
is fixed to the housing frame and other end is c
side the housing to provide damping.
onnected to the vibrating body, vibrational dis
ces strain in the cantilever beam.
er beam is proportional to the vibration/acceler
d on the beam indicates the strain which is the
it is calibrated prior to use.
-5
Page 95
onnected to the
lacement of
tion.
irect measure of

7/29/2019 Ics Notes by Polarao Sir
http://slidepdf.com/reader/full/ics-notes-by-polarao-sir 98/184
ICS NOTES-44 UNIT-5
Page 96
R.Pola Rao,Asso.Prof,Dept of ME
REFERENCE BOOKS:
1.A course on mechanical measurements and instrumentation- A.K Sawhney
2.Instrumentation and Control systems- S.Sudhakarreddy&P.Divakararao
3.Instrumentation Measurement & Analysis- B.C Nakra and K.K Choudhry

7/29/2019 Ics Notes by Polarao Sir
http://slidepdf.com/reader/full/ics-notes-by-polarao-sir 99/184
ICS
R.Pola Rao,Asso.Prof,Dept of M
Variable Resistance Vi
Consists of a seismic ma
When the housing frame
attached to the mass mov
circuit.
The change in resistance
measurement.
Piezoelectric Accelerom
Piezoelectric accelerome
crystal along with electro
NOTES-45 UNI
E
ration Sensor
s, spring. damper and potentiometer
is connected to a vibrating body, seismic mass
es along with the body thereby changing the res
is calibrated in terms of vibration to facilitate th
eter:
er consists of a seismic mass, spring, damper a
de arrangement which are connected as shown.
-5
Page 97
nd the slider
istance of the
e direct
d a piezoelectric

7/29/2019 Ics Notes by Polarao Sir
http://slidepdf.com/reader/full/ics-notes-by-polarao-sir 100/184
ICS NOTES-45 UNIT-5
R.Pola Rao,Asso.Prof,Dept of ME Page 98
when the housing frame is connected to the vibrating body, a force is exerted on the
piezoelectric crystal by the mass-spring arrangement.
Due to this force a voltage is generated which is the measure of vibration.
REFERENCE BOOKS:
1.A course on mechanical measurements and instrumentation- A.K Sawhney
2.Instrumentation and Control systems- S.Sudhakarreddy&P.Divakararao
3.Instrumentation Measurement & Analysis- B.C Nakra and K.K Choudhry

7/29/2019 Ics Notes by Polarao Sir
http://slidepdf.com/reader/full/ics-notes-by-polarao-sir 101/184
ICS
R.Pola Rao,Asso.Prof,Dept of M
LVDT- Accelerometer:
The mass which is attach
An auxiliary power supp
During the vibration of
windings occurs which p
This output voltage of th
direct measurement.
Capacitance Vibration
NOTES-46 UNI
E
ed to the frame is made to act as the core of the
ly is given to the primary winding.
ody , relative displacement between the seismi
oduces voltage in the secondary coil.
LVDT is calibrated in terms of the vibration t
ensor
-5
Page 99
LVDT.
mass and the
facilitate the

7/29/2019 Ics Notes by Polarao Sir
http://slidepdf.com/reader/full/ics-notes-by-polarao-sir 102/184
ICS NOTES-46 UNIT-5
R.Pola Rao,Asso.Prof,Dept of ME Page 100
When the housing frame is attached to the vibrating body relative movement between the
mass and the housing frame occurs.
This movement causes a change in distance between the capacitor plates, thereby
changing its capacitance.
The change in capacitance is the measure vibration.
REFERENCE BOOKS:
1.A course on mechanical measurements and instrumentation- A.K Sawhney
2.Instrumentation and Control systems- S.Sudhakarreddy&P.Divakararao
3.Instrumentation Measurement & Analysis- B.C Nakra and K.K Choudhry

7/29/2019 Ics Notes by Polarao Sir
http://slidepdf.com/reader/full/ics-notes-by-polarao-sir 103/184
ICS NOTES-47 UNIT-6
R.Pola Rao, Asso.Prof, Dept of ME,GMRIT-Rajam Page 101
Strain gauge and different types of electrical resistance strain gauges:
Strain gauge is defined as a transducer used to measure strain and associated stress in
experimental stress analysis. When a metal wire (or conducting wire) is stretched or
compressed, its length and diameter changes due to which the resistance and also the
resistivity of the wire will change. This effect is known as piezo-resistive effect. All
the strain gauges operates on the principle of piezo-resistive effect. Hence these are
also referred as piezo-resistive gauges.
Classification
Electrical resistance strain gauges are mainly classified into two types. They are,
(i) Unbonded strain gauges
(ii) Bonded strain gauges.
Bonded strain gauges are further divided into,
(i) Foil type strain gauge
(ii) Wire type strain gauge
(iii) Semiconductor type strain gauge.
Different methods used for the measurement of strain:
If is defined as the relative change in dimensions i.e, change in length of a given line
segment (wire or conductor) to the actual length of that line segment. When a load is
applied to a simple bar whose length is L, dimensional change will occur in the length
of the bar. Therefore the strain applied to the bar is given by,
L
L ∆
=Strain
length
lengthin
Actual
Change=ε
The various methods available for the measurement of strain are,
1. Photo-elasticity method
2. Brittle lacquers
3. Strain gauges
(a) Non-electrical strain gauges
(i) Mechanical
(ii) Optical.
(iii) Photo-elastic.

7/29/2019 Ics Notes by Polarao Sir
http://slidepdf.com/reader/full/ics-notes-by-polarao-sir 104/184
ICS NOTES-47 UNIT-6
R.Pola Rao, Asso.Prof, Dept of ME,GMRIT-Rajam Page 102
(b) Electrical strain gauges
(i) Resistance gauges
1. Metallic
2. Semiconductor.
(ii) Capacitance gauges
(iii) Inductance gauges.
REFERENCE BOOKS:
1.A course on mechanical measurements and instrumentation- A.K Sawhney2.Instrumentation and Control systems- S.Sudhakarreddy&P.Divakararao 3.Instrumentation Measurement & Analysis- B.C Nakra and K.K Choudhry

7/29/2019 Ics Notes by Polarao Sir
http://slidepdf.com/reader/full/ics-notes-by-polarao-sir 105/184
ICS NOTES-48 UNIT-6
R.Pola Rao, Asso.Prof, Dept of ME,GMRIT-Rajam Page 103
Bonded strain gauge and Unbonded strain gauge.
(i) Bonded Strain Gauge
When the strain gauges is directly placed or bonded so on the surface of the
(component) which is subjected to stress or which under study, then this arrangement
is known as bonded wire strain gauge. A bonded wire strain gauge designed to
measure pressure or force is illustrated below.
Figure
In the above arrangement a fine resistance wire 0.25mm (in diameter) is bonded on
the surface of the device under observation. When a force or pressure is applied to the
device, the physical dimensions of it will change. Since the strain gauge element is
pasted on its surface, the dimensions of the strain gauge changes due to which the
resistance of the gauge changes. The measure of change in resistance will become the
measure of applied pressure or force.
This change in resistance of the gauge can be measured by connecting the gauge in
anyone of the four arms of balanced Wheatstone bridge as shown below.
Figure: Bonded Strain Gauge connected in Wheatstone Bridge
Specifications:

7/29/2019 Ics Notes by Polarao Sir
http://slidepdf.com/reader/full/ics-notes-by-polarao-sir 106/184
ICS NOTES-48 UNIT-6
R.Pola Rao, Asso.Prof, Dept of ME,GMRIT-Rajam Page 104
1. Typical size - Typically 3mm x 3mm but some times bigger than 2.5mm x 12.5 mm
2. Resistance - 120 Ω to 1000 Ω
3. Maximum excitation voltage -5 V to 10 V,
4. Construction material - Nickel-Copper, Nickel-Chromium or Nickel-Ferrous alloys.
Advantages
1. Accuracy is high.
2. These can be available in different shapes.
3. High sensitivity and high stability.
4. Perfect bonding can be done.
5. Can measure high pressures.
Disadvantage
These are sensitive to change in temperature.
Applications
I. These can be used in the applications of stress analysis
These can be used along with different transducers for different measurement
application
(ii) Unbonded Strain Gauge
The strain gauges which are not directly bonded on the surface of the device which is
subjected to stress or which is under study are known as unbonded strain gauge
Figure: Unbonded Strian Gauge

7/29/2019 Ics Notes by Polarao Sir
http://slidepdf.com/reader/full/ics-notes-by-polarao-sir 107/184
ICS NOTES-48 UNIT-6
R.Pola Rao, Asso.Prof, Dept of ME,GMRIT-Rajam Page 105
The unbonded strain gauge is placed on frames A and B with the help of insulated
pins. These two frames are movable with respect to each other and this arrangement
can be connected in one of the four arms of Wheatstone bridge. When the pressure
measured is applied, the frame, A moves with inspect to frame B. This causes change
in the length and cross section of the strain gauge which in turn oauses its resistance
to change. Due to this Change in resistance the bridge will be unbalanced and
Produces some output voltage which indicates the change in resistance, which in turn
gives the value of applied pressure.
Specifications
1. Typical size = 0.003 mm in dia. and 25 mm in length.
2. Resistance = 12 Ω, 350 Ω to 1000 Ω
3. Maximum excitation voltage = 5 V to 10 V
4. Construction material - Nichrome, Constantan, Nickel, Iso elastic
Advantages:
1. It has greater accuracy
2. This gauge can be used in the range of ± 0.15% strain
Disadvantages
1. It requires more space
Application:
1. It can be used in the measurement of pressure, acceleration and force.
2. It can be used in those systems where gauge can be placed at difference places
and requires measurement of pressure or stresses frequently or more number
of times
REFERENCE BOOKS:
1.A course on mechanical measurements and instrumentation- A.K Sawhney
2.Instrumentation and Control systems- S.Sudhakarreddy&P.Divakararao 3.Instrumentation Measurement & Analysis- B.C Nakra and K.K Choudhry

7/29/2019 Ics Notes by Polarao Sir
http://slidepdf.com/reader/full/ics-notes-by-polarao-sir 108/184
ICS NOTES-49 UNIT-6
R.Pola Rao, Asso.Prof, Dept of ME,GMRIT-Rajam Page 106
(i) Foil Type Strain gauge
Metal Foil Strain gauges:
In this type of strain gauges a metal foil is used to sense the applied strain. The
materials used for its construction are nickel, nichrome, platinum, isoelastic
(nickel+chromium + molybdenum), constantan (nickel+copper). The gauge factor and
characteristics of foil strain, gauges are similar to the wire strain gauges.
Figure: Foil Type Strain Gauges
The metal foil gauges can be easily etched on a flexible insulating carrier film. In the
construction of etched foil strain gauge, first a layer of strain sensitive material is
bonded to a thin sheet of backelite or paper. The part of metal which is to be used as
wire element is covered with some masking material and then to this, unit an etching
solution is applied. Therefore, the unmasked part of the metal will be removed
thereby leaving the required grid structure. By this method of construction, the etched
foil strain gauges are made in thinner sizes.
Different forms of metal foil strain gauges are shown as follows,

7/29/2019 Ics Notes by Polarao Sir
http://slidepdf.com/reader/full/ics-notes-by-polarao-sir 109/184
ICS NOTES-49 UNIT-6
R.Pola Rao, Asso.Prof, Dept of ME,GMRIT-Rajam Page 107
Figure: Different Forms of Metal Foil Strain Gauges
When a force or pressure is applied to the sensing element of metal foil strain gauge
the physical dimensions of it will change. Since, the strain gauge element is pasted on
its surface, the dimensions of the strain gauge changes due to which the resistance of
the gauge changes. The measure of change in resistance will become the measure of
applied pressure. or force (this change in resistance of the gauge can be measured by
connecting the gauge in anyone of the four arms of balanced Wheatstone bridge).
Semicoductor Strain Gauge
A typical semiconductor strain gauge is formed by the semiconductor technology i.e.,
the semiconducting wafers or filaments of length varying from 2 mm to 10 mm andthickness of 0.05 mm are bonded on suitable insulating substrates (for example
teflon). The gold leads are usually employed for making electrical contacts. The
electrodes are formed by vapour deposition. The assembly is placed in a protective
box as shown in the figure below.

7/29/2019 Ics Notes by Polarao Sir
http://slidepdf.com/reader/full/ics-notes-by-polarao-sir 110/184
ICS NOTES-49 UNIT-6
R.Pola Rao, Asso.Prof, Dept of ME,GMRIT-Rajam Page 108
Figure: Semiconductor Strain Gauge
The strain sensitive elements used by the semiconductor strain gauge are the
semiconductor materials such as silicon and germanium.
When the strain is applied to the semiconductor element a large change in resistance
occur which can be measured with the help of a Wheatstone bridge. The strain can be
measured with high degree of accuracy due to relatively high change in resistance.
A temperature compensated semiconductor strain gauge can be used to measure small
strains of the order of 10-6
i.e., micro-strain.
This type of gauge will have a gauge factor of 130 ±10% for a semiconductor material
of dimension 1 x 0.5 x 0.005 inch having the resistance of 350 Ω.
Advantages of Semiconductor Strain Gauge
1. The gauge factor of semiconductor strain gauge is very high, about ± 130.
2. They are useful in measurement of very small strains of the order of 0.01
micro-strain due to their high gauge factor.
3. Semiconductor strain gauge exhibits very low hysteresis i.e., less than 0.05%.
4. The semiconductor strain gauge has much higher output, but it is as stable as a
metallic strain gauge.
5. It possess a high frequency response of 1012
Hz.
6. It has a large fatigue life i.e., 10 x 106operations can be performed.
7. They can be manufactured in very small sizes, their lengths ranging from 0.7
to 7.0 mm.
(iii)Wire Type Strain Gauges
These are available in bonded and unbonded type. In bounded type, the strain gauge is
directly pasted on the surface of the structure under test. To paste the strain gauge on
the structure, adhesives are used which are responsible for transmitting the strain from
the structure to the gauge wires.

7/29/2019 Ics Notes by Polarao Sir
http://slidepdf.com/reader/full/ics-notes-by-polarao-sir 111/184
ICS NOTES-49 UNIT-6
R.Pola Rao, Asso.Prof, Dept of ME,GMRIT-Rajam Page 109
These gauges are basically fabricated in four varieties. Namely
1. Flat grid type.
2. Wrap around type.
3. Single wire gauge.
4. Woven type gauge.
1. Flat Grid Wire Gauge
In flat grid wire gauges the fine wire is arranged in the form of a grid (i.e, wound back
and forth) and then pasted on a backing material (ex: epoxy, paper etc) with the help
of adhesive as shown in figure (1). Transverse strain's cause changes in resistance at
the ends of each section where the wires are looped around. By maintaining the length
of loops at minimum or joining them with some material which is less sensitive to
strain compared to actual material used in the fabrication of gauge, the cross
sensitivity can be reduced.
In order to get maximum transfer of strain from structure under test to gauge, the grid
structure should be placed as cl9se, as possible to the structure under test. This also
helps to maintain the hysteresis and creep at minimum.
Figure: Flat Grid Wire gauge
2. Wrap Around Wire Gauge

7/29/2019 Ics Notes by Polarao Sir
http://slidepdf.com/reader/full/ics-notes-by-polarao-sir 112/184
ICS NOTES-49 UNIT-6
R.Pola Rao, Asso.Prof, Dept of ME,GMRIT-Rajam Page 110
Figure: Wrap Around Wire Gauge
In wrap around wire gauges, the fine wire is wound on a thin strip or a flattened tube
of paper. There can be made smaller in length for same value of resistance compared
to flat grid type.
However in this type the wire grid is in two planes, the gauge has very high surface
thickness. Due to this creep and hysteresis increases.
3. Single wire gauges
This type of wire gauges are mainly designed to avoid cross-sensitivity factor. These
are formed when single wires are stretched across and laid (as illustrated in figure
(6)).
In order to avoid looping of the same material, thick copper wires are attached
(welded) at the ends. Due to this cross-sensitivity reduces to a great extent.
Figure: Single Wire Gauge
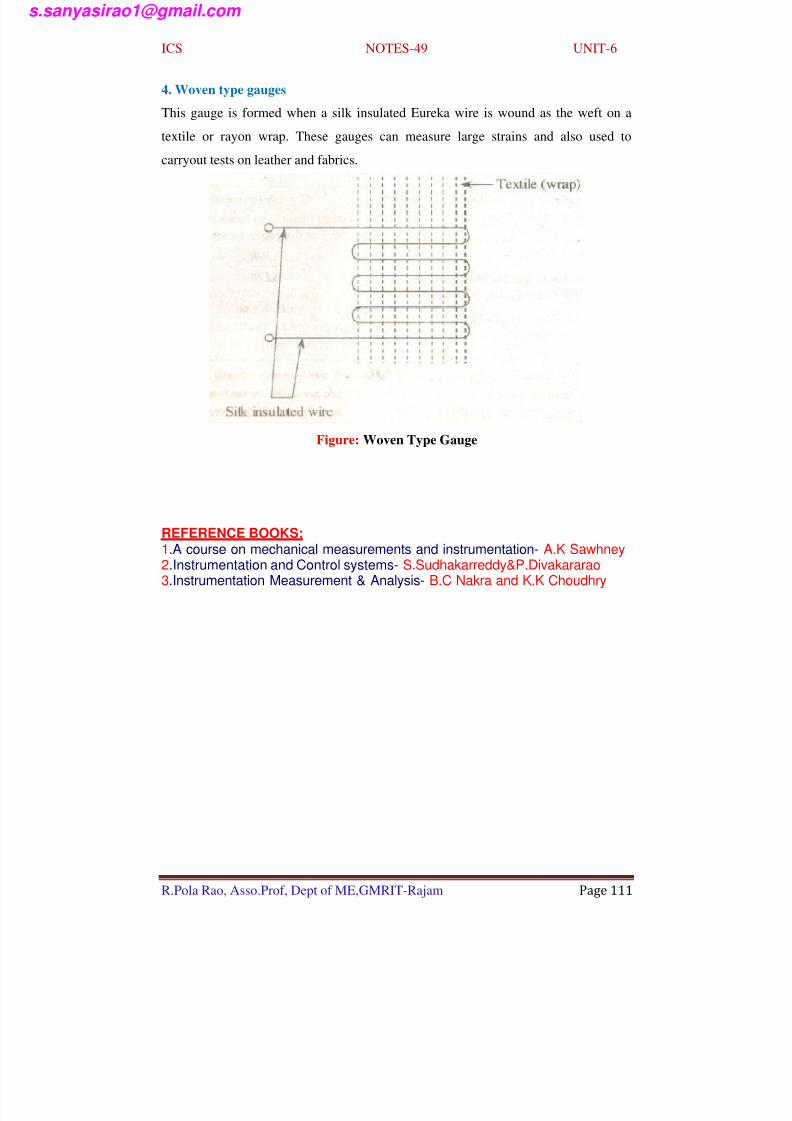
7/29/2019 Ics Notes by Polarao Sir
http://slidepdf.com/reader/full/ics-notes-by-polarao-sir 113/184
ICS NOTES-49 UNIT-6
R.Pola Rao, Asso.Prof, Dept of ME,GMRIT-Rajam Page 111
4. Woven type gauges
This gauge is formed when a silk insulated Eureka wire is wound as the weft on a
textile or rayon wrap. These gauges can measure large strains and also used to
carryout tests on leather and fabrics.
Figure: Woven Type Gauge
REFERENCE BOOKS:
1.A course on mechanical measurements and instrumentation- A.K Sawhney2.Instrumentation and Control systems- S.Sudhakarreddy&P.Divakararao 3.Instrumentation Measurement & Analysis- B.C Nakra and K.K Choudhry

7/29/2019 Ics Notes by Polarao Sir
http://slidepdf.com/reader/full/ics-notes-by-polarao-sir 114/184
ICS NOTES-50 UNIT-6
R.Pola Rao, Asso.Prof, Dept of ME,GMRIT-Rajam Page 112
Principle of resistance strain gauge and equation for the gauge factor:
Strain gauge consists of a fine metallic wire of 0.025 mm diameter and in appropriate
length. The resistance of a single wire is given by.
A
L R
ρ = (1)
p = Resistivity of material of conductor
L=Length of wire
A =Cross-sectional area of wire.
When it is strained within the elastic limit, the resistance of the wire will change due
to,
1. Dimensional changes (L, A).
2. Change in value of resistivity, (This property is called piezo-resistive effect).
Taking logarithm on both sides of equation (1), we get,
log R = log ρ + log L - log A
Differentiating the above equation
A
dA
L
dLd
R
dR−+=
ρ
ρ (2)
4
2 D A
π = ( Is the area of cross section)
dD DdA .24
π =
4
.
2
2 D
dD D
A
dA
π
π =
D
dD
A
dA.2=
When a wire is subjected to longitudinal stress, its length increases (longitudinal
strain) and its diameter decrease (lateral strain).
Poisson's ratio is defined as the ratio of lateral strain to longitudinal strain.
Strain
Strain
al Longitudin
Lateralv
−=
LdL
DdDv
/
/ −=
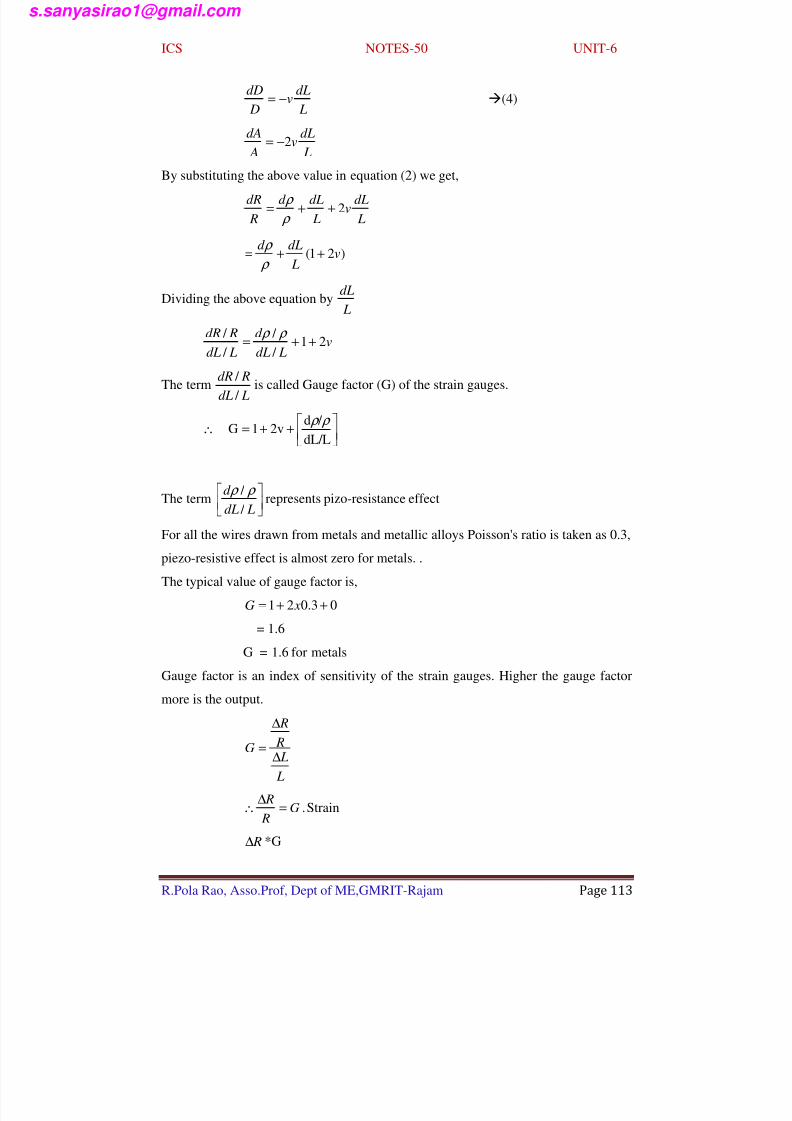
7/29/2019 Ics Notes by Polarao Sir
http://slidepdf.com/reader/full/ics-notes-by-polarao-sir 115/184
ICS NOTES-50 UNIT-6
R.Pola Rao, Asso.Prof, Dept of ME,GMRIT-Rajam Page 113
L
dLv
D
dD−= (4)
L
dLv
A
dA2−=
By substituting the above value in equation (2) we get,
L
dLv
L
dLd
R
dR2++=
ρ
ρ
)21( v L
dLd ++=
ρ
ρ
Dividing the above equation by L
dL
v LdL
d
LdL
RdR21
/
/
/
/ ++=
ρ ρ
The term LdL
RdR
/
/ is called Gauge factor (G) of the strain gauges.
++=∴
dL/L
/ d2v1G
ρ ρ
The term
LdL
d
/
/ ρ ρ represents pizo-resistance effect
For all the wires drawn from metals and metallic alloys Poisson's ratio is taken as 0.3,
piezo-resistive effect is almost zero for metals. .
The typical value of gauge factor is,
03.021 ++= xG
= 1.6
G = 1.6 for metals
Gauge factor is an index of sensitivity of the strain gauges. Higher the gauge factor
more is the output.
L
L R
R
G∆
∆
=
Strain.G R
R=
∆∴
R∆ *G

7/29/2019 Ics Notes by Polarao Sir
http://slidepdf.com/reader/full/ics-notes-by-polarao-sir 116/184
ICS NOTES-50 UNIT-6
R.Pola Rao, Asso.Prof, Dept of ME,GMRIT-Rajam Page 114
A resistance strain gauge with a a gauge factor 2.04 is fastened to a beam which
is subjected to a strain of 1x10⁻⁶
. If the original resistance of the gauge is 120Ω
Calculate the change in resistance.
Given that,
Strain, ε = 1x 10⁻⁶
Gauge factor, Gf = 2.04
Original resistance of gauge, R =120Ω
Therefore change in resistance RG R f ε =∆
12010104.2 6 x x x R −=∆∴
= 0.2448 mΩ
Ω=∆−3
102448.0 x R
A single electrical resistance strain gauge of resistance 120Ω and having a gauge
factor of 2 is bonded to steel having an elastic limit stress of 400 MN/m2
and
modulus of elasticity 200 GN/m2. Calculate the change in resistance due to a
change of temperature of 20°C. Coefficient of linear expansion of steel is 12 x 10-6
/ 0C.
Given that,b = 0.02 m
d = 0.003m
E = 200GN/m2
X = 12.7 x 10⁻³
m
Movement of inertia
3
12
1 xbxd I =
3)003.0(02.0121 x x=
4121045 m x −
=
Deflection,
EI
Fl x
3
3
=

7/29/2019 Ics Notes by Polarao Sir
http://slidepdf.com/reader/full/ics-notes-by-polarao-sir 117/184
ICS NOTES-50 UNIT-6
R.Pola Rao, Asso.Prof, Dept of ME,GMRIT-Rajam Page 115
3
3
l
EIxF =
3
3129
)25.0(
107.124510102003−−
=x x x x x
= 22 N
Bending moment
Nm xF M x 3.315.022 ===
Stress,
2
003.0
1045
3.3
2 12x
x
d
I
M S
−==
= 11o MN/m2
Strain,
9
6
10200
10110
x
x
E
S
L
L==
∆=ε
= 0.55 x 10⁻³
Gauge factor,
231055.0
120152.03==
∆
∆
=− x
x
L
L R
R
G f
Gf = 23
A strain gauge of nominal resistance 200 Ω is fixed on the flat surface of a short
column of 2 cm x 2 cm cross-sectional area. The column is subjected to an axial
force of 100 N. The strain gauge forms one arm of a bridge with other arms all
equal to 200Ω. Find open circuit voltage of the bridge excited by 10 V. Given
Young’s modulus of elasticity is 2.1 x 10¹¹
N/m2.
Given,
Force, F = 100N
Cross-sectional area, A =2 x 2 x 10-4
m2
Normal resistance of gauge, Rg =200Ω
Young's modules, E = 2.1x10¹¹
N/m2
Input Voltage, ei =10 V
Let, the Gauge factor, Gf =2

7/29/2019 Ics Notes by Polarao Sir
http://slidepdf.com/reader/full/ics-notes-by-polarao-sir 118/184
ICS NOTES-50 UNIT-6
R.Pola Rao, Asso.Prof, Dept of ME,GMRIT-Rajam Page 116
Stress, S = F/A=24
4 / 1025
104
100m N x
x=
−
Strain, 6
11
4
1019.1101.2
1025 −=== x
x
x
E
S ε
Change in resistance,
g f g RG R ..ε =∆
= 2 x 1.19x10-6
x 200
Ω=∆−41076.4 x Rg
The output voltage, Oe∆ is given by,
102004
1076.4
.4
4
x x
x xe R
Re i
g
g
O
−
=∆
=∆
V xeO6
1095.5−
=∆ .
Two electrical strain gauges are bonded to a duralumin cantilever and connected
in a bridge as adjacent arms. Each gauge has a resistance of 100Ω and a gauge
factor of 2.1. The input voltage is 4V. The stress is 200 MN/m2. Find the current
through the detector if its resistance is 400Ω. Modulus of elasticity of duralumin
is 70 GN/m2.
FigureGiven that,
Each gauge has a resistance of, R =100Ω
The gauge factor, Gf =2.1
The input voltage, V = 4 V
The stress, ε =200 x 106

7/29/2019 Ics Notes by Polarao Sir
http://slidepdf.com/reader/full/ics-notes-by-polarao-sir 119/184
ICS NOTES-50 UNIT-6
R.Pola Rao, Asso.Prof, Dept of ME,GMRIT-Rajam Page 117
The meter is connected at the output terminals of the bridge and has a resistance R m =
400Ω
The output voltage o
m
oxe
R
RV
+
=
1
1
Where, eo = open circuit voltage across the bridge for two active strain gauges
i
f
O e E
Ge .
2
.ε =
E = Modulus of elasticity
V x x x
x xeO 012.04
10702
102001.29
6
==
Output Voltage,
012.0
400
1001
1 xV O+
=
012.025.1
1 xV O =
012.08.0 x=
mV V O
6.9=
Thus, the meter current,
m
Om R
V I =
400
106.93−
=x
I m
63 102410024.0 −−== x x
A I m
µ 24=
REFERENCE BOOKS:
1.A course on mechanical measurements and instrumentation- A.K Sawhney2.Instrumentation and Control systems- S.Sudhakarreddy&P.Divakararao 3.Instrumentation Measurement & Analysis- B.C Nakra and K.K Choudhry

7/29/2019 Ics Notes by Polarao Sir
http://slidepdf.com/reader/full/ics-notes-by-polarao-sir 120/184
ICS NOTES-51 UNIT-6
R.Pola Rao, Asso.Prof, Dept of ME,GMRIT-Rajam Page 118
Calibration of resistive strain gauges:
The main objective of strain gauge calibration is to establish a relation between
measured strain and display system in which scale is divided into arbitrary units.
However, the process of strain gauge calibration requires some necessary adjustments
in order to get accurate scale reading.
This technique involves a known value of change to introduce in the resistance of
anyone arm of four arms bridge in order to simulate a certain value of strain. The
change made in the resistance to carry out this is calculated provided the values of
unstrained resistance of the strain gauge and its Gf (Gauge factor) are known.
Figure: Strain Gauge Calibration
In practical process of strain gauge calibration a known value of change is introduced
in the resistance of gauge by connecting a high value of resistor (R sh) in parallel to it
and measuring the resultant output due to this change. The RSh is used when the strain
gauge resistance is being Rg
When switch (S) is open the resistance of arm ‘a’ = Rg
When switch is closed the resistance of arm,
shg
shg
R R
R R
a +=
Therefore, the resulting variation in resistance of arm “a” due to shunt resistance (Rsh)
is given by,

7/29/2019 Ics Notes by Polarao Sir
http://slidepdf.com/reader/full/ics-notes-by-polarao-sir 121/184
ICS NOTES-51 UNIT-6
R.Pola Rao, Asso.Prof, Dept of ME,GMRIT-Rajam Page 119
)(shg
shg
gg R R
R R R R
+−=∆
shg
g
g R R
R R
+=∆
2
(1)
And an equivalent strain is given by,
g
g
f
e R
R
G
∆=∈ .
1
)(
112
shg
g
g f R R
R x
R x
G +=
)( shg f
g
R RG
R
+= (2)
And shunt resistance,e f
e f g
shG
G R R
∈
∈−=
)1( (3)
In practical e f G ∈ is very small (nearly )1<<∈e f
G therefore it can be neglected
e f
g
shG
R R
∈≅∴ (4)
The value of e∈ can be calculated from equation (3) or (4). If the relation between
strain and readout is linear a single value of shunt resistance, (Rsh) is required for
calibration. Hence the R h value should be selected so that the indicator provides
maximum scale deflection or full scale deflection.
This procedure of calibration is also used if the bridge contains more than one active
gauge.
Let n =Number of active gauges in a bridge.
Then for a gives Rsh the represented strain is approximatelyn
1of the strain given in
equation (2)
Therefore the effective strain in this case is given by
)(shg f
g
e R RnG
R
+=∈

7/29/2019 Ics Notes by Polarao Sir
http://slidepdf.com/reader/full/ics-notes-by-polarao-sir 122/184
ICS NOTES-52 UNIT-6
R.Pola Rao, Asso.Prof, Dept of ME,GMRIT-Rajam Page 120
Properties of materials used for strain gauges:
The materials used for strain gauges should contain below given properties in order to
obtain very high reproducibility, long, good, accuracy, good sensitivity etc.
• High gauge factor
• High specific resistance
• Constant strain sensitivity over several ranges of values of strain
• Low temperature coefficient of resistance
• High yield point
• Good corrosion resistance.
Some of the materials which are popularly used in the fabrication of strain gauges and
their properties are,
1. Nichrome
(i) It is composed with 80% of nickel and 20% of chromium.
(ii) Gauge factor: 2.5
(iii)Resistivity: 100 x 10-8
0Ωm
(iv) Resistance temperature coefficient : 0.1 x 10⁻³ /
0C
(v) Upper temperature value: 12000C
2. Isoelastic
(i) It is composed with, 36% of nickel, 8% of chromium, 0.5% of
molybdemum etc
(ii) Gauge factor: 3.6
(iii) Resistivity: 105 x 10-8Ωm
(iv) Resistance temperature coefficient: 0.175 x 10⁻³ /
0C
(v) Upper temperature value: 12000C.
3. Constantan
(i) It is composed with 45% of nickel and 55% of copper
(ii) Gauge factor: 2.1
(iii) Resistivity: 48 x 10-8
Ωm.
(iv) Resistance temperature coefficient:± 0.02 x10⁻³ /
0C
(v) Upper temperature value: 40000C
4. Nickel
(i) Gauge factor: - 12

7/29/2019 Ics Notes by Polarao Sir
http://slidepdf.com/reader/full/ics-notes-by-polarao-sir 123/184
ICS NOTES-52 UNIT-6
R.Pola Rao, Asso.Prof, Dept of ME,GMRIT-Rajam Page 121
(ii) Resistivity: 6.5 x 10⁻⁸Ωm
(iii) Resistance temperature coefficient: 6.8 x 10⁻³ /
0C.
5. Platinum
(i) Gauge factor: 4.8
(ii) Resistivity: 10x 10-8Ωm
(iii) Resistance temperature coefficient: 4.0 x 10⁻³ /
OC.
Desirable characteristics of bonding material:
The material is used to bond (paste) the strain gauge on to the surface of the device
which, is subjected to stress or which is under study is known as bonding material.
The bonding materials are also known as adhesives, cements. Thermoplastic cement,
thermosetting cement, special ceramic cement, silicon varnish, nitro cellulose are
some of the examples of bonding materials.
The bonding material transmits the strain from the device under test to the gauge
(sensing element). Therefore the selection of bonding material is very important.
The desirable characteristics of bonding material are,
(i) The bonding material must have high insulation resistance, high creep
resistance.
(ii) It should possess good shear strength to transmit the strain from the device
under test to gauge (sensing element).
(iii) It should have insulator properties with high elasticity.
(iv) It should be able to dry up in a small period of time.
(v) It should be insensitive to environmental conditions such as temperature,
humidity, moisture etc.
(vi) It should be able to provide linear change in resistance per unit strain.
(vii) It should be able to spread easily and provide good bonding adhesion.
REFERENCE BOOKS:
1.A course on mechanical measurements and instrumentation- A.K Sawhney
2.Instrumentation and Control systems- S.Sudhakarreddy&P.Divakararao 3.Instrumentation Measurement & Analysis- B.C Nakra and K.K Choudhry

7/29/2019 Ics Notes by Polarao Sir
http://slidepdf.com/reader/full/ics-notes-by-polarao-sir 124/184
ICS NOTES-53 UNIT-6
R.Pola Rao, Asso.Prof, Dept of ME,GMRIT-Rajam Page 121
.
Single strain gauge element - active and inactive direction.
A single length of wire can be used as the sensing element in a strain gauge. However,
the circuits which are used for measuring the changes in resistance impose certain
restrictions on the minimum resistance that a strain gauge should possess. This value
depends on the gauge current and gauge length for given value of gauge factor, higher
resistance gauges offer high resistance changes and draw lower current and hence,
less heat dissipation problems. An element with grid structure is generally used for
increasing the resistance of the gauge.
Figure
Gauge sensitivity -strain gauge:
If a wire or conductor is stretched or compressed, the resistance of the conductor
changes because of dimensional changes of length and cross-sectional area. Therefore
the gauge sensitivity is described in terms of characteristic called the gauge factor
which is defined as the unit change in resistance per unit change in length.
Figure: Strain Gauge on a cantilever to measure Strain

7/29/2019 Ics Notes by Polarao Sir
http://slidepdf.com/reader/full/ics-notes-by-polarao-sir 125/184
ICS NOTES-53 UNIT-6
R.Pola Rao, Asso.Prof, Dept of ME,GMRIT-Rajam Page 122
Two arm and four arm conditions used for strain measurement:
Measurement of Strain Using Two Strain Gauges
Consider two strain gauges placed on a cantilever beam (as shown in figure (1)) for
the measurement of strain.
Figure: Two Strain Gauges on a Cantilever to Measure StrainIn the above figure, when strain is applied the strain gauge mounted on the side i.e.,
Rga experiences positive strain or tension where as the strain gauge mounted on the
bottom side i.e., Rgc experiences negative strain or compression. When these two
active gauges are connected in two separate arms of the Wheatstone bridge the
resulting bridge is known as ‘half bridge’ and is shown below figure (2).
Figure: Half Bridge for Measurement of Strain
The effects of temperature can be eliminated by having Rb = Rd and connecting two
identical strain gauges
Let,
R R R R Rd gcbga−−−=
When strain is not applied the potential of both points
N and P are same i.e.,2
ie
. Therefore the output of the bridge will be zero. i.e., e0 = 0

7/29/2019 Ics Notes by Polarao Sir
http://slidepdf.com/reader/full/ics-notes-by-polarao-sir 126/184
ICS NOTES-53 UNIT-6
R.Pola Rao, Asso.Prof, Dept of ME,GMRIT-Rajam Page 123
When strain is applied to the cantilever the resistance of gauge placed on top of the
cantilever increase while that of the resistance of gauge placed on bottom side
decreases.
When strain is applied the resistance of Rga is given by,
∆+=
R
R R Rga
1
When strain is applied the resistance Rga is given by,
∆−=
R
R R R
gc 1
Since, Rb =Rd =R
The potential of point, P =2
ie
The potential of point,
∆−+
∆+
∆+
=
R
R R
R
R R
R
R R
e N i
11
1
2
1 R
R
ei
∆+
=
Due to the applied strain the resulting change in output is given by,
222
1 R
R
ee R
R
ee i
i
io
∆
=−
∆+
=∆
2
∈=∆∴
f
io
Gee
In this way, the output of half bridge is two times that of the output of quarter bridge.
Due to this the sensitivity is doubled and effects of temperature are also eliminated.
The gauge sensitivity of a half bridge will become,
f gg GkRS 2=

7/29/2019 Ics Notes by Polarao Sir
http://slidepdf.com/reader/full/ics-notes-by-polarao-sir 127/184
ICS NOTES-53 UNIT-6
R.Pola Rao, Asso.Prof, Dept of ME,GMRIT-Rajam Page 124
Figure(1): Strain Gauges on a Cantilever
Four strain gauges are mounted on a cantilever beam (as shown above) to measure
strain. Assume that all the four strain gauges are of similar type. When strain is not
applied the resistance of all the gauges is same i.e,
Rga = Rgb =Rgc=Rgd =R
When these active gauges are connected in a Wheatstone bridge, each gauge in, each
arm then the resulting bridge is known as full bridge and is shown below.
Rga = Rgb =Rgc=Rgd =R
Figure(2): Full bridge for Measurement of Strain
When strain is not applied the potential of both points N and P are same i.e,2
ie
.
Therefore the output of the bridge will be zero i.e, e0 =0. When strain is applied the
resistance values of strain gauges will change. Thus,
The resistance of Rga and Rgd =
∆+
R
R R 1
The resistance of Rgb and Rgc =
∆−
R
R R 1

7/29/2019 Ics Notes by Polarao Sir
http://slidepdf.com/reader/full/ics-notes-by-polarao-sir 128/184
ICS NOTES-53 UNIT-6
R.Pola Rao, Asso.Prof, Dept of ME,GMRIT-Rajam Page 125
When strain is applied the potential of point
∆−+
∆+
∆+
=
R
R R
R
R R
R
R R
e N i
11
1
2
1 R
R
ei
∆+
=
And
Potential of point, (when strained )
∆++
∆−
∆−
=
R
R R
R
R R
R
R R
ePi
11
1
2
1 R
R
ei
∆−=
=
Due to the applied strain the resulting change in output is given by
2
1
2
1 R
R
e R
R
ee iio
∆−
−
∆+
=∆
ei f o G
R
Re ε =
∆=∆
Four active arm bridges are required if the gauges are employed as secondary
transducers to provide highest sensitivity. Therefore the gauge sensitivity of a full
bridge will become,
f ggGkRS 4=
.
Types of strain gauge arrangement for measuring strain:
Strain gauge can be used in different possible arrangements for measuring strain.
They are,
(i) In this first arrangement a single strain gauge SG1 is fixed on the elastic member
(which is under test). Here die strain gauge measures the axial strain in the elastic
element. When the strain is applied e resistance of the gauge changes and it can be
measured with the help of Wheatstone bridge (i.e, by connecting the gauge in any one

7/29/2019 Ics Notes by Polarao Sir
http://slidepdf.com/reader/full/ics-notes-by-polarao-sir 129/184
ICS NOTES-53 UNIT-6
R.Pola Rao, Asso.Prof, Dept of ME,GMRIT-Rajam Page 126
of the four arms of the bridge). This arrangement is not compensated for changes in
temperature.
Figure(1): Measurement of Strain Using Single Strain gauge Arrangement
(ii) In the other method two active strain gauges SG1, SG2 are used to measure strain
as shown in figure (2). In this arrangement SG1 and SG2 are placed at right angles to
each other. This arrangement is also known as Poisson’s arrangement. When strain is
applied, the SG1 experiences axial tensile strain and SG2 experiences transverse
compressive strain. The compressive strait is v times the tensile strain. Since the two
gauges experiences strains of opposite nature the signal enhancement factor will be
(1 + v).
Where,
v is Poisson's ratio.

7/29/2019 Ics Notes by Polarao Sir
http://slidepdf.com/reader/full/ics-notes-by-polarao-sir 130/184
ICS NOTES-53 UNIT-6
R.Pola Rao, Asso.Prof, Dept of ME,GMRIT-Rajam Page 127
Figure (2): Strain Gauge on a Cantilever to Measure Strain
This arrangement is compensated for temperature. As the variations in temperature
identically gauges, the set output will be zero affects the two gauge, the set output will
be zero
(iii) In another arrangement, two strain gauges are placed such that both will
experience equal amount of axial tensile strains. To measure resistance changes in the
gauges due to axial tensile strains, the gauges are connected in any two opposite arms
of the bridge as illustrated below.
Figure (3): Arrangement of Two Strain Gauges in strain Measurement

7/29/2019 Ics Notes by Polarao Sir
http://slidepdf.com/reader/full/ics-notes-by-polarao-sir 131/184
ICS NOTES-53 UNIT-6
R.Pola Rao, Asso.Prof, Dept of ME,GMRIT-Rajam Page 128
This arrangement requires two dummy strain gauges to compensate changes in
temperature.
(iv) Strain can also be measured by employing four active strain gauges. In this
arrangement gauges SG2 and SG4 are placed at right angles to gauges SG1, and SG3.
This arrangement compensates the changes in temperature and its signal
enchancement factor is 2( 1 + v)
Figure (4): Measurement of Strain using four Strains gauges
Measurement of torque with strain gauge:
Strain gauge torque transducers are frequently used for the measurement of torque.
The figure shows the strain gauge torsion meter. This arrangement uses four strain
gauges each mounted at 90° to each other. The most widely used strain gauges in this
technique is bonded-wire type. These strain gauges are diametrically opposite<to each
other. These strain gauges are arranged in a Wheatstone bridge circuit.

7/29/2019 Ics Notes by Polarao Sir
http://slidepdf.com/reader/full/ics-notes-by-polarao-sir 132/184
ICS NOTES-53 UNIT-6
R.Pola Rao, Asso.Prof, Dept of ME,GMRIT-Rajam Page 129
Figure
In this type of meter if characteristics of all the four strain gauges are matched then
the meter is insensitive to bending and pull effects. The Galvanometer is shown in thefigure is used to indicate the torsion deflection if any changes occur in the strain
gauge circuit. Strain gauges R1 and R4 are subjected to tensile stress and strain gauges
R2 and R3 are subjected to compressive stress, when the shaft is under torsion.
Therefore the torque of the rotating shaft is obtained with the help of compressive and
tensile stresses. The torque of the, strain gauge torque transducer is given by,
( )Nm
2
0 φ π
l
R RGT i
−=
Where,
T = Torque in Nm
G = Modulus of rigidity
Ro = Outer radius of the shaft
Ri = Inner radius of the shaft

7/29/2019 Ics Notes by Polarao Sir
http://slidepdf.com/reader/full/ics-notes-by-polarao-sir 133/184
ICS NOTES-53 UNIT-6
R.Pola Rao, Asso.Prof, Dept of ME,GMRIT-Rajam Page 130
φ = Angular deflection of the shaft
l = Length of the shaft
The angle made by the gauges with shaft is 450. Therefore the shaft given by,
( )44
0
45
i
o
R RG
TR
−
±=∈
π
Advantages:
1. This system is temperature compensated.
2. Automatic compensation is offered by this meter for bending and pull effects.
3. Maximum sensitivity is provided by this system for a particular torque.
Slip rings and speed sensors attached to the strain gauge torque transducers, are
known as commercial type, and are used for the measurement of torque in the range
of 0.6 to 104
mkgf.
A mild steel shaft is used to connect a motor drive to a constant load torque. A
foil strain gauge having, a resistance of 120 ΩΩΩΩ and a gauge factor 2 is mounted on
a shaft with its active axis at an angle of 45 degrees to the axis of the shaft. The
shear modulus of steel is 80 GN/m2. The shaft radius is 15 mm and the change in
strain gauge resistance due to the load is 0.24ΩΩΩΩ. Find the load torque.
Answer:
Given that,
∆R = 0.24Ω
R = 120 Ω
G = 80 x 109
N/m2
Gf = 2
Figure
Angular of shear,3
2
Gr
T
π θ =
An area of the shaft surface, originally square with the sides of unit length, is
deformed by strain to a parallelogram. The original length of diagonal is 2 .

7/29/2019 Ics Notes by Polarao Sir
http://slidepdf.com/reader/full/ics-notes-by-polarao-sir 134/184
ICS NOTES-53 UNIT-6
R.Pola Rao, Asso.Prof, Dept of ME,GMRIT-Rajam Page 131
If the angle of shear, θ is small then the length of diagonal of parallelogram is longer
and the diagonal of the square.
Difference in length =2
θ
22
2 θ θ
ε ==∆
= L
L
θ θ
ε ===∆
22 xG
R
R f
R
R∆=θ
120
24.0=
rad102 3−= x
Torque
2
3θ π Gr T =
( )2
10210151080 339 −−
=x x x x xπ
= 848 NM
REFERENCE BOOKS:
1.A course on mechanical measurements and instrumentation- A.K Sawhney2.Instrumentation and Control systems- S.Sudhakarreddy&P.Divakararao 3.Instrumentation Measurement & Analysis- B.C Nakra and K.K Choudhry

7/29/2019 Ics Notes by Polarao Sir
http://slidepdf.com/reader/full/ics-notes-by-polarao-sir 135/184
ICS NOTES-54 UNIT-6
R.Pola Rao, Asso.Prof, Dept of ME,GMRIT-Rajam Page 132
Measurement of torque with strain gauge:
Strain gauge torque transducers are frequently used for the measurement of torque.
The figure shows the strain gauge torsion meter. This arrangement uses four strain
gauges each mounted at 90° to each other. The most widely used strain gauges in this
technique is bonded-wire type. These strain gauges are diametrically opposite<to each
other. These strain gauges are arranged in a Wheatstone bridge circuit.
Figure
In this type of meter if characteristics of all the four strain gauges are matched then
the meter is insensitive to bending and pull effects. The Galvanometer is shown in the
figure is used to indicate the torsion deflection if any changes occur in the strain
gauge circuit. Strain gauges R1 and R4 are subjected to tensile stress and strain gauges
R2 and R3 are subjected to compressive stress, when the shaft is under torsion.
Therefore the torque of the rotating shaft is obtained with the help of compressive and
tensile stresses. The torque of the, strain gauge torque transducer is given by,

7/29/2019 Ics Notes by Polarao Sir
http://slidepdf.com/reader/full/ics-notes-by-polarao-sir 136/184
ICS NOTES-54 UNIT-6
R.Pola Rao, Asso.Prof, Dept of ME,GMRIT-Rajam Page 133
( )Nm
2
0 φ π
l
R RGT i
−=
Where,
T = Torque in Nm
G = Modulus of rigidityRo = Outer radius of the shaft
Ri = Inner radius of the shaft
φ = Angular deflection of the shaft
l = Length of the shaft
The angle made by the gauges with shaft is 450. Therefore the shaft given by,
( )44
0
45
i
o
R RG
TR
−±=∈π
Advantages:
1. This system is temperature compensated.
2. Automatic compensation is offered by this meter for bending and pull effects.
3. Maximum sensitivity is provided by this system for a particular torque.
Slip rings and speed sensors attached to the strain gauge torque transducers, are
known as commercial type, and are used for the measurement of torque in the range
of 0.6 to 104
mkgf.
A mild steel shaft is used to connect a motor drive to a constant load torque. A
foil strain gauge having, a resistance of 120 ΩΩΩΩ and a gauge factor 2 is mounted on
a shaft with its active axis at an angle of 45 degrees to the axis of the shaft. The
shear modulus of steel is 80 GN/m2. The shaft radius is 15 mm and the change in
strain gauge resistance due to the load is 0.24ΩΩΩΩ. Find the load torque.
Given that,
∆R = 0.24Ω
R = 120 Ω
G = 80 x 109
N/m2
Gf = 2

7/29/2019 Ics Notes by Polarao Sir
http://slidepdf.com/reader/full/ics-notes-by-polarao-sir 137/184
ICS NOTES-54 UNIT-6
R.Pola Rao, Asso.Prof, Dept of ME,GMRIT-Rajam Page 134
Figure
Angular of shear,3
2
Gr
T
π θ =
An area of the shaft surface, originally square with the sides of unit length, is
deformed by strain to a parallelogram. The original length of diagonal is 2 .
If the angle of shear, θ is small then the length of diagonal of parallelogram is longer
and the diagonal of the square.
Difference in length =2
θ
22
2 θ
θ
ε ==∆
= L
L
θ θ
ε ===∆
22 xG
R
R f
R
R∆=θ
120
24.0=
rad1023−= x
Torque
2
3θ π Gr T =
( )2
10210151080 339 −−
=x x x x xπ
= 848 NM
REFERENCE BOOKS: 1.A course on mechanical measurements and instrumentation- A.K Sawhney2.Instrumentation and Control systems- S.Sudhakarreddy&P.Divakararao 3.Instrumentation Measurement & Analysis- B.C Nakra and K.K Choudhry

7/29/2019 Ics Notes by Polarao Sir
http://slidepdf.com/reader/full/ics-notes-by-polarao-sir 138/184
ICS NOTES-55 UNIT-6
R.Pola Rao, Asso.Prof, Dept of ME,GMRIT-Rajam Page 135
Strain gauge rosette and different types:
Many transducer applications and stress analysis techniques use a combination of
strain gauge. This combination of two or more strain gauge elements is known as
rosette. With conventional strain gauges, it is not possible to indicate the direction of
the applied stress.
Therefore, it is required to develop strain gauge measurement system which can
determine strain and stress without knowing the direction of stress and strain. This
problem can be avoided by employing three strain gauges as a unit known as rosette.
The different forms of rosettes are illustrated below.
Figure (1): 3-element Rosette, 600 Planer (Foil Type)
Figure (2): 3-element Rosette, 450
Stacked (Wire Type)

7/29/2019 Ics Notes by Polarao Sir
http://slidepdf.com/reader/full/ics-notes-by-polarao-sir 139/184
ICS NOTES-55 UNIT-6
R.Pola Rao, Asso.Prof, Dept of ME,GMRIT-Rajam Page 136
Figure (3): 2-element Rosette, 900
Stacked (Foil Type)
Figure (4): 2-element Rosette, 900
Planer (Foil Type)
Figure (5): 3-element Rosette, 450
Planer (Foil Type)

7/29/2019 Ics Notes by Polarao Sir
http://slidepdf.com/reader/full/ics-notes-by-polarao-sir 140/184
ICS NOTES-55 UNIT-6
R.Pola Rao, Asso.Prof, Dept of ME,GMRIT-Rajam Page 137
Figure (6): 2-element Rosette, 900
Shear Planer Foil
If the measurement system contains 3-gauge rosette, then it is possible to calculate all
the required data, as this measurement is aim to give stress at a point, ideally the 3
gauges have to be superimposed on that point. This type of construction is known as
stacked rosette. This construction is feasible, but is places the top gauge at some
distance from the surface of the specimen. This increases its self heating, because it is
insulated from the underlying specimen. This underlying metal specimen serves like a
heat sink. If these limitations are greater, then planar rosettes are used.
(a) Rectangular Strain Gauge Rosette

7/29/2019 Ics Notes by Polarao Sir
http://slidepdf.com/reader/full/ics-notes-by-polarao-sir 141/184
ICS NOTES-55 UNIT-6
R.Pola Rao, Asso.Prof, Dept of ME,GMRIT-Rajam Page 138
Figure (1): Three Element Rectangular Rosette
In three element rectangular rosettes the strain gauges are positioned at 00, 450 and
900
as illustrated in figure (1).
Let,
Strain measured by strain gauge 1 = ε S1
Strain measured by strain gauge 2 = ε S2
Strain measured by strain gauge 3= ε S3
The principle strains are,
( )Q
vvS S mS S m .
)1(2)1(2, 21
minmax+
∈±
−
∈+∈∈=
Where,
( ) ( )[ ] 2 / 12
32
2
21 S S S S Q ∈+∈+∈+∈=
Maximum shear stress is given by,
xQv E T m
)1(2max
+=
Orientation angle φ of principle stress is given by,
0
21
312 9002
2tan +<∈−∈
∈−∈−∈= φ φ
S S
S S S Where ( )3122
1S S S ∈+∈>∈
(b) Delta Strain Gauge Rosette

7/29/2019 Ics Notes by Polarao Sir
http://slidepdf.com/reader/full/ics-notes-by-polarao-sir 142/184
ICS NOTES-55 UNIT-6
R.Pola Rao, Asso.Prof, Dept of ME,GMRIT-Rajam Page 139
Figure (2): Three Element Delter Rosette
In three element delta rosette the strain gauges are positioned as shown in figure (2)
Let the strains measured by strain gauge 1,2,3 are εS1, εS2 and εS3 respectively.
The principle strains are,
( ) ( ) ( ) ( )[ ][ ]2 / 12
13
2
32
2
21321minmax 2223
1, S S S S S S S S S ss ∈−∈+∈+∈+∈−∈±∈+∈+∈=∈∈
( )[ ] PS S S ss ±∈+∈+∈=∈∈ 321minmax3
1,
Where,
( ) ( ) ( )[ ] 2 / 12
13
2
33
2
21 222 S S S S S S E E E E E E P −+−+−=
The principal stresses are
++
−
++= xP
vv
E E E E S S S S S m
1
1
13. 321
minmax
Maximum shear stress is given by,
pv
T m .)1(3
max+
∈
Orientation angle φ of principal stress is given by,
( )[ ] 0
321
2 / 1
23 9002
3tan +<
∈−∈−∈
∈−∈= φ φ
S S S
S S when 23 S S >∈∈

7/29/2019 Ics Notes by Polarao Sir
http://slidepdf.com/reader/full/ics-notes-by-polarao-sir 143/184
ICS NOTES-56 UNIT-7
R.Pola Rao,Asso.Prof,Dept of ME Page 140
Humidity: The quantity of water vapour contained in the atmosphere
Moisture : The quantity of water absorbed or adsorbed by a solid or Liquid.
Absolute humidity : The mass of water vapour present in a unit volume of gas or air.
Relative humidity: Ratio of amount of water vapour pressure actually present in a given volume
of gas to the amount of water vapour pressure required for saturation.
The relative humidity of saturated air is equal to 100%.
Dew point temperature: When the temperature of air is reduced by continuous Cooling at
constant pressure, the water vapour in the air starts condensing at a Particular temperature ,which
is referred as the Dew point temperature.
Dry bulb temperature: The sensing bulb of it is in direct contact with air and measures the
temperature which is known as dry bulb temperature.
Wet bulb temperature: The sensing bulb of it is covered with wet wick or moistened with pure
water and this covering is brought in contact with air. The temperature, measured by this
thermometer is known as wet bulb temperature.
Importance of Humidity Control:
Continuous monitoring and controlling of humidity is very essential in many process industries
such as paper industries, pharmaceutical industries, chemical industries, food industries, garment
industries, leather industries etc. This is because the presence or variation of humidity the effects
the behavior, properties and composition, quality of many substances.
To prevent the food products to become dry, spoilage of dried milk, eggs and for
successful storage of fruits, meat etc,.
To reduce the affects of surface leakage in electrical installations.
To maintain proper environmental conditions for human comforts.
For proper drying of wood, color printing. ,
Textile and paper industries require high humidity conditions. Any variations in humidity
may cause the nature, behaviour, characteristics of paper pulp and synthetic fibres to
change.
In pharmaceutical industries, the humidity should be carefully controlled to avoid
growing of any bacteria in the process of making pharmaceuticals
Classification of Humidity Measuring Instruments

7/29/2019 Ics Notes by Polarao Sir
http://slidepdf.com/reader/full/ics-notes-by-polarao-sir 144/184
ICS NOTES-56 UNIT-7
R.Pola Rao,Asso.Prof,Dept of ME Page 141
1.Sling Psychrometer
2.Arption hygrometers
(a) Mechanical humidity sensing absorption hygrometer.
(b) Electrical humidity sensing absorption hygrometer.
3.Dew point meter.
REFERENCE BOOKS:
1.A course on mechanical measurements and instrumentation- A.K Sawhney
2.Instrumentation and Control systems- S.Sudhakarreddy&P.Divakararao
3.Instrumentation Measurement & Analysis- B.C Nakra and K.K Choudhry

7/29/2019 Ics Notes by Polarao Sir
http://slidepdf.com/reader/full/ics-notes-by-polarao-sir 145/184
ICS NOTES-57 UNIT-7
R.Pola Rao,Asso.Prof,Dept of ME Page 143
Classification of Humidity Measuring Instruments
1.Sling Psychrometer
2.Arption hygrometers
(a) Mechanical humidity sensing absorption hygrometer.
(b) Electrical humidity sensing absorption hygrometer.
3.Dew point meter.
1.Sling Psychrometer :
It measures both dry and wet bulb temperatures.
These measured temperatures give the measure of humidity present in air .
This instrument uses two thermometers, one is dry bulb thermometer and
the other is wet bulb thermometer
The dry bulb thermometer is so called because the sensing bulb of it is in direct contact
with air and measures the temperature which is known as dry bulb temperature.

7/29/2019 Ics Notes by Polarao Sir
http://slidepdf.com/reader/full/ics-notes-by-polarao-sir 146/184
ICS NOTES-57 UNIT-7
R.Pola Rao,Asso.Prof,Dept of ME Page 144
The wet bulb thermometer is so called because the sensing bulb of it is covered with
woven cotton wick or moistened with pure water and this
covering is brought in contact with air.
The temperature, measured by this thermometer is known as wet bulb temperature.
These two thermometers are held in a frame which is covered by glass casing. and a
swivel handle is attached to this glass casing
Operation:
Arrangement is to be rotated at 5 m/s to 10 m/s in order to obtain necessary air motion.
When the psychrometer rotates, the thermometer whose sensing bulb is in direct contact
with air measures and indicates dry bulb temperature
When the air passes on the wick present on the bulb of the thermometer ,the moisturepresent in the wick starts evaporating and a cooling effect is produced at the bulb.
Wet bulb temperature is always less than dry bulb temperature.
The psychrometer frame–glass covering-thermometer should be rotated between the
specified period of time.
If it is rotated fro longer period of time, the wet wick will dry very fast, therefore wet
bulb temperature will not be at its minimum value.
If it is rotated for short period of time, proper wet bulb temperature cannot be measured.

7/29/2019 Ics Notes by Polarao Sir
http://slidepdf.com/reader/full/ics-notes-by-polarao-sir 147/184
ICS NOTES-57 UNIT-7
R.Pola Rao,Asso.Prof,Dept of ME Page 145
REFERENCE BOOKS:
1.A course on mechanical measurements and instrumentation- A.K Sawhney
2.Instrumentation and Control systems- S.Sudhakarreddy&P.Divakararao
3.Instrumentation Measurement & Analysis- B.C Nakra and K.K Choudhry

7/29/2019 Ics Notes by Polarao Sir
http://slidepdf.com/reader/full/ics-notes-by-polarao-sir 148/184
ICS
R.Pola Rao,Asso.Prof,Dept of M
Absorption Hygromete
(a) Mechanical humidity
(b) Electrical humidity se
(a). Mechanical Humidi
Operating principle -inv
materials like wood, pa
moisture from atmospher
This variation in linearatmosphere
An animal hair is used as
The hair is separated fro
This hair arrangement is
other end is attached to a
The link carries a pointer
When the hygrometer is
surrounding air.
Due to this the length of
This increase or decrease
to the pointer.
NOTES-58 UNI
E
sensing absorption hygrometer.
nsing absorption hygrometer.
ty Sensing Absorption Hygrometer
olves the change of linear dimensions of s
per, human hair, animal membrane, etc., w
e.
dimensions is used to measure the humidit
humidity sensor.
one another and arranged parallely.
attached to an arm which is pivoted at one e
mechanical link.
which moves over a scale calibrated in terms o
placed in the atmosphere the hair absorbs the
hair increase or decreases (in a linear direction)
of hair arrangement is transmitted to the arm a
-7
Page 144
me hydroscopic
hen they absorb
y present in the
nd, where as the
humidity.
umidity from its
.
d link and hence

7/29/2019 Ics Notes by Polarao Sir
http://slidepdf.com/reader/full/ics-notes-by-polarao-sir 149/184
ICS NOTES-58 UNIT-7
R.Pola Rao,Asso.Prof,Dept of ME Page 145
The pointer moves on the calibrated scale there by indicating the humidity content
present in the atmosphere.
If the hygrometer employs membrane as a humidity sensing element then it is known as
membrane hygrometer
(b). Electrical Humidity Sensing Absorption Hygrometer
Operating principle- variation of resistance with variation in humidity .
The two electrodes are coated with hygroscopic salt.
It is a lithium chloride conductor and acts as humidity sensing element.
The leads of two electrodes are connected in one of the four arms of a balanced
Wheat stone bridge circuit.
The two electrodes are placed in the atmosphere whose humidity is to be measured.
When the humidity of atmosphere changes, the lithium chloride absorbs or losses
moisture.
Therefore the resistance of the lithium chloride conductor changes.
When the humidity in the atmosphere increases, the resistance decreases and vice versa.

7/29/2019 Ics Notes by Polarao Sir
http://slidepdf.com/reader/full/ics-notes-by-polarao-sir 150/184
ICS NOTES-58 UNIT-7
R.Pola Rao,Asso.Prof,Dept of ME Page 146
Due to this the balance condition of Wheatstone bridge will get disturbed and the bridge
produces some output voltage which gives the measure of relative humidity present in the
atmosphere.
REFERENCE BOOKS:
1.A course on mechanical measurements and instrumentation- A.K Sawhney
2.Instrumentation and Control systems- S.Sudhakarreddy&P.Divakararao
3.Instrumentation Measurement & Analysis- B.C Nakra and K.K Choudhry

7/29/2019 Ics Notes by Polarao Sir
http://slidepdf.com/reader/full/ics-notes-by-polarao-sir 151/184
ICS NOTES-60 UNIT-7
R.Pola Rao,Asso.Prof,Dept of ME Page 149
Moisture Measurement - For Granular Materials :
To measure moisture present in granular material a cup shaped electrode arrangement is
used.
The granular material is poured into the cup to which electrode leads are connected.
A piston provided by spring arrangement is used to close the cup in order to maintain
maximum pressure in the material, and actual moisture is measured by weighting it after
it becomes completely dried.
For each material and its electrode arrangement, resistance – moisture content
characteristics are established provided the device is calibrated properly.
Elastic force meters
Elastic force meters are force measuring devices.
These can be used to measure both static force and dynamic force.
When the force to be measured is applied to these meters, the elastic sensing element
sense the applied force and produces displacement.
The measure of this displacement gives the amount of force applied at the input.
These elastic sensing elements can be available in the form of diaphragms, cylinders,
rings, strips etc.

7/29/2019 Ics Notes by Polarao Sir
http://slidepdf.com/reader/full/ics-notes-by-polarao-sir 152/184
ICS
R.Pola Rao,Asso.Prof,Dept of M
Load cell
NOTES-60 UNI
E
-7
Page 150

7/29/2019 Ics Notes by Polarao Sir
http://slidepdf.com/reader/full/ics-notes-by-polarao-sir 153/184
ICS NOTES-60 UNIT-7
R.Pola Rao,Asso.Prof,Dept of ME Page 151
Primary devices that enable measurements of both static and dynamic forces are known
as load cells.
Load cells use elastic member as primary devices and strain gauge as secondary devices
in the measurement of static and dynamic forces.
The load cell which uses a cantilever beam (elastic member) as primary transducer and
strain gauge as secondary transducer is shown in figure
The strain experienced by the strain gauges R2 and R4 is opposite in nature of strain that
is experienced by gauges Rl and R3 .
When force is applied to cantilever beam it will bend, with this the resistance of the
gauges will be changed.
Here electrical output will be obtained with the use of Wheatstone bridge.
AE
P =ε Strian
L
EAk , =Stiffness

7/29/2019 Ics Notes by Polarao Sir
http://slidepdf.com/reader/full/ics-notes-by-polarao-sir 154/184
ICS NOTES-60 UNIT-7
R.Pola Rao,Asso.Prof,Dept of ME Page 152
REFERENCE BOOKS:
1.A course on mechanical measurements and instrumentation- A.K Sawhney
2.Instrumentation and Control systems- S.Sudhakarreddy&P.Divakararao
3.Instrumentation Measurement & Analysis- B.C Nakra and K.K Choudhry

7/29/2019 Ics Notes by Polarao Sir
http://slidepdf.com/reader/full/ics-notes-by-polarao-sir 155/184
ICS NOTES-61 UNIT-7
R.Pola Rao,Asso.Prof,Dept of ME Page 153
Hydraulic load cell.
The principle of operation of hydraulic load cell -When a force is applied on a liquidmedium, the pressure of the liquid increases.
This increase in pressure is a measure of the applied force when calibrated.
It is also known as a hydraulic plunger.
Hydraulic oil is filled in a closed chamber whose height is 0.75 mm.
The force to be measured is applied on the diaphragm.
The applied force move the diaphragm downwards and thus closes the chamber from the
top.
The pressure of the liquid increases due to the applied force. This increase in pressure of
the liquid is measured by employing mechanical or electrical pressure gauge.
When full load is applied the maximum of 0.05 mm deflection occurs.
This type of load cell can measure force upto 500 tonnes.
Pneumatic Load Cell.

7/29/2019 Ics Notes by Polarao Sir
http://slidepdf.com/reader/full/ics-notes-by-polarao-sir 156/184
ICS NOTES-61 UNIT-7
R.Pola Rao,Asso.Prof,Dept of ME Page 154
Principle - works on the balancing of force
i.e., the applied unknown downward force is balanced by upward force of air pressure. The
pressure at which the downward force is balanced by upward force indicates the amount of
applied force.
When the unknown force is applied to the top of the diaphragm, in diaphragm deflects
towards down.
Therefore the flapper moves downwards and closes the opening of nozzle.
Air is supplied through and air pressure regulator to the other side of the diaphragm.
Since the flapper shut off the nozzle opening, the back pressure increases in the system.
This increased back pressure also act on the diaphragm.
The air pressure value is regulated until the diaphragm comes back to its pre-loaded
position.
At this balanced stage of diaphragm, the pressure indicated by the pressure meter(pressure gauge) gives the amount of force applied.

7/29/2019 Ics Notes by Polarao Sir
http://slidepdf.com/reader/full/ics-notes-by-polarao-sir 157/184
ICS NOTES-62 UNIT-7
R.Pola Rao,Asso.Prof,Dept of ME Page 155
Strain Gauge Torsion Meter
This arrangement uses four strain gauges each mounted at 900 to each other.
Strain gauges are diametrically opposite to each other and these strain gauge are
arranged in a Wheatstone bridge circuit.
Strain gauge R1 and R4 are subjected to tensile stress and strain gauge R2 and R3 are
subjected to compressive stress, when the shaft is under torsion.

7/29/2019 Ics Notes by Polarao Sir
http://slidepdf.com/reader/full/ics-notes-by-polarao-sir 158/184
ICS NOTES-62 UNIT-7
R.Pola Rao,Asso.Prof,Dept of ME Page 156
Therefore, the torque of the rotating shaft is obtained with the help of compressive and
tensile stresses.
The angle made by the gauge with shaft is 45
0
, strain is given by.
Electrical Torsion Meter
Rotating shaft employs two slotted discs and two transducers which can be photoelectric
or magnetic transducers.
The two wheels are mounted on a shaft as shown.
When no torque is applied on the shaft the teeth of both wheels are correctly aligned
with each other.
Under this condition the voltage pulses induced in both the transducers are same i.e., thetime interval between the pulses is zero.
When the shaft is subjected to torque to the measured, the teeth of both wheels will not
align.
It causes voltage pulses to induce in the two transducers with a time difference.
Nml
R RGT
i 2
)( 0 φ π −
=
)( 44
0
045
i R RG
TR
−±=π
ε

7/29/2019 Ics Notes by Polarao Sir
http://slidepdf.com/reader/full/ics-notes-by-polarao-sir 159/184
ICS NOTES-62 UNIT-7
R.Pola Rao,Asso.Prof,Dept of ME Page 157
This time difference or time interval between the pulses is proportional to the torque
applied on the shaft.
Here the time interval is measured by connecting the output of transducer to as electronic
circuitry using leads.
Mechanical Torsion Meters
It contains a shaft mounted between two drums and two flanges.
One drum is provided with a torque calibrated scale and the other has a pointer.
A stroboscopic light source is used to note down the readings on the rotating shaft.
One of the two ends of the rotating shaft is mounted on the driving engine where as the
other end is attached to the driven load.
The angular displacement (angular twist) of the shaft over a fixed length is proportional
to the torque exerted on the shaft.
This angle of shift gives the amount of torque applied and is indicated by the movement
of the pointer on the calibrated scale.
Since the calibrate scale is marked on the rotating drum it is difficult to note down the
readings directly.

7/29/2019 Ics Notes by Polarao Sir
http://slidepdf.com/reader/full/ics-notes-by-polarao-sir 160/184
ICS
R.Pola Rao,Asso.Prof,Dept of M
To overcome this difficul
calibrated scale and the fl
is appeared.
The movement at which
is taken.
As the applied torque var
It can measure and indic
the shaft power.
Optical Torsion Meter
This optical system meas
The deflected light beam
applied torque.
In contains a shaft on wh
distance apart.
A tension strip is placed
Two mirrors are fixed o
reflected onto the torque
When the shaft is subject
NOTES-62 UNI
E
ty the flash light from the stroboscope is focuse
ashing frequency is varied and adjusted until a
the stationary image appears, the reading on th
ies, the angle of twist also varies.
ate the varying angle of twist and it can also be
ures the angular deflection of light beam.
is proportional to the angular twist of the shaft
ich two castings namely P and Q are mounted a
and attached between the two castings
the castings such that the light falling on the m
calibrated scale through an optical system.
ed to torque, a relative movement takes place b
-7
Page 158
d onto the
tationary image
calibrated scale
sed to indicate
and hence to the
a known
irrors is
tween P and Q.
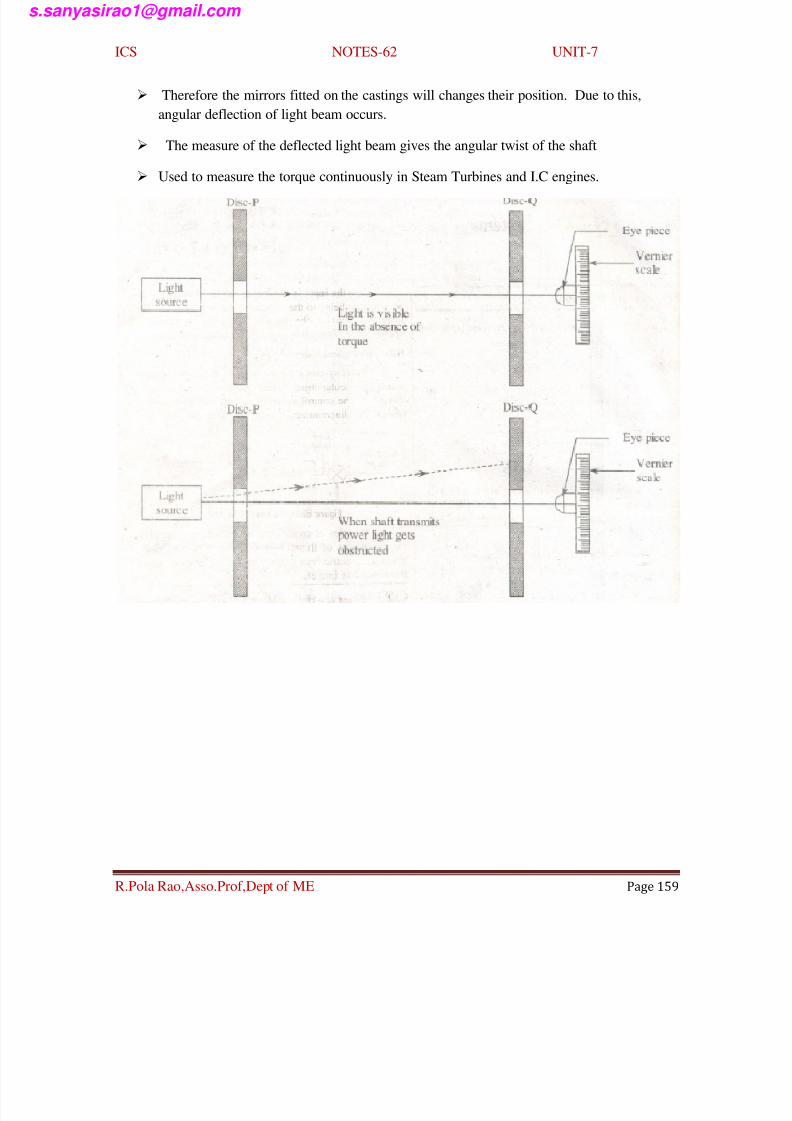
7/29/2019 Ics Notes by Polarao Sir
http://slidepdf.com/reader/full/ics-notes-by-polarao-sir 161/184
ICS NOTES-62 UNIT-7
R.Pola Rao,Asso.Prof,Dept of ME Page 159
Therefore the mirrors fitted on the castings will changes their position. Due to this,
angular deflection of light beam occurs.
The measure of the deflected light beam gives the angular twist of the shaft
Used to measure the torque continuously in Steam Turbines and I.C engines.

7/29/2019 Ics Notes by Polarao Sir
http://slidepdf.com/reader/full/ics-notes-by-polarao-sir 162/184
ICS
R.Pola Rao,Asso.Prof,Dept of M
Hydraulic Dynamomet
It is an absorption type o
This dynamometer uses
i.e., to dissipate mechani
Therefore, it is also kno
It contains ,
A rotating disk which is
semi elliptical groove wh
A stationary casing mou
system is fixed to it so as
Same as the rotating disk
The semi-elliptical groov
recesses of the casing.
As the driving shaft of th
chamber which causes v
causes the casing of the d
NOTES-63 UNI
E
r
dynamometer.
luid friction for their operation
al energy.
n as fluid friction dynamometer.
attached to the driving shaft of the test machine
ich allow water or steam to flow through them.
nted on antifriction bearings . It has a braking a
to make the casing rotate freely.
of the casing also contains semi-elliptical groo
es of the disk match with the corresponding se
prime mover rotates the liquid follows a helic
rtices and eddy currents to develop in the liqui
ynamometer to rotate in the direction of the sha
-7
Page 160
. The disk -has
m and a balance
es on it.
i-elliptical
l path in the
which in turn
ft.

7/29/2019 Ics Notes by Polarao Sir
http://slidepdf.com/reader/full/ics-notes-by-polarao-sir 163/184
ICS NOTES-63 UNIT-7
R.Pola Rao,Asso.Prof,Dept of ME Page 161
The power absorption is maximum if the casing is full and is minimum if the amount of
liquid is minimum.
The total power absorption of this device changes approximately as
(i) Cube of rotational speed
(ii) Fifth power of rotating disk diameter.
The absorbing element contains a force sensing element such as load cell placed at the
end of the arm/whose radius is 'r'.
Torque T=F x r
Dynamometer:
A dynamometer is a brake but in addition it as a device to measure the frictional
resistance.
Knowing the frictional resistance, we may obtain the torque transmitted and hence
the power of the engine.
Types:
1. Absorption dynamometers:
Entire energy or power produced by the engine is absorbed by the friction resistances of
the brake and is transformed into heat.
a) Prony brake dynamometer, and
b) Rope brake dynamometer.
2. Transmission dynamometers:

7/29/2019 Ics Notes by Polarao Sir
http://slidepdf.com/reader/full/ics-notes-by-polarao-sir 164/184
ICS NOTES-63 UNIT-7
R.Pola Rao,Asso.Prof,Dept of ME Page 162
The energy or power produced by the engine is transmitted through the dynamometer to
some other machines.
a) Epi cyclic-train dynamometer,
b) Belt transmission dynamometer, and
c) Torsion dynamometer.
Prony brake dynamometer:
It consists of two wooden blocks placed around a pulley fixed to the shaft of an engine
whose power is required to be measured.
The blocks are clamped by means of two bolts and nuts.
A helical spring is provided between the nut and the upper block to adjust the pressureon the pulley to control its speed.
Torque on the shaft T = W.L = F.R N-m

7/29/2019 Ics Notes by Polarao Sir
http://slidepdf.com/reader/full/ics-notes-by-polarao-sir 165/184
ICS NOTES-63 UNIT-7
R.Pola Rao,Asso.Prof,Dept of ME Page 163
Rope brake dynamometer:
It is most commonly used for Measuring the brake power of the engine.
It consists of one, two or more ropes wound around the flywheel or rim of a
pulley fixed rigidly to the shaft of an engine.
The upper end of the rope is attached to a spring balance while the lower end of the rope
is kept in position by applying a dead weight .
Wooden blocks are placed at intervals around the circumference of the flywheel to
prevent the slipping of the rope over the flywheel.
Net load on the brake F = (W – S) N
Torque on the shaft T = F.R N-m
=(W-S).R
Brake Power = = =
Eddy Current Dynamometer:
60
)(2 RS W N −π
60
2 NT π
60
))(( d DS W N +−π

7/29/2019 Ics Notes by Polarao Sir
http://slidepdf.com/reader/full/ics-notes-by-polarao-sir 166/184
ICS
R.Pola Rao,Asso.Prof,Dept of M
Principle-Whenever a conductin
the current .
Current flows in a short c
The current flowing wit
the form of heat.
It has
(i)A toothed rotor made
tested or a test engine.
(ii)A cast iron stator that
Working-When the drivi
Due to this a constant ch
Therefore eddy currents
These induced currents o
The moment of resistanc
rotor) is determined by m
This moment of resistanc
NOTES-63 UNI
E
element moves through a magnetic flux an e.
ircular path inside the conductor.
in the conductor is known as eddy current and i
f steel mounted on the driving shaft of the pow
carries an exciting coil
ng shaft rotates which in turn rotates the rotor.
ange in flux density occurs at all points on the s
re induced in the stator
bstruct (resist) the rotation of the rotor.
e (i.e., the moment at which eddy currents resis
eans of braking arm and balance system.
e is used to measure the torque and the shaft po
-7
Page 164
.f is induced in
s dissipated in
r source to be
tator.
the rotation of
wer.

7/29/2019 Ics Notes by Polarao Sir
http://slidepdf.com/reader/full/ics-notes-by-polarao-sir 167/184
ICS NOTES-63 UNIT-7
R.Pola Rao,Asso.Prof,Dept of ME Page 165
REFERENCE BOOKS:
1.A course on mechanical measurements and instrumentation- A.K Sawhney
2.Instrumentation and Control systems- S.Sudhakarreddy&P.Divakararao
3.Instrumentation Measurement & Analysis- B.C Nakra and K.K Choudhry

7/29/2019 Ics Notes by Polarao Sir
http://slidepdf.com/reader/full/ics-notes-by-polarao-sir 168/184
ICS NOTES-64 UNIT-8
R.Pola Rao,Asso.Prof,Dept of ME Page 166
Control system system :
A system in which input has a command over the output or a system in which
input has a control over the output is called a control system.
Figure: A Control System
A water tap can be taken as simple and best example of a control system. Here the flow
of water (i.e., e output) is mechanically controlled by the movement valve (i.e., input).
Different examples of control system are,
A Switch
FigureOne among the examples of a control system is ach in which the input is
mechanically pressing or ap-ag force on button with the fingers and output is flow on-
flow of current.
A Driving System
Figure: Driving System of an Automobile
Controller SystemInput Input
LinkagesAnd
Carborator
EngineCalibration
InputOutput
Variable
speed

7/29/2019 Ics Notes by Polarao Sir
http://slidepdf.com/reader/full/ics-notes-by-polarao-sir 169/184
ICS NOTES-64 UNIT-8
R.Pola Rao,Asso.Prof,Dept of ME Page 167
Here the input is the Acceleration which is given by a human being to the vehicle which
controls or regulates the output i.e., the speed of the vehicle. The desired speed can be
obtained by controlling the Acceleration.
(iii) Biological Control System
In this system a person with his finger points towards a particular object and the
output is desired pointed direction. The control signal here is the position of the object.
The-diagrammatic representation is shown below.
Figure: Biological Control System
Examples of control system include temperature measurement~ of thermometer,
refrigerator, washing machine, electric frying pans, household devices with thermoset
like iron etc.
REFERENCE BOOKS:
1.A course on mechanical measurements and instrumentation- A.K Sawhney
2.Instrumentation and Control systems- S.Sudhakarreddy&P.Divakararao 3.Instrumentation Measurement & Analysis- B.C Nakra and K.K Choudhry

7/29/2019 Ics Notes by Polarao Sir
http://slidepdf.com/reader/full/ics-notes-by-polarao-sir 170/184
ICS NOTES-65 UNIT-8
R.Pola Rao,Asso.Prof,Dept of ME Page 168
Requirements of control system :
Basically there are three main requirements of a control system. They are,
(i) Accuracy
(ii) Stability
(iii) Speed of response.
Accuracy
Accuracy of a system is defined as the difference between the measured output
and the true input. A system with more accuracy is highly expensive.
It is given by formula,
Accuracy =Measured output - True input
In many systems accuracy is expressed as percentage,
inputTrue
inputTrue-outMeasure%Accuracy =
In day-to-day scenario's none of the systems are 100% accurate because there will
be a difference between the measured output and the true input.
Stability
A system is said to be stable if it produces bounded output for a bounded input
also the output also the output reaches to zero state in the absence of the input,
independent of initial conditions. In these type of systems the response is finite for a
given input.
Stability is categorized into two type (i). Absolutely stable (ii) Conditionally
stable. Absolutely stable system is one whose output is stable for all variations of its
parameters and conditionally stable system is one whose output is stable for limited
variations in its parameters.
Speed for Response

7/29/2019 Ics Notes by Polarao Sir
http://slidepdf.com/reader/full/ics-notes-by-polarao-sir 171/184
ICS NOTES-65 UNIT-8
R.Pola Rao,Asso.Prof,Dept of ME Page 169
The time taken by the system to sense the applied output and deliver us output is
known as the sped of response. For an ideal system the speed of response is infinity i.e.,
the system must response to the applied input instantaneously.
For an ideal system accuracy is 100%, it is perfectly stable and the speed for
response is infinity but such system never exists in real time scenarios.
meter which lets the rider to obtain the desired speed.
REFERENCE BOOKS: 1.A course on mechanical measurements and instrumentation- A.K Sawhney2.Instrumentation and Control systems- S.Sudhakarreddy&P.Divakararao 3.Instrumentation Measurement & Analysis- B.C Nakra and K.K Choudhry

7/29/2019 Ics Notes by Polarao Sir
http://slidepdf.com/reader/full/ics-notes-by-polarao-sir 172/184
ICS NOTES-66 UNIT-8
R.Pola Rao,Asso.Prof,Dept of ME Page 170
Different types of control systems:
Control system is basically categorized into two types.
(i) Open loop system (system without feedback)
(ii) Closed loop system (system with feedback).
Let us discuss each of them detail.
(i) Open Loop System
A control system which does not automatical1y corrects error in the outputs of the system
of known as an open loop system. Error here inc1udes the environmental variations of
disturbances. The general block diagram of open loop system is,
Figure: Open loop Control system
An open loop system is also called a system with no feedback to the input. Since
without feedback the system is not aware of what errors in the output are occurring. Thus
the output changes due to disturbances is not followed by change in input to correct the
output.
Any changes in system are corrected manually,
Traffic Control System
Traffic control system is the best example for open loop control system. Here the
timers which are included in the signals does not depend upon the quantity of traffic
rather they display control signals depending upon the time allotted for each way.
(i) Closed Loop Systems
A system which automatically correct errors in the output is called a closed loop
system. In a closed loop system output effects the input so as to maintain the desired
output. The back diagram of closed loop system is shown figure
ControlSystemInput
Error
Output

7/29/2019 Ics Notes by Polarao Sir
http://slidepdf.com/reader/full/ics-notes-by-polarao-sir 173/184
ICS NOTES-66 UNIT-8
R.Pola Rao,Asso.Prof,Dept of ME Page 171
An open loop system can be modified to closed loop system by just adding a
feedback path.
When input is applied to a closed loop system a output is obtained this output is
sent as feedback to the input where the error detector checks for the errors. If error are
encountered then they are corrected and hence desired output is obtained.
Example
An Automobile Steering System
An automobile steering system is an example for closed loop system. Its block
diagram representation is shown in figure (3).
Figure (3): Automobile Steering System
The eyes will have the general view of movement of car. If any error is
encountered, it is corrected by the brain and hands. This result is feedback to the eyes.
obtain the desired speed.
REFERENCE BOOKS: 1.A course on mechanical measurements and instrumentation- A.K Sawhney2.Instrumentation and Control systems- S.Sudhakarreddy&P.Divakararao 3.Instrumentation Measurement & Analysis- B.C Nakra and K.K Choudhry

7/29/2019 Ics Notes by Polarao Sir
http://slidepdf.com/reader/full/ics-notes-by-polarao-sir 174/184
ICS NOTES-67 UNIT-8
R.Pola Rao,Asso.Prof,Dept of ME Page 172
Distinguish between open loop and dosed loop systems:
Open Loop System
The features of this systems are,
1. The variations in the output effected by noise are not corrected automatically.
2. There is no comparison between obtained value and the desired value of the
variable.
3. Due to the disturbances the output may not be the desired one.
4. These systems are highly inaccurate and are unreliable.
5. Excluding above factors, these systems are easy of construct and are
economical.
Example:
Figure: Temperature Control System (open Loop)
The above block diagram represents a closed loop temperature control system.
Description
The relay circuit in the block diagram operates as a switch, which is automatically
controlled by a computer or a microprocessor. The time slot during wl1ich the relay
behaves as a short circuit (i.e., ON switch), in order to generate heat by coil is the critical
parameter for obtaining desired temperature. ,
The reference input (set point) is feeded in the controller with the help of a
keyboard or any other input device. The temperature in the electrical furnace is sensed by
7/29/2019 Ics Notes by Polarao Sir
http://slidepdf.com/reader/full/ics-notes-by-polarao-sir 175/184
ICS NOTES-67 UNIT-8
R.Pola Rao,Asso.Prof,Dept of ME Page 173
the sensor. The output of sensor is an analog signal and is converted to digital by means
of analog to digital converter and finally given to the computer. The computer compares
this signal with the reference input. If any difference occurs then the computer sends an
error signal. This error signal is converted into analog with the help of DAC (digital to
analog converter) and applied to relay circuit through 'amplifier, Depending on error
signal the relay circuit changes its state (switches ON or OFF). This process continues
until desired temperature is obtained. When temperature is at desired point no error signal
is generated by the controller.
REFERENCE BOOKS:
1.A course on mechanical measurements and instrumentation- A.K Sawhney2.Instrumentation and Control systems- S.Sudhakarreddy&P.Divakararao
3.Instrumentation Measurement & Analysis- B.C Nakra and K.K Choudhry

7/29/2019 Ics Notes by Polarao Sir
http://slidepdf.com/reader/full/ics-notes-by-polarao-sir 176/184
ICS NOTES-68 UNIT-8
R.Pola Rao,Asso.Prof,Dept of ME Page 174
Working of one automatic control system used in practice:
Automata systems are the one controlled automatically (i.e., not manually). One among
the automatic control system is the feedback controlled thermal system is shown in the
figure below.
Description
The thermal system comprises of a steam control valve, an automatic controller, a
heating element and a thermometer.
Cold water is passed in the thermal system through the inlet shown in the figure.
Depending upon the temperature of water desired, the steam valve is opened and steam is
supplied into the tank. Due to this the temperature of water increases. The thermometer
employed is used to measure the temperature of hot water. This measured value is given
as feedback to the automatic controller (generally a regular). The controller compares the
measured temperature with the' desired temperature. If any difference is encountered then
an error signal is generated by the controller and is given to the control valve. Finally
depending upon the type of error signal the control valve performs the operation and
hence descried hotness of water is obtained.
REFERENCE BOOKS:
1.A course on mechanical measurements and instrumentation- A.K Sawhney
2.Instrumentation and Control systems- S.Sudhakarreddy&P.Divakararao 3.Instrumentation Measurement & Analysis- B.C Nakra and K.K Choudhry

7/29/2019 Ics Notes by Polarao Sir
http://slidepdf.com/reader/full/ics-notes-by-polarao-sir 177/184
ICS NOTES-69 UNIT-8
R.Pola Rao,Asso.Prof,Dept of ME Page 175
Controlling of water level in a boiler:
Automatic control systems are employed for controlling water level in a boiler. This is
shown diagrammatically as.
The boiler is provided with an inlet, specified for flow of water in the tank, A
pneumatic valve is employed at the inlet for adjusting the flow of water. This valve is
opened or closed so as to obtain the desired water level in the tank. Depending upon the
position of valve water gets accommodated in the tank. This obtained level of water in
the tank is measured, and applied to automatic controller. Here any increase and decrease
in the water level moves the ball up and down respectively. This up and down movement
of ball gives the status of liquid level to the controller. The controller compares the
obtained level with the desired level. If any difference occurs then an error signal is
generated By the controller and is given as a feedback to pneumatic valve. Depending
upon the error signal the operation is performed and desired water level in the boiler is
obtained.
REFERENCE BOOKS:
1.A course on mechanical measurements and instrumentation- A.K Sawhney2.Instrumentation and Control systems- S.Sudhakarreddy&P.Divakararao 3.Instrumentation Measurement & Analysis- B.C Nakra and K.K Choudhry

7/29/2019 Ics Notes by Polarao Sir
http://slidepdf.com/reader/full/ics-notes-by-polarao-sir 178/184
ICS NOTES-70 UNIT-8
R.Pola Rao, Asso.Prof, Dept of ME,GMRIT-Rajam Page 176
Servomechanism :
Servomechanism
A feedback control system in which the variable to be controlled (output) is either
mechanical position or velocity, acceleration i.e., time derivative of displacement is
known as servomechanism. It uses feedback mechanism to correct the performance of
the system. In this system the error-correcting signal&(feedback) help in controlling the
mechanical positions. The main purpose of servomechanism is to provide accurate
control of motion automatically. The response time is of order of milliseconds.
Applications of servomechanism include power assisted steering and control large cars,
ships etc.
Position Control System using Servomotor
Position control system with servomechanism is depicted below.
In the figure above the generator 'G' is used to power the servomotor. To the shaft
of servomotor a load is connected through gears wheels. Here we need to obtain the
desired position of the load. Electrical signals obtained are converted to mechanical

7/29/2019 Ics Notes by Polarao Sir
http://slidepdf.com/reader/full/ics-notes-by-polarao-sir 179/184
ICS NOTES-70 UNIT-8
R.Pola Rao, Asso.Prof, Dept of ME,GMRIT-Rajam Page 177
motion by means of potentiometers. The input potentiometer is used to set desired load
position ' θd' and feedback Potentiometer is used for the actual, load" position ' θa'. The
difference between the two angular positions i.e., 'θd' 'θa' generates the error signal which
is amplified and fed to the generator. The generation circuit hence drives the servomotor.
The motor stops rotating if the error signal is zero i.e ., if the desired load position is
obtained.
REFERENCE BOOKS:
1.A course on mechanical measurements and instrumentation- A.K Sawhney2.Instrumentation and Control systems- S.Sudhakarreddy&P.Divakararao
3.Instrumentation Measurement & Analysis- B.C Nakra and K.K Choudhry

7/29/2019 Ics Notes by Polarao Sir
http://slidepdf.com/reader/full/ics-notes-by-polarao-sir 180/184
ICS NOTES-71 UNIT-8
R.Pola Rao, Asso.Prof, Dept of ME,GMRIT-Rajam Page 178
Working of a variable speed D.C. drive control system and its characteristics and
applications:
The block diagram representation of a variable speed D.C. drive control system is shown
below.
Potentiometer is used to vary the speed that is desired. The output of
potentiometer is given to the system. The motor included in this system is a D.C. shunt
motor, here the motors armature voltage is varied and field current is kept constant to
achieve required speed. This obtained speed is delivered to the load and is also measured
by the tachometer. The value measured by the tachometer is compared with the desired
speed and if difference is encountered, an error signal is generated; This error signal is
amplified is given to the shunt motor to obtain the desired speed.
Applications
1. Used in roll stabilization of ships.
2. Power steering apparatus of an automobile.
3. Variable speed control system of D.C. motor.
4. Machine tool position control.
5. For guided missiles, aircraft and manufacturing machinery.
REFERENCE BOOKS:
1.A course on mechanical measurements and instrumentation- A.K Sawhney2.Instrumentation and Control systems- S.Sudhakarreddy&P.Divakararao 3.Instrumentation Measurement & Analysis- B.C Nakra and K.K Choudhry

7/29/2019 Ics Notes by Polarao Sir
http://slidepdf.com/reader/full/ics-notes-by-polarao-sir 181/184
ICS NOTES-72 UNIT-8
R.Pola Rao, Asso.Prof, Dept of ME,GMRIT-Rajam Page 179
Block diagram of the arrangement and the uses of feedback in the application of:
(a) The Speed of Steam Engine
The speed of a steam engine is controlled by Pressure Controlling the steam
supply.
For controlling the steam supply centrifugal watt governor is used. Centrifugal
watt governor set-up consists of a string, spring and two flying balls. An actuator is also
attached to the governor, for controlling the opening of steam supply valve. The set-point
of the speed is also set and fed to the governor through a balancing rod.
The string of the govern pr is connected to the shaft of the steam engine.
Whenever the speed of the shaft exceeds the set-point the arrangement of the string andthe spring exeI1scentrifugal force on the flying balls which cause the balls to move
outwards. This outward movement of the balls applies power on the piston of the
hydraulic actuator which in turn decreases the opening of the valve of the steam supply.
Reduction in valve opening decreases the steam supply and thereby reduces the engine
speed and brings it to the set-point.

7/29/2019 Ics Notes by Polarao Sir
http://slidepdf.com/reader/full/ics-notes-by-polarao-sir 182/184
ICS NOTES-72 UNIT-8
R.Pola Rao, Asso.Prof, Dept of ME,GMRIT-Rajam Page 180
Similarly, when there is a decrease in speed, the governor arrangement leads to
opening of the valve. This increases the steam supply and thus increases the speed.
When the output is not feedback to the input, automatic opening and closing of
valve will not take place and the steam supply is not controlled. Therefore the speed of
the steam engine is not controlled at desired value.
(b) Control of Pressure in a Furnace
The control system for controlling pressure, in a furnace consists of pressure
gauge, actuator and a damper mechanism.
The damper is placed inside the chimney in between regulates the flow of gases.
The damper mechanism regulates the flow of gases.
The pressure inside the furnace is measured through a pressure gauge and
compared to the set-point pressure. If there is a deviation from the set-point, the
corresponding correction signal (electrical signal) is applied to the actuator. The actuator
converts this electrical signal into a physical signal and applies it to the damper
mechanism. The displacement of the damper either increases or decreases the pressure
inside the furnace, according to the correction signal. Thus, in this way the pressure in a
furnace is controlled.
If the system does not contain feedback arrangement, the error signal' will not be
applied to the damper through the actuator. Therefore any changes in pressure inside the
furnace will not be controlled and desired pressure will not be achieved automatically.

7/29/2019 Ics Notes by Polarao Sir
http://slidepdf.com/reader/full/ics-notes-by-polarao-sir 183/184
ICS NOTES-72 UNIT-8
R.Pola Rao, Asso.Prof, Dept of ME,GMRIT-Rajam Page 181
(a) The Temperature of Water Being Heated by Steam.
- For answer refer Unit-VIII, Q6.
(b) The Speed of an Automobile Vehicle
Figure above depicts the block diagram representation of a closed loop
automobile system. In our scenario we are controlling the speed of the automobile.
Description
Let us consider a rider riding a bike then the speed desired by the rider will be as
an input to the system. Depending upon the decision made by human brain the hands
will apply force on the acceleration. Receiving all these signals the vehicles engine will
perform the specified function.
The speed generated by the engine is the output. This speed is calculated with the
help of speedometer and is sighted towards human eye. If the actual speed or obtained

7/29/2019 Ics Notes by Polarao Sir
http://slidepdf.com/reader/full/ics-notes-by-polarao-sir 184/184
ICS NOTES-72 UNIT-8
speed is different from the desired speed then an error signal is made by the human eyes.
This error signal disturbs the human brain and hence on further acceleration or
retardation the desired speed is obtained.
The feedback in this case is the display scale of speedometer to the human eye. Itis a critical parameter which lets the rider to obtain the desired speed
REFERENCE BOOKS: 1.A course on mechanical measurements and instrumentation- A.K Sawhney
2.Instrumentation and Control systems- S.Sudhakarreddy&P.Divakararao 3 Instrumentation Measurement & Analysis B C Nakra and K K Choudhry