ict and disaster risk reduction division capacity
TRANSCRIPT

ICT and Disaster Risk Reduction Division Capacity development toolkit 7/2020
Adaptation and Resilience to Drought:
From know how to do how
A guidebook for the practitioners
[Based on the case studies from South East Asia]
For more information, please contact: ICT and Disaster Risk Reduction Division Economic and Social Commission
for Asia and the Pacific (ESCAP) United Nations Building, Rajadamnern Nok Avenue, Bangkok 10200, Thailand
Email: [email protected]
https://www.unescap.org/our-work/ict-and-disaster-risk-reduction/regional-cooperation-disaster-risk-reduction
1
3
4
2 Asia Pacific
Disaster
Resilience
Network
Regional Platform for Multi-hazard Early Warning and Cascading Risks
Knowledge for Policy
Technology Innovations and Application
Data Analysis and Statistics

ii
Preface
The Ready for the Dry Years publication series has been a part of joint efforts between ESCAP and
ASEAN to support Member States to prepare for intensifying drought risk, by assessing patterns of
drought hazard exposure and vulnerability, highlighting drought impacts, and assessing future drought
risks in the decades ahead. The second edition of the Report was launched at the ASEAN Ministerial
Meeting on Disaster Management, which was held virtually on 27th November 2020. This edition was
designed to usher in a paradigm shift towards more proactive and adaptive drought management across
South-East Asia. The Report provided the evidence base for these interventions, including the recently
adopted ASEAN Declaration on the Strengthening of Adaptation to Drought. Further, the Report
presented three policy tracks: i) reduce and prevent; ii) prepare and respond; and iii) restore and recover.
The methodology presented in the second edition of the Report can be used for the implementation of
the policies and interventions related to the adaptation and resilience to drought. It’s in this context that
‘Adaptation and resilience to drought: From know how to do how’ – a guidebook for the practitioners
has been developed that aims to operationalize the policy track to reduce and prevent the negative
impacts of drought through cross-sectoral initiatives of addressing the water-food-energy nexus. ESCAP
is a part of the Intergovernmental Working Group on Drought (IWG), established in September 2019
during UNCCD COP14. This guidebook contributes to the UNCCD Drought Toolbox that provides tools
and methods to reduce drought risk, be better prepared and effectively respond to drought.
Acknowledgements
Adaptation and resilience to drought: From know how to do how is one of the deliverables of ESCAP’s
Asia-Pacific Disaster Resilience Network (APDRN) for enhancing the knowledge and building the
capacity of Member States. Under the overall guidance of Tiziana Bonapace, Director, ICT and Disaster
Risk Reduction Division, members of the core authors team led by Sanjay Srivastava, Chief, Disaster
Risk Reduction Section, consisted of Prangya Paramita Gupta, Maria Bernadet Dewi, Kareff May
Rafisura and Madhurima Sarkar-Swaisgood.
Valuable advice, reviews and inputs were received from Prof Mukund S Babel (AIT), Amin
Shamseddini (APDIM), Caroline King, Xiaoxia Jia and Daniel Tsegai (UNCCD/IWG-Drought).
Anoushka Ali provided copy editing and proofreading. The graphic design and layout were created by
Jeong Won Min. It was refined further by Sapna Dubey.
Chonlathon Piemwongjit and Natacha Pitaksereekul provided administrative assistance to the authors
team.
Preface
Acknowledgements
iii
Contents Forewords ................................................................................. Error! Bookmark not defined.
Acknowledgements ............................................................................................................. ii
Contents ...............................................................................................................................iii
List of Figures ...................................................................................................................... v
Acronyms .............................................................................................................................vi
Chapter 1. Overview ............................................................................................................ 1
Chapter 2. Why drought adaptation? ................................................................................. 2
2.1 Drought in South-East Asia .......................................................................................... 2
2.2 Drought adaptation and its benefits .............................................................................. 4
2.3 The aim of drought adaptation ...................................................................................... 5
2.4 How to approach drought adaptation ............................................................................ 6
Chapter 3. Drought adaptation – Know How ..................................................................... 7
3.1 Structural changes in water-food-energy and drought .................................................. 7
3.2 Addressing water-food-energy nexus in drought adaptation ......................................... 9
Chapter 4: Drought adaptation – Do How .........................................................................12
4.1 Integrating drought adaptation into the existing drought management process .......... 12
4.2 Integrating drought adaptation into national/regional climate change policy ............... 15
4.3 Mainstreaming drought adaptation into national/regional drought management
strategies ......................................................................................................................... 19
4.4 Potential outcomes of integrating drought adaptation into the drought management
process ............................................................................................................................ 20
Chapter 5: Quantifying the potential economic, social and environmental costs of
drought ................................................................................................................................21
5.1 UNCCD drought toolbox ............................................................................................. 21
5.2 Add-on module in the UNCCD Drought toolbox: analysis of socioeconomic drought
indicators ......................................................................................................................... 21
5.2.1 Estimating Population Exposure ...........................................................................22
5.2.2 Estimating exposure of agricultural lands to drought .............................................24
5.2.3 Estimating population vulnerability ........................................................................26
5.2.4 Identifying risk hotspots ........................................................................................28
5.2.5 Estimating economic loss due to drought ..............................................................31
5.3 Adaptation techniques ................................................................................................ 33
5.4 Dynamic drought risk assessment .............................................................................. 34
Contents
Disaster Risk Reduction/WP1 From know how to do how: Adaptation and Resilience to Drought
iv
5.4.1 ASEAN Specialized Meteorological Centre (ASMC) .............................................35
5.4.2 Regional Drought and Crop Yield Information System (RDCYIS) .........................35
5.4.3 Climate Change Knowledge Portal (CCKP) ..........................................................36
Chapter 6: Conclusions......................................................................................................38
Bibliography ........................................................................................................................38
Annexure I ...........................................................................................................................38
Endnote ...............................................................................................................................38

Disaster Risk Reduction/WP1 From know how to do how: Adaptation and Resilience to Drought
v
List of Figures
Figure 1 Three parallel tracks for drought adaptation .............................................................................. 1
Figure 2 Cluster of drought impacts ......................................................................................................... 3
Figure 3 Triple dividends: Economic, social and environmental benefits of drought adaptation ............. 4
Figure 4 Goals of drought adaptation ...................................................................................................... 5
Figure 5 Stages of drought adaptation ..................................................................................................... 6
Figure 6 Key figures on water-food and energy domain in South-East Asia , ......................................... 8
Figure 7 Water-food-energy nexus in drought perspective, .................................................................... 9
Figure 8 Possible entry points for mainstreaming drought adaptation ................................................... 19
Figure 9 Population exposed to different levels of water stress under a business-as-usual (BAU)
scenario in South-East Asia in (a) 2020, (b) 2030 and (c) 2040 ............................................................ 23
Figure 10 Exposure of orchards, plantation and agricultural lands in South-East Asia to different levels
of drought ............................................................................................................................................... 25
Figure 11 Population vulnerability under business-as-usual (BAU) scenario based on water stress and
human development index in South-East Asia in (a)2020, (b) 2030 and (c) 2040 ................................ 27
Figure 12 Hotspots of population during the 5 years of drought peak (October 2015) in Myanmar
based on (a) high percentage of severely and moderately stunted children, (b) low wealth score and
(c) high percentage of men working in the agricultural sector ............................................................... 29
Figure 13 Hotspots of population with high percentage of men and women working in the agricultural
sector during the 5 years of drought peak (2015) in Viet Nam .............................................................. 30
Figure 14 Average Annual Loss (AAL) under droughts of different severity (2020) .............................. 32
Figure 15 ASMC regional weather forecasting web portal .................................................................... 35
Figure 16 Regional drought and crop yield information system by SERVIR and ADPC ....................... 36
Figure 17 Climate Change Knowledge Portal ........................................................................................ 37
List of Figures

Disaster Risk Reduction/WP1 From know how to do how: Adaptation and Resilience to Drought
vi
Acronyms
AAL Average Annual Loss
ADPC Asian Disaster Preparedness Center
APDRN
Asia-Pacific Disaster Resilience Network
ASEAN Association of Southeast Asian Nations
ASMC ASEAN Specialized Meteorological Centre
CCKP Climate Change Knowledge Portal
BAU Business-As-Usual
CGIAR Consultative Group on International Agricultural Research
CHIRPS
Climate Hazards Group InfraRed Precipitation with Station data
COP Conference of the Parties
DHS Demographic Health Surveys
ESCAP Economic and Social Commission for Asia and the Pacific
GDP Gross Domestic Product
IOD Indian Ocean Dipole
NAP National Adaptation Plan
NDA National Drought Agreement
QGIS Quantum GIS
RCLMS Regional Land Cover Monitoring System
SDGs Sustainable Development Goals
SHDI Subnational Human Development Index
UNCCD
United Nations Convention to Combat Desertification
UNDP United Nations Development Programme
UNFCCC United Nations Framework Convention on Climate Change
WRI World Resource Institute
Acronyms


Disaster Risk Reduction/WP1 From know how to do how: Adaptation and Resilience to Drought
1
South-East Asia is frequently affected by drought and its impacts. During 2015 to 2020, the entire
ASEAN region experienced at least six months of drought.1 For a better understanding of current drought
management practices in South-East Asia, ESCAP has advocated for a shift to a more pro-active
drought management approach and introduced a three-track framework in their publication, Ready for
the Dry Years: Building resilience to drought in South-East Asia (second edition). Considering future
drought risks in this region, the framework demonstrates three parallel tracks for policy interventions for
drought adaptation that need to be taken across different sectors and at various timescales. Track 1
focuses on reducing or preventing drought risk though managing food, water and energy using a nexus
approach. Track 2 enables countries to be better prepared and respond to drought risks through risk
assessment, monitoring and early warning using climate services, data and innovations. Track 3
emphasizes to build-back-better by adopting risk-informed financing and insurance strategies. For the
effective implementation of this framework, it is essential to integrate these adaptation strategies into
existing drought management plans and policies in both individual countries and in ASEAN as well.
Figure 1 Three parallel tracks for drought adaptation2
This guidebook aims to promote drought adaptation as the key to drought management processes and
provides strategic and practical options to operationalize drought adaptation in South-East Asia. It
includes the fundamental concept of integrating drought adaptation into existing drought management
process and into regional or national drought management policies and their mainstreaming mechanism.
Furthermore, this guidebook describes various Track 1 strategies as well as provides technical support
for the implementation of Track 2 strategies. Track 1 presents the lessons learnt from the best practices
for drought adaptation in water, food and energy sectors across the South-East Asia region. To develop
the Track 2 adaptation strategies, it is essential to understand the underlying causes of drought risks,
Chapter 1. Overview

Disaster Risk Reduction/WP1 From know how to do how: Adaptation and Resilience to Drought
2
including exposure to drought and specific vulnerability at the regional or sub-regional level. Different
approaches (methods and data) have been adopted by various countries to identify drought risk,
however, a common methodology can ensure the consistency and systemic replication of risk
assessment across the region. This guidebook presents examples of geo-spatial-based drought risk
assessment tools, at different spatial scales, using critically validated open source data and open source
data analysis interface, which can be replicated across the region. It includes the identification of drought
risk hotspots, exposure and vulnerability to drought as well as guidelines to estimate the economic
impacts of drought in South-East Asia.
This guidebook targets multi-sector stakeholders, such as professionals from agriculture, water
resources, energy, disaster and climate change, land management, planning and finance sectors, as
well as administrators, government officials and policymakers who are working in relevant sectors. It is
expected that this guidebook will become a useful tool in assisting such multi-sector stakeholders in
addressing drought risk to develop more resilient communities in the future.
2.1 Drought in South-East Asia
Drought is a slow-onset natural hazard causing wide-reaching and prolonged impacts on the economy,
people and environment. The creeping nature of drought makes it difficult to precisely determine its
onset and ending. It directly impacts agriculture through declining crop yields, thereby increasing food
insecurity. It disrupts the supply chain, impacts businesses and essential services, and enhances land
degradation and the depletion of water resources. Furthermore, it may even widen social inequalities,
create social conflicts and trigger migration.3, 4
Drought has intermittently covered large areas of South-East Asia throughout 1981-2020. Successive
droughts, in this region, during 2015-2016 and 2018-2020 reflect its episodic nature. During this time
more than 70 per cent of the land area, in this region, experienced moderate drought, however, the
spatial extent varied.5
Drought in South-East Asia is primarily caused by a deficit of rainfall, which is driven by the interaction
of multiple climate systems, at different spatio-temporal scales. El-Niño events which cause rainfall to
shift further east of this region, often trigger the onset of drought. The anomalies in the sea surface
temperature in the Indian Ocean (IOD) are another major driver of drought in the region. The strong and
positive IOD contributes to deficient rainfall, in some parts of the region, and helps develop a drought
situation. Moreover, on the decadal timescale, rainfall also shows variability, which is associated with
changes in the sea surface temperature in the Pacific Ocean. Although rainfall is the primary driver of
drought, high surface air temperature intensifies its impacts. Thus, drought in South-East Asia is also
associated with above-average maximum temperature.6
Chapter 2. Why drought adaptation?

Disaster Risk Reduction/WP1 From know how to do how: Adaptation and Resilience to Drought
3
Figure 2 Cluster of drought impacts7
Populations living in poor socioeconomic conditions have been more vulnerable to the impacts of
drought. Drought magnifies already existing social inequalities, poverty and marginalization as crop
failure, food shortage and drought-related diseases increase population vulnerability. Often, drought
triggers environmental degradation, such as forest and peat land fire and air pollution, declining water
quality and creating water scarcity. Droughts accelerate land degradation, especially in areas with over-
exploited land and water resources, deforestation and unsuitable agricultural practices, which creates a
huge economic burden. Moreover, drought has caused severe economic damage to countries primarily
because of loss of agricultural production and its subsequent impact in the associated sectors.
The ‘crisis management’ approach is most common in addressing drought. However, it fails to build
resilience of the society and provide long-term sustainability. On the contrary, adaptation seeks to reduce
the harmful consequences of drought along with enhancing a society’s capacity to anticipate, cope with,
and respond to drought. Adaptation integrally addresses these socio-environmental consequences with
assured economic benefits. As per the Global Commission on Adaptation, “the overall rate of return on
investment in improved resilience is very high.”8 Moreover, adaptation builds resilience of the key
system against the impacts of drought.
Therefore, for countries in South-East Asia, where a large proportion of the population is economically
dependent on climate-sensitive sectors, such as agriculture, fisheries, forestry, water, energy and
environment, adaptation is a key instrument to avoid and overcome the impacts of drought.
From this perspective, this guidebook aims to advise multisectoral, development professionals working
in the water, energy, environment and agricultural sector, who support policy planners and decision
makers through scientific evidence and technical expertise, on the strategic planning of drought
adaptation and in the technical know-how of the available tools. The advice provided in this guidebook
are based on the practical experiences of drought adaptation in South-East Asia.

Disaster Risk Reduction/WP1 From know how to do how: Adaptation and Resilience to Drought
4
2.2 Drought adaptation and its benefits
Drought adaptation can propel three dividends bringing about economic, social and environmental
benefits. 9 Adaptation measures not only help avoid losses caused by drought, proving to be
economically beneficial in the short-term, but enhanced resilience and future risk reduction are long-
term benefits which are reflected in the social and environmental sectors. Figure 1 illustrates the benefits
of adaptation action in three key dimensions of sustainable development.
Figure 3 Triple dividends: Economic, social and environmental benefits of drought adaptation
Adaptation measures often generate co-benefits. For example, in the long run, adaptation measures
can reduce future vulnerabilities caused due to climate change and drought. Afforestation helps reduce
land degradation and increases soil-water availability during drought, but also creates a carbon sink and
helps mitigate global warming. The implementation of adaptation measures requires services,
knowledge and resources and therefore, creates market opportunities for the providers. For example,
the development of wastewater treatment infrastructure and transportation networks are required to
facilitate the use of wastewater for agriculture during drought. By and large, the policies, measures and
development activities taken toward drought adaptation can help achieve long-term sustainable
development goals.

Disaster Risk Reduction/WP1 From know how to do how: Adaptation and Resilience to Drought
5
2.3 The aim of drought adaptation
Drought adaptation refers to the strategies which are developed or implemented to enhance a system’s
ability to adjust with the changing climate and related events (e.g., drought) by avoiding potential
damages and losses, and taking advantage of the opportunities or coping with the consequences.
One such strategy is crop diversification, instead of monoculture, in drought-prone areas which can
avoid potential economic loss due to drought.10 For example, to encash the opportunities from drought-
induced saltwater intrusion in the Mekong delta, farmers are practicing integrated rice-shrimp farming
(which refers to shrimp farming in existing rice fields).11 To cope with water shortages during drought,
construction of water storage structures, such as ponds and tanks and rainwater harvesting, are
recommended.12, 13
Figure 4 Goals of drought adaptation14
Disaster Risk Reduction/WP1 From know how to do how: Adaptation and Resilience to Drought
6
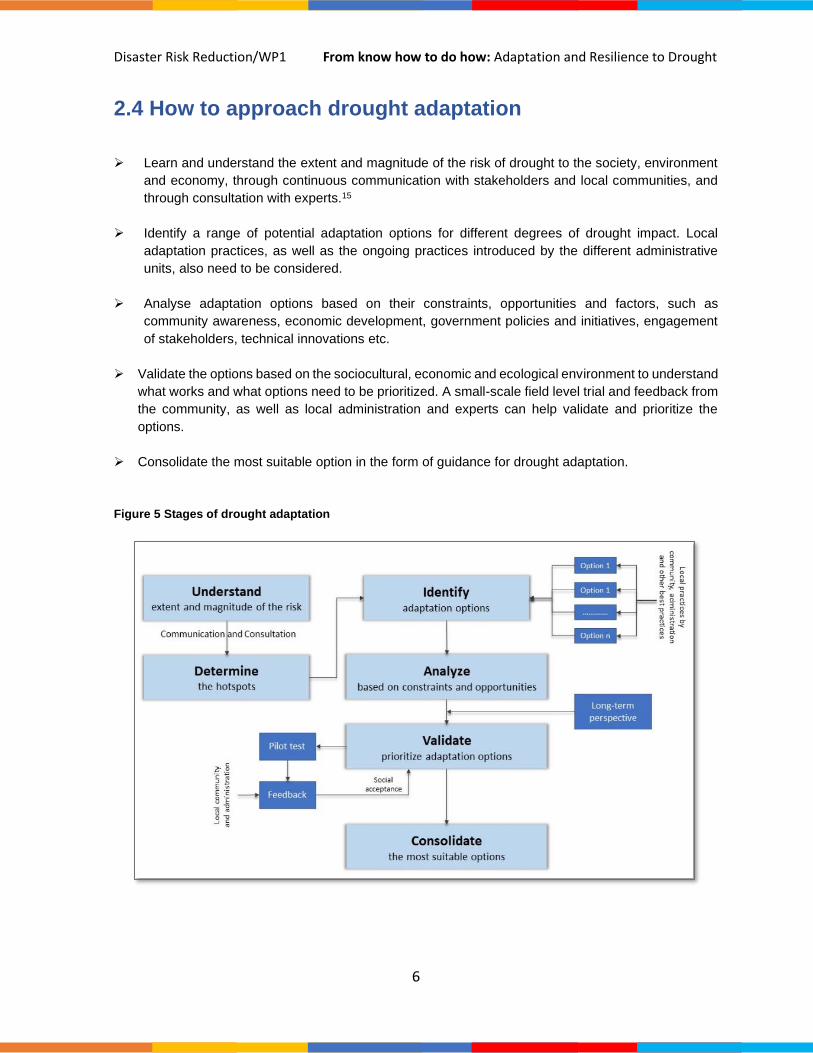
2.4 How to approach drought adaptation
➢ Learn and understand the extent and magnitude of the risk of drought to the society, environment
and economy, through continuous communication with stakeholders and local communities, and
through consultation with experts.15
➢ Identify a range of potential adaptation options for different degrees of drought impact. Local
adaptation practices, as well as the ongoing practices introduced by the different administrative
units, also need to be considered.
➢ Analyse adaptation options based on their constraints, opportunities and factors, such as
community awareness, economic development, government policies and initiatives, engagement
of stakeholders, technical innovations etc.
➢ Validate the options based on the sociocultural, economic and ecological environment to understand
what works and what options need to be prioritized. A small-scale field level trial and feedback from
the community, as well as local administration and experts can help validate and prioritize the
options.
➢ Consolidate the most suitable option in the form of guidance for drought adaptation.
Figure 5 Stages of drought adaptation
Disaster Risk Reduction/WP1 From know how to do how: Adaptation and Resilience to Drought
7
3.1 Structural changes in water-food-energy and drought
Major changes in the food system:
Between 1983 and 2017, agricultural land increased by nearly 70 per cent across South-East Asia, with
a 290 per cent increase in Viet Nam, followed by Myanmar (134 per cent), Lao People’s Democratic
Republic (65 per cent) and Malaysia (54 per cent).16 This additional agricultural area has come from
either utilizing fallow or waste lands, or clearing forest lands, or is compensated by increasing cropping
intensity. Intensification, though required to address the increasing demand for food, has often caused
land degradation and depletion of groundwater. Marginal and non-traditional lands are brought under
cultivation of rubber and oil palm because of the high financial returns on investment that these crops
provide.17
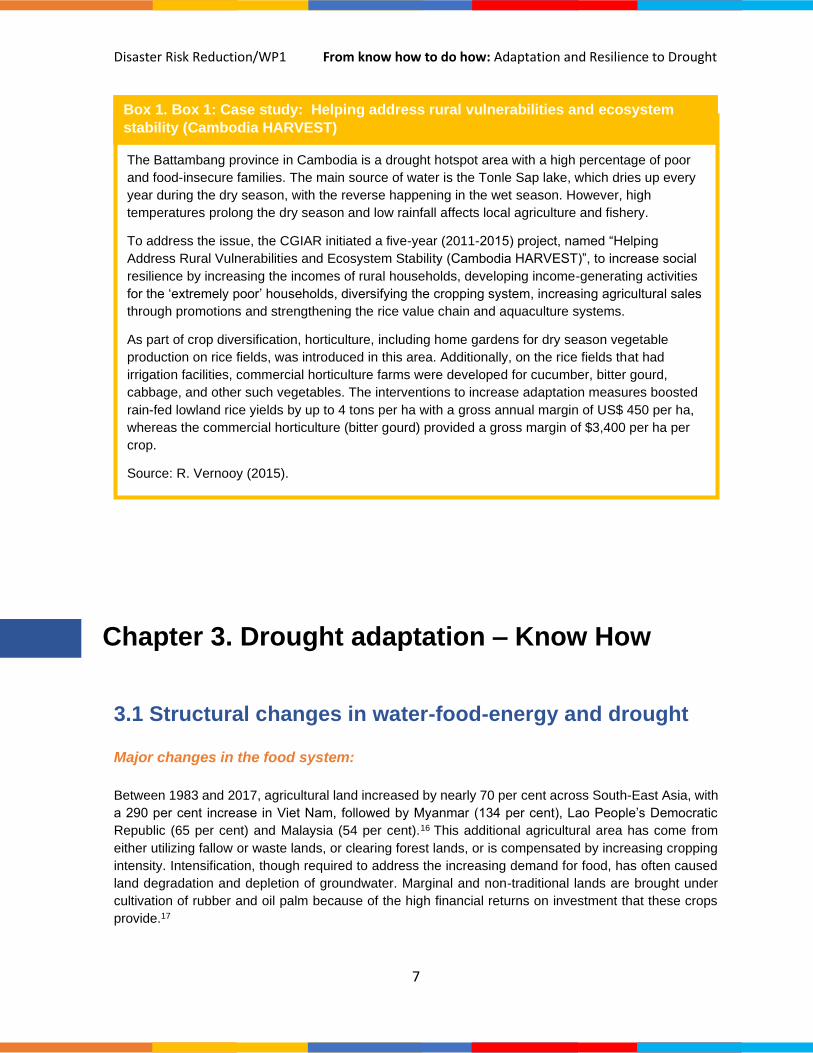
The Battambang province in Cambodia is a drought hotspot area with a high percentage of poor
and food-insecure families. The main source of water is the Tonle Sap lake, which dries up every
year during the dry season, with the reverse happening in the wet season. However, high
temperatures prolong the dry season and low rainfall affects local agriculture and fishery.
To address the issue, the CGIAR initiated a five-year (2011-2015) project, named “Helping
Address Rural Vulnerabilities and Ecosystem Stability (Cambodia HARVEST)”, to increase social
resilience by increasing the incomes of rural households, developing income-generating activities
for the ‘extremely poor’ households, diversifying the cropping system, increasing agricultural sales
through promotions and strengthening the rice value chain and aquaculture systems.
As part of crop diversification, horticulture, including home gardens for dry season vegetable
production on rice fields, was introduced in this area. Additionally, on the rice fields that had
irrigation facilities, commercial horticulture farms were developed for cucumber, bitter gourd,
cabbage, and other such vegetables. The interventions to increase adaptation measures boosted
rain-fed lowland rice yields by up to 4 tons per ha with a gross annual margin of US$ 450 per ha,
whereas the commercial horticulture (bitter gourd) provided a gross margin of $3,400 per ha per
crop.
Source: R. Vernooy (2015).
Box 1. Box 1: Case study: Helping address rural vulnerabilities and ecosystem
stability (Cambodia HARVEST)
Chapter 3. Drought adaptation – Know How

Disaster Risk Reduction/WP1 From know how to do how: Adaptation and Resilience to Drought
8
Major changes in the water system:
In South-East Asia, the total internal, renewable freshwater has been declining since the last two
decades,18 while the demand for water is expected to increase by 30 per cent by 2025. There has been
a significant increase in the demand for freshwater resources in Cambodia, Lao People’s Democratic
Republic and Viet Nam for hydropower, industry and urbanization. However, the efficiency of water use,
in the agricultural sector, has been one of the lowest in this region compared to the global scenario.
Major growth in the service and tourism industries has added additional pressure on the region’s
freshwater resources.
Major changes in the energy system:
The development of hydropower as a renewable resource has been very promising in South-East Asia.
Hydropower capacity in the region grew almost three-fold from 16 GW to 44 GW between 2000 and
2016.19 Viet Nam has the highest installed capacity of hydropower among the ASEAN Member States.20
However, drought exacerbates water shortages, which reduces the generation efficiency of hydropower
plants. Furthermore, water shortages and occurrence of drought often coincides with a heavy demand
for electricity.
These changes enhance the impact of drought, affecting long-term food, water and energy security of
the region and increasing the social, environmental and economic vulnerability of the region.
Figure 6 Key figures on water-food and energy domain in South-East Asia 21, 22

Disaster Risk Reduction/WP1 From know how to do how: Adaptation and Resilience to Drought
9
3.2 Addressing water-food-energy nexus in drought
adaptation
The impact of drought in South-East Asia is reflected across many sectors, however, it centres around
the key nexus of water, food and energy due to their complex interactions and interdependencies.
Although there has been growing interest in drought adaptation in recent years, the interventions have
mostly been sectoral. In such cases, if a nexus approach is adopted, cross-sectoral adaptation options
can build social, economic and environmental resilience of the all the systems across the nexus.
Figure 7 Water-food-energy nexus in drought perspective23, 24
Food-water system: Sustainable food production needs a sustainable supply of water. Hence, water
scarcity or drought will have a profound impact on the food production system. On the other hand,
agriculture affects the water sector through land degradation (affects the soil-water balance) and
groundwater depletion through over-exploitation.
Water-energy system: Hydropower efficiency solely depends on water availability. Any disruption in
the water supply, such as drought, hampers energy production and also the services to other essential
sectors. On the other hand, energy is required for water purification, extraction and its transportation.
Energy-food system: Energy in agriculture is primarily required for irrigation and water supply. Thus,
any disruption in energy supply impacts food production. Though the sustainable development goals
encourage the increasing use of hydropower, however, any water scarce situation can affect food
security by hampering irrigation and water supply to the farms.

Disaster Risk Reduction/WP1 From know how to do how: Adaptation and Resilience to Drought
10
The following are the key principals of addressing the nexus approach for drought adaptation:
✓ Understand the interlinkages of the water-food-energy nexus as a ‘system’ to enhance
the ‘system efficiency’, rather than focusing on the efficiency of any individual sector.
✓ Analyse the effect a change in one resource can have on other resources due to
adaptation measures. Economic analysis should also involve nexus links.
✓ Capitalize on the understanding of the nexus in order to consider adaptation measures
for potential “low-probability-high-impact” events in the near future.
✓ Identify integrated adaptation measures, which are mutually beneficial, and address the
convergence among the sectors.
✓ Justify adaptation measures by interlinking the nexus with climate change in order to
explain their sustainability across space and time.
✓ Ensure coordination among stakeholders of the sectors, while developing adaptation
strategies in order to generate ancillary benefits for long-term sustainability.
Drip irrigation has long been introduced in the South-East Asia region, and has produced varying
levels of success. However, the acceptance and penetration of drip irrigation has been low for
social, economic, ecological and institutional outlook. On a trial basis, drip irrigation was
introduced to small-scale vegetable farmers in drought-prone provinces of Viet Nam (Binh Phouc),
Cambodia (Prey Veng and Svay Reing), Philippines (Lantapan and Bukidnon) and Indonesia
(Reing and Bogor, West Java; Rembang, East Java). As a result, water use efficiency and yield
increased by 43 per cent and 15 per cent in Cambodia, respectively, whereas in Viet Nam the
yield increased between 8 and 11 per cent, respectively. The average yield of vegetables
increased by 15 per cent in the Philippines and the yield and quality of vegetable crops increased
in Indonesia even during the dry season.
Nexus opportunity:
Drip irrigation increases water use efficiency and energy efficiency for agriculture by reducing the
overall consumption of water and energy. Increased efficiency can lead to agricultural expansion,
intensification, increased productivity and food security, as more crops could be produced per
drop of water. Water efficiency in irrigation also reduces the demand for energy (for pumping
water) for agriculture. By minimizing water requirements in agriculture, water can be re-allocated
toward hydropower generation for the industrial and domestic sectors. Such effects help society to
build resilience against drought and its impacts and help to restore environmental flows as a co-
benefit.
Source: M. Palada and others (2011).
Box 2: Case study of nexus approach for drought
Disaster Risk Reduction/WP1 From know how to do how: Adaptation and Resilience to Drought
11
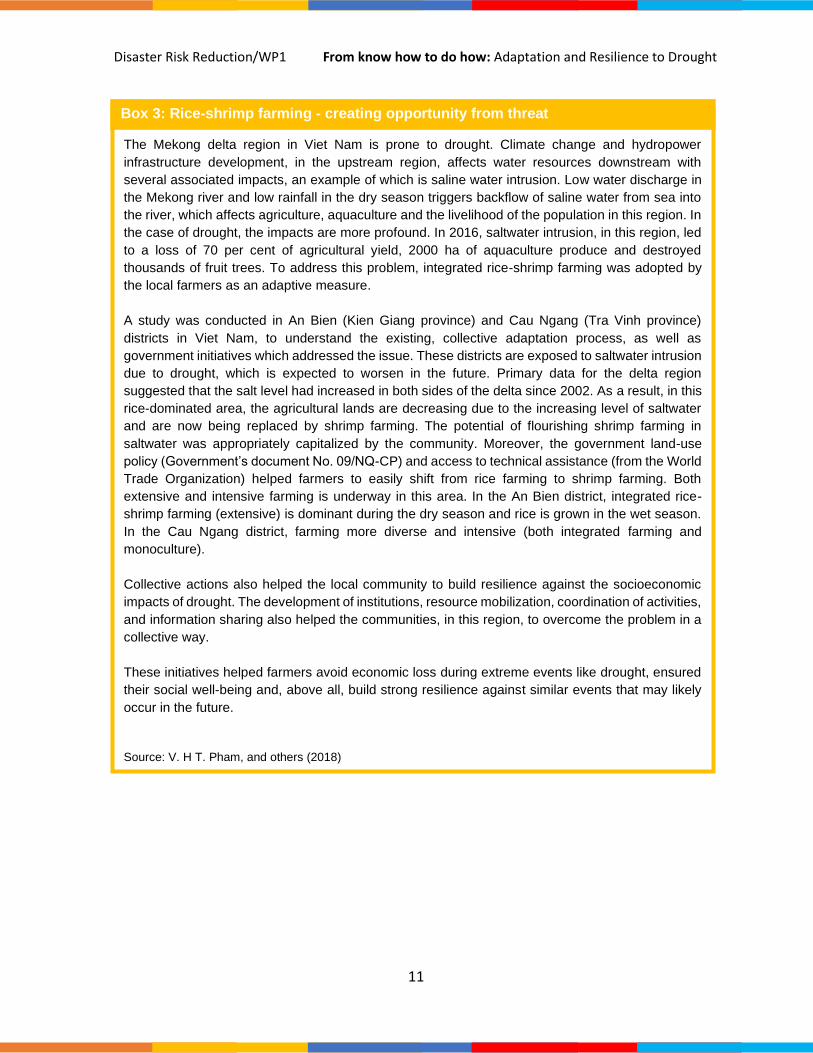
The Mekong delta region in Viet Nam is prone to drought. Climate change and hydropower
infrastructure development, in the upstream region, affects water resources downstream with
several associated impacts, an example of which is saline water intrusion. Low water discharge in
the Mekong river and low rainfall in the dry season triggers backflow of saline water from sea into
the river, which affects agriculture, aquaculture and the livelihood of the population in this region. In
the case of drought, the impacts are more profound. In 2016, saltwater intrusion, in this region, led
to a loss of 70 per cent of agricultural yield, 2000 ha of aquaculture produce and destroyed
thousands of fruit trees. To address this problem, integrated rice-shrimp farming was adopted by
the local farmers as an adaptive measure.
A study was conducted in An Bien (Kien Giang province) and Cau Ngang (Tra Vinh province)
districts in Viet Nam, to understand the existing, collective adaptation process, as well as
government initiatives which addressed the issue. These districts are exposed to saltwater intrusion
due to drought, which is expected to worsen in the future. Primary data for the delta region
suggested that the salt level had increased in both sides of the delta since 2002. As a result, in this
rice-dominated area, the agricultural lands are decreasing due to the increasing level of saltwater
and are now being replaced by shrimp farming. The potential of flourishing shrimp farming in
saltwater was appropriately capitalized by the community. Moreover, the government land-use
policy (Government’s document No. 09/NQ-CP) and access to technical assistance (from the World
Trade Organization) helped farmers to easily shift from rice farming to shrimp farming. Both
extensive and intensive farming is underway in this area. In the An Bien district, integrated rice-
shrimp farming (extensive) is dominant during the dry season and rice is grown in the wet season.
In the Cau Ngang district, farming more diverse and intensive (both integrated farming and
monoculture).
Collective actions also helped the local community to build resilience against the socioeconomic
impacts of drought. The development of institutions, resource mobilization, coordination of activities,
and information sharing also helped the communities, in this region, to overcome the problem in a
collective way.
These initiatives helped farmers avoid economic loss during extreme events like drought, ensured
their social well-being and, above all, build strong resilience against similar events that may likely
occur in the future.
Source: V. H T. Pham, and others (2018)
Box 3: Rice-shrimp farming - creating opportunity from threat

Disaster Risk Reduction/WP1 From know how to do how: Adaptation and Resilience to Drought
12
4.1 Integrating drought adaptation into the existing drought
management process To be most effective, drought adaption measures should be integrated into the existing drought
management framework, plans and policies by Governments and other related organizations, rather
than work as an independent system.
Developing perspective:
The needs of all major sectors, such as water, food, energy and the
ecosystem, that address human development are affected by drought and the
impacts are interconnected across these sectors. Adaptation measures in one
sector must be consistent with the others. As Albert Einstein once said, “We
cannot solve our problems with the same level of thinking that created them”.
Hence, there is need to develop a new perspective in order to address
drought. To develop this perspective, it is necessary to:
➢ identify important or imminent sectors and communities who need urgent assistance.
➢ collect and analyse data on the key indicators to understand the interlinkages among
sectors (a list of some of the key indicators are given in Annex I).
➢ integrate socioeconomic information in the analysis to understand the extent and direction
of risk.
➢ identify the resources under threat, their correlations and competing interests, and probable
potential criticalities which may arise due to drought.
➢ listen to the viewpoint of multiple stakeholders to understand the risk.
➢ learn about existing policies, plans and actions to identify the gaps.
Identifying tools and skills:
The data on indicators vary in type, structure,
volume, completeness, consistency and robustness. Thus, to analyse
these data certain tools are necessary. For example, to understand
changes in forest cover or expansion of agricultural area over a time
period, spatial analysis tools are most suitable. Likewise, statistical
software and policy analysis tools are necessary to analyse large
volumes of socioeconomic data and policy instruments, respectively.
Many of the tools are open source and thus easy to access. Examples
of such tools and data sources are given in Annex I.
Chapter 4: Drought adaptation – Do How

Disaster Risk Reduction/WP1 From know how to do how: Adaptation and Resilience to Drought
13
Furthermore, specific skill sets are also required to use the tools efficiently. Skills can be developed in
professionals through different capacity development programmes. Technical analysis, planning and
management and public outreach qualities are some of the skills that are critical for professionals.
Sharing knowledge and experience:
Sharing and learning from tangible measures are some of the important
parts of drought adaptation. Fore replication and upscaling of best
practices, communicating, sharing of experiences and knowledge and
cross learning are very important. Public, private and government
stakeholders should be consulted prior to decision-making. Recording
and documenting traditional knowledges and practices also helps in
building location specific adaptation strategies. Following are some of
the tools for knowledge-sharing:
• Knowing adaptation best practices and case studies through online resources, such as the
- Adaptation Knowledge Portal. Available at
https://www4.unfccc.int/sites/nwpstaging/Pages/Home.aspxhttp://www.asiapacificadapt.ne
t/adaptation-practices
- PreventionWeb: The knowledge platform for disaster risk reduction. Available at
https://www.preventionweb.net/english/professional/policies/
- The UNCCD Drought Toolbox. Available at https://knowledge.unccd.int/drought-toolbox
• Information dissemination through workshops, webinars, conferences and capacity-building
programmes.
Defining approach:
By knowing the risks and the various stakeholders involved, a strategic,
flexible and structured approach should be undertaken to formulate
adaptation actions. Flexibility in approach allows planning not only according
to changes, but also to make changes in the approach when taking
community perspectives or local circumstances into consideration. For
example, adaptation is a long-term process and additional issues may
develop along the adaptation journey. A flexible and responsive adaptation
approach allows policymakers to address the changes embedded in the existing pathway.

Disaster Risk Reduction/WP1 From know how to do how: Adaptation and Resilience to Drought
14
Monitoring and evaluation (M&E):
As the implementation and mainstreaming of adaptation need investments, it is essential to ensure
effectiveness, efficiency and equity of the interventions. A successful adaptation process for all sectors
should be supported by an adequate reporting mechanism to identify the most feasible options, in order
to ultimately preserve livelihoods and ensure that the sectors contribute effectively to the economy.
• Monitoring is done through continuous collection of
information on the progress of the interventions.
• Evaluation is done through systematic collection and analysis
of the information to understand the extent of progress with
respect to the set objectives.
M&E involves the implementation authorities (governments, administrations and institutions) who are
responsible for coordinating the process and reporting the results, the boundary teams (local
administration, NGO’s etc.,) who translate the policies into ground practices and the beneficiaries (local
communities) who actually implement the adaptation measures. Some examples of the M&E tools are:
• Audit in different time-scales using data on the development indicators.
• Focus groups/ in-depth interviews, direct observation and participatory assessments.
The adaptation approach should:
• Be flexible, responsive and present a spectrum of potential actions that address
sustainable adaptation.
• Be able to develop strategies which can follow changing circumstances.
• Serve as a menu for adaptation actions to guide decisions. Professionals should be
able to select the most contextual option/options that provide benefits across sectors.
• Provide the team (professionals and stakeholders) a platform to discuss pertinent
topics and issues.
The adaptation approach should not:
• Be rigid with set guidelines and recommendations to avoid dependency on any specific
method.
• Express preferences for the use of any of the options.
Box 4: How to define the adaptation approach

Disaster Risk Reduction/WP1 From know how to do how: Adaptation and Resilience to Drought
15
4.2 Integrating drought adaptation into national/regional
climate change policy
While the understanding of drought and its potential impacts have become much clearer over time, policy
guidance on the adaptation processes have been out of pace. Drought and climate are interlinked, as
climate change amplifies drought risk. Hence, through drought adaptation, the impacts of climate change
can also be minimized or alleviated. For this purpose, integrating drought adaptation into existing
national or regional climate change policies, with a clear roadmap is essential. Generally, public
agencies working in relevant fields, such as environment, water, energy and land provide policy inputs.
However, professionals in multisectoral development have an equally important role to play in the
following steps to bring about desired effects or changes.
Agenda setting:
Through agenda setting, the policy and its related problems are acknowledged to be of public interest.
Individuals or groups identify problems, propose their solutions, as well as influence the government to
intervene. In such cases professionals can assist through following actions:
• Support policymakers through sharing of information on potential drought risks.
• Highlight the relation between climate change and drought occurrence and emphasize the need
of inclusive policy.
Box 5: Thailand’s initiatives in M&E
Thailand has begun establishing a national M&E system for the water and agriculture sectors. These sectors are planning to integrate the M&E of adaptation measures in line with the country’s National Adaptation Plan (NAP), which lies within the overall information governance framework. The requirement of M&E has been highlighted in the UNFCCC Paris Agreement, the Sustainable Development Goals (SDGs), and the Sendai Framework for Disaster Risk Reduction 2015-2030. The establishment of a national level M&E system will facilitate the reporting of Thailand’s achievements towards the goals set out in these agreements.
In the agriculture and water sectors, adaptation interventions, such as organic agriculture, piloting drought-resistant crop varieties and soil and water conservation, are already functioning to achieve resilience to drought. In both sectors, adaptation interventions often have their own M&E system or framework at the project level. However, with a national level M&E system, it will be easy to assess whether these adaptation actions, policies and plans can achieve the desired results across a broader scale (contribute to the country’s Nationally Determined Contribution) as well. The M&E of water management, including adaptation actions, will be anchored as a vital part of integrated and climate-sensitive river basin planning (River Basin Master Plans).
Source: UNDP (2019a) and German Cooperation (2019).
Box 5: Thailand’s initiatives in M&E

Disaster Risk Reduction/WP1 From know how to do how: Adaptation and Resilience to Drought
16
• Explain the linkages between drought adaptation and sustainable development goals to
emphasize the broader perspectives of drought adaptation.
• Inform policymakers about international best practices on the impacts of drought and provide
examples of adaptation to strengthen the rationale for inclusive policy.
Policy formulation:
During this stage, various policy options are analysed to provide possible solutions for a particular
problem. The policy statement must clearly mention who is going to implement the policy, how it will be
implemented and what resources will be used for that purpose. In this stage, experts can contribute in
the following ways:
• Identify and promote policy options that will be most effective in the anticipated future. Experts
can support policy formulation by analysing current and future risks and interlink these with
climate change adaptation priorities.
• Use supporting briefs, statistics and analyses to strengthen, and make well-informed and
evidence-based policies.
• Promote those options and potential approaches which advocate future resilience.
• Promote policies which address drought adaptation in a coherent and integrated way across
principal sectors. Uncoordinated and fragmented policy frameworks can result in high costs of
investment in the implementation of adaptation measures.
• Act as the bridge between stakeholders and policymakers to highlight the priorities in policy
formulation, for example, for local water services, water infrastructure or ecosystem restoration.
Policy adoption:
In this stage, policy decisions are made based on the alternatives, arguments and evidence provided
during the formulation phase. Experts can assist decision makers through advocating for a specific policy
decision.
Policy implementation:
In this stage, the policy implementation parameters are established. The factors which decide
effectiveness of the policy are (a) type and complexity of the problem, (b) magnitude of the expected
change and the target groups, (c) volume of human and financial resources attributed for implementation
and (d) the administrative structure and regulations to implement the law.25 Experts can assist those
involved in the policy network to understand these parameters for effective implementation by:
• Describing the type and complexity of drought through risk information, with a crucial
understanding of the interaction between different sectors.
• Assessing the magnitude of the expected change through an evaluation of risks and impacts.
Information about the extent and intensity of drought will help the implementation authority

Disaster Risk Reduction/WP1 From know how to do how: Adaptation and Resilience to Drought
17
assess the magnitude of the interventions required. Likewise, knowledge about the
socioeconomic, cultural and political structure of the target groups will help to decide the
effectiveness of the adaptation measures.
• Gathering information on the volume of human and financial resources needed for
implementation, by identifying the government’s budget and other available resources.
• Bridging the gap between the administration and target group through capacity development
programmes, where the exchange of information and resources are undertaken. Building a
relationship between administrations and target groups, together with the nature of the
regulations (e.g., lenient or stringent), ensures the success of a law. In general, well-accepted
laws by the target group are often successful.
Policy evaluation:
Policy evaluation is necessary to verify whether the policy goals are attained after implementation.
Evaluation can also help incorporate new technologies, lessons learned from recent drought events and
changes in vulnerability into policies. Experts can assist in policy review by cross-checking the
adaptation components of the policy and highlighting the achievements through answering questions
such as:
• Does the policy align with current climate change adaptation plans?
• Does the policy promote and is in line with sustainable development?
• Does the policy enhance community resilience against drought?
• Does the policy reduce exposure of the community to drought?
• Does the policy reduce vulnerability of the community to drought?
• Does the policy have a multisectoral approach?
• Do the policy measures bring about triple dividends, in terms of social, environmental and
economic benefits to the society?

Disaster Risk Reduction/WP1 From know how to do how: Adaptation and Resilience to Drought
18
Box 6: Development of Australia’s National Drought Policy
Australia is a dry continent characterized by varied rainfall and frequent drought. Prior to 1989, drought was considered a natural disaster. Drought management focused on financial assistance to state governments in the form of relief and recovery payment and infrastructure restoration. After identifying the gaps in this approach, the National Drought Policy was announced, in 1992, to:
• Encourage primary producers and other sections of rural Australia to adopt self-reliant approaches to manage climate variability.
• Facilitate the maintenance and protection of Australia’s agricultural and environmental resources base during periods of climatic stress.
• Facilitate the early recovery of agricultural and rural industries, in order to be consistent with long-term sustainable levels.
Until 2008, drought was termed as an exceptional circumstances event and addressed with a crisis management approach. In 2008, the review of the drought policy indicated the need for policy reform with a consideration of variable climate, as well as the social impact of drought on farm families and rural communities and recommended the restructuring of policy to help farmers prepare for drought, rather than wait for drought occurrence.
In 2013, based on a pilot of drought reform measures in parts of Western Australia, the
Intergovernmental Agreement on National Drought Program Reform (IGA) outlined the roles
and responsibilities for implementing a new approach focused on drought preparedness.
In 2015, the Australian Government released a roadmap of practical actions to develop the
agriculture sector under drought conditions. This was aimed to help farmers prepare for
drought, not only from a business perspective, but through better social and community support.
Improved seasonal forecasting, tax measures, farm insurance advice and risk assessment
grants was announced in the roadmap.
On 12 December 2018, the Council of Australian Governments agreed and signed a
new National Drought Agreement (NDA). The NDA focusses on a joint approach to drought
preparedness, responses and recovery, with an attention to accountability and transparency.
Climate change and variability was recognized during the framing of action plans and the
measures covered all aspects of risk management practices, thereby enhancing long-term
preparedness and resilience.
Source: Australian Government, Department of Agriculture, Water and the Environment (2020).
Box 6: Development of Australia’s National Drought Policy
Disaster Risk Reduction/WP1 From know how to do how: Adaptation and Resilience to Drought
19
4.3 Mainstreaming drought adaptation into
national/regional drought management strategies
Mainstreaming drought adaptation refers to the process of systematically integrating adaptation
considerations into the decision-making and planning process for drought management, rather than
implementing them as stand-alone measures. This can take place at different geographical scales
(regional, national or sub-national), and at different stages of decision-making (policymaking, planning,
budgeting or implementation).
Supporting with information:
Understanding drought risk in the local context, where drought management measures will be
implemented, will help to address them specifically. Experts can support the planning process by
providing site-specific data on risk, vulnerability and exposure.
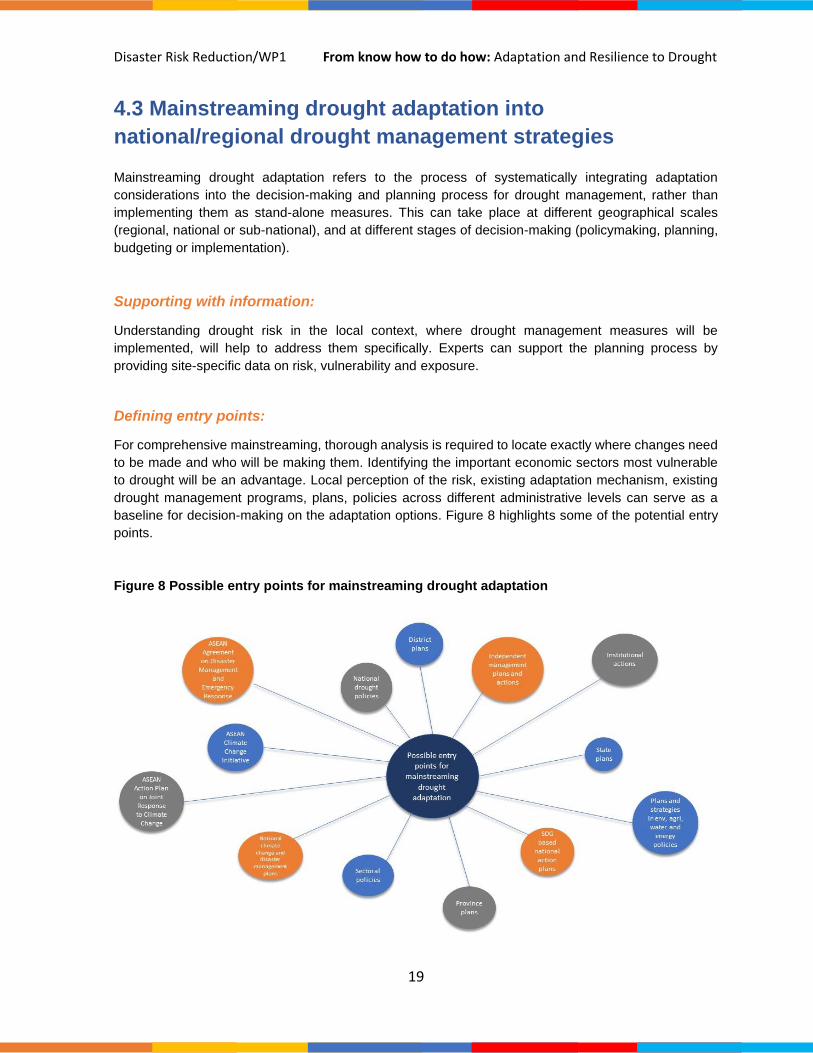
Defining entry points:
For comprehensive mainstreaming, thorough analysis is required to locate exactly where changes need
to be made and who will be making them. Identifying the important economic sectors most vulnerable
to drought will be an advantage. Local perception of the risk, existing adaptation mechanism, existing
drought management programs, plans, policies across different administrative levels can serve as a
baseline for decision-making on the adaptation options. Figure 8 highlights some of the potential entry
points.
Figure 8 Possible entry points for mainstreaming drought adaptation

Disaster Risk Reduction/WP1 From know how to do how: Adaptation and Resilience to Drought
20
Identifying stakeholders:
In order the decide who should participate in mainstreaming activities, stakeholder identification is
required. An exhaustive list of organizations, institutions, groups or individuals involved in drought
adaptation or management activities or in policies and programmes can be used to design an
appropriate institutional set-up that promotes the mainstreaming objective.
Capacity-building and awareness:
Apart from institutionalization, the capacity of the target group in the mainstreaming process must be
enhanced so that they can include appropriate adaptation measures in their decision-making process.
4.4 Potential outcomes of integrating drought adaptation
into the drought management process
• Transition from crisis management to a systematic risk management approach
The integration of drought adaptation into the drought management process will help to develop a
systematic approach in the process of drought risk reduction. The drought management process, which
will be supported by scientific evidence, will thereby become more robust and focused. It will significantly
change the way governments prepare for and respond to drought, by placing greater emphasis on risk
management, rather than crisis management.
• No-regret development and resilience-based approach
The integration of adaptation will make developments (for example, in human resources, social and
infrastructure) more drought resilient across all sectors. Drought adaptation is a precautionary measure
that will promote no-regret development, which will increase the system’s ability to deal with impacts of
drought. It will enhance the resilience of society, the environment and infrastructure and enable
sustainable growth.
• Cost-effective investment with risk-informed development for long-term
sustainability
Adaptation leads to long-term sustainability of resources, even with the uncertain future climate change
scenario. It will reduce the driving forces that cause social, environmental and economical vulnerability
due to drought, in a cost-effective way. As adaptation has an economic advantage over recovery and
rebuilding, it will help in making cost-effective investment for building resilience against drought.

Disaster Risk Reduction/WP1 From know how to do how: Adaptation and Resilience to Drought
21
5.1 UNCCD drought toolbox
As requested by the Conference of the Parties (COP), at its thirteenth meeting (COP13), the drought
initiative was conceived by the United Nations Convention to Combat Desertification (UNCCD) with the
aim of enhancing resilience of communities and the ecosystem to drought and strengthening drought
adaptation through national action plans. The new initiatives focused on:
• Drought preparedness systems
• Regional efforts to reduce drought vulnerability and risk
• A toolbox to boost the resilience of people and ecosystems to drought
The drought toolbox is a repository of tools, case studies and other resources which can support the
framing of the National Drought Policy Plan. The drought toolbox consists of three modules; (1) Drought
Monitoring and Early Warning; (2) Drought Vulnerability and Risk Assessment; and (3) Drought Risk
Mitigation Measures.26
5.2 Add-on module in the UNCCD Drought toolbox: analysis
of socioeconomic drought indicators
The socioeconomic structure of a population defines their vulnerability or the adaptive capacity to
drought and water stress. Household income, employment, social life, access to information, health and
nutritional status, education, physical infrastructure, demographic factors, economic well-being and
inequality etc., reflect a society's capacity to anticipate, cope with and respond to drought. Poor
socioeconomic conditions, and drought and water stress have a cumulative impact on a population and
can even cause social conflicts and migrations. Hence, prior knowledge on these indicators gives an
edge to policymakers so they can develop drought adaptation and mitigation strategies.
The add-on module is intended to assist policymakers with an analytical interpretation of the
socioeconomic impacts of drought. This module will be interlinked with the Asia-Pacific Disaster
Resilience Network (APDRN) data portal, which is currently under development, to facilitate all the base
data required for the analysis.
Chapter 5: Quantifying the potential economic
, social and environmental costs of drought

Disaster Risk Reduction/WP1 From know how to do how: Adaptation and Resilience to Drought
22
5.2.1 Estimating Population Exposure
Population exposure to water stress can be estimated through integrating water stress data and
gridded population data. The methodology is described below.
1. Extracting water stress data for the South-East Asia region
• Add the “aqueduct_projections” shape file in QGIS window using “Add Vector Layer” button.
• Add the boundary of South-East Asia region from APDRN in the existing QGIS window
• Click Vector > Geoprocessing tool > Clip.
• Add “aqueduct_projections” as input layer, boundary of South-East Asia as overlay layer.
Name the output feature class as “Aqueduct_SEA”, mention the location to save the data
and click on “Run”.
• Add “Aqueduct_SEA” in QGIS window > Open attribute table of “Aqueduct_SEA” to view
water stress data for different climate change scenarios and socio-economic pathways which
are presented in each column.
• The description of data can be found in “aqueduct_projections_schematic_20140615.xls”
downloaded along with the data.
2. Creating scenario wise raster file
• Add “Aqueduct_SEA” in QGIS window > right click > Export > Save Features As
• Add the following details:
File Name - as “ws2028tl” and save it in the same location.
Select field to export and their export options - Select BasinID, dwnBasinID, Area_km2,
Shape_lenght and ws2028tl and click “OK”.
• Repeat the process for scenario ws3028tl and ws4028tl.
3. Extracting population data for the South-East Asia region
• Add “Asia_PPP_2020_adj_v2.tif” in the QGIS window using “Add Raster Layer” button.
• Click on Raster > Extraction > Clip raster by mask layer.
• Put “Asia_PPP_2020_adj_v2.tif” as input layer and boundary of South-East Asia region as
Mask layer. Under Clipped (mask), name the output raster as “worldpop_SEA” and save in
the same location as earlier.
Key question
➢ What number of people are exposed to different levels of water stress in the current and future
scenario?
Data sources
➢ The water stress projection data developed by World Resource Institute (WRI).
Available at https://www.wri.org/resources/data-sets/aqueduct-water-stress-projections-data.
➢ Gridded population data by WorldPop. Available at https://www.worldpop.org/geodata/listing?id=17

Disaster Risk Reduction/WP1 From know how to do how: Adaptation and Resilience to Drought
23
4. Calculating population distribution in different water stress zones
• Click on Processing Toolbox > search for Zonal Statistics.
• Add “worldpop_SEA” as raster layer.
• Add “ws2028tl” as vector layer containing zones.
• Choose “SUM” as statistics to calculate and click “Run”.
• Open attribute table of “ws2028tl”. A new column with the statistics is added in the attribute
table. From that column the number of populations in each water stress category can be
calculated.
• The thematic map can be prepared by using properties > symbology> categorize
Save the data using export > Save Feature As “pop_WS2028tl”.
Likewise, population distribution in future water stress scenario (such as ws3028 and ws4028) can be
done using water stress data and population projection data. For different socioeconomic pathways, the
population projection data can be downloaded from
https://sedac.ciesin.columbia.edu/data/set/popdynamics-1-km-downscaled-pop-base-year-projection-
ssp-2000-2100-rev01/data-download.
Figure 9 Population exposed to different levels of water stress under a business-as-usual (BAU) scenario
in South-East Asia in (a) 2020, (b) 2030 and (c) 2040

Disaster Risk Reduction/WP1 From know how to do how: Adaptation and Resilience to Drought
24
5.2.2 Estimating exposure of agricultural lands to drought
Agriculture is one of the sectors most impacted by drought. Exposure of agricultural lands to different
levels of drought can be estimated using landuse/land cover data and drought occurrence data
generated by ESCAP. The methodology is described below:
1. Projecting land cover data
• Download the RCLMS raster data and add in the in QGIS.
• Click Raster > Projection > Wrap (Reproject). Use Asia_South_Albers_Equal_Area_Conic as
the Target CRS. Name the output data and save in desired location. Then “Run”
2. Extracting drought data for Mekong river basin area
• Add individual drought data in the QGIS window using “Add Raster Layer” button.
• Click on Raster > Extraction > Clip raster by mask layer.
• Put drought data as input layer and Mekong river basin boundary provided in APDRN web
portal as Mask layer.
3. Calculating exposure of agricultural lands to different drought levels
• To find out the exposure of agricultural lands to different levels of drought multiply individual
drought data with the landcover data using Processing Toolbox > Raster calculator.
• Open Processing Toolbox. Type Raster layer zonal statistics. Add (drought*landcover) data
as input layer and zones layer. Save it in desired location and click “Run”.
• This will produce a table with area under different landcover categories exposed to drought.
Agriculture data can be extracted from the table.
• Repeat the process for each (drought*landcover) files.
Key question
➢ How much agricultural land is exposed to different levels of drought?
Data sources
➢ Regional Land Cover Monitoring System (RCLMS) developed by SERVIR-Mekong programme. Available at https://landcovermapping.org/en/landcover/
➢ Drought occurrence data from ESCAP’s APDRN web portal.
➢ Mekong river basin boundary from ESCAP’s APDRN web portal.

Disaster Risk Reduction/WP1 From know how to do how: Adaptation and Resilience to Drought
25
Figure 10 Exposure of orchards, plantation and agricultural lands in South-East Asia to different levels of
drought

Disaster Risk Reduction/WP1 From know how to do how: Adaptation and Resilience to Drought
26
5.2.3 Estimating population vulnerability
Population vulnerability due to water stress and drought can be estimated using the sub-national Human
Development Index and the WRI water stress data and drought occurrence data generated by ESCAP,
respectively. The methodology is described below:
Key question
➢ What is the population vulnerability distribution due to water stress in the current and future
scenario?
Vulnerability indicator
➢ Sub-national Human Development Index (SHDI)
Data sources
➢ The water stress projection data developed by World Resource Institute (WRI). Available at
https://www.wri.org/resources/data-sets/aqueduct-water-stress-projections-data.
➢ SHDI (SHDI Complete 4.0 (1).csv and SHDI-4.0-Vardescription (1).csv). Available at
https://globaldatalab.org/shdi/download_files/
➢ Sub-national administrative boundary downloadable from ESCAP’s APDRN web portal.
1. Joining SHDI data with the subnational administrative boundary
• Download SHDI data. Extract the data for South-East Asian countries in Microsoft Excel and
save as “SHDI_SEA2018.csv”.
• Add Sub-national administrative boundary “GDL_SEA.shp” and “SHDI_SEA2018.csv” in
QGIS
• Right click on “GDL_SEA” > properties > Joins…
• Click on “+” at the bottom of the window.
• Add the following details
Join layer: “SHDI_SEA2018”
Join field: GDLCODE
Target field: GDLCode
and click “OK”
• Right click on “GDL_SEA.shp” > Export > Save Feature As> give the file name as
“GDL_SHDI_SEA.shp” and click “OK”.
2. Creating scenario wise raster file
• Open Processing tool > search for Rasterize.
• Give “GDL__SHDI_SEA.shp” as Input layer, shdi as Field to use for a burn-in value, Horizontal
and vertical resolution as 0.0833.
• Under Rasterize click on Save to a File and give name as “GDL_SHDI_SEA.tiff”, and click
“Run”.

Disaster Risk Reduction/WP1 From know how to do how: Adaptation and Resilience to Drought
27
Population vulnerability depends on the SHDI. The higher the SHDI values, the lower the
vulnerability. To estimate the vulnerability, the SDHI values are categorized as:
Category SHDI
very high 0.8 – 1
high 0.7 - 0.799
medium 0.550 - 0.699
low 0 - 0.549
• Add “GDL_SHDI_SEA.tiff” in QGIS window.
• Open Processing Toolbox > search for Raster Calculator to create raster files for different
categories of vulnerability from “GDL_SHDI_SEA.tiff” using the following expressions:
very high (vul_veryhigh): "GDL_SHDI_SEA" <= 0.549
high (vul_high): ("GDL_SHDI_SEA" >= 0.550) & ("GDL_SHDI_SEA" <= 0.699)
medium (vul_medium): ("GDL_SHDI_SEA" >= 0.7) & ("GDL_SHDI_SEA" <= 0.799)
low (vul_low): "GDL_SHDI_SEA" >= 0.8
3. Calculating population vulnerability in different water stress zones
• To identify population vulnerability in different water stress zones, multiply WS2028tl and
vul_low, vul_medium, vul_high and vul_veryhigh in Raster calculator using the following
expressions:
"WS2028tl" * "vul_low"
"WS2028tl" * "vul_ medium "
"WS2028tl" * "vul_high"
"WS2028tl" * "vul_veryhigh"
A similar procedure can be followed to estimate population vulnerability under future water stress
conditions using ws3028tl and ws4028tl.
Figure 11 Population vulnerability under business-as-usual (BAU) scenario based on water stress and
human development index in South-East Asia in (a)2020, (b) 2030 and (c) 2040
Disaster Risk Reduction/WP1 From know how to do how: Adaptation and Resilience to Drought
28
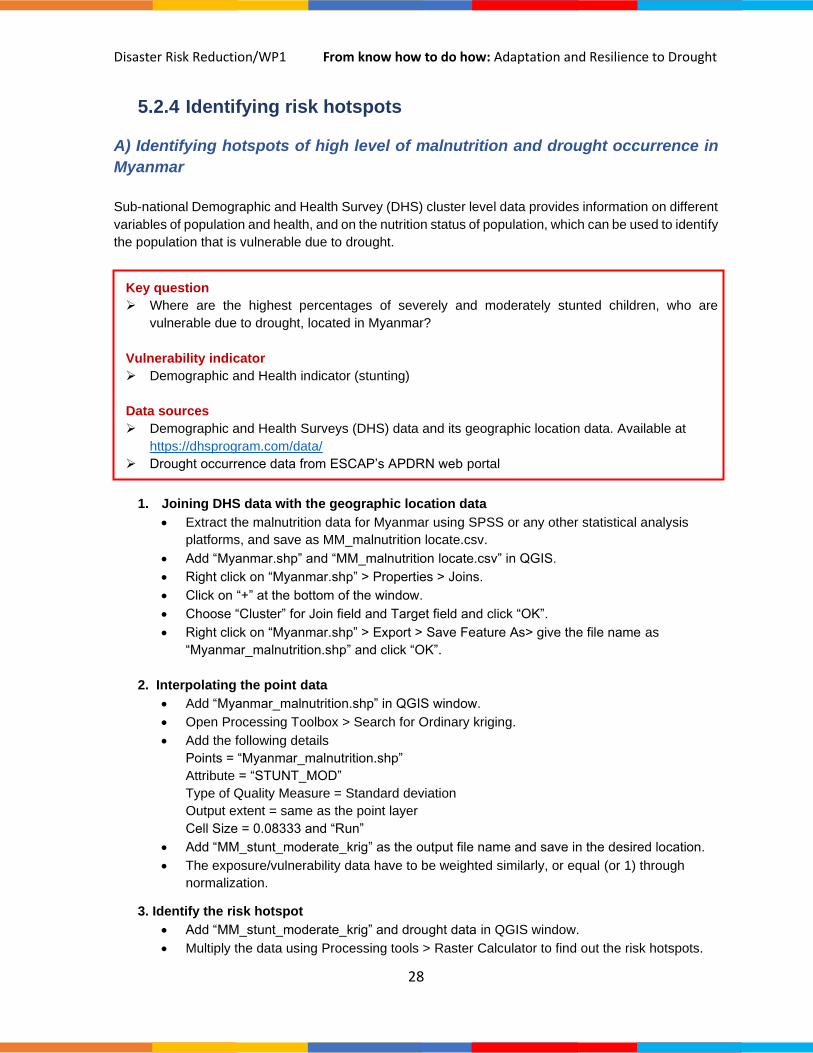
5.2.4 Identifying risk hotspots
A) Identifying hotspots of high level of malnutrition and drought occurrence in
Myanmar
Sub-national Demographic and Health Survey (DHS) cluster level data provides information on different
variables of population and health, and on the nutrition status of population, which can be used to identify
the population that is vulnerable due to drought.
Key question
➢ Where are the highest percentages of severely and moderately stunted children, who are
vulnerable due to drought, located in Myanmar?
Vulnerability indicator
➢ Demographic and Health indicator (stunting)
Data sources
➢ Demographic and Health Surveys (DHS) data and its geographic location data. Available at
https://dhsprogram.com/data/
➢ Drought occurrence data from ESCAP’s APDRN web portal
1. Joining DHS data with the geographic location data
• Extract the malnutrition data for Myanmar using SPSS or any other statistical analysis
platforms, and save as MM_malnutrition locate.csv.
• Add “Myanmar.shp” and “MM_malnutrition locate.csv” in QGIS.
• Right click on “Myanmar.shp” > Properties > Joins.
• Click on “+” at the bottom of the window.
• Choose “Cluster” for Join field and Target field and click “OK”.
• Right click on “Myanmar.shp” > Export > Save Feature As> give the file name as
“Myanmar_malnutrition.shp” and click “OK”.
2. Interpolating the point data
• Add “Myanmar_malnutrition.shp” in QGIS window.
• Open Processing Toolbox > Search for Ordinary kriging.
• Add the following details
Points = “Myanmar_malnutrition.shp”
Attribute = “STUNT_MOD”
Type of Quality Measure = Standard deviation
Output extent = same as the point layer
Cell Size = 0.08333 and “Run”
• Add “MM_stunt_moderate_krig” as the output file name and save in the desired location.
• The exposure/vulnerability data have to be weighted similarly, or equal (or 1) through
normalization.
3. Identify the risk hotspot
• Add “MM_stunt_moderate_krig” and drought data in QGIS window.
• Multiply the data using Processing tools > Raster Calculator to find out the risk hotspots.

Disaster Risk Reduction/WP1 From know how to do how: Adaptation and Resilience to Drought
29
A similar method should be followed to identify the population vulnerability hotspots based on poverty
and employment under agriculture.
Figure 12 Hotspots of population during the 5 years of drought peak (October 2015) in Myanmar based on
(a) high percentage of severely and moderately stunted children, (b) low wealth score and (c) high
percentage of men working in the agricultural sector27
B) Identifying hotspots of high level of agricultural employment and drought
occurrence in Viet Nam
Agriculture is directly impacted by drought, and so is the population employed in the agricultural sector.
Therefore, the data on employment in agriculture can be integrated with drought occurrence data to
identify the hotspots.
Key question
➢ Where are the highest percentages of population employed in agriculture, who are vulnerable due
to drought, located in Myanmar?
Vulnerability indicator
➢ Employment in agriculture
Data sources
➢ The sub-national data on employment under agriculture (.csv/ .xlsx) can be downloaded from
http://www5.worldbank.org/mapvietnam/ .
➢ Drought occurrence data from ESCAP’s APDRN web portal

Disaster Risk Reduction/WP1 From know how to do how: Adaptation and Resilience to Drought
30
1. Joining demographic data with the geographic location data (.shp file)
• A unique id should be generated in vietnam.shp by adding a field in the attribute table and
manually entering data based on the unique id of districts in the agriculture employment
database prior to joining them.
• Add “vietnam.shp” and “emp_agri.csv” in QGIS window.
• Right click on “vietnam.shp” > Properties > Joins.
• Click on “+” at the bottom of the window.
• Choose “unq_id” for Join field and Target field and click “OK”.
• Right click on “vietnam.shp” > Export > Save Feature As> give the file name as
“vietnam_agri.shp” and click “OK”.
2. Interpolating the point data
• Add “vietnam_agri.shp” using in QGIS window.
• Open Processing Toolbox > Search for Ordinary Kriging.
• Add the following details
Points = “vietnam_agri.shp”
Attribute = “emp_agri_perc”
Type of Quality Measure = Standard deviation
Output extent same as the point layer
Cell Size = 0.08333 and “Run”
• Add “vet_agri_krig” as the output file name and save in the desired location.
• Normalize the output and give output file name as “vet_agri_krig_norm”.
3. Identify the risk hotspot
• Multiply “vet_agri_bessel_norm” with the drought data using Processing tools > Raster
Calculator to find out the risk hotspots.
Figure 13 Hotspots of population with high percentage of men and women working in the agricultural sector
during the 5 years of drought peak (2015) in Viet Nam

Disaster Risk Reduction/WP1 From know how to do how: Adaptation and Resilience to Drought
31
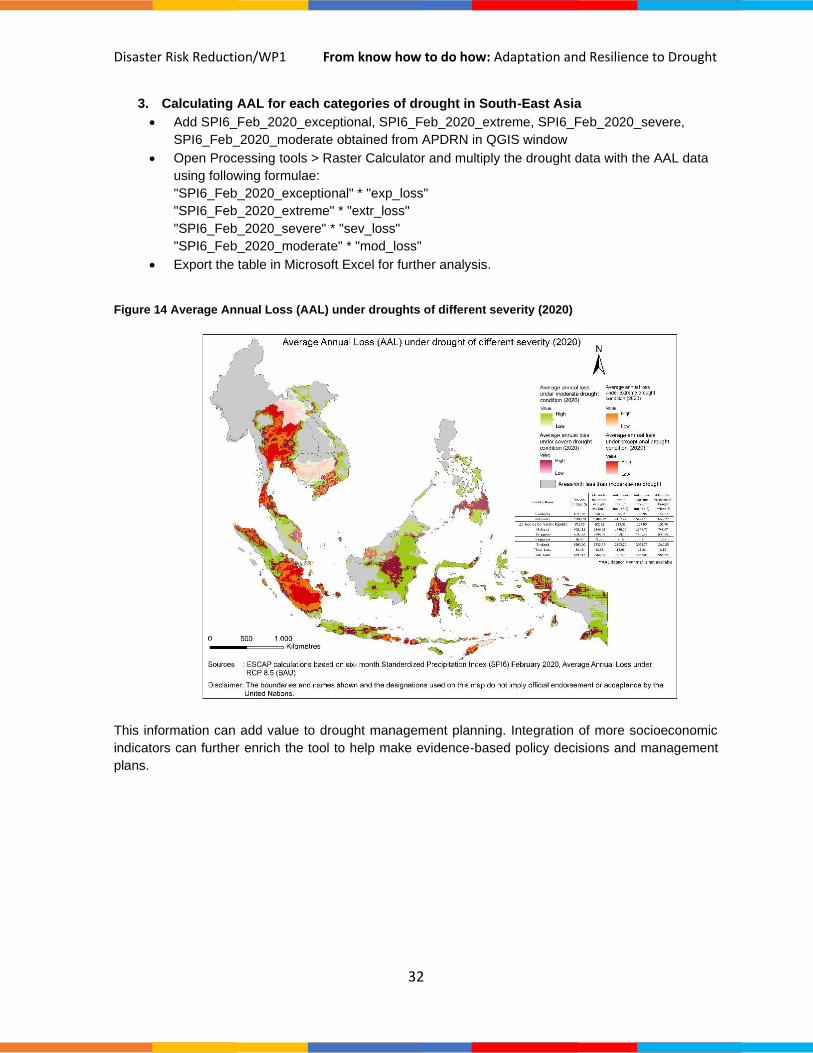
5.2.5 Estimating economic loss due to drought
Economic losses due to disasters is estimated through probabilistic risk models and expressed as the
Average Annual Loss (AAL). It is the expected overall loss per year due to disasters, averaged over
many years.28 ESCAP has estimated the AAL for drought for South-East Asia,29 as well as developed
different drought scenarios for this region. Both data can be used to calculate the spatial distribution of
losses for drought with different intensities.
Key question
➢ What is the spatial distribution of AAL due to drought?
Data sources
➢ AAL and drought occurrence data from ESCAP’s APDRN web portal
1. Calculating AAL for different categories of drought
• Add “SEA_BND” in ArcMap and populate the AAL for drought data for each country in the
attribute table.
• Add 4 fields in the attribute table (mod_loss, sev_loss, extr_loss, expc_loss) following the
same procedure mentioned above.
• Calcuate each categories of loss using the following formulae:
mod_loss = [Loss_m_USD] *15/100
sev_loss = [Loss_m_USD] *25/100
extr_loss = [Loss_m_USD] *35/100
expc_loss = [Loss_m_USD] *45/100
2. Creating raster files for different drought - AAL category
• Open Processing tool > search for Rasterize.
• Input layer is “SEA_BND”, Field to use for burn-in value = mod_loss.
• Give Horizontal and Vertical resolution as 0.0833.
• Under Rasterize click on Save to a File and give name as “mod_loss”, and click “Run”.
• Similarly create raster files for “sev_loss”, “extr_loss” and “expc_loss”.
Assumption:
1. AAL has been used to calculate the economic loss due to drought.
2. If the drought in 2020 continues for 7 months, it will cost 0.34 per cent of GDP,a which is
equivalent to 45 per cent of AAL.
• For exceptional drought, the loss is 45 per cent of AAL.
• For extreme drought, the loss is 35 per cent.
• For severe drought, the loss is 25 per cent.
• For moderate drought, the loss is 15 per cent of AAL.
a Chalwat Sowcharoensuk and Chamadanai Marknual (2020).
Disaster Risk Reduction/WP1 From know how to do how: Adaptation and Resilience to Drought
32
3. Calculating AAL for each categories of drought in South-East Asia
• Add SPI6_Feb_2020_exceptional, SPI6_Feb_2020_extreme, SPI6_Feb_2020_severe,
SPI6_Feb_2020_moderate obtained from APDRN in QGIS window
• Open Processing tools > Raster Calculator and multiply the drought data with the AAL data
using following formulae:
"SPI6_Feb_2020_exceptional" * "exp_loss"
"SPI6_Feb_2020_extreme" * "extr_loss"
"SPI6_Feb_2020_severe" * "sev_loss"
"SPI6_Feb_2020_moderate" * "mod_loss"
• Export the table in Microsoft Excel for further analysis.
Figure 14 Average Annual Loss (AAL) under droughts of different severity (2020)
This information can add value to drought management planning. Integration of more socioeconomic
indicators can further enrich the tool to help make evidence-based policy decisions and management
plans.

Disaster Risk Reduction/WP1 From know how to do how: Adaptation and Resilience to Drought
33
5.3 Adaptation techniques
Countries in South-East Asia have already put in place a set of drought adaptation practices that help
food, water, land and ecosystem to accelerate adaptation actions. Country specific examples are already
listed in the ESCAP publication entitled Ready for the Dry Years: Building resilience to drought in South-
East Asia. Some of the examples are as follows:
Food system:
In a rainfed agricultural system, such as South-East Asia, several crop diversification measures are
undertaken to cushion the crop loss due to drought events. Shifting from monoculture to a multi-cropping
system, both upland cropping and integrated farming are important strategies to enhance the economic
and ecological sustainability of the agricultural system. For efficient resource utilization, the System Rice
Intensification (SRI) technique is undertaken, which can improve the growth of the crop together with its
productivity and resilience. The stress-tolerant and short-maturing varieties of crops have been
experimented successfully, in some drought prone areas, which could avoid crop loss during drought.
To save crops from pest infestation due to prolonged drought conditions, Integrated Pest Management
is another important adaptation tool. All these tools contribute toward building environmental resilience,
developing economic resilience, ensuring nutrition security of the community, as well as promoting
resource conservation.
Water system:
Integrated water resources management (IWRM) is a widely implemented mechanism which ensures a
sustainable water supply to a community during the dry period, improves the socioeconomic condition
of the community through alternative livelihood and enhanced climate resilience. Water accounting
underpins evidence-based monitoring and early warning, builds stronger water governance, and helps
in the sustainable allocation of available water. Groundwater recharge through Managed Aquifer
Recharge (MAR), can overcome spatio-temporal variability of groundwater during drought conditions.
Alternative Wet and Dry (AWD) and Direct Dry Seeding Rice (DDSR) technologies are effective water
conservation techniques to improve the efficiency of irrigation water use without affecting the yield.
Safely treated wastewater and rainwater can be the sources of multi-purpose usage of water that will
help to cope with water scarcity during the dry season and strengthen drought preparedness.
Energy system:
For the energy infrastructures, Governments in South-East Asia have started to develop robust plans
for risk-informed investment and climate resilient infrastructure keeping the future climate scenario in
mind. Risk assessment is a critical part of this plan which will identify the critical assets and prioritize
investments.

Disaster Risk Reduction/WP1 From know how to do how: Adaptation and Resilience to Drought
34
Land system:
Sustainable land-based management practices (SLM), that are identified by UNCCD, are effective for
drought management and mitigation. Many South-East Asian countries have incorporated SLM in their
national adaptation plans. Drought-Smart Land Management (D-SLM) is a unique framework which
centres around the land-drought nexus and promotes sustainable land-based interventions as part of
drought management. Spatial land-use planning can be used to monitor long-term changes in land use
and land cover. Sustainable forest management is another important adaptation tool for water and soil
conservation and for increasing drought resilience.
Ecosystem:
Nature-based solutions are gaining importance as drought management strategies as they enhance an
ecosystem’s capacity to protect the society from the impacts of drought. Ecosystem-based adaptation
measures are sustainable adaptation tools for future uncertain climate conditions, have low maintenance
costs and require voluntary community participation.
5.4 Dynamic drought risk assessment
Drought risk and its impacts depend on the severity and probability of the drought occurrence, the
exposed assets and/or the population and its vulnerability. The variables contributing to drought risk can
be of two types based on their frequency of change. Variables, such as climate, land use soil properties
and socioeconomic factors exhibit significant changes in a longer time frame, generally annual to
decadal, whereas other variables, such as weather, crop status and water resources require a shorter
time frame, months or a season, to show detectable changes. For long-term policy planning, decision-
making and investments, understanding the variables, such as the future climate change scenario or the
nature of socioeconomic changes is essential, information on the drought indicators, such as weather
and crop status are also important for monitoring and immediate response. Many tools are available
online which can provide useful and timely information on such variables, and can guide in drought
adaptation planning. Following are some examples of such online platforms of weather/climate
information for different spatio-temporal scales.

Disaster Risk Reduction/WP1 From know how to do how: Adaptation and Resilience to Drought
35
5.4.1 ASEAN Specialized Meteorological Centre (ASMC)
The ASMC undertakes research and development to
improve scientific understanding and the prediction of
significant weather and climate systems in the South-East
Asia region. It has a web-based weather information
system which provides:
• 12 to 72 hours forecast of surface winds
• Monthly rainfall data across South-East Asia
• Information on weather conditions, such as smoke,
haze, dust, rain, showers etc.
The application can be accessed through
http://asmc.asean.org/home/.
Monthly, seasonal and sub-seasonal climate outlook on
precipitation and temperature for the entire South-East Asia
region is published in this portal. The El Niño Southern
Oscillation (ENSO) conditions are also monitored monthly
and published in the website.
5.4.2 Regional Drought and Crop Yield Information System
(RDCYIS)
The RDCYIS is an integrated web-based information system to facilitate drought monitoring, analysis
and forecasting. It provides current status and seasonal forecast of drought indices in the Mekong river
basin area to implement short and long-term drought adaptation and mitigation measures. The
application provides information on the following drought indices:
• Standardized Precipitation Index for (1 month, 3 months, 6 months and 1 year with 1 – 10 days
interval).
• Soil moisture deficit index (with 1 – 10 days interval).
• Dry spell events (with 1 – 10 days interval).
• Standardized run-off index (1 month, 3 months, 6 months and 1 year with 1 – 10 days interval).
Figure 15 ASMC regional weather forecasting web portal

Disaster Risk Reduction/WP1 From know how to do how: Adaptation and Resilience to Drought
36
Figure 16 Regional drought and crop yield information system by SERVIR and ADPC
These spatial data can be downloaded in both Raster and Vector format and the attribute data can be
downloaded in “.csv” or “.xlsx” format for further analysis. Interactive graphs and charts can also be
generated online using the data. The application can be accessed through https://rdcyis-
servir.adpc.net/map
5.4.3 Climate Change Knowledge Portal (CCKP)
The CCKP provides global data on historical and future climate variables, such as temperature and
precipitation. The historical data is available from 1901 to 2016, while the future projection data is
available till 2099. The data can be visualized online through maps and/or as an annual cycle chart for
three different geographical extents, namely watershed, country and region. This information can be
analysed at various spatio-temporal levels. The application can be access through
https://climateknowledgeportal.worldbank.org/

Disaster Risk Reduction/WP1 From know how to do how: Adaptation and Resilience to Drought
37
Figure 17 Climate Change Knowledge Portal
The historical data on temperature and precipitation are presented as monthly average and annual
average (annual total in case of precipitation). The future projections are expressed though several other
indices of temperature and precipitation. For example, Maximum Daily Rainfall (10 - 25-yr RL), Days
with Rainfall > 50mm, Summer Days (Tmax >25°C) and Hot Day (Tmax >35°C). CCKP also provides
several agriculture indicators (Projected Change in Growing Season Length, Days of Consecutive Dry
Spell, Days of Consecutive Wet Spell and Rainfall Seasonality) and drought indicators (Mean Drought
Index, Severe Drought Likelihood, Monthly Rainfall Range and Annual Rainfall Range). These data can
also be downloaded in “.xlsx” or “.csv” formats for further analysis and planning purposes.

Disaster Risk Reduction/WP1 From know how to do how: Adaptation and Resilience to Drought
38
• It is important to include water-food-energy nexus into the drought adaptation and
planning process
Drought impedes the overall development of a society through its long-lasting impacts on key sectors,
such as water, food and energy and their associated sectors. The impacts of drought are compounded
due to the complex interlinkages between water, food and energy. Therefore, drought adaptation should
include a consideration of this nexus into policy planning to increase resilience against climate change
and drought impacts and reduce vulnerability.
• Multisectoral development professionals in the water, energy, environment and
agriculture sector play a very important role in developing policy decisions on
drought adaptation
Policy decisions on drought adaptation should be risk-informed and evidence-based. Such decisions
should also connect with the nation’s climate change policy and sustainable development goals. The
practical and first-hand experience of development professionals, together with their skills to identify risk
and knowledge about several tools and technologies, should be utilized to develop robust adaptation
guidelines and policy planning.
• The Add-on tool is a key instrument in developing evidence on the social and
economic impacts of drought in order to drive policy decisions
Although the UNCCD drought toolbox has an extensive application in monitoring drought indicators,
identifying risks and vulnerabilities and propose mitigation or adaptation measures, the add-on tools on
the socioeconomic aspects of drought can enhance its analytical output and bring about socioeconomic
resilience to the communities. This tool, if utilized efficiently on a case to case basis, can be instrumental
in reducing the impacts of drought.
Chapter 6: Conclusions

Disaster Risk Reduction/WP1 From know how to do how: Adaptation and Resilience to Drought
39
ASEAN Cooperation on Environment (2017). Fifth ASEAN State of the Environment Report (SOER5).
Jakarta: ASEAN Secretariat.
Australian Government, Department of Agriculture, Water and the Environment (2020). History of
Drought Policy and Programs. Available at https://www.agriculture.gov.au/ag-farm-
food/drought/drought-policy/history. Accessed on 3 August 2020.
Baas, Stephan, and Selvaraju Ramasamy (2008). Community Based Adaptation in Action: A case study
from Bangladesh. Project Summary Report (Phase I). Rome, Italy: FAO.
Barron, J. ed. (2009). Rainwater harvesting: a lifeline for human well-being. United Nations Environment
Programme (UNEP) Stockholm Environment Institute (SEI).
Fox, Jefferson, and Jean-Christophe Castella (2013). Expansion of Rubber (Hevea brasiliensis) in
Mainland Southeast Asia: What are the Prospects for Small Holders? Journal of Peasant
Studies, vol. 40, No. 1, pp. 155-170.
Gao, J. (2020). Global 1-km Downscaled Population Base Year and Projection Grids Based on the
Shared Socioeconomic Pathways, Revision 01. Palisades, NY: NASA Socioeconomic Data and
Applications Center (SEDAC). Available at https://doi.org/10.7927/q7z9-9r69. Accessed on 1
August 2020.
German Cooperation (2019). Thailand, Australia and Germany pool their efforts to strengthen data
management and M&E of adaptation in Thailand's water sector. Available at https://www.thai-
german-cooperation.info/en_US/fighting-against-climate-change-thailand-australia-and-
germany-pool-their-efforts-to-strengthen-data-management-and-me-of-adaptation-in-
thailands-water-sector/
Global Commission on Adaptation (2019). Adapt Now: A Global Call for Leadership on Climate
Resilience. Washington, D.C.: World Resources Institute.
Global Data Lab (2018). Subnational Human Development Index (HDI) Version 1. Available at
https://globaldatalab.org/shdi/download_files/. Accessed on 10 May 2020.
Gnanasagaran, Angaindrankumar (2018). Financing hydropower in Southeast Asia. The ASEAN Post.
21 December. Available at https://theaseanpost.com/article/financing-hydropower-southeast-
asia-
0#:~:text=According%20to%20the%20International%20Renewable,Indochinese%20region%2
0and%20the%20Philippines. Accessed on 28 July 2020.
Hoff, Holger, and others (2019). A Nexus Approach for the MENA Region—From Concept to Knowledge
to Action. Frontiers in Environment Science, vol. 7, No. 48.
International Hydropower Association (2020). 2020 Hydropower Status Report. Available at
https://www.hydropower.org/publications/2020-hydropower-status-report-ppt. Accessed on 31
August 2020.
McLeman, Robert A. and Lori M. Hunter (2010). Migration in the context of vulnerability and adaptation
to climate change: insights from analogues. WIREs Climate Change, vol. 1 No. 3, pp. 450-461.
Bibliography

Disaster Risk Reduction/WP1 From know how to do how: Adaptation and Resilience to Drought
40
Palada, M. and others (2011). Farmers’ experiences with low-pressure drip irrigation for vegetable
production in Southeast Asia and the Pacific. Acta Horticulturae, No. 921_5, pp. 49-56.
Pham, V.H.T., and others (2018). Government intervention and farmers’ adaptation to saline intrusion:
A case study in the Vietnamese Mekong Delta. International Journal on Advanced Science,
Engineering, Information Technology, vol. 8, No.5.
Preston, Nigel, and Helena Clayton, eds. (2003). Rice–shrimp farming in the Mekong Delta: biophysical
and socioeconomic issues. ACIAR Technical Reports No. 52e. Canberra, Australia.
Sabatier P. A. and D. Mazmanian (1995). A conceptual framework of the implementation process. In S.
Z. Theodolou and M. A. Cahn, Public Policy: The Essential Readings. Upper Saddle River, N.J.:
Prentice Hall, Inc.
Sowcharoensuk, Chalwat, and Chamadanai Marknual (2020). Severe drought: Agriculture sector takes
direct hit and spillover effects on manufacturing supply chains. Research Intelligence, pp. 1 -
11.
Swe, Lwin Maung Maung and others (2015). Farmers' perception of and adaptation to climate change
impacts in the Dry Zone of Myanmar. Climate and Development, vol. 7, No. 5, pp. 437–453.
Thomas Tanner, and others (2015). The triple dividend of resilience: Realising Development Goals
Through the Multiple Benefits of Disaster Risk Management. Washington, D.C.: Overseas
Development Institute, Global Facility for Disaster Risk Reduction, and World Bank.
Uexkull, Nina von (2014). Sustained drought, vulnerability and civil conflict in Sub-Saharan Africa.
Political Geography, vol. 43, pp. 16 - 26.
United Nations Development Programme (UNDP) (2019a). Exploring indicators to monitor and evaluate
adaptation in Thailand’s agricultural sectors. Available at https://www.adaptation-
undp.org/exploring-indicators-monitor-and-evaluate-adaptation-thailand%E2%80%99s-
agricultural-sectors
---- (2019b). Terminal Evaluation: Addressing climate change risks on water resources and food security
in dry zone of Myanmar. Available at https://erc.undp.org/evaluation/evaluations/detail/9682.
Accessed 4 May 2020..
United Nations, Economic and Social Commission for Asia and the Pacific (ESCAP) (2019). Asia-Pacific
Disaster Report 2019: The Disaster Riskscape Across Asia-Pacific. Sales No. E.19.II.F.12.
---- (2020). Ready for the Dry Years: Building resilience to drought in South-East Asia. United Nations
publication.
United States Agency for International Development (USAID) (2014). Demographic and Health Surveys
(DHS) Programme for Cambodia. Available at https://dhsprogram.com/data/. Accessed on 25
May 2020.
----- (2016). Demographic and Health Surveys (DHS) Programme for Myanmar. Available at
https://dhsprogram.com/data/. Accessed on 25 May 20202.
UNISDR (2015). Global Assessment Report on Disaster Risk Reduction, Making Development
Sustainable: The Future of Disaster Risk Management. Geneva: United Nations Office for
Disaster Risk Reduction (UNISDR).

Disaster Risk Reduction/WP1 From know how to do how: Adaptation and Resilience to Drought
41
Vernooy, R. ed. (2015). Effective implementation of crop diversification strategies for Cambodia, Lao
PDR and Vietnam: Insights from past experiences and ideas for new research. Rome, Italy:
Bioversity International
World Bank Open Data (2009). Vietnam. Available at http://www5.worldbank.org/mapvietnam/.
Accessed on 8 September 2020.
WorldPop Open Population Repository (2016). Asia Continental Population Datasets (2000 – 2020).
Available at www.worldpop.org. Accessed on 15 August 2020.
World Resource Institute (WRI) (2015). Aqueduct Water Stress Projections Data. Available at
https://www.wri.org/resources/data-sets/aqueduct-water-stress-projections-data. Accessed on
24 May 2020.

Disaster Risk Reduction/WP1 From know how to do how: Adaptation and Resilience to Drought
42
Sector Driver to develop adaptation strategy Tools/ Data
Agriculture
(Food)
Type of critical/ commercial food crops Land cover map
Value of critical/ commercial food crops Land cover map
Harvest cycle critical/ commercial food crops
Crop Health of critical/ commercial food crops Vegetation indices
(NDVI, VHI etc.)
Yield and production of critical/ commercial food crops
Input (fertilizer/ pesticides) of critical/ commercial food
crops
Statistical data on
consumption
Irrigation infrastructure Statistical data
Livestock (Number, type, value, fodder) Statistical data
Aquaculture (Number, type, value, location) Statistical data
Water
Total renewable freshwater available Statistical data
Groundwater availability Statistical data/
Groundwater map
Seasonal variability of groundwater Statistical data/
Groundwater map
Water levels at rivers and reservoirs Statistical data
Salinity Statistical data/
salinity map
Water stress and scarcity Water stress index
Water demand and consumption – all sectors Statistical data
Water-use efficiency Statistical data
Wastewater generation and treatment capacity Water recycling
capacity
Energy
Water levels at rivers and reservoirs Statistical data
Location of hydropower Statistical data and
map
Consumption and production of hydropower Statistical data
Land
Soil type Soil maps
Soil moisture and variability Soil moisture index
Soil salinity Soil maps
Topography
Digital Elevation
Model/Digital
Terrain Model/
Slope
Land Use/ Land Cover Land Use/ Land
Cover dynamics
Degraded land Land Use/ Land
Cover map
Socioeconomic Population and demography Statistical data
Annexure I
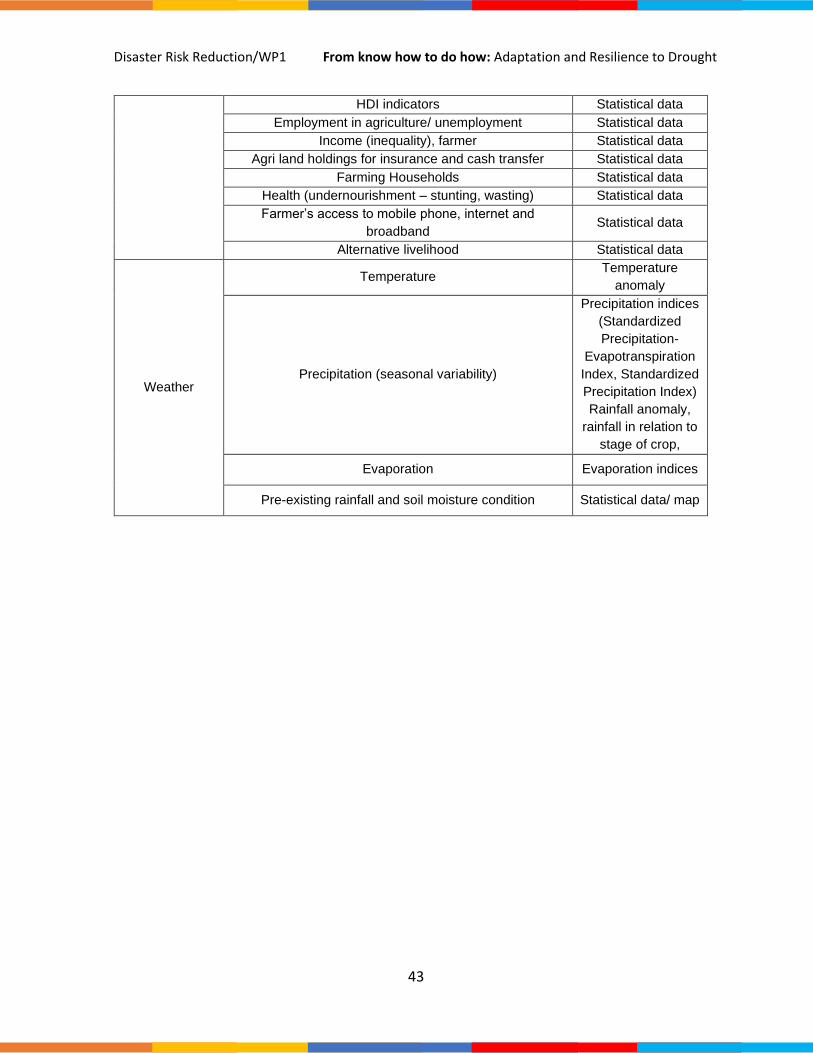
Disaster Risk Reduction/WP1 From know how to do how: Adaptation and Resilience to Drought
43
HDI indicators Statistical data
Employment in agriculture/ unemployment Statistical data
Income (inequality), farmer Statistical data
Agri land holdings for insurance and cash transfer Statistical data
Farming Households Statistical data
Health (undernourishment – stunting, wasting) Statistical data
Farmer’s access to mobile phone, internet and
broadband Statistical data
Alternative livelihood Statistical data
Weather
Temperature Temperature
anomaly
Precipitation (seasonal variability)
Precipitation indices
(Standardized
Precipitation-
Evapotranspiration
Index, Standardized
Precipitation Index)
Rainfall anomaly,
rainfall in relation to
stage of crop,
Evaporation Evaporation indices
Pre-existing rainfall and soil moisture condition Statistical data/ map

Disaster Risk Reduction/WP1 From know how to do how: Adaptation and Resilience to Drought
44
1 ESCAP (2020) 2 ESCAP (2020). 3 Robert A. McLeman, and Lori M. Hunter (2010). 4 Nina von Uexkull (2014). 5 ESCAP (2020). 6 Ibid. 7 ESCAP (2020). 8 Global Commission on Adaptation (2019). 9 Thomas Tanner and others (2015). 10 UNDP (2019b). 11 Nigel Preston and Helena Clayton (2003). 12 J. Barron (2009). 13 Lwin Maung Maung Swe and others (2015). 14 ESCAP (2020). 15 Stephan Baas and Selvaraju Ramasamy (2008). 16 ESCAP (2020). 17 Jefferson Fox and Jean-Christophe Castella (2013). 18 ASEAN Cooperation on Environment (2017). 19 Angaindrankumar Gnanasagaran (2018). 20 International Hydropower Association (2020). 21 ASEAN Cooperation on Environment (2017). 22 ESCAP (2020). 23 Ibid. 24 ESCAP (2020). 25 P. A. Sabatier, and D. Mazmanian (1995). 26 The detailed content and user’s guideline are available at https://knowledge.unccd.int/drought-toolbox 27 ESCAP (2020). 28 UNISDR (2015). 29 ESCAP (2019).
Endnote