ict and intangible capital: complementary relations and industry productivity growth
TRANSCRIPT
ICT and Intangible Capital:Complementary Relations and Industry Productivity Growth
C. Corrado, (The Conference Board), New YorkJ. Haskel, (Imperial College, CEPR and IZA), LondonC. Jona-Lasinio, (ISTAT and LUISS Lab), Rome
World Conference on Intellectual Capital for Communities - 11th Edition28-29 May 2015, Paris
C. Jona-Lasinio IC11 - "ICT Intangibles and Complementarities" May 28-29, 2015 1 / 22

Introduction
• Background literature• ICT and new sources of growth in the EU countries:descriptive evidence
• ICT, R&D and Non-R&D Intangible Capital:complementary relations and growth
• New policy challenges
C. Jona-Lasinio IC11 - "ICT Intangibles and Complementarities" May 28-29, 2015 2 / 22
Defining intangible assets
Computerized Information
Innovative Property
Economic Competencies
• Software • Databases
• R&D • Mineral exploration • Entertainment and artistic originals • Design and other new product development costs
• Branding (mkt. research and long-lived advertising) • Firm-specific human capital (training) • Organizational capital (business process investment)
Broad&category&&&&&Type&of&Investment&&&&&&&&&&&&&&&&&
The$CHS$framework$
Non-R&D intangibles: what are they?
C. Jona-Lasinio IC11 - "ICT Intangibles and Complementarities" May 28-29, 2015 3 / 22

Motivation
• Empirical evidence shows that once intangible capital is includedin a sources-of-growth analysis it accounts for 20-33% of labourproductivity growth in the market sector of the US and EUeconomies.
• As a consequence, the measurement of intangible investment is apotentially important addition to both sources-of-growth analysisand national accounting practice.
• The inclusion of different types of capital (and labour) inputs intoa sources-of-growth model is a relevant improvement in theunderstanding of the drivers of productivity changes due tocomposition shifts to higher-performing types.
C. Jona-Lasinio IC11 - "ICT Intangibles and Complementarities" May 28-29, 2015 4 / 22

Aim
• Investigate the productivity effects of unmeasured intangiblecapital and its possible synergies with ICT.
• Our main assumption is that the interaction between ICT andco-investment in intangible capital is a relevant omitted effect in aproduction function.
C. Jona-Lasinio IC11 - "ICT Intangibles and Complementarities" May 28-29, 2015 5 / 22

Background literature I
• ICT is traditionally described as a general purpose technology(Bresnahan and Trajtenberg,1995) economically beneficialbecause it facilitates complementary innovations that in turn leadto productivity increases (Brynjolfsson and Hitt (2000)).
• But the causal relationship between ICT adoption andproductivity growth is complex and not yet fully explored.
• Microeconomic evidence demonstrates that the link fromfirm-level ICT adoption to productivity growth is composite,emphasysing for example the relevance of co-investments intraining and organizational change, to generate competitiveadvantage (e.g., Bresnahan, Brynjolfsson, and Hitt, 2002;Brynjolfsson, Hitt, and Yang, 2002)).
C. Jona-Lasinio IC11 - "ICT Intangibles and Complementarities" May 28-29, 2015 6 / 22
Background literature II
• Macroeconomic evidence on the joint/disjoint contribution of ICTand intangibles to industry productivity growth is still scant,mainly because of lack of industry data on intangibles.
• Some macroeconomic productivity studies have nonethelesssuggested that the returns to ICT and productivity growth arehigher once proxies for intangibles are included, (e.g., Basu,Fernald, Oulton, Srinivasan (2004) and Acraya and Basu, (2010)).
• Other papers have explored directly the linkage between ICT andR&D but with differing results (Cerquera and Klein, (2008);Polder et al., (2009); Hall et al (2012)).
C. Jona-Lasinio IC11 - "ICT Intangibles and Complementarities" May 28-29, 2015 7 / 22

Background literature III
• Intangible capital has emerged as a new relevant source ofproductivity growth in the U.S. (Corrado, Hulten and Sichel,2005, 2009) and in the European economies (Corrado, Haskel,Jona-Lasinio, Iommi, 2012 and 2014a).
• Corrado, Haskel, Jona-Lasinio (2014), found that in a productionfunction the estimated output elasticities of ICT capital arereduced when intangibles are introduced, suggesting that, asconjectured in much of the pre-intangible data literature, returnsto ICT depend crucially on the presence of unmeasurableintangibles.
C. Jona-Lasinio IC11 - "ICT Intangibles and Complementarities" May 28-29, 2015 8 / 22
The data
• INTAN-Invest harmonized cross country industry estimates ofintangible investments (www.INTAN-Invest.net)• Country coverage: Austria, Belgium, Germany, Denmark,Finland, France, Greece, Netherlands, Italy, Ireland, Portugal,Spain, Sweden and UK
• Industry coverage: NACE Rev2 sectors A through N(excluding real estate) plus sectors R and S.
• Time coverage: 1995-2010• EUKLEMS (2012 release)
C. Jona-Lasinio IC11 - "ICT Intangibles and Complementarities" May 28-29, 2015 9 / 22

Intangible investment and growth in the Europeancountries and industries
Intangible investments (chain linked volumes):compounded average rates of growth 1995-2010
0.00#
1.00#
2.00#
3.00#
4.00#
5.00#
6.00#
7.00#
8.00#
9.00#
10.00# Manufacturing+ Services+
C. Jona-Lasinio IC11 - "ICT Intangibles and Complementarities" May 28-29, 2015 10 / 22

ICT, R&D and Non-R&D investment intensity in the EU:manufacturing vs services
0.0$
1.0$
2.0$
3.0$
4.0$
5.0$
6.0$
7.0$
8.0$
at$ be$ de$ dk$ es$ fi$ fr$ it$ nl$ pt$ se$ uk$
ICT$intensity:$manufacturing$and$services$$(average'shares'of'value'added)'
manC serC
0.0$
2.0$
4.0$
6.0$
8.0$
10.0$
12.0$
14.0$
at$ be$ de$ dk$ es$ fi$ fr$ it$ nl$ pt$ se$ uk$
Intangible$(no$R&D)$intensity:$manufacturing$and$services$(average'shares'of'value'added)'
manC serC
0.0$
2.0$
4.0$
6.0$
8.0$
10.0$
12.0$
at$ be$ de$ dk$ es$ fi$ fr$ it$ nl$ pt$ se$ uk$
R&D$intensity:$manufacturing$and$services$$(average'shares'of'value'added)'
manC serC
Non-R&D intangibles include: Design, Advertising and Market research, Organizational capital, Training and artistic originals
C. Jona-Lasinio IC11 - "ICT Intangibles and Complementarities" May 28-29, 2015 11 / 22
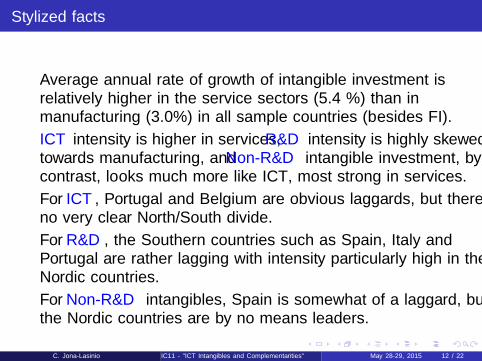
Stylized facts
• Average annual rate of growth of intangible investment isrelatively higher in the service sectors (5.4 %) than inmanufacturing (3.0%) in all sample countries (besides FI).
• ICT intensity is higher in services, R&D intensity is highly skewedtowards manufacturing, and Non-R&D intangible investment, bycontrast, looks much more like ICT, most strong in services.
• For ICT, Portugal and Belgium are obvious laggards, but there isno very clear North/South divide.
• For R&D, the Southern countries such as Spain, Italy andPortugal are rather lagging with intensity particularly high in theNordic countries.
• For Non-R&D intangibles, Spain is somewhat of a laggard, butthe Nordic countries are by no means leaders.
C. Jona-Lasinio IC11 - "ICT Intangibles and Complementarities" May 28-29, 2015 12 / 22

Sources of labour productivity growth: 1995-2009
!1.50&
!1.00&
!0.50&
0.00&
0.50&
1.00&
1.50&
2.00&
2.50&
3.00&
Austria& Germany& Spain& Finland& France& Italy& Netherlands& UK&TFP& 0.99& 0.34& !1.05& 1.64& 0.17& !0.79& 0.76& 0.58&
Non!R&D& 0.22& 0.18& 0.11& 0.30& 0.32& 0.11& 0.32& 0.42&
R&D& 0.21& 0.13& 0.08& 0.42& 0.11& 0.03& 0.10& 0.09&
NonICT& 0.10& 0.39& 0.74& !0.27& 0.33& 0.35& 0.25& 0.48&
ICT& 0.40& 0.35& 0.41& 0.37& 0.32& 0.23& 0.49& 0.80&
Labor&composiNon& 0.26& 0.11& 0.38& 0.17& 0.46& 0.28& 0.32& 0.41&
C. Jona-Lasinio IC11 - "ICT Intangibles and Complementarities" May 28-29, 2015 13 / 22
Broaden our perspective for productivity analysis:spillovers and complementarities
PRODUCTIVITY
ICT
Non R&D INTG
R&D
INNOVATION
C. Jona-Lasinio IC11 - "ICT Intangibles and Complementarities" May 28-29, 2015 14 / 22

Extended framework
• Besides the direct growth contribution of each single capital asset(solid blue arrows) there are relevant synergies between them(dashed green arrows) possibly affecting productivity growth:• Complementarities• Spillover effects
• Are the spillovers (CHJ, 2014) the product of knowledge diffusionor complementarity with ICT (or both)?
C. Jona-Lasinio IC11 - "ICT Intangibles and Complementarities" May 28-29, 2015 15 / 22

ICT versus Intangible, Non-R&D and R&D capital stocks
-.05
0.0
5.1
Dln
KH_I
ntan
g
-.1 0 .1 .2 .3DlnKH_ICT
“Fr” “De” “Fi” “Uk” “It” “Es” “Nl” “At” Fitted values
(a) ICT vs Intangibles
-.05
0.0
5.1
Dln
KH_N
on R
&D In
tang
ible
s
-.1 0 .1 .2 .3DlnKH_ICT
“Fr” “De” “Fi” “Uk” “It” “Es” “Nl” “At” Fitted values
(b) ICT vs Non-R&D Intangibles
-.05
0.0
5.1
.15
Dln
KH_R
&D
-.1 0 .1 .2 .3DlnKH_ICT
“Fr” “De” “Fi” “Uk” “It” “Es” “Nl” “At” Fitted values
(c) ICT vs R&D
Figure 4. : ICT versus Intangible, Non-R&D and R&D capital stocks
Note: Figure shows first di↵erences, country/industries, 1995-2010.
Non-R&D intangible capital is strongly correlated with ICT (0.6) but less correlated is R&D
(0.3). Interestingly, decomposing the correlations of Non-R&D intangibles into its main asset
components reveals that organizational capital, brands and design are strongly correlated
with ICT as suggested by the above-cited literature.
15
C. Jona-Lasinio IC11 - "ICT Intangibles and Complementarities" May 28-29, 2015 16 / 22

Exploring complementarities between ICT and Intangibles:Econometric strategy
∆ln(Qi,c,t/Hi,c,t) = α1∆ln(K ICTi,c,t/Hi,c,t) + α2∆ln(KNonICT
i,c,t /Hi,c,t)
+ α3∆ln(Ri,c,t/Hi,c,t) + α4∆ln(Ri,c,t/Hi,c,t) ∗ ln(K ICT/H)i,c
+ α5ln(K ICT/H)i,c + α6∆ln(L/H)i,c,t + λi + λc + λt + ηi,c,t .
where all variables refer to sector i , country c at time t:
• (Q)i,c,t is value added;
• (H)i,c,t is total hours worked;
• (KNonICT )i,c,t and (K ICT )i,c,t are Non ICT and ICT capital;
• (R)i,c,t is intangible capital;
• (L)i,c,t is labour quality;
• K ICT/H)i,c denotes country-industry’s average (log) ICT intensity;
• λi , λc , λt are a set of industry, country and time dummies.
C. Jona-Lasinio IC11 - "ICT Intangibles and Complementarities" May 28-29, 2015 17 / 22

Estimation results: augmented production function
Table 3—: Augmented production function (dependent variable: �ln(Q/H)i,c,t
(1) (2) (3) (4) (5) (6) (7) (8) (9) (10)
VARIABLES
�ln(L/H)i,c,t�1 0.16* 0.20** 0.34*** 0.32*** 0.28*** 0.34*** 0.28*** 0.40*** 0.29*** 0.26***(1.92) (2.40) (4.77) (3.90) (3.45) (4.72) (3.35) (5.06) (3.59) (3.13)
�ln(KNon�ICT /H)i,c,t 0.18*** 0.12** 0.28*** 0.12** 0.11** 0.27*** 0.14*** 0.06 0.22*** 0.15***(3.49) (2.46) (6.62) (2.24) (2.31) (6.09) (2.74) (1.14) (4.00) (2.87)
�ln(KICT /H)i,c,t 0.12*** 0.08*** 0.11*** 0.18*** 0.12*** 0.12*** 0.15*** 0.13*** 0.13*** 0.15***(4.76) (3.14) (5.24) (6.84) (4.73) (5.03) (5.84) (5.28) (5.14) (5.77)
�ln(R/H)i,c,t 0.07 0.04(1.37) (0.76)
�ln(RExcl�R&D/H)i,c,t 0.27*** 0.20***(5.94) (4.05)
�ln(RR&D/H)i,c,t -0.01(-0.50)
ln(KICT /H)i,c 0.01** 0.01* -0.00 0.01*** 0.01*** 0.00 0.01***(2.47) (1.83) (-0.17) (2.68) (3.91) (0.72) (2.76)
�ln(R/H)i,c,t ⇤ ln(KICT /H)i,c 0.06**(2.49)
�ln(RExcl�R&D/H)i,c,t ⇤ ln(KICT /H)i,c 0.04*(1.78)
�ln(RR&D/H)i,c,t ⇤ ln(KICT /H)i,c 0.00(0.44)
�ln(RORG/H)i,c,t ⇤ ln(KICT /H)i,c 0.04*(1.93)
�ln(RTRAIN/H)i,c,t ⇤ ln(KICT /H)i,c 0.05**(2.35)
�ln(RDES/H)i,c,t ⇤ ln(KICT /H)i,c 0.09***(4.14)
�ln(RMKT /H)i,c,t ⇤ ln(KICT /H)i,c 0.05***(2.79)
�ln(RORG/H)i,c,t 0.09*(1.74)
�ln(RTRAIN/H)i,c,t 0.35***(6.09)
�ln(RDES/H)i,c,t 0.08(1.37)
�ln(RMKT /H)i,c,t 0.09*(1.79)
Observations 528 528 440 528 528 440 528 528 517 528R-squared 0.34 0.38 0.46 0.40 0.42 0.46 0.41 0.48 0.43 0.43
Notes to table. T-statistics in brackets. *** p¡0.01, ** p¡0.05, * p¡0.1. Final four columns also include �ln(R �Ra/H)i,c,t where R(a) is the column asset.
17
C. Jona-Lasinio IC11 - "ICT Intangibles and Complementarities" May 28-29, 2015 18 / 22

Estimation results:marginal effects of intangibles on productivity growth
-.4-.2
0.2
.4Ef
fect
s on
Fitt
ed V
alue
s
-3 -2 -1 0 1 2ICT/H
All intan
-.10
.1.2
.3.4
Effe
cts
on F
itted
Val
ues
-3 -2 -1 0 1 2ICT/H
Non-R&D intan
-.1-.0
50
.05
Effe
cts
on F
itted
Val
ues
-3 -2 -1 0 1 2ICT/H
R&D
-.2-.1
0.1
.2.3
Effe
cts
on F
itted
Val
ues
-3 -2 -1 0 1 2ICT/H
Org
0.2
.4.6
Effe
cts
on F
itted
Val
ues
-3 -2 -1 0 1 2ICT/H
Train
-.4-.2
0.2
.4Ef
fect
s on
Fitt
ed V
alue
s
-3 -2 -1 0 1 2ICT/H
Design
-.4-.2
0.2
.4Ef
fect
s on
Fitt
ed V
alue
s
-3 -2 -1 0 1 2ICT/H
Mkting
Figure 5. : Marginal effect of intangible capital assets on productivity growth
The positive interaction e↵ects between ln(KICT /H) and �lnR/H suggests that labour
productivity growth in above-average ICT intensive countries-industries was faster in countries-
industries experiencing higher increases in intangible capital accumulation �lnR, or that ICT
capital and intangible capital are complements in production. This result is represented in
Figure 5 which shows the marginal e↵ect of �lnR/H between the 5th and 95th percentiles of
the distribution of (KICT /H), with shading representing the 95 percent confidence interval
where the conditions under which intangible capital accumulation has statistically significant
e↵ect on productivity growth are met.
As expected, in all cases the marginal e↵ect is increasing as the degree of ICT intensity
increases. In fact, the confidence intervals show that the marginal e↵ect of �lnR/H is only
statistically positive at quite high levels of ln(KICT /H) (with the exception of training, where
the marginal e↵ect is positive throughout).
To get some idea of the numbers involved, the top left panel shows the marginal e↵ect
of �lnR/H when ln(KICT /H) > 1. This turns out to be above the 60th percentile in the
distribution of ln(KICT /H). At the 60th percentile the elasticity is 0.10 whereas at the 95th
percentile it is 0.16.
Note finally that the interaction with the log of ICT intensity suggests the marginal e↵ect
is bounded from becoming very high at high levels of intensity. The marginal e↵ect thus has
diminishing returns in the level of ICT-intensity, which makes economic sense.
18
C. Jona-Lasinio IC11 - "ICT Intangibles and Complementarities" May 28-29, 2015 19 / 22

Estimation results
• The positive interaction effects between average ICT andintangibles suggests that labour productivity growth inabove-average ICT intensive countries-industries was faster incountries-industries experiencing higher increases in intangiblecapital accumulation, or that ICT capital and intangible capitalare complements in production.
• The marginal effect is increasing as the degree of ICT intensityincreases.
C. Jona-Lasinio IC11 - "ICT Intangibles and Complementarities" May 28-29, 2015 20 / 22

Conclusions I
• Intangible capital accumulation more dynamic in services thanmanufacturing (excluding Finland)
• R&D, Non-R&D and ICT average intensities:• Broad differences between Northern and Southern Europe• Northern countries relatively more intangible and ICT intensive than Southern
countries• Services are more intensive in Non-R&D Intangibles and ICT than
manufacturing
• The contribution of intangibles to labour productivity growth issimilar in both manufacturing and services (about 25% of labourproductivity growth).
• Non-R&D intangible capital accounts for a relatively higher share of labourproductivity growth compared to R&D.
C. Jona-Lasinio IC11 - "ICT Intangibles and Complementarities" May 28-29, 2015 21 / 22

Conclusions II
• ICT and intangibles are complement in the production process (arelation holding for sub-classes of intangible assets).
• Intangible assets may have a stronger effect on productivitygrowth when interacted with other variables, particularly with ICT.
• The strong correlation between Non-R&D intangibles and ICTsuggests they are strategic variables in the innovation policyagenda.
• Policymakers need more accurate data to identify sound policiesto foster investment in innovation and the diffusion of innovativeactivity.
C. Jona-Lasinio IC11 - "ICT Intangibles and Complementarities" May 28-29, 2015 22 / 22