ict benchmarking: better practice roadmap archived · ict benchmarking: better practice roadmap |...
TRANSCRIPT

ICT Benchmarking: Better Practice Roadmap | 1
ICT Benchmarking: Better Practice Roadmap
PART 1 | VERSION 1.0
Archive
d
ICT Benchmarking: Better Practice Roadmap | 2
Licensing
The Department of Finance and Deregulation is licensed to use, reproduce, adapt, modify, distribute and communicate the information contained in the ICT Benchmarking: Better Practice Roadmap document. With the exception of the Commonwealth Coat of Arms, and subject to any copyright notices contained in individual documents, all material presented in the ICT Benchmarking: Better Practice Roadmap document is provided under a Creative Commons Australia Licence (Attribution-NonCommercial 3.0 Unported) (http://creativecommons.org/licenses/by-nc/3.0/). To the extent that copyright subsists in a third party (such as in the material relating to the definitions of cost elements and service towers at pages 6 to 8), permission will be required from the third party to reuse the material.
The document must be attributed: “ICT Benchmarking: Better Practice Roadmap”. Use of the Coat of Arms The terms under which the Coat of Arms can be used are detailed on the following website: http://www.itsanhonour.gov.au/coat-arms/. Contact us Inquiries regarding the licence and any use of this data are welcome at: ICT Skills, Capability and Investment Branch Australian Government Information Management Office Department of Finance and Deregulation John Gorton Building King Edward Terrace Parkes ACT 2600 Email: [email protected] The capability maturity model used in this document is loosely aligned with CMM and other maturity model principles, but it is in no way endorsed by Carnegie Mellon Software Engineering Institute, or represented as a valid CMM or CMMI-compatible product.
CMM, CMMI and Capability Maturity Model are registered in the US Patent & Trademark Office by Carnegie Mellon University.
Archive
d
ICT Benchmarking: Better Practice Roadmap | 3
Contents
1. Executive Summary 4 1.1 Purpose 4 1.2 Roadmap to improved ICT Benchmarking 4 1.3 The Benefits of Improving Benchmarking Maturity 5
2. ICT Benchmarking Roadmap 7 2.1 Capability Maturity Model 7 2.2 Strategies to Improve Maturity 9 2.3 Level 1 to Level 2 9 2.4 Level 2 to Level 3 10 2.5 Level 3 to Level 4 10 2.6 Level 4 to Level 5 11 2.7 Implementation Assistance 12
3. Models for Preparing Cost and Personnel Data 13 3.1 Preparing Cost and Personnel Data 13 3.2 Investment 15
4. Volume Information 16 4.1 Collecting Volume Data 16
Attachments Separate document Part 2
Archive
d

1. Executive Summary
A mature ICT organisation actively manages ICT expenditure; the benchmarking process is integrated within the
management planning and control framework.
1.1 Purpose Benchmarking is the process of improving performance by continuously identifying, understanding, and adapting practices and processes.
The Australian Government conducts ICT Benchmarking to measure improvement in the efficiency and effectiveness of ICT services in Financial Management and Accountability Act agencies.
This Guide has been developed to:
• improve the quality of the benchmarking data; and
• streamline the preparation process for agencies.
The Guide provides a number of alternative solutions for preparing ICT benchmarking data, which can be tailored to the individual requirements of agencies and the level of investment that is considered appropriate. The proposed solutions are based on actual working models from Australian Government agencies.
The Guide, intended for Chief Information Officers, Chief Financial Officers, senior managers, and the practitioners responsible for preparing the benchmarking data, provides a framework for self assessment based on a capability maturity model.
Agencies are encouraged to share better practice in ICT benchmarking and AGIMO can facilitate this by providing contacts in mature organisations (see section 2.7).
1.2 Roadmap to improved ICT Benchmarking Agencies can identify what level of maturity they currently have and develop strategies to improve performance and move to the next level of maturity.
The capability maturity model (CMM) provides a road map to advise agencies on the strategies to achieve the next level of maturity. Based on a continuum of five levels 1 as presented in Figure 1, each level in the CMM incrementally builds on the performance criteria in the lower levels.
1 The CMM levels are based on the P3M3® format.
Archive
d

ICT Benchmarking: Better Practice Roadmap | 5
Figure 1 – Capability Maturity Model
Level 1 – Initial Process
Level 3 – Defined Process
Level 5 – Optimised
Process
Level 4 – Managed Process
Level 2 – Repeatable
Process
Individual ‘heroics’
Each year a new process
High cost and inefficient
Low level data integrity
Extended timeframe
Established process
Common language
Right people assigned
Basic tools in place
Policies, processes and standards are well defined
Uniformly applied
Data integrity is acceptable
Able to meet timeframes
Risks are defined and
managed
Evidence-based funding
Rigorous measurement
Efficient systems and
processes
High data integrity
Best in class processes
Knowledge management
Exploiting opportunities
Source of competitive advantage
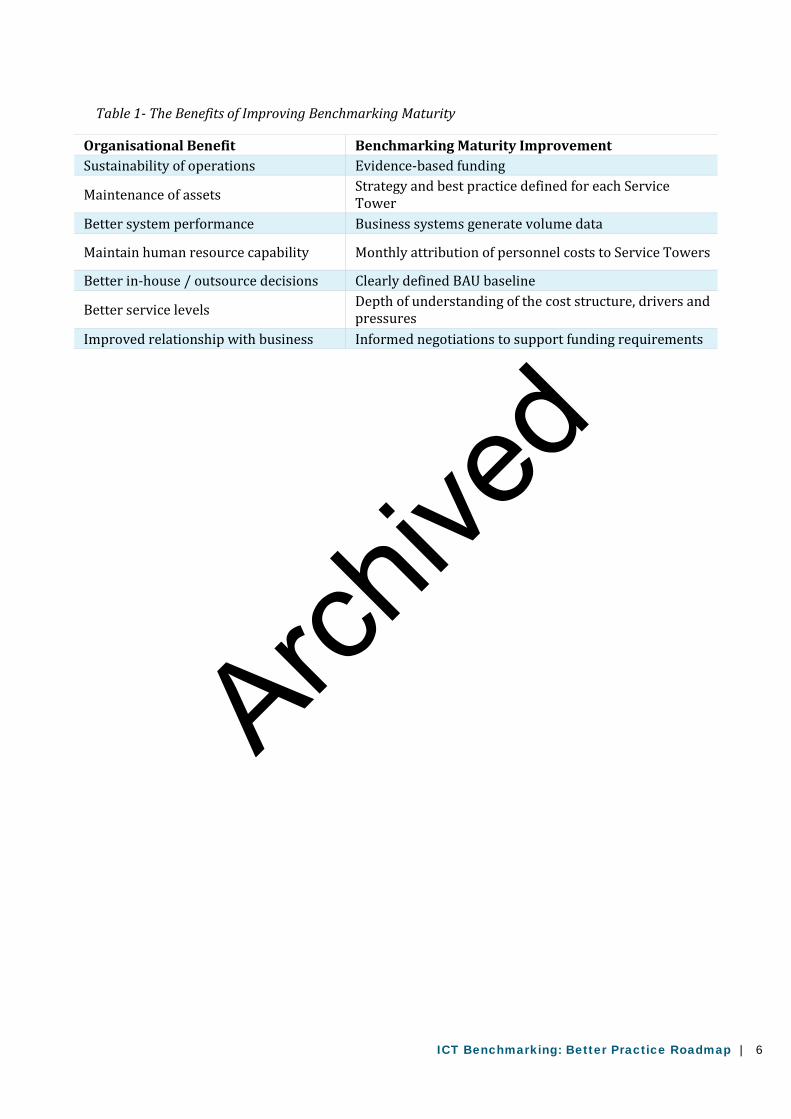
1.3 The Benefits of Improving Benchmarking Maturity Many agencies are using benchmarking as a systematic tool for better ICT expenditure decision making. They benchmark their performance against their peers, identify where improvements can be made and seek out best practice from other organisations. The following table summarises how using this Guide to improve your benchmarking maturity can have wider organisational benefits.
Archive
d
ICT Benchmarking: Better Practice Roadmap | 6
Table 1- The Benefits of Improving Benchmarking Maturity
Organisational Benefit Benchmarking Maturity Improvement Sustainability of operations Evidence-based funding
Maintenance of assets Strategy and best practice defined for each Service Tower
Better system performance Business systems generate volume data
Maintain human resource capability Monthly attribution of personnel costs to Service Towers
Better in-house / outsource decisions Clearly defined BAU baseline
Better service levels Depth of understanding of the cost structure, drivers and pressures
Improved relationship with business Informed negotiations to support funding requirements
Archive
d
ICT Benchmarking: Better Practice Roadmap | 7
2. ICT Benchmarking Roadmap
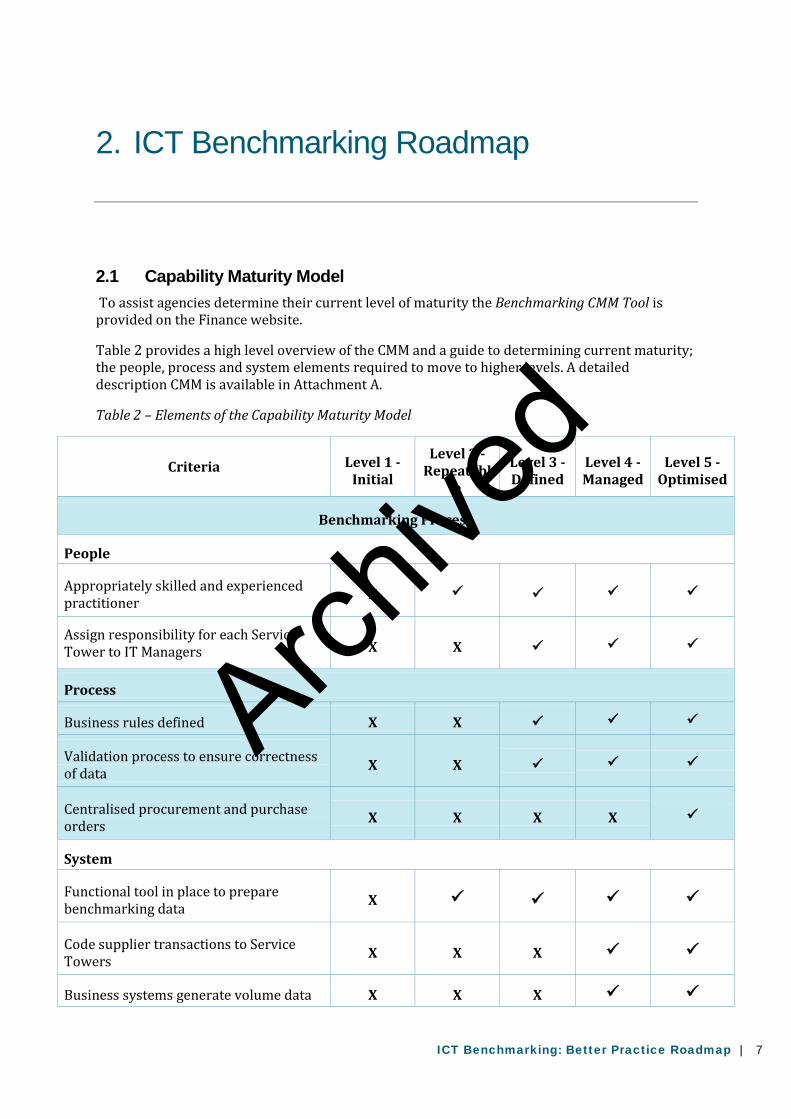
2.1 Capability Maturity Model To assist agencies determine their current level of maturity the Benchmarking CMM Tool is provided on the Finance website.
Table 2 provides a high level overview of the CMM and a guide to determining current maturity; the people, process and system elements required to move to higher levels. A detailed description CMM is available in Attachment A.
Table 2 – Elements of the Capability Maturity Model
Criteria Level 1 - Initial
Level 2 - Repeatabl
e
Level 3 - Defined
Level 4 - Managed
Level 5 - Optimised
Benchmarking Process
People
Appropriately skilled and experienced practitioner
X
Assign responsibility for each Service Tower to IT Managers X X
Process
Business rules defined X X
Validation process to ensure correctness of data X X
Centralised procurement and purchase orders X X X X
System
Functional tool in place to prepare benchmarking data X
Code supplier transactions to Service Towers X X X
Business systems generate volume data X X X
Archive
d

ICT Benchmarking: Better Practice Roadmap | 8
Criteria Level 1 - Initial
Level 2 - Repeatabl
e
Level 3 - Defined
Level 4 - Managed
Level 5 - Optimised
External personnel data is available from standard process X X X
Monthly attribution of personnel costs to Service Towers X X X X
Project ledger with Work Breakdown Structure (WBS) X X X X
Benchmarking data is available at the service tower level at any time during the year
X X X X
Management of ICT Expenditure
People
Senior Manager appointed at the appropriate level of seniority with functional responsibility for managing resources and controlling ICT expenditure
X X X
Process
Explain variations between years X X
Clearly define business as usual baseline X X
Depth of understanding of benchmarking structure
X X
BM data informs strategies X X
Strategy and best practice defined for each Service Tower
X X X
Depth of understanding of the cost structure, drivers and pressures
X X X X
Centralised CIO organisation X X X X
Informed negotiations to support growth in BAU funding X X X
System
Align benchmarking data structures with management planning and control framework (e.g. budgeting and reporting)
X X X X
Archive
d
ICT Benchmarking: Better Practice Roadmap | 9
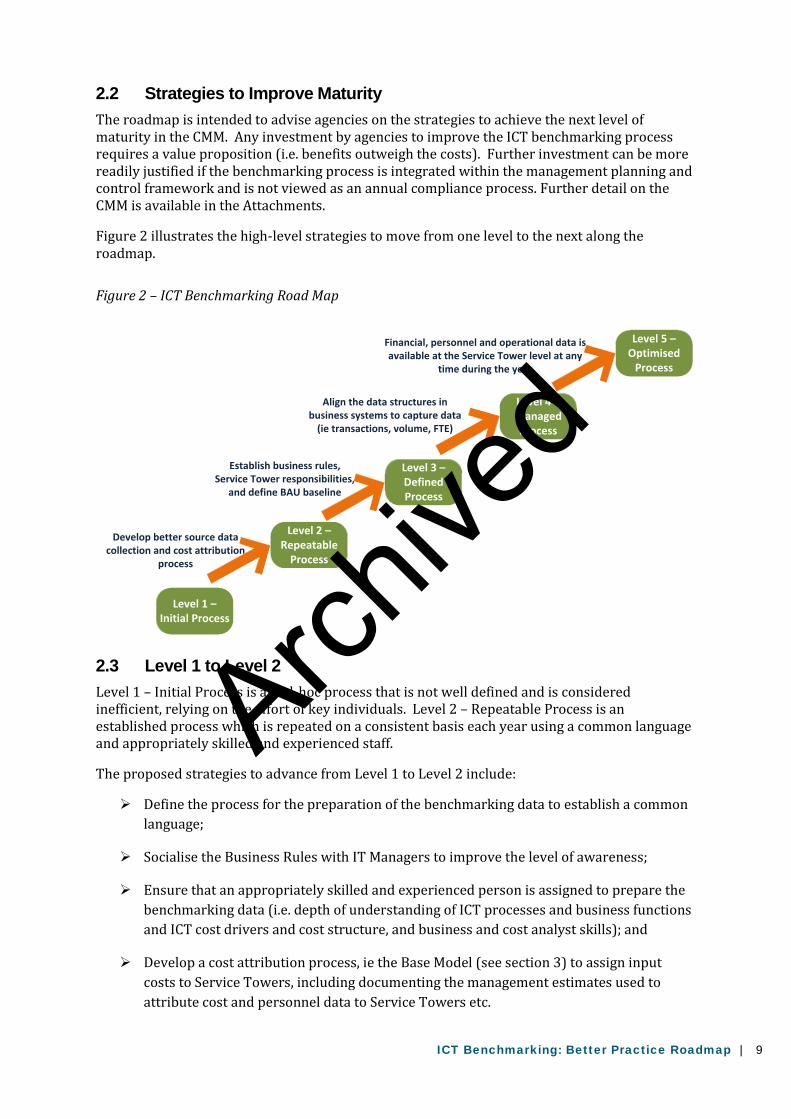
2.2 Strategies to Improve Maturity The roadmap is intended to advise agencies on the strategies to achieve the next level of maturity in the CMM. Any investment by agencies to improve the ICT benchmarking process requires a value proposition (i.e. benefits outweigh the costs). Further investment can be more readily justified if the benchmarking process is integrated within the management planning and control framework and is not viewed as an annual compliance process. Further detail on the CMM is available in the Attachments.
Figure 2 illustrates the high-level strategies to move from one level to the next along the roadmap. Figure 2 – ICT Benchmarking Road Map
Develop better source data collection and cost attribution
process
Establish business rules, Service Tower responsibilities,
and define BAU baseline
Align the data structures in business systems to capture data
(ie transactions, volume, FTE)
Financial, personnel and operational data is available at the Service Tower level at any
time during the year
Level 1 – Initial Process
Level 3 – Defined Process
Level 5 – Optimised
Process
Level 4 – Managed Process
Level 2 – Repeatable
Process
2.3 Level 1 to Level 2 Level 1 – Initial Process is an ad-hoc process that is not well defined and is considered inefficient, relying on the effort of key individuals. Level 2 – Repeatable Process is an established process which is repeated on a consistent basis each year using a common language and appropriately skilled and experienced staff.
The proposed strategies to advance from Level 1 to Level 2 include:
Define the process for the preparation of the benchmarking data to establish a common language;
Socialise the Business Rules with IT Managers to improve the level of awareness;
Ensure that an appropriately skilled and experienced person is assigned to prepare the benchmarking data (i.e. depth of understanding of ICT processes and business functions and ICT cost drivers and cost structure, and business and cost analyst skills); and
Develop a cost attribution process, ie the Base Model (see section 3) to assign input costs to Service Towers, including documenting the management estimates used to attribute cost and personnel data to Service Towers etc.
Archive
d

ICT Benchmarking: Better Practice Roadmap | 10
2.4 Level 2 to Level 3 Level 3 – Defined Process has well defined policies, processes and procedures which are uniformly applied to generate quality data in an efficient and timely process.
The proposed strategies to advance from Level 2 to Level 3 include:
Develop a functional attribution model to calculate the costs and attribute the personnel data (ie the Base Model);
Establish a well defined data collection process for collecting source data (financial, human resources, and operational 2);
Define Business Rules in a formal document which has been disseminated to all IT Managers;
Assign responsibility for each Service Tower to an IT Manager who is required to sign off on the benchmarking data, explain any material variations between years, consider the benchmarking data, discuss with comparable agencies, and suggest performance improvement strategies where relevant; and
Clearly define the BAU baseline and separate resources between BAU and non-BAU activities.
2.5 Level 3 to Level 4 Level 4 – Managed Process involves management engaging in extensive debate on funding levels, performance and resource management strategies based on substantive evidence which has been generated from robust systems and processes.
The proposed strategies to advance from Level 3 to Level 4 include:
Align the data structures in the Financial Management Information System (FMIS) and supporting systems to the benchmarking data formats, ie the Extended Model (see Section 3);
Direct data capture of supplier transaction data against Service Towers using purchase orders;
Time recording and project ledger to capture staff effort and attribute costs and FTE to BAU and non-BAU activities;
Map asset classes to Service Towers in the Asset Register to determine depreciation costs;
Operational volume data and IT contractor FTE is directly accessible from functioning business systems as a standard reporting process;
Centralise ICT expenditure (i.e. minimise decentralised ICT functions);
2 Operational data is based on evidence and not ‘guesstimates’.
Archive
d

ICT Benchmarking: Better Practice Roadmap | 11
Develop performance improvement strategies for each Service Tower which have been informed by the benchmarking data and follow up discussions with comparable agencies;
Appoint a Senior Manager (i.e. Financial Controller 3) to be responsible for controlling ICT expenditure and managing resources and ensuring an effective ‘front door’ (i.e. no additional funding no additional services);
Develop separate budgets for BAU and non-BAU; and
Negotiate funding levels with the Executive based on informed discussions underpinned by substantive evidence.
2.6 Level 4 to Level 5 Level 5 – Optimised Process is a source of competitive advantage that enables agencies to exploit opportunities and achieve best in class results.
The proposed strategies to advance from Level 4 to Level 5 include:
Integrate the ICT benchmarking process into the management planning and reporting processes and generate management information by Service Tower as a standard management report, ie the Advanced Model (see Section 3);
Use the benchmarking data to inform the sourcing strategy and define service categories for market testing;
Share better practice processes with peer agencies;
Define the BAU baseline Service Level Standards (SLS) for each Service Tower and socialise with business units; and
Develop a funding model which accounts for growth in workload associated with changes in the business and ICT environment and agree any changes in the BAU baseline upfront in business cases (i.e. flow on costs).
3 The Financial Controller would have management responsibility for all functions described in the paper entitled ‘Management of ICT Expenditure’.
Archive
d
ICT Benchmarking: Better Practice Roadmap | 12
2.7 Implementation Assistance Further detail on implementing the Roadmap is available in the Attachments.
A number of agencies, which are currently at different levels of maturity, have indicated their willingness to assist other agencies with strategies and practical advice to improve operations.
AGIMO is able to provide contact details and facilitate discussions between agencies.
Archive
d

ICT Benchmarking: Better Practice Roadmap | 13
3. Models for Preparing Cost and Personnel Data
3.1 Preparing Cost and Personnel Data Three alternative models are provided for the preparation of the cost and personnel data required for the ICT benchmarking process:
• Base Model: this is an end of year attribution process which is largely based on management estimates (Level 2–Repeatable, and 3–Defined Process);
• Extended Model: this builds on the Base Model’s attribution process with a more robust costing tool, capture of supplier costs by Service Tower at the transaction data entry point, and utilises staff effort data from time recording system to attribute internal and external personnel costs to Service Tower (Level 4–Managed Process); and
• Advanced Model: fully integrated FMIS solution with the financial source data capture at the transaction data entry point and alignment of data structures (Level 5–Optimised Process).
Figure 3 illustrates the alignment of the roadmap with the three models for preparing cost and personnel data.
Figure 3 – Cost and Personnel Data Preparation Models
Level 1 – Initial Process
Level 3 – Defined Process
Level 5 – Optimised
Process
Level 4 – Managed Process
Level 2 – Repeatable
Process
EXTENDED MODEL
BASE MODEL
ADVANCED MODEL
Archive
d

ICT Benchmarking: Better Practice Roadmap | 14
Table 3 provides a summary of the key features of each of the three models. These models together represent an incremental approach to achieving best practice (i.e. they build progressively on each other to achieve the goal of best practice).
Table 3 – Alternative Models for Preparing Cost and Personnel Data
Base Model Defined Process
Extended Mode Managed Process
Advanced Model Optimised Process
• End of year attribution process to attribute input costs and personnel data to Service Towers and other outputs
• Well defined and documented business rules for the preparation of the benchmarking data
• Fully functional cost model using spreadsheet tools based on defined business rules to prepare the cost and personnel data
• Validation process to ensure the correctness of the benchmarking data
• Structured data collection process using standard templates
• High level of reliance on management estimates
• Evidence based cost driver data using staff effort data sourced from a time recording system for internal and external personnel (replace management estimates where appropriate)
• Standard process for maintaining external personnel FTE data (hourly rates, start/end dates, cost centre and contribution areas)
• Depreciation costs are captured by asset class and mapped to Service Towers
• Billing data from major suppliers identifies the split by Service Tower
• Use of an FMIS costing module to undertake the cost attribution to Service Towers
• Align internal systems with the benchmarking data structures (e.g. Service Towers, ICT cost elements, and contribution areas)
• All ICT supplier transactions are captured at the transaction data entry point by Service Tower in all financial applications in the FMIS (e.g. payables, purchasing and assets)
• Centralised procurement and use of purchase orders to code all ICT supplier transactions to Service Towers
• Costs coded to a Project Ledger with a multiple level WBS data structure which includes Service Towers (centrally managed data structure)
• Monthly attribution of internal and external personnel to Service Towers based on time sheet data
• Classify internal and external personnel against Contribution Areas
• Consistent data entry process for actual and budget data
• Resource planning at the individual resource level to determine the level of effort for each activity performed using
Archive
d
ICT Benchmarking: Better Practice Roadmap | 15
Base Model Defined Process
Extended Mode Managed Process
Advanced Model Optimised Process
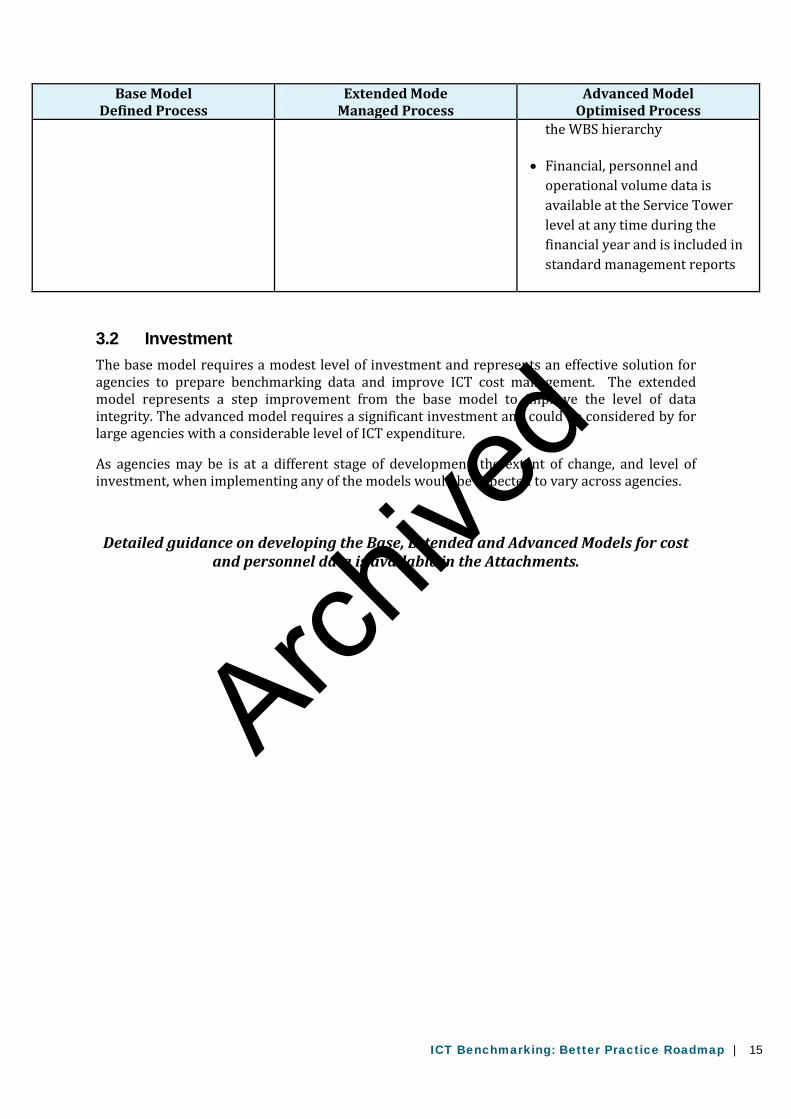
the WBS hierarchy
• Financial, personnel and operational volume data is available at the Service Tower level at any time during the financial year and is included in standard management reports
3.2 Investment The base model requires a modest level of investment and represents an effective solution for agencies to prepare benchmarking data and improve ICT cost management. The extended model represents a step improvement from the base model to improve the level of data integrity. The advanced model requires a significant investment and could be considered by for large agencies with a considerable level of ICT expenditure.
As agencies may be is at a different stage of development, the extent of change, and level of investment, when implementing any of the models would be expected to vary across agencies.
Detailed guidance on developing the Base, Extended and Advanced Models for cost and personnel data is available in the Attachments.
Archive
d

ICT Benchmarking: Better Practice Roadmap | 16
4. Volume Information
4.1 Collecting Volume Data For many agencies the collection of volume information (with the exception of simple data sets such as the number of personal computers (PCs)) is not supported by established processes and systems for data capture. There is an opportunity to improve the level of data integrity through establishing standard processes and business rules.
A key issue is the cost/benefit advantage of the level of investment required to establish a more structured environment for the collection of this data, especially where the data is only used for external compliance. This section provides better practice data collection methods for each volume metric required to be reported as part of the ICT benchmarking process (Level 4 – Managed Process). It also suggests value added uses of the data for agencies.
Table 4 provides a summary of the volume information required for the ICT benchmarking process. Further detail is provided in the Attachments.
Table 4 – Volume Information
Service Tower Benchmarking Data Method
Applications Not applicable
Mainframe Capacity and utilisation Mainframe management systems
Midrange Volumes, operating system (OS) instances, physical servers, central processing units (CPU) and utilisation data
Configuration Management Data Base and/or software asset management systems and network monitoring software
Storage Storage capacity Storage management systems
WAN Wide area Network (WAN) link capacity
Network management systems
Gateways Upload and download volume information
Management systems
LAN and RAS Number of active and used Local Area Network (LAN) ports
Management systems
End User Infrastructure Number of standard operating Configuration Management Data Base or asset management
Archive
d

ICT Benchmarking: Better Practice Roadmap | 17
Service Tower Benchmarking Data Method
environments (SOEs) and users
Number of items
Average time to replace items
system
Voice Services Number of devices Configuration Management Data Base or asset management system
Help Desk Number of calls and incidents Service desk management system
Facilities Volume (square meters)
Future planning for the data centre and power requirements
Facilities management reporting
Infrastructure management planning
Detailed guidance on developing volume data is available in the Attachments
Archive
d