ict job market - pikom · ict job market outlook 2016 which is now in its 9th year. as the national...
TRANSCRIPT

Persatuan Industri Komputer Dan Multimedia Malaysia(The National ICT Association of Malaysia)
E1, Empire Damansara,No. 2, Jalan PJU 8/8a, Damansara Perdana47820 Petaling Jaya, SelangorT : +(603) 4065 0078 F : +(603) 4065 0079 E+ : [email protected] W+ : www.pikom.org.my
PIKOM, the National ICT Association of Malaysia, is a not-for-profit organisation. It is the largest associa-tion representing information and communications technology (ICT) players in Malaysia. Since its inception in 1986, PIKOM has come of age as the voice of the ICT industry. It has become an ICT referral centre for government and industry players, as well as international organisations. In this regard, PIKOM takes on the responsibility to publish ICT-relevant information in a periodic manner.
Editorial and design services by: MJLAIKC INFOWORKS | Tel: 6012 5050862 | E: [email protected] by: Era Konsep Sdn Bhd | Tel: 603 6272 4024 | E: [email protected]
ICT JOB MARKETOUTLOOK IN MALAYSIA
JULY, 2016
ICT JOB MARKETOUTLOOK IN MALAYSIA
JULY, 2016
IN COLLABORATION WITH

CopyrightCopyright © 2016. All rights reserved. No part of this publication may be produced or transmitted in any form or any means, electronic, mechanical, photocopying or otherwise, including recording or the use of any information storage and retrieval system without prior written permission from PIKOM.

CopyrightCopyright © 2016. All rights reserved. No part of this publication may be produced or transmitted in any form or any means, electronic, mechanical, photocopying or otherwise, including recording or the use of any information storage and retrieval system without prior written permission from PIKOM.
E1, Empire Damansara,No. 2, Jalan PJU 8/8a, Damansara Perdana47820 Petaling Jaya, SelangorT: +(603) 4065 0078F: +(603) 4065 0079 E: [email protected] W: www.pikom.org.my
Wisma JobStreet.com,27, Lorong Medan Tuanku 1, (off Jalan Sultan Ismail), 50300 Kuala Lumpur, MalaysiaT: +(603) 2176 0493 (DL)F: +(603) 2698 7200E: [email protected]: www.jobstreet.com
iSSN No: 2180-267Xrelease date: July, 2016
Editor-in-Chief: Rina De Silva, Research Manager, PIKOMreviewed by: Woon Tai Hai, PIKOM Research Committee Chairman
DisclaimerThis publication contains findings based on data provided by JobStreet.com Sdn Bhd (449122-K) with PIKOM collaboratively carrying out the data analysis. Although a professional effort has been made to ensure the accuracy of data analysis and presentation, all information furnished in this publication is provided strictly on an ‘as is’ and ‘as available’ basis and is so provided for your information and reference only. With this caution, kindly be informed that this release is not presented to address the circumstances of any particular individual or entity. As such, JobStreet.com and PIKOM including their sponsors, partners and associates, whether named or unnamed, do not warrant the accuracy or adequacy of the data and findings. Moreover, all parties concerned explicitly disclaim any liability for errors or omissions or inaccuracies pertaining to the contents of this publication. Therefore, the use of data and findings presented in this publication is solely at the user’s risk. PIKOM and JobStreet.com shall in no event be liable for damages, loss or expense including without limitation, direct, incidental, special, or consequential damage or economic loss arising from or in connection with the data and / or findings published in this series. However, professional advice can be sought from the producers of this publication.

Foreword by the PIKoM ChaIrMan- ChIn Chee Seong
I am happy to announce the release of the PIKOM ICT Job Market Outlook 2016 which is now in its 9th year. As the national association for the local ICT industry, it is imperative that we keep close track of the ‘pulse’ of the economy and industry. The ICT job market is one of the important components and ‘lifelines’ in sustaining and driving the growth of the industry. While the report provides indicators of how ICT salaries of different categories and industries have fared in the past years, it is the outlook of the job market that allows ‘C’ level executives to understand, plan and decide on their talents and project budgets for the coming years.
At this juncture, I would like to take this opportunity to express my sincere thanks and appreciation to Jobstreet.com and PayScale web publishers for their invaluable input as well as the PIKOM Research Committee for spearheading this publication once again. I would also like to thank Fusionex, BDO, Hitachi Sunway and Powerware Systems for their support of this report. Without such strategic collaboration and effort, the report would not have been possible.
Most of us are well aware that 2015 was a challenging year for all. Factors like the plummeting crude oil and commodity prices, the weakening of the Ringgit against major currencies, implementation of the GST and weakening of the Chinese economy have impacted our economy. While the overall ICT industry, especially the ICT services sector, continued to
register positive growth, the average salary for 2015 only grew by 5.3% over 2014 (a marked difference to our forecast of 7.4% in the previous year’s report). Recollecting the past record, it is apparent that this is the lowest year-on-year (y-o-y) growth recorded since the publication was launched eight years ago. The positive news is that the average annual growth rate (AAGR) of most major sectors is still generally healthy. However, we anticipate that this downtrend will persist into 2016, when we expect a growth rate of 4.7%. We are also optimistic that the GDP growth for the economy will be sustained at 4.5% for 2016 and 2017.
Even if we are concerned at the prospect of lower growth over the next one or two years, it is more critical that we (the industry and government) tackle the fundamental root causes to the challenges and issues faced by the industry, in particular the outflow of talents to other economies, ensuring a continuous stream of quality fresh graduates into the workforce, promoting R&D and commercialisation, and maintaining competitive salaries against regional countries. PIKOM will continue in its endeavor as an association to work with industry players, government and academicians to resolve these issues including facilitating strategic discussions and / or developing thought leadership papers and reports such as this market outlook report. Once again, my heartfelt thanks to all who have made this publication a reality again.

PreaMble FroM the PIKoMreSearCh CoMMIttee ChaIrMan- woon taI haI
PIKOM is pleased to once again publish the “ICT Job Market Outlook 2016”. You will notice that in this year’s publication, we have opted for a fiery ‘red’ front and back cover devoid of any pictures or illustration. Does this mean that we have a crisis on hand, or has the industry outlook become bleak as compared with previous years? Let us briefly examine the results of this study, commencing with the gross Domestic Product (GDP) of the nation before drilling down to the ICT industry and salary outlook.
economic outlook 2016/2017 Malaysia’s economy registered a better-than-expected growth of 5.0% in 2015 (as projected in the ICT Job Market Outlook 2015). While this was lower than the 6.0% growth rate in 2014, it was still higher than the projected growth rate of below 5.0%. The economy grew strongly in the last quarter of the year which boosted the overall GDP for 2015. While the first quarter of 2016 did not perform as well as the last quarter of 2015, the downtrend was not as severe as what the market had anticipated. (Q4 2015 4.5% to Q1 2016 4.2% - Department of Statistics, Malaysia).
Domestic market demand continues to drive growth and this is expected to remain strong for the rest of 2016. However, the external sector is not as resilient, with underlying factors such as the drop in the prices of natural gas, crude and other petroleum products expected to impact on the sector. Most research institutions have forecasted a lower GDP growth rate of between 4.2% and 4.5% for 2016 and an improved 4.5% to 5% growth rate for 2017. However Pikom is forecasting a growth rate of 4.5% for 2016 and even as high as 4.7% for 2017. PIKOM’s forecast is based on the fact that domestic demand remains robust while at the same time, commodity prices are stabilising and there are no apparent adverse global economic and political conditions in the near future.
ICt Sector outlookTotal ICT value increased from RM122.8 billion in 2013 to RM137.6 billion in 2014. We estimate the total ICT
value to reach RM155.2billion based on an AAGR of 8.0% for the period 2010 - 2015. This is attributed to positive growth in ICT Manufacturing, ICT Services, e-commerce and ICT Trade. The share of overall ICT industry to the economy expanded from 16.5% in 2010 to 17.6% by 2015. Contribution from e-commerce related services has been on the rise, albeit slower as compared to the other countries. The share of e-commerce related trade to the economy increased from 3.6% to 4.8% during this period.
While the ICT Manufacturing sub-sector continued to decline, the Services (ICTS) sub-sector has been experiencing consistent growth in the last two decades. Share of ICTS to the overall economy has almost doubled from 3.3% in 2000 to 6.6% in 2015 and is projected to touch 7.0% by end of 2016. Since 2013, the ICTS sector has been recording double digit year-on-year (y-o-y) growth, in tandem with positive GDP growth. In 2015, it clocked RM70.2 billion at an AAGR of 11.0% and is expected to touch RM77.5 billion by 2016. Generally, the overall outlook for the ICT industry, in particularly the ICTS sector, is still positive and will continue to drive growth for the industry.
ICt Job Market outlookThe overall average monthly salary of ICT professionals in Malaysia in 2015 was RM8,114 (RM7,706 in 2014), registering a y-o-y growth of 5.3% (as compared to 7.9% in 2014). This growth rate is the lowest over the past 8 years since this publication was first published. Interestingly, a major contrast when analysing 2015 figures against those of the previous years was the absence of high double digit growth for all categories and industries; most noticeable in the middle management to senior management positions. Some of these double digit growth rates in past years were as high as 20-50% for certain job-level categories and industries. In contrast, the highest growth recorded for 2015 (over 2014) was about 15% while the other end of the spectrum showed a low growth rate of 0.1%. All these factors contributed to the lowering of the overall average growth rate for 2015.

ICT Job MarkeT ouTlook In MalaysIa | July, 20166
While there were significant differences in the y-o-y figures for 2015, the AAGR for many of the sectors still registered healthy growth, inferring that this may be a temporary decline. However, there were sectors that exhibited a declining trend for both y-o-y and AAGR and they included Telecommunications, Oil and Gas, Banking, Utilities and Manufacturing.
The economic woes and the uncertainties in 2015 have certainly had an adverse impact on the ICT industry, which in turn caused a ripple effect on the overall salary growth for 2015. While the industry
expected a downturn, it certainly did not expect an impact of such magnitude. Perhaps, it is also a good wake up call for the ICT industry to realise that although salaries have been growing steadily for the past 8 years, future salary growth cannot be taken for granted.
Taking into account the economic outlook and the inherent industry issues, PIKOM is projecting an overall average salary growth of 4.7% for 2016, which will be lower than 2015. We expect this trend to continue into 2017.

PIKoM reSearCh CoMMIttee 2016
woon tai hai• Executive Director, BDO Consulting Sdn
Bhd, Malaysia (2014 – current)• Executive Director, KPMG Risk and
Management Consulting Sdn Bhd, Malaysia (1998 - 2013 retired)
• Served two terms as PIKOM Chairman 2011 - 12 & 2012 - 2013
• Appointed to PIKOM Advisory Board 2013 - 2016 / PIKOM Research Committee Chairman 2008-2016
• Over 33 years of experience in the ICT industry and management consulting
• Master of Business Administration (MBA) - University of Technology, Sydney Australia (UTS)
• Post Grad. Diploma (Finance and Accounting) - University of Technology, Sydney Australia (UTS)
• Bachelor of Science – University of New South Wales (UNSW), Australia
BDO is the world’s fifth largest network of professional firms that provide audit, advisory and tax services to businesses.
ong Kian yew• Executive Director, PIKOM• Over 20 years of working experience in
the ICT industry• Represents PIKOM in various Government• committees on ICT policy and advocacy• Represents PIKOM at international level
in the World IT and Services Alliance
(WITSA) and Regional Asian Oceanian Computing Industry Organization (ASOCIO)
• Served as Secretary-General of ASOCIO in 2013
• Bachelor of Marketing - University of Strathclyde
rina de Silva• Research Manager, PIKOM• Former Assistant Editor, New Straits
Times Press (NSTP)• Over 20 years in the media industry,
which included covering ICT news and developments in Malaysia and other ASEAN countries
• Published writing portfolio includes investigative news articles, personality pieces, feature stories on health, ICT trends, consumer issues and community-related topics
• Bachelor of Arts in Economics - Brandon University, Manitoba, Canada

Information and communication technologies (ICT) continue to stimulate and drive an industry recognised as one of the most dynamic and fastest-growing economic segments in Malaysia.
As a result, the job market for the ICT industry remains vibrant and subject to new and exciting trends such as the emergence of next generation technologies in the form of big data analytics (BDA), the internet of things (IoT), cloud as well as mobility and social media solutions.
The resulting ebb and flow in the movement of talent is one of the reasons why the ICT Job Market Outlook in Malaysia series commands increasing interest among industry players, job seekers and other stakeholders year after year.
PIKOM, the National ICT Association of Malaysia, has once again taken the lead to compile and publish the ICT Job Market Outlook in Malaysia, 2016 in collaboration with JobStreet.com. PIKOM provided the in-depth analysis and insights for the economic, industry and employment outlook based in part on the latest salary data points and employment perception index from Jobstreet.com. PIKOM also leveraged heavily on past data from various sources including Bank Negara Malaysia (BNM) and the Department of Statistics Malaysia (DOSM); and utilised various statistical methods e.g. ‘smoothening of curve’, linear extrapolation and regression technique in gauging and deriving trends.
The report is presented in four sections, as follows:• Section A: Malaysia Economic Outlook 2016/2017• Section B: ICT Industry Outlook 2016 / 2017• Section C: ICT Salary Trends and Regional
Benchmarking • Section D: Supplementary articles
◊ ICT Employment Outlook Perception◊ What Makes An Effective Big Data
Analytics platform
Readers will find in this report a detailed breakdown of prevailing ICT salaries according to the following:• ICT salaries by industry• ICT salary trends by industry 2009 - 2015• Top paying industries for ICT professionals• ICT salaries by job categories• ICT salary benchmarking against 19 other
economies and over 100 cities
PIKOM is the national representative of the ICT industry with 800 members as at end June 2016. Its members contribute about 80% of the total ICT revenue in the country. PIKOM membership profiles can be broadly categorised as ICT providers like wholesalers, retailers, solution providers and web service providers; ICT user community especially large-scale users in banking, insurance, telecommunications, transportation etc., and ICT-enabled service providers, in particular in the shared services and outsourcing sector. Functionally, PIKOM undertakes ICT business promotion activities, branding, trade and business promotions as well as policy and advocacy activities.
JobStreet.com (www.jobstreet.com) is a leading online job board presently covering the employment markets in Malaysia, Singapore, Philippines, Indonesia and Vietnam. JobStreet.com currently services over 230,000 corporate hirers and over 15 million jobseekers in its database.
aboUt thIS rePort
Section a : Malaysian economic outlook 2016/2017 10
Section b : ICt Industry outlook 2016/2017 22
Section C : ICt Salary trends & regional benchmarking 30
Section d : Supplementary articles 53 ▪ ICT Employment Outlook Perception ▪ What makes an effective Big Data Analytics platform
table oF ContentS
SECTION A:
MalaySIa eConoMIC oUtlooK 2016/2017
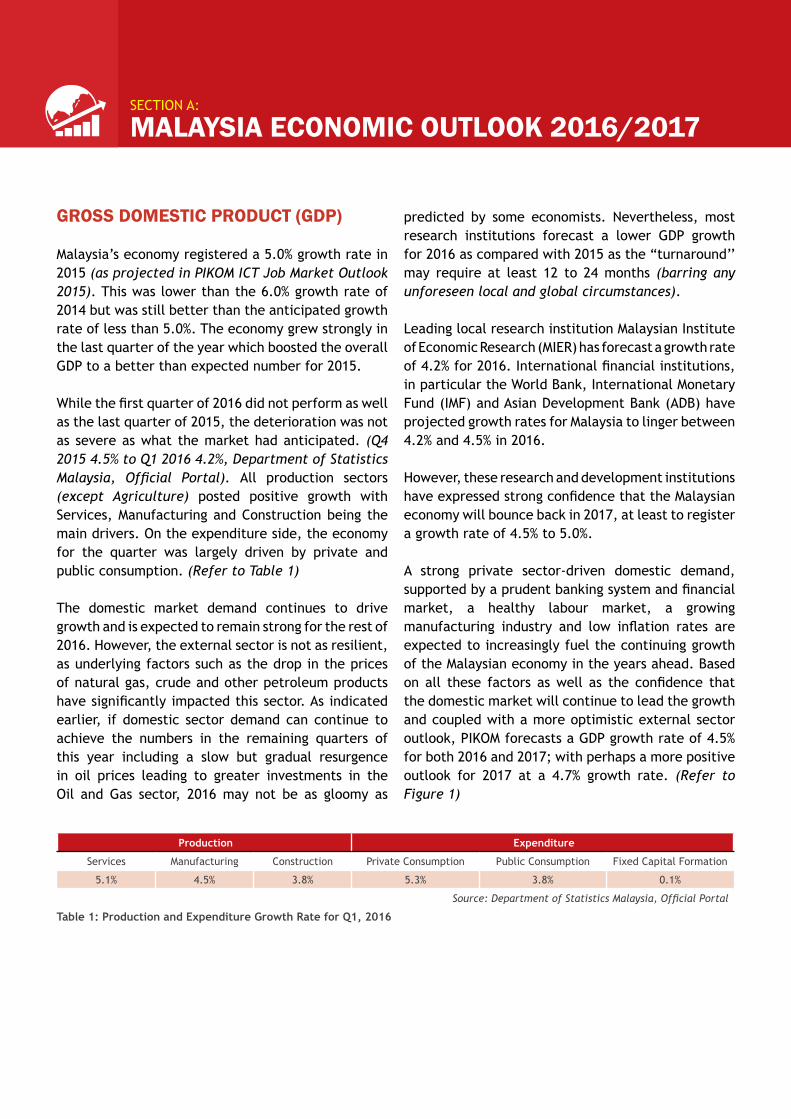
groSS doMeStIC ProdUCt (gdP)
Malaysia’s economy registered a 5.0% growth rate in 2015 (as projected in PIKOM ICT Job Market Outlook 2015). This was lower than the 6.0% growth rate of 2014 but was still better than the anticipated growth rate of less than 5.0%. The economy grew strongly in the last quarter of the year which boosted the overall GDP to a better than expected number for 2015.
While the first quarter of 2016 did not perform as well as the last quarter of 2015, the deterioration was not as severe as what the market had anticipated. (Q4 2015 4.5% to Q1 2016 4.2%, Department of Statistics Malaysia, Official Portal). All production sectors (except Agriculture) posted positive growth with Services, Manufacturing and Construction being the main drivers. On the expenditure side, the economy for the quarter was largely driven by private and public consumption. (Refer to Table 1)
The domestic market demand continues to drive growth and is expected to remain strong for the rest of 2016. However, the external sector is not as resilient, as underlying factors such as the drop in the prices of natural gas, crude and other petroleum products have significantly impacted this sector. As indicated earlier, if domestic sector demand can continue to achieve the numbers in the remaining quarters of this year including a slow but gradual resurgence in oil prices leading to greater investments in the Oil and Gas sector, 2016 may not be as gloomy as
predicted by some economists. Nevertheless, most research institutions forecast a lower GDP growth for 2016 as compared with 2015 as the “turnaround’’ may require at least 12 to 24 months (barring any unforeseen local and global circumstances).
Leading local research institution Malaysian Institute of Economic Research (MIER) has forecast a growth rate of 4.2% for 2016. International financial institutions, in particular the World Bank, International Monetary Fund (IMF) and Asian Development Bank (ADB) have projected growth rates for Malaysia to linger between 4.2% and 4.5% in 2016.
However, these research and development institutions have expressed strong confidence that the Malaysian economy will bounce back in 2017, at least to register a growth rate of 4.5% to 5.0%.
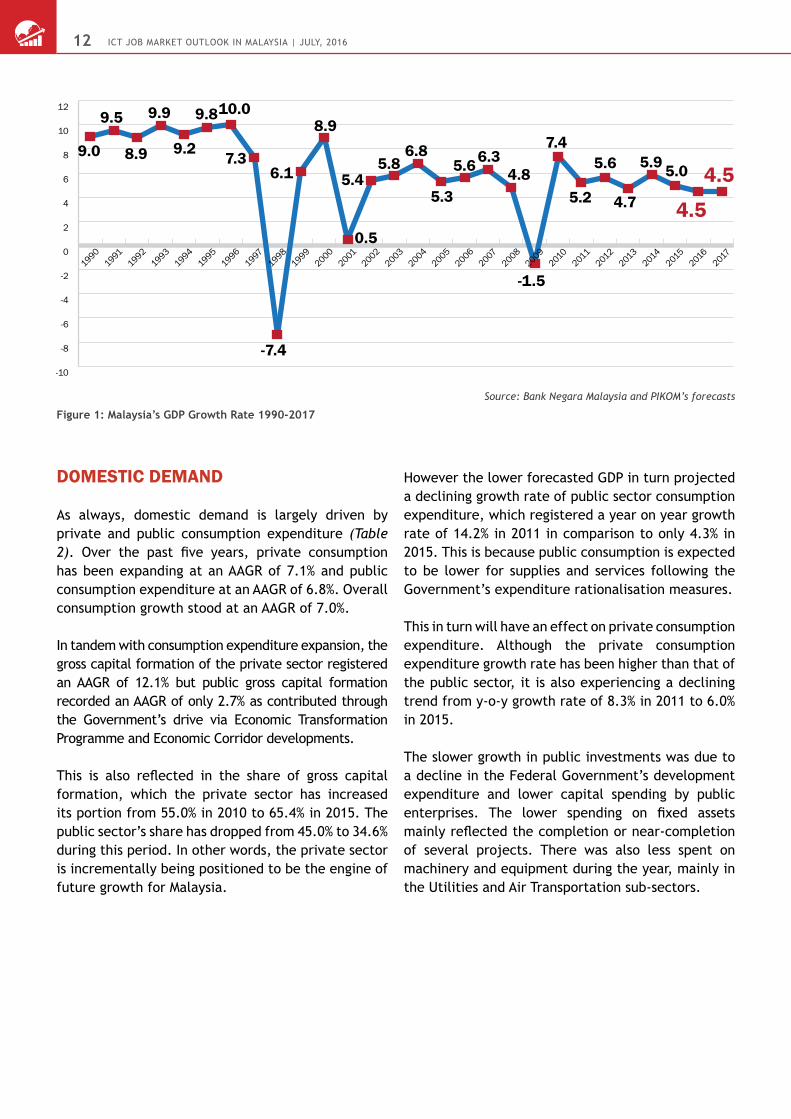
A strong private sector-driven domestic demand, supported by a prudent banking system and financial market, a healthy labour market, a growing manufacturing industry and low inflation rates are expected to increasingly fuel the continuing growth of the Malaysian economy in the years ahead. Based on all these factors as well as the confidence that the domestic market will continue to lead the growth and coupled with a more optimistic external sector outlook, PIKOM forecasts a GDP growth rate of 4.5% for both 2016 and 2017; with perhaps a more positive outlook for 2017 at a 4.7% growth rate. (Refer to Figure 1)
Production Expenditure
Services Manufacturing Construction Private Consumption Public Consumption Fixed Capital Formation
5.1% 4.5% 3.8% 5.3% 3.8% 0.1%
Source: Department of Statistics Malaysia, Official Portal
Table 1: Production and Expenditure Growth Rate for Q1, 2016

ICT Job MarkeT ouTlook In MalaysIa | July, 201612
doMeStIC deMand
As always, domestic demand is largely driven by private and public consumption expenditure (Table 2). Over the past five years, private consumption has been expanding at an AAGR of 7.1% and public consumption expenditure at an AAGR of 6.8%. Overall consumption growth stood at an AAGR of 7.0%.
In tandem with consumption expenditure expansion, the gross capital formation of the private sector registered an AAGR of 12.1% but public gross capital formation recorded an AAGR of only 2.7% as contributed through the Government’s drive via Economic Transformation Programme and Economic Corridor developments.
This is also reflected in the share of gross capital formation, which the private sector has increased its portion from 55.0% in 2010 to 65.4% in 2015. The public sector’s share has dropped from 45.0% to 34.6% during this period. In other words, the private sector is incrementally being positioned to be the engine of future growth for Malaysia.
However the lower forecasted GDP in turn projected a declining growth rate of public sector consumption expenditure, which registered a year on year growth rate of 14.2% in 2011 in comparison to only 4.3% in 2015. This is because public consumption is expected to be lower for supplies and services following the Government’s expenditure rationalisation measures.
This in turn will have an effect on private consumption expenditure. Although the private consumption expenditure growth rate has been higher than that of the public sector, it is also experiencing a declining trend from y-o-y growth rate of 8.3% in 2011 to 6.0% in 2015.
The slower growth in public investments was due to a decline in the Federal Government’s development expenditure and lower capital spending by public enterprises. The lower spending on fixed assets mainly reflected the completion or near-completion of several projects. There was also less spent on machinery and equipment during the year, mainly in the Utilities and Air Transportation sub-sectors.
-10
-8
-6
-4
-2
0
2
4
6
8
10
12
20172016
20152014
20132012
20112010
20092008
20072006
20052004
20032002
20012000
19991998
19971996
19951994
19931992
19911990
8.99.0
9.5 9.9
9.2
9.810.0
7.3
-7.4
6.1
8.9
0.5
5.45.8
6.8
5.3
5.66.34.8
-1.5
7.4
5.2
5.6
4.7
5.9 5.0 4.5
4.5
Source: Bank Negara Malaysia and PIKOM’s forecasts
Figure 1: Malaysia’s GDP Growth Rate 1990-2017

ICT Job MarkeT ouTlook In MalaysIa | July, 2016 13
CONSTANT PRICES (2010=100)
Period Final consumption expenditure Gross fixed capital formation
Gross Domestic Product (GDP)Total Y-o-Y
(%)Private sector
Y-o-Y(%)
Public sector
Y-o-Y(%) Total Y-o-Y
(%)Private sector
Y-o-Y(%)
Public sector
Y-o-Y(%)
2010 498,591 395,245 103,346 184,292 101,291 83,001 821,434
2011 540,359 8.4 422,376 6.9 117,983 14.2 195,996 6.4 110,863 9.5 85,133 2.6 864,920
2012 582,015 7.7 457,625 8.3 124,390 5.4 233,203 19.0 134,543 21.4 98,659 15.9 912,261
2013 622,517 7.0 490,798 7.2 131,719 5.9 252,271 8.2 151,749 12.8 100,522 1.9 955,260
2014 662,490 6.4 524,979 7.0 137,511 4.4 264,276 4.8 168,510 11.0 95,765 -4.7 1,012,506
2015 699,694 5.6 556,304 6.0 143,389 4.3 274,144 3.7 179,375 6.4 94,768 -1.0 1,062,647
“AAGR: 2010-2015 (%)”
7.0 7.1 6.8 8.3 12.1 2.7
PeriodFinal Consumption Expenditure : Sectoral Share (%) Gross Fixed Capital Formation : Sectoral Share (%)
Total Private sector Public sector Total Private sector Public sector
2010 100.0 79.3 20.7 100.0 55.0 45.0
2011 100.0 78.2 21.8 100.0 56.6 43.4
2012 100.0 78.6 21.4 100.0 57.7 42.3
2013 100.0 78.8 21.2 100.0 60.2 39.8
2014 100.0 79.2 20.8 100.0 63.8 36.2
2015 100.0 79.5 20.5 100.0 65.4 34.6
PeriodFinal Consumption Expenditure : Share to GDP (%) Gross Fixed Capital Formation : Share to GDP (%)
GDPTotal Private sector Public sector Total Private sector Public sector
2010 60.7 48.1 12.6 22.4 12.3 10.1 100.0
2011 62.5 48.8 13.6 22.7 12.8 9.8 100.0
2012 63.8 50.2 13.6 25.6 14.7 10.8 100.0
2013 65.2 51.4 13.8 26.4 15.9 10.5 100.0
2014 65.4 51.8 13.6 26.1 16.6 9.5 100.0
2015 65.8 52.4 13.5 25.8 16.9 8.9 100.0
Source: Bank Negara Malaysia
Table 2: Final Consumption Expenditure and Gross Capital Formation by Private and Public Sector: 2005-2010
eXternal deMand
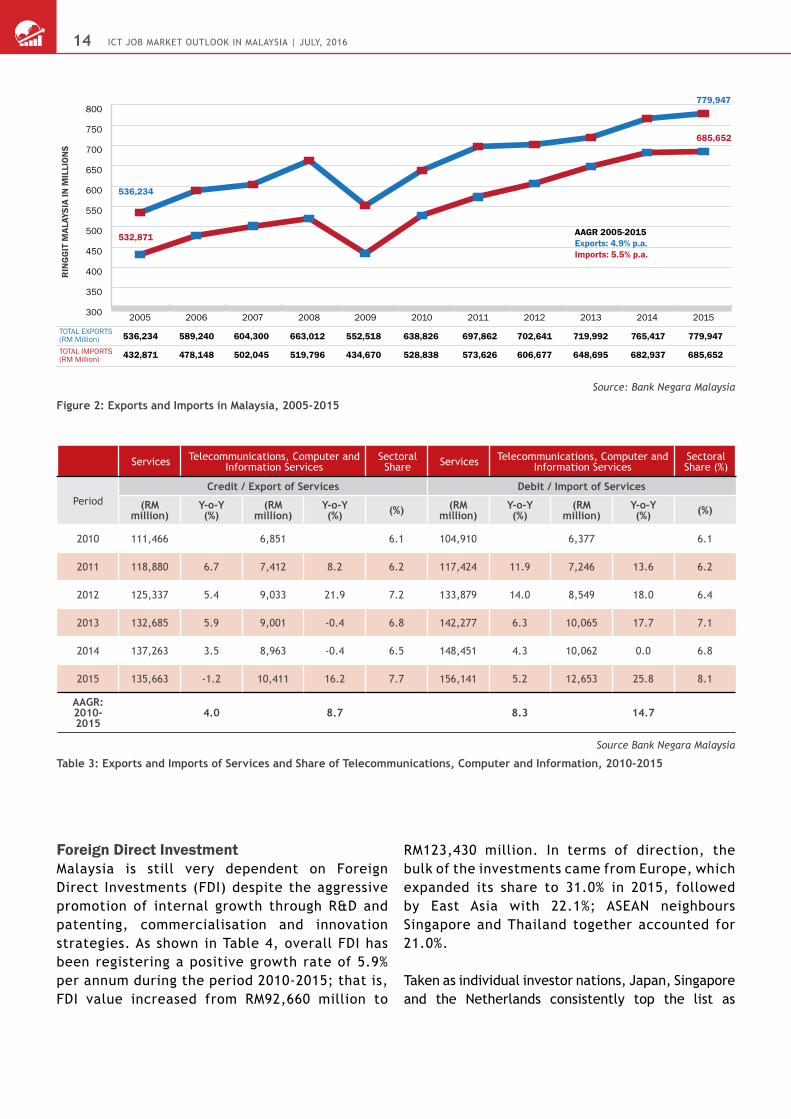
overall trade dependencyBeing a trading nation, Malaysia’s dependence on global trade is a vital factor in its economic growth. Despite experiencing a negative growth during the 2009 Global Financial Crisis, exports have grown at an AAGR of 4.9% over the past 10 years from 2005 onwards (See Figure 2).
Similarly, imports rose steadily at 5.5% during this period. However, there continues to be concerns over the volatility of the global economy with the latest US Federal Reserve report indicating softer macro-economic data, in particular increasing interest rate, strong US currency, slowdown of the
Chinese economy and the ongoing anaemic growth in the Eurozone. All these factors will affect our exports. Malaysia’s growth in overall trade is well supported by regional growth and its strong ties with China, India, Japan, South Korea and ASEAN countries. Positive growth in these countries results in economic gains for Malaysia as well. High economic activities in China, India and ASEAN nations augur well for Malaysia as 60% of its total trade is centered on these countries. Malaysia has also attracted substantial investments from advanced economies like Japan, South Korea and Singapore. With Asian economies projected to grow significantly in 2016, Malaysia can in turn anticipate increased trade and investment opportunities.
ICT Job MarkeT ouTlook In MalaysIa | July, 201614
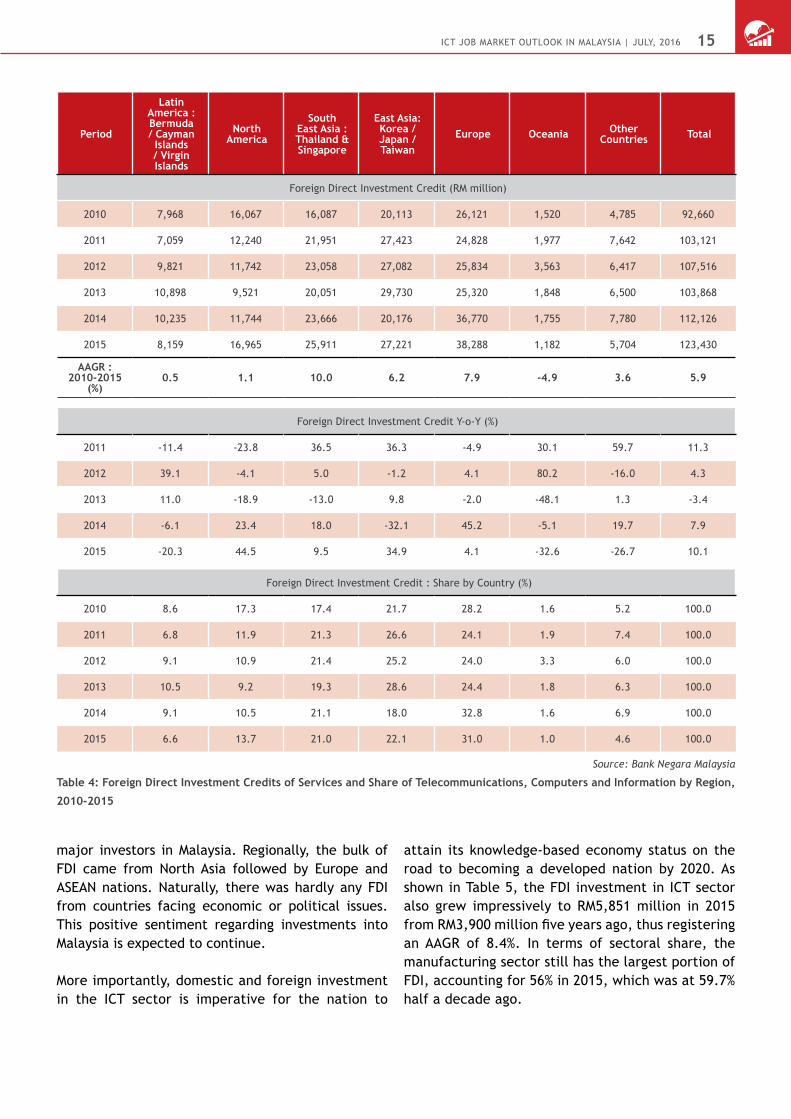
Foreign direct InvestmentMalaysia is still very dependent on Foreign Direct Investments (FDI) despite the aggressive promotion of internal growth through R&D and patenting, commercialisation and innovation strategies. As shown in Table 4, overall FDI has been registering a positive growth rate of 5.9% per annum during the period 2010-2015; that is, FDI value increased from RM92,660 million to
RM123,430 million. In terms of direction, the bulk of the investments came from Europe, which expanded its share to 31.0% in 2015, followed by East Asia with 22.1%; ASEAN neighbours Singapore and Thailand together accounted for 21.0%.
Taken as individual investor nations, Japan, Singapore and the Netherlands consistently top the list as
300
350
400
450
500
550
600
650
700
750
800
20152014201320122011201020092008200720062005
779,947
685,652
765,417
682,937
719,992
648,695
702,641
606,677
697,862
573,626
638,826
528,838
552,518
434,670
663,012
519,796
604,300
502,045
589,240
478,148
536,234
432,871
TOTAL EXPORTS(RM Million)TOTAL IMPORTS(RM Million)
RIN
GG
IT M
ALAY
SIA
IN M
ILLI
ON
S
AAGR 2005-2015Exports: 4.9% p.a.Imports: 5.5% p.a.
536,234
532,871
779,947
685,652
Source: Bank Negara Malaysia
Figure 2: Exports and Imports in Malaysia, 2005-2015
Services Telecommunications, Computer and Information Services
Sectoral Share Services Telecommunications, Computer and
Information ServicesSectoral Share (%)
PeriodCredit / Export of Services Debit / Import of Services
(RM million)
Y-o-Y (%)
(RM million)
Y-o-Y (%) (%) (RM
million)Y-o-Y (%)
(RM million)
Y-o-Y (%) (%)
2010 111,466 6,851 6.1 104,910 6,377 6.1
2011 118,880 6.7 7,412 8.2 6.2 117,424 11.9 7,246 13.6 6.2
2012 125,337 5.4 9,033 21.9 7.2 133,879 14.0 8,549 18.0 6.4
2013 132,685 5.9 9,001 -0.4 6.8 142,277 6.3 10,065 17.7 7.1
2014 137,263 3.5 8,963 -0.4 6.5 148,451 4.3 10,062 0.0 6.8
2015 135,663 -1.2 10,411 16.2 7.7 156,141 5.2 12,653 25.8 8.1
AAGR: 2010-2015
4.0 8.7 8.3 14.7
Source Bank Negara Malaysia
Table 3: Exports and Imports of Services and Share of Telecommunications, Computer and Information, 2010-2015
ICT Job MarkeT ouTlook In MalaysIa | July, 2016 15
major investors in Malaysia. Regionally, the bulk of FDI came from North Asia followed by Europe and ASEAN nations. Naturally, there was hardly any FDI from countries facing economic or political issues. This positive sentiment regarding investments into Malaysia is expected to continue.
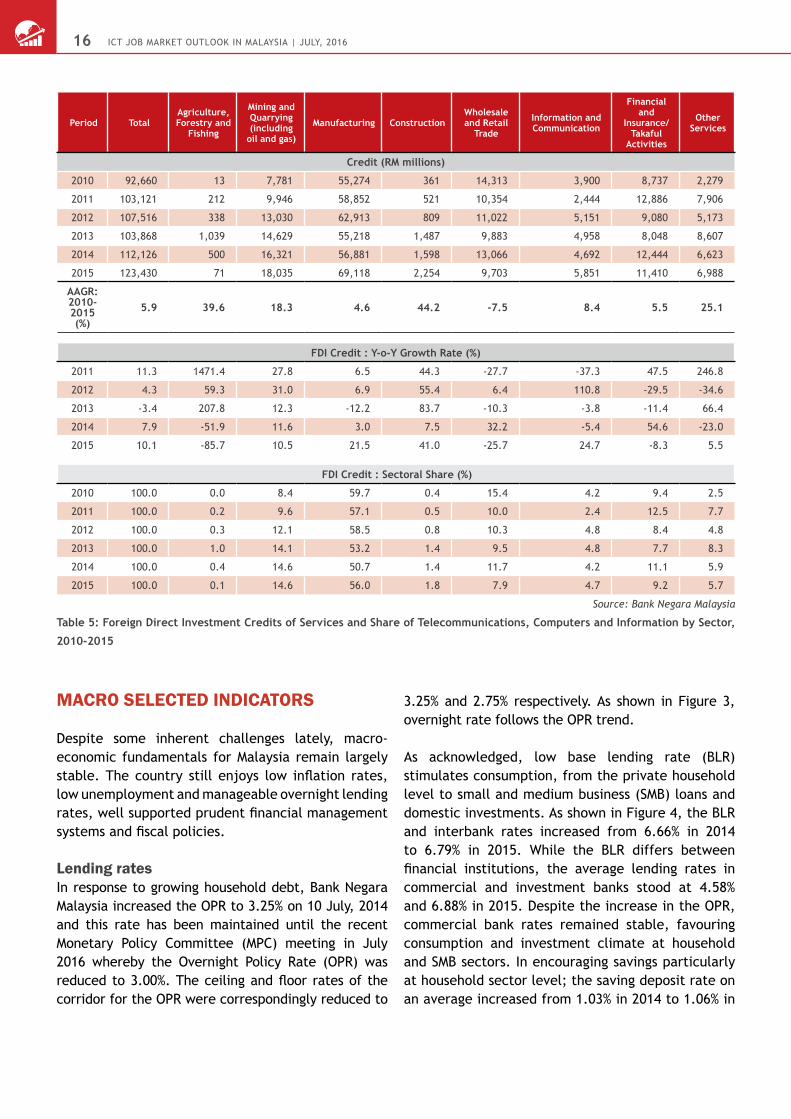
More importantly, domestic and foreign investment in the ICT sector is imperative for the nation to
attain its knowledge-based economy status on the road to becoming a developed nation by 2020. As shown in Table 5, the FDI investment in ICT sector also grew impressively to RM5,851 million in 2015 from RM3,900 million five years ago, thus registering an AAGR of 8.4%. In terms of sectoral share, the manufacturing sector still has the largest portion of FDI, accounting for 56% in 2015, which was at 59.7% half a decade ago.
Period
Latin America : Bermuda / Cayman
Islands / Virgin Islands
North America
South East Asia : Thailand & Singapore
East Asia: Korea / Japan / Taiwan
Europe Oceania Other Countries Total
Foreign Direct Investment Credit (RM million)
2010 7,968 16,067 16,087 20,113 26,121 1,520 4,785 92,660
2011 7,059 12,240 21,951 27,423 24,828 1,977 7,642 103,121
2012 9,821 11,742 23,058 27,082 25,834 3,563 6,417 107,516
2013 10,898 9,521 20,051 29,730 25,320 1,848 6,500 103,868
2014 10,235 11,744 23,666 20,176 36,770 1,755 7,780 112,126
2015 8,159 16,965 25,911 27,221 38,288 1,182 5,704 123,430
AAGR : 2010-2015
(%)0.5 1.1 10.0 6.2 7.9 -4.9 3.6 5.9
Foreign Direct Investment Credit Y-o-Y (%)
2011 -11.4 -23.8 36.5 36.3 -4.9 30.1 59.7 11.3
2012 39.1 -4.1 5.0 -1.2 4.1 80.2 -16.0 4.3
2013 11.0 -18.9 -13.0 9.8 -2.0 -48.1 1.3 -3.4
2014 -6.1 23.4 18.0 -32.1 45.2 -5.1 19.7 7.9
2015 -20.3 44.5 9.5 34.9 4.1 -32.6 -26.7 10.1
Foreign Direct Investment Credit : Share by Country (%)
2010 8.6 17.3 17.4 21.7 28.2 1.6 5.2 100.0
2011 6.8 11.9 21.3 26.6 24.1 1.9 7.4 100.0
2012 9.1 10.9 21.4 25.2 24.0 3.3 6.0 100.0
2013 10.5 9.2 19.3 28.6 24.4 1.8 6.3 100.0
2014 9.1 10.5 21.1 18.0 32.8 1.6 6.9 100.0
2015 6.6 13.7 21.0 22.1 31.0 1.0 4.6 100.0
Source: Bank Negara Malaysia
Table 4: Foreign Direct Investment Credits of Services and Share of Telecommunications, Computers and Information by Region,
2010-2015
ICT Job MarkeT ouTlook In MalaysIa | July, 201616
MaCro SeleCted IndICatorS
Despite some inherent challenges lately, macro-economic fundamentals for Malaysia remain largely stable. The country still enjoys low inflation rates, low unemployment and manageable overnight lending rates, well supported prudent financial management systems and fiscal policies.
lending ratesIn response to growing household debt, Bank Negara Malaysia increased the OPR to 3.25% on 10 July, 2014 and this rate has been maintained until the recent Monetary Policy Committee (MPC) meeting in July 2016 whereby the Overnight Policy Rate (OPR) was reduced to 3.00%. The ceiling and floor rates of the corridor for the OPR were correspondingly reduced to
3.25% and 2.75% respectively. As shown in Figure 3, overnight rate follows the OPR trend. As acknowledged, low base lending rate (BLR) stimulates consumption, from the private household level to small and medium business (SMB) loans and domestic investments. As shown in Figure 4, the BLR and interbank rates increased from 6.66% in 2014 to 6.79% in 2015. While the BLR differs between financial institutions, the average lending rates in commercial and investment banks stood at 4.58% and 6.88% in 2015. Despite the increase in the OPR, commercial bank rates remained stable, favouring consumption and investment climate at household and SMB sectors. In encouraging savings particularly at household sector level; the saving deposit rate on an average increased from 1.03% in 2014 to 1.06% in
Period TotalAgriculture, Forestry and
Fishing
Mining and Quarrying (including
oil and gas)
Manufacturing ConstructionWholesale and Retail
Trade
Information and Communication
Financial and
Insurance/Takaful
Activities
Other Services
Credit (RM millions)
2010 92,660 13 7,781 55,274 361 14,313 3,900 8,737 2,279
2011 103,121 212 9,946 58,852 521 10,354 2,444 12,886 7,906
2012 107,516 338 13,030 62,913 809 11,022 5,151 9,080 5,173
2013 103,868 1,039 14,629 55,218 1,487 9,883 4,958 8,048 8,607
2014 112,126 500 16,321 56,881 1,598 13,066 4,692 12,444 6,623
2015 123,430 71 18,035 69,118 2,254 9,703 5,851 11,410 6,988
AAGR: 2010-2015 (%)
5.9 39.6 18.3 4.6 44.2 -7.5 8.4 5.5 25.1
FDI Credit : Y-o-Y Growth Rate (%)
2011 11.3 1471.4 27.8 6.5 44.3 -27.7 -37.3 47.5 246.8
2012 4.3 59.3 31.0 6.9 55.4 6.4 110.8 -29.5 -34.6
2013 -3.4 207.8 12.3 -12.2 83.7 -10.3 -3.8 -11.4 66.4
2014 7.9 -51.9 11.6 3.0 7.5 32.2 -5.4 54.6 -23.0
2015 10.1 -85.7 10.5 21.5 41.0 -25.7 24.7 -8.3 5.5
FDI Credit : Sectoral Share (%)
2010 100.0 0.0 8.4 59.7 0.4 15.4 4.2 9.4 2.5
2011 100.0 0.2 9.6 57.1 0.5 10.0 2.4 12.5 7.7
2012 100.0 0.3 12.1 58.5 0.8 10.3 4.8 8.4 4.8
2013 100.0 1.0 14.1 53.2 1.4 9.5 4.8 7.7 8.3
2014 100.0 0.4 14.6 50.7 1.4 11.7 4.2 11.1 5.9
2015 100.0 0.1 14.6 56.0 1.8 7.9 4.7 9.2 5.7
Source: Bank Negara Malaysia
Table 5: Foreign Direct Investment Credits of Services and Share of Telecommunications, Computers and Information by Sector,
2010-2015

ICT Job MarkeT ouTlook In MalaysIa | July, 2016 17
1.50
2.00
2.50
3.00
3.50
4.00
2015201420132012201120102009200820072006
3.25
3.13
3.25
3.06
3.00
2.93
3.00
2.88
3.00
2.75
2.75
2.32
2.00
2.11
3.25
3.45
3.50
3.45
3.50
3.25
Overnight policy rate (OPR)
Overnight rate
PER
CEN
TAG
E (%
)
Source: Bank Negara Malaysia
Figure 3: Overnight Policy Rate (OPR) : 2006-2015
0.5
1.5
2.5
3.5
4.5
5.5
6.5
7.5
8.5
201520142013201220112010
Savings deposit:Commercial BanksBase Lending Rate:Commercial BanksAverage Lending Rate:Commercial BanksAverage Lending Rate:Investment Banks
PER
CEN
TAG
E (%
)
1.06
6.79
4.58
6.88
1.03
6.66
4.59
6.13
1.01
6.53
4.61
6.64
1.04
6.53
4.79
6.99
1.08
6.45
4.92
7.07
0.94
6.02
5.00
7.21
7.21
6.02
5.00
0.94 1.06
4.58
6.79
6.88
Source: Bank Negara Malaysia
Figure 4: Commercial and Investment Banks Lending and Deposit Rates: 2010-2015
2015. However, average lending rates for investment banks increased significantly from 6.13% in 2014, thus posing a challenge to the investment climate, especially for large scale projects.
Inflation RateAs depicted in Figure 5, the average inflation rate declined to 2.1% in 2015 from 3.1% in 2014. However, some leading research institutions had earlier
projected the inflation rate to shore up to 2.9% in 2016. Notably, the government’s ongoing subsidy rationalisation efforts that began in 2013, weakening of the ringgit impacting cost of imports and the 6% Goods and Services Tax (GST) that was implemented in April 2015 will continue to exert pressure on inflation figures, although the impact of the GST will stabilise in the long term. Despite these challenges, inflation rates should be contained and this is attributed to

ICT Job MarkeT ouTlook In MalaysIa | July, 201618
1.0
1.5
2.0
2.5
3.0
3.5
2016201520142013201220112010
PER
CEN
TAG
E (%
)
1.61.7
3.2
2.1 2.1
2.93.1
Source: Bank Negara Malaysia & PIKOM’s forecasts for 2016
Figure 5 : Malaysian Annual Inflation Rate: 2010-2016
11.5
12.0
12.5
13.0
13.5
14.0
Q4/15Q3/15Q2/15Q1/15Q4/14Q3/14Q2/14Q1/14Q4/13Q3/13Q2/13Q1/13Q4/12Q3/12Q2/12Q1/12Q4/11Q3/11Q2/11Q1/11Q4/10Q3/10Q2/10Q1/10
EMPLOYMENT(MILLION)
EMPL
OYM
ENT
IN M
ILLI
ON
S
AAGR: 2010-20152.96%
11.69 11.80 11.82 11.96 12.27 12.31 12.44 12.41 12.66 12.74 12.88 12.80 12.83 13.20 13.44 13.47 13.45 13.54 13.62 13.69 13.70 13.75 13.79 13.84
Source: Bank Negara Malaysia
Figure 6: Malaysian Employment: Q1, 2010 - Q4, 2015
falling petrol prices in the international market and more so, reduced fuel costs at retail level can help to mitigate business overheads and operating costs, mainly transportation. This was confirmed in the recent BNM report whereby BNM has projected a 2% to 3% inflation rate for 2016, compared to earlier projections of 2.5% to 3.5%.
employment and Unemployment rateMalaysia’s employment figures rose from 11.96 million in 2010 to 13.84 million by end of 2015, clocking in an AAGR of 2.96%; see Figure 6. Concurrently, unemployment rates fluctuated, highest at 3.6% and lowest at 2.7% during this period; see Figure 7.

ICT Job MarkeT ouTlook In MalaysIa | July, 2016 19
2.5
2.7
2.9
3.1
3.3
3.5
3.7
Q4/15Q3/15Q2/15Q1/15Q4/14Q3/14Q2/14Q1/14Q4/13Q3/13Q2/13Q1/13Q4/12Q3/12Q2/12Q1/12Q4/11Q3/11Q2/11Q1/11Q4/10Q3/10Q2/10Q1/10
UNEMPLOYMENTRATE (%)
PER
CEN
TAG
E (%
)
3.6 3.2 3.1 3.1 3.1 3.0 3.1 3.0 3.0 3.0 3.0 3.1 3.1 3.0 3.1 3.2 3.1 2.8 2.7 2.8 3.1 3.1 3.2 3.2
3.2
3.6
2.7
Source: Bank Negara Malaysia
Figure 7: Unemployment Rate in Malaysia, Q12010-Q42015
In fact, Malaysia’s overall unemployment rate has remained well below 4% not only in recent years but even way back since 1990, effectively reflecting full employment and perhaps, frictional unemployment attributed to job seekers’ choosiness. These consistently low figures are the result of the numerous jobs being created in the pursuit of industrialisation and positive Foreign Direct Investment (FDI) since 1982.
Over the years, Malaysia has been importing significant foreign labour workers to ease the labour shortages especially in the production and operations sectors. ICT knowledge workers have also been brought in to meet demand in the high value adding sectors as well as R&D and innovation activities.
However, despite these two phenomena, unemployment among graduates has always been a critical political and social issue. While there are graduates who are
highly selective about job placements, a significant number also end up in fields that are not related to their qualifications. A major contributing reason for unemployment among graduates is also the lack of relevant skills, experience and exposure. These include not only technical skills, but soft skills such as problem solving, confidence, leadership, communication and a good command of the English language.
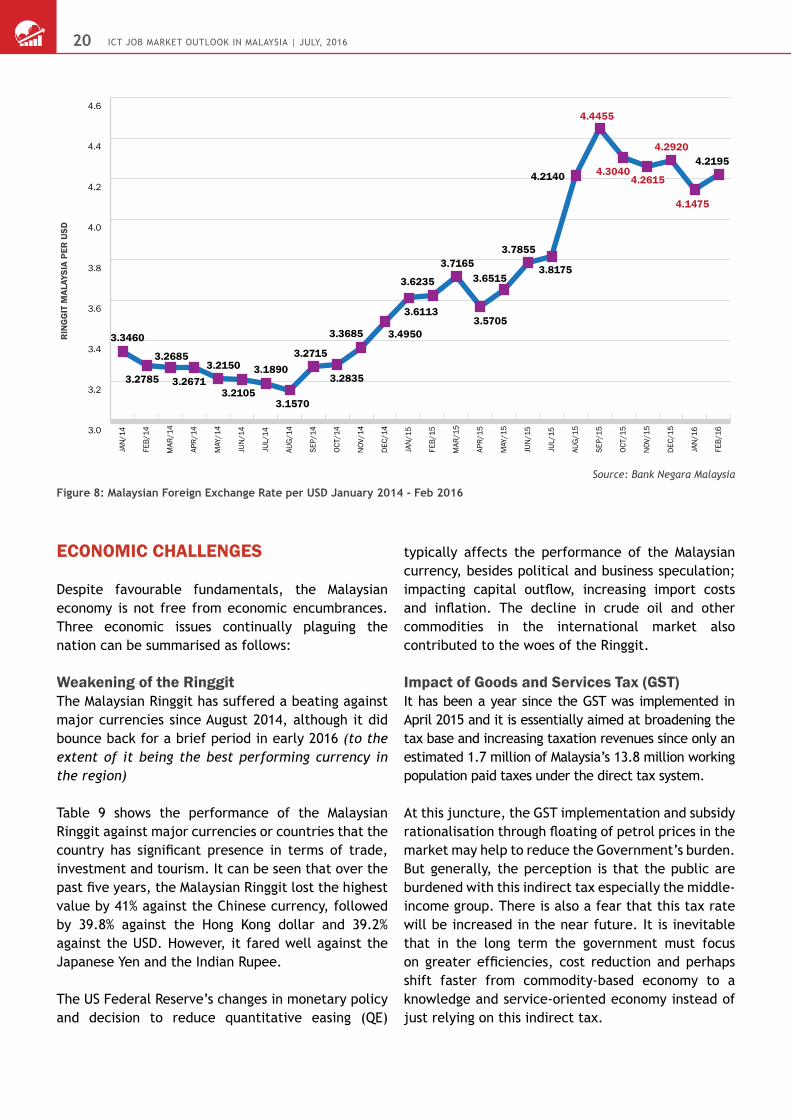
Foreign exchange rateAs shown in Figure 8, since August 2014, the value of the Malaysian Ringgit against the US dollar has continually dropped from RM3.157 until September 2015 when it touched RM4.4455 before shoring up to RM4.2195 in February 2016. During this period, the Malaysian currency weakened by 33.7%, sending disturbing signals to the business community especially in dealing with cross-border transactions in USD.
ICT Job MarkeT ouTlook In MalaysIa | July, 201620
eConoMIC ChallengeS
Despite favourable fundamentals, the Malaysian economy is not free from economic encumbrances. Three economic issues continually plaguing the nation can be summarised as follows:
weakening of the ringgitThe Malaysian Ringgit has suffered a beating against major currencies since August 2014, although it did bounce back for a brief period in early 2016 (to the extent of it being the best performing currency in the region)
Table 9 shows the performance of the Malaysian Ringgit against major currencies or countries that the country has significant presence in terms of trade, investment and tourism. It can be seen that over the past five years, the Malaysian Ringgit lost the highest value by 41% against the Chinese currency, followed by 39.8% against the Hong Kong dollar and 39.2% against the USD. However, it fared well against the Japanese Yen and the Indian Rupee.
The US Federal Reserve’s changes in monetary policy and decision to reduce quantitative easing (QE)
typically affects the performance of the Malaysian currency, besides political and business speculation; impacting capital outflow, increasing import costs and inflation. The decline in crude oil and other commodities in the international market also contributed to the woes of the Ringgit.
Impact of goods and Services tax (gSt)It has been a year since the GST was implemented in April 2015 and it is essentially aimed at broadening the tax base and increasing taxation revenues since only an estimated 1.7 million of Malaysia’s 13.8 million working population paid taxes under the direct tax system.
At this juncture, the GST implementation and subsidy rationalisation through floating of petrol prices in the market may help to reduce the Government’s burden. But generally, the perception is that the public are burdened with this indirect tax especially the middle-income group. There is also a fear that this tax rate will be increased in the near future. It is inevitable that in the long term the government must focus on greater efficiencies, cost reduction and perhaps shift faster from commodity-based economy to a knowledge and service-oriented economy instead of just relying on this indirect tax.
3.0
3.2
3.4
3.6
3.8
4.0
4.2
4.4
4.6
FEB/
16
JAN
/16
DEC
/15
NOV
/15
OCT/
15
SEP/
15
AUG
/15
JUL/
15
JUN
/15
MAY
/15
APR/
15
MAR
/15
FEB/
15
JAN
/15
DEC
/14
NOV
/14
OCT/
14
SEP/
14
AUG
/14
JUL/
14
JUN
/14
MAY
/14
APR/
14
MAR
/14
FEB/
14
JAN
/14
RIN
GG
IT M
ALAY
SIA
PER
USD
3.3460
3.2785
3.2685
3.26713.2150
3.2105
3.1890
3.1570
3.2715
3.2835
3.3685 3.4950
3.6113
3.6235
3.7165
3.5705
3.6515
3.7855
3.8175
4.2140
4.4455
4.30404.2615
4.2920
4.1475
4.2195
Source: Bank Negara Malaysia
Figure 8: Malaysian Foreign Exchange Rate per USD January 2014 - Feb 2016

ICT Job MarkeT ouTlook In MalaysIa | July, 2016 21
PeriodUSD GBP Euro 100 HKD 100 JPY CNY SGD 100 IDR 100 THB
As end of the Year : Exchange Rates Malaysian Ringgit
2010 3.0835 4.7817 4.0804 39.615 3.7869 0.4662 2.3859 0.0344 10.227
2011 3.1770 4.8962 4.1118 40.890 4.0975 0.5034 2.4427 0.0347 10.009
2012 3.0583 4.9420 4.0412 39.453 3.5576 0.4909 2.5030 0.0317 9.9910
2013 3.2815 5.4076 4.5263 42.318 3.1281 0.5422 2.5943 0.0269 9.9757
2014 3.4950 5.4396 4.2513 45.058 2.9255 0.5637 2.6449 0.0281 10.627
2015 4.2920 6.3607 4.6918 55.374 3.5645 0.6610 3.0356 0.0311 11.922
% Change: 2010-2015” 39.2 33.0 15.0 39.8 -5.9 41.8 27.2 -9.6 16.6
Source: Bank Negara Malaysia
Table 9: Exchange Rate of Malaysian Ringgit against Major Currencies, 2013-Q1 2015
reliance on Foreign workersForeign labour forms a big portion of the Malaysian workforce, specifically in the lower rung jobs in manufacturing, agriculture, construction and services as well as domestic maids. The total number of foreign workers registered with the immigration authority rose from 1.818 million in 2010 to 2.073 million in 2014; see Figure 9.
In the long run, this heavy reliance on foreign labour can be detrimental to the country. We have to address
the existing labour issues, in particular heavy reliance on low-skilled foreign workers, low wage structure, inadequate skilled jobs, low labour productivity, and youth unemployment.
Like in the developed countries, it is high time more technological solutions including information and communication technologies are deployed in addressing labour shortages especially in managing dirty, difficult and dangerous jobs.
1400
1500
1600
1700
1800
1900
2000
2100
2200
2300
20142013201220112010200920082007200620052004
THO
USA
ND
S
FOREIGN WORKERS(THOUSANDS) 2073.12250.31572.61573.11817.91918.22062.62044.81869.21815.21470.1
Source: Temporary Work Visit Pass, Immigration Department of Malaysia
Figure 9: Registered Foreign Workers in Malaysia, 2004-2014

SECTION B:
ICt IndUStry oUtlooK 2016/2017
Driven by strong fundamentals and a fairly healthy Gross Domestic Product (GDP) in the last decade, the overall Malaysian ICT industry continued to flourish, in particular the ICT Services sector even though the economy grew by only 5.0% in 2015, which was lower than the 6.0% growth rate of 2014.
Past years’ figures have consistently showed an upward trend in the services sector in contrast to the ICT Manufacturing sector, which has been on the decline.
A number of fundamental factors have been spurring this growth for the industry. They include the various on-going national transformation plans, rising middle-level income population and a fragmented market that is mostly focused on urban areas and cities such as Kuala Lumpur, Penang and Johor, leaving great potential for further development in the other states, including in East Malaysia.
Factors such as the low PC penetration especially in the rural areas, an improving internet and broadband penetration rate and cost (albeit still relatively high compared to economies in the region) and continuous efforts and measures by the Government to develop the country into a regional services hub such as outsourcing for specific industries is helping the industry.
Oil and Gas is among the industries that utilise and leverage on ICT a great deal. This has often been the most attractive sector for employment and it contributes immensely to the growth of the ICT industry; although in 2015 this industry registered one of the lowest salary growths.
Overall, other key industries that are still very buoyant and will continue to have a demand for
ICT include the Government, Telecommunications, Education, Financial Services and Health.
In efforts to attain the last mile towards becoming a developed nation by 2020, it is also important to take into cognizance some of the latest trends in the ICT industry. They include continuous innovations in Broadband, Mobile Computing, adoption of Cloud Computing at the enterprise level, pervasive social media, Big Data Analytics deployment, next level of e-Commerce implementation and realisation of the potential of IoT.
These are areas of opportunities that can be leveraged on immediately but they cannot be addressed in isolation. IDC coined this as the Third Platform, which is effectively the third model of computing platform cementing the inter-dependencies between social media, mobile, cloud computing and big data including IoT. While a successful shift to this Third Platform will gain immense benefits and rewards, it is perhaps easier to profess than to implement.
oVerall ICt IndUStry PerForManCe
The entire ICT Industry can be broadly grouped into two categories – ICT Manufacturing and ICT Services sectors. According to the ICT Satellite Account released by the Department of Statistics Malaysia (DOSM), the GDP value of ICT products broadly constitutes; computers and peripheral equipment, communications equipment, consumer electronics equipment and various ICT components.
On the other hand, the ICT Services sector encompasses a wide range of services and products from the internet and telecommunications fields, satellite and data communication services, to

ICT Job MarkeT ouTlook In MalaysIa | July, 2016 2323
hardware and software, publishing, media, data processing, e-commerce and ICT trade services.
The ICT Satellite Account published by DOSM carried data for the period 2010 to 2014. Among others, it showed a significant increase of 12.05% in total ICT value from RM122.8 billion in 2013 to RM137.6 billion in 2014. Applying a simple projection, the total ICT value for 2015 is expected to reach RM155.2 billion based on an average annual growth rate (AAGR) of 8.0% for the period 2010 - 2015.
This increase was attributed to the positive growth registered in ICT Manufacturing, ICT Services, e-Commerce and ICT Trade in services. The share of overall ICT industry to the economy expanded from 16.5% in 2010 to 17.6% by 2015.
Contribution from e-Commerce related services has been on the rise, albeit slower compared to other countries. Its share of the economy increased from 3.6% to 4.8% during this period; see Figure 1.

ICT Job MarkeT ouTlook In MalaysIa | July, 20162424
12.9 11.9 11.7 12.0 12.4 12.8
3.6 4.0 4.2 4.4 4.6 4.8
3
5
7
9
11
13
15
201520142013201220112010
PER
CEN
TAG
E (%
)
SHARE OF ECONOMY
SHARE OF ECONOMY
ICT industry
e-commerce
Source: Department of Statistics Malaysia
Figure 1 : Share of ICT Industry and E-Commerce to the Economy: 2010-2015
80
90
100
110
120
130
140
150
160
Q4/15
Q3/15
Q2/15
Q1/15
Q4/14
Q3/14
Q2/14
Q1/14
Q4/13
Q3/13
Q2/13
Q1/13
Q4/12
Q3/12
Q2/12
Q1/12
Q4/11
Q3/11
Q2/11
Q1/11
Q4/10
Q3/10
Q2/10
Q1/10
ELECTRONICS:INDUSTRIAL
PRODUCTION INDEX(2010=100)
IND
EX V
ALU
E (2
010=
100)
108.1 105.9 94.3 91.7 90.2 96.2 102.3 95.2 100.9 109.3 113.3 109.4 111.1 127.9 136.8 137.2 132.4 147.3 142.2 145.5 132.2 138.3 147.2 153.8
Source: Bank Negara Malaysia
Figure 2 : Electronics Industrial Production Index : Q1, 2010 - Q4, 2015
ICt ManUFaCtUrIng PerForManCe
Despite facing challenges in the electronics industry, overall ICT Manufacturing still grew positively as shown in the Electronics Industrial Production Index. This index grew from 108.1 in the 1st quarter of 2010 to 153.8 in the last quarter of 2015; see Figure 2. Nonetheless, further examination showed that the hardware production component in the ICT Manufacturing sector, in particular integrated circuits, semi-conductors and electronic transistors,
have registered a significant decline over the years in terms of production units.
As shown in Figure 3, production of integrated circuits and semi-conductors registered a negative AAGR of -8.6% and -8.1% respectively during the period 2010-2015.
The electronic transistors segment recorded positive growth of 0.77%, which is considered very low in comparison to its performance during the early nineties.

ICT Job MarkeT ouTlook In MalaysIa | July, 2016 2525
Period Integrated circuits (million units)
Semiconductors (million units)
Electronic transistors (million units)
2010 38007 17997 34184
2011 33380 16281 34189
2012 39391 19765 36119
2013 35686 19281 35362
2014 24613 15017 36577
2015 24253 11797 35523
“AAGR : 2010-2015
(%)”-8.6 -8.1 0.77
Source: Bank Negara Malaysia
Table 1 : Production Volume of Selected Micro-Electronics Items: 2010-2015
12.5 21.7 16.2 3.4 -8.6
15.3 33.0 4.4 0.8 -8.1
-15
-10
-5
0
5
10
15
20
25
30
35
40
2010-20152006-20102001-20051996-20001991-1995
PER
CEN
TAG
E (%
)
7.6 13.9 8.5 3.9 0.8
INTEGRATED CIRCUITS (%)
SEMICONDUCTORS (%)
ELECTRONIC TRANSISTORS (%)
Source: Bank Negara Malaysia
Figure 3 : Average Annual Growth Rate Of Selected Micro-Electronics Items: 1991-2015
As shown in Figure 3, these three ICT sectors have been declining since 2000 and this is not unexpected as emerging lower-cost production economies in Asia, in particular China and Vietnam, have been on the rise since the turn of the century. In addition, with the emergence of new digital technologies, the demand for these micro-electronics components has been falling, leading to the closure of many plants.
ICt SerVICeS SeCtor PerForManCe
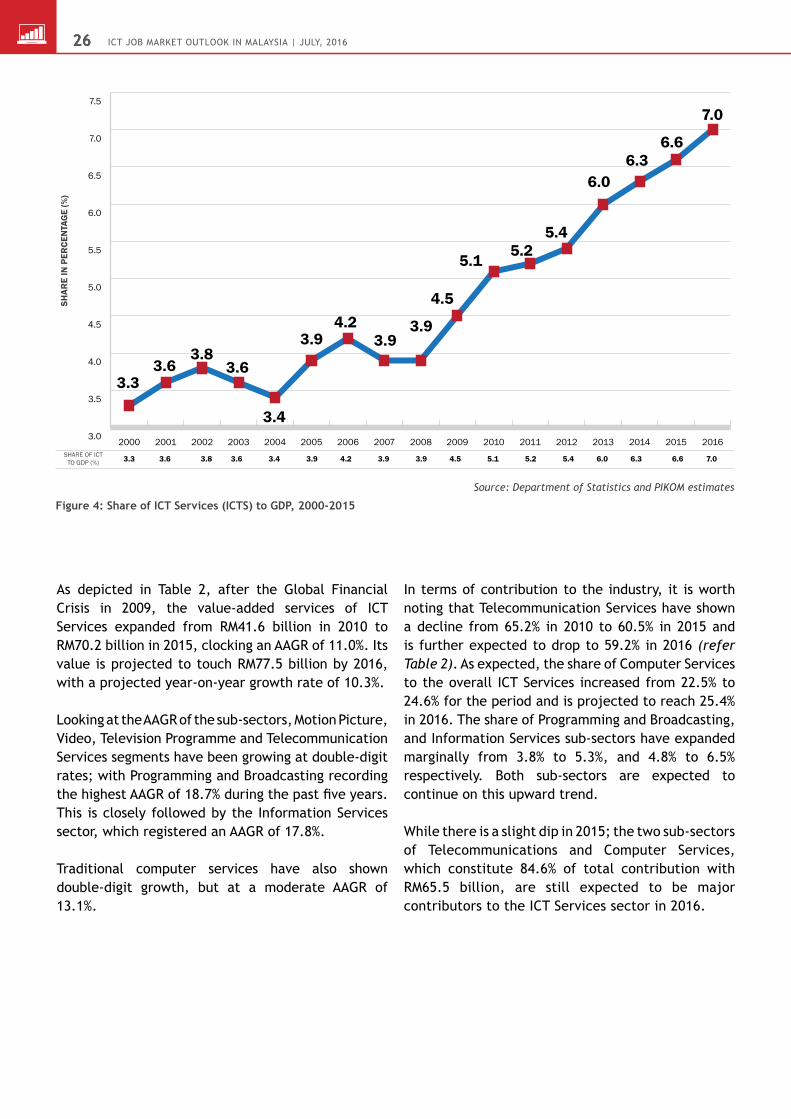
The Services sector, on the other hand, has been experiencing consistent growth since 2000. This share of the ICT Services sector has almost doubled from 3.3% in 2000 to 6.6% in 2015; and is projected to reach 7.0% by the end of this year (refer Figure 4).
ICT Job MarkeT ouTlook In MalaysIa | July, 20162626
As depicted in Table 2, after the Global Financial Crisis in 2009, the value-added services of ICT Services expanded from RM41.6 billion in 2010 to RM70.2 billion in 2015, clocking an AAGR of 11.0%. Its value is projected to touch RM77.5 billion by 2016, with a projected year-on-year growth rate of 10.3%.
Looking at the AAGR of the sub-sectors, Motion Picture, Video, Television Programme and Telecommunication Services segments have been growing at double-digit rates; with Programming and Broadcasting recording the highest AAGR of 18.7% during the past five years. This is closely followed by the Information Services sector, which registered an AAGR of 17.8%.
Traditional computer services have also shown double-digit growth, but at a moderate AAGR of 13.1%.
In terms of contribution to the industry, it is worth noting that Telecommunication Services have shown a decline from 65.2% in 2010 to 60.5% in 2015 and is further expected to drop to 59.2% in 2016 (refer Table 2). As expected, the share of Computer Services to the overall ICT Services increased from 22.5% to 24.6% for the period and is projected to reach 25.4% in 2016. The share of Programming and Broadcasting, and Information Services sub-sectors have expanded marginally from 3.8% to 5.3%, and 4.8% to 6.5% respectively. Both sub-sectors are expected to continue on this upward trend.
While there is a slight dip in 2015; the two sub-sectors of Telecommunications and Computer Services, which constitute 84.6% of total contribution with RM65.5 billion, are still expected to be major contributors to the ICT Services sector in 2016.
3.0
3.5
4.0
4.5
5.0
5.5
6.0
6.5
7.0
7.5
20162015201420132012201120102009200820072006200520042003200220012000SHARE OF ICT
TO GDP (%)
SHAR
E IN
PER
CEN
TAG
E (%
)
3.3
3.3 3.6 3.8 3.6 3.4 3.9 4.2 3.9 3.9 4.5 5.1 5.2 5.4 6.0 6.3 6.6 7.0
3.63.8
3.6
3.4
3.94.2
3.93.9
4.5
5.15.2
5.4
6.06.3
6.6
7.0
Source: Department of Statistics and PIKOM estimates
Figure 4: Share of ICT Services (ICTS) to GDP, 2000-2015

ICT Job MarkeT ouTlook In MalaysIa | July, 2016 2727
Year
Overall ICTS Value Added
Services (‘000)
Telecom-munication
Services (‘000)
Computer Services (‘000)
Sub-total Publishing (‘000)
Motion picture,
video and television
programme (‘000)
Program-ming & Broad-casting (‘000)
Information Services (‘000)
Sub-total
2010 41,593,590 27,106,855 9,360,934 36,467,789 503,080 1,056,006 1,565,327 2,001,388 5,125,801
2011 45,259,877 29,778,845 9,945,621 39,724,466 590,079 1,065,823 1,690,288 2,189,221 5,535,411
2012 49,498,475 32,178,234 10,855,882 43,034,116 623,188 1,207,919 2,231,082 2,402,170 6,464,359
2013 57,097,981 36,186,289 13,013,260 49,199,549 708,501 1,261,831 2,655,537 3,272,563 7,898,432
2014 64,142,369 39,967,634 15,072,265 55,039,899 755,818 1,337,788 3,151,607 3,857,257 9,102,470
2015 70,237,209 42,496,875 17,291,392 59,788,267 795,823 1,413,745 3,692,957 4,546,416 10,448,942
2016 77,485,620 45,856,507 19,670,641 65,527,148 830,478 1,489,702 4,279,587 5,358,705 11,958,472
AAGR : 2010 -2015
(%)11.0 9.4 13.1 10.4 9.6 6.0 18.7 17.8 15.3
Year-on-Year Growth Rate (%)
2011 8.8 9.9 6.2 8.9 17.3 0.9 8.0 9.4 8.0
2012 9.4 8.1 9.2 8.3 5.6 13.3 32.0 9.7 16.8
2013 15.4 12.5 19.9 14.3 13.7 4.5 19.0 36.2 22.2
2014 12.3 10.4 15.8 11.9 6.7 6.0 18.7 17.9 15.2
2015 9.5 6.3 14.7 8.6 5.3 5.7 17.2 17.9 14.8
2016 10.3 7.9 13.8 9.6 4.4 5.4 15.9 17.9 14.4
Sub-sector Share of Overall ICT Services (%)
2010 100.0 65.2 22.5 87.7 1.2 2.5 3.8 4.8 12.3
2011 100.0 65.8 22.0 87.8 1.3 2.4 3.7 4.8 12.2
2012 100.0 65.0 21.9 86.9 1.3 2.4 4.5 4.9 13.1
2013 100.0 63.4 22.8 86.2 1.2 2.2 4.7 5.7 13.8
2014 100.0 62.3 23.5 85.8 1.2 2.1 4.9 6.0 14.2
2015 100.0 60.5 24.6 85.1 1.1 2.0 5.3 6.5 14.9
2016 100.0 59.2 25.4 84.6 1.1 1.9 5.5 6.9 15.4
Source: Department of Statistics, EPU and PIKOM estimates
Table 2: Distribution of ICT Services and Growth rate by Sub-sectors, 2000-2015
e-CoMMerCe – where are we?
The National e-Commerce Council developed a National e-Commerce strategic roadmap for fast tracking e-Commerce in the country. It encompasses six key thrusts – accelerating seller adoption, promoting the national brand to boost cross-border e-Commerce, making strategic investments in selected e-Commerce businesses, providing economic incentives, lifting non-tariff barriers and increasing adoption of e-Procurement by business.
According to the Ministry of International Trade and Industry (MITI), the e-Commerce trade in Malaysia currently contributes about 5.8% to the country’s Gross Domestic Product (GDP) and is expected to contribute between 9% and 10% by 2020. It has been growing at 10% to 11% annually in Malaysia. Although this is a good result, the Ministry acknowledged that e-Commerce in Malaysia still lags behind other countries such as China, whose e-Commerce contributes 21% to its GDP while US’s e-Commerce contributes 35% to its GDP.
ICT Job MarkeT ouTlook In MalaysIa | July, 20162828
Global management consulting firm AT Kearney also projected that Malaysia’s e-Commerce market will continue to be highly attractive with plenty of room to grow. Its latest report stated that the retail e-Commerce market size in ASEAN in 2014 is worth about US$9 billion.
In Malaysia, the retail e-Commerce market size is worth about US$1.5 billion, ranking the country third behind Indonesia and Singapore, where the size is about US$2.2 billion and US$1.9 billion respectively.
It also reported that there are 87 million online shoppers in ASEAN, which is slightly more than half of its online population of 158 million. In Malaysia, about 80% of its 20 million netizens are online shoppers, ranking the country first in the region.
It also estimated that about 40% of the e-Commerce spending in Malaysia is cross border with American and Chinese web-shops being the more popular choices. However, issues such as fulfilment, different jurisdictions, regulations, cross-border logistics and compliance will have to be addressed as a priority before the ‘‘last mile’’ can be reached.
The AT Kearney report also compared e-Commerce revenue and spending, and figures showed that the gap between the two has been closing since 2011. In 2015, the spending was about RM93.8 billion while revenue was about RM72.3 billion.
It is estimated that spending will be about RM95.6 billion while revenue is expected to be about RM80.9 billion in 2016. AT Kearney projected that 2018 will be the year when revenue could potentially overtake spending for the first time, making Malaysia a Net Exporter.
PIKOM is already driving this ASEAN Economic Community (AEC) Digital Task force (an initiative by Asian-Oceanic Computing Industry Organisation - ASOCIO) by proposing and kick-starting various programmes among the ASOCIO members.
They include cross international marketplace collaboration, comprehensive SMEs on-boarding programmes and setting up an AEC e-fulfilling network with the objective to spur e-Commerce
trade, and lifting the barriers to e-Commerce not just among ASEAN members but also potentially to India, Korea, Japan and China. (Source: Proposal to grow AEC e-Commerce trade by PIKOM 2016).
IndUStry ChallengeS & reCoMMendatIonS
Despite the impressive growth of the industry in the past two decades, the industry has been plagued by challenges; some external but mostly inherent within the industry. These include:
a. Skills and qualifications not aligned and/or meeting the expectations of the industry, especially for fresh graduates.
b. Jobs not matching with the qualifications and experiences of candidates. Some employers tend not to understand the differences between Computer Science, Information Systems, Information Technology and/or Software engineering. This could have been caused by a surfeit of curricula and glorified names for degree offerings in higher institutions of education. It has been claimed that some of the nomenclature of the degrees do not reflect the discipline and often the degrees are named based on what is perceived as “marketable”.
c. Experienced talent lured away by neighbouring countries and English-speaking countries – due in part to the weakening of the ringgit.
d. Salary and compensation disparity with other economies – due in part to the weakening ringgit including dollar-for-dollar comparison.
e. Drop in the number of students embarking on Computer Science programmes, resulting in fewer Computer Science graduates.
f. Perception of some parents that there is a lack of job opportunities in the ICT industry.
g. Shift from an ICT ‘’Consumption’’ to an ICT ‘‘Creation’’ culture is still not very apparent although there are continuous promotions for
ICT Job MarkeT ouTlook In MalaysIa | July, 2016 2929
entrepreneurship by the Government. It has often been claimed that there are poor R&D, innovation, patenting and commercialisation efforts.
h. The GST implementation in 2015 has also caused a slowdown in the industry even though there is an expectation that it will resume its normal state within 18 to 24 months.
i. Job hopping continues to be a rampant practice especially for the younger generation.
j. ‘’Paradigm Shift’’ of buying practices and trend towards ‘‘online’’ purchases is also apparent today and affecting the ICT industry, in particular the retailers. This is inevitable as the existing business models no longer prevail especially for the traditional retail business.
k. If the AEC opens up to be a truly free trade zone for all ASEAN member countries, it will also be a major threat to the local ICT industry, in particular to those who continue to only focus on the local market.
Some strategic recommendations for considerations:
a. We must ensure that our salaries, in particular of fresh graduates, are at least at par with the neighboring economies.
b. There must be continuous collaboration and communication between the industry, academics and Government agencies and ministries.
c. Should inculcate longer term internship and programmes for ICT students in Higher Institutions of Education and Universities in collaboration with the industries. This is to ensure that fresh graduates have at least the basic skills and the working “experience” attributes expected by employers.
d. Promote and introduce ICT vocational programmes such as programming, security and network technicians in colleges and vocational institution as one do not need to earn a “degree” to be successful in the industry.
e. The industry must continue to promote the uptake of globally recognised certifications such as the Capability Maturity Model Integration (CMMI) and People Capability Maturity Model (PCMM) as these are crucial for globalising local ICT products and services. The industry must encourage entrepreneurship and promote R&D programmes at higher education institutions.
f. Foundational ICT curriculum should be introduced at the primary school level. Inevitably, our children are already exposed to ICT devices and gadgets, including smartphones.
g. The Government must ensure that the quality of Science and Mathematics curricula in schools as well as in higher education institutions be maintained and benchmarked against world class standards; in particular, enabling students to apply this knowledge in the real world leveraging on modern technologies and methodologies. Hence, there is also a need to revitalise interest in pursuing STEM- (Science, Technology, Engineering and Mathematics) and the Government needs to continue to invest in forwarding STEM education and upskilling STEM professionals.
h. Industry associations and government agencies must continue to promote e-Commerce but they must ensure that the payment systems are secure and the logistics of moving the products and goods (locally) are free of bureaucracy and reduced inefficiencies.

2015 Salary growth rate
The overall average monthly salary of ICT professionals in Malaysia in 2015 was RM8,114 (Figure 1) against RM7,706 in 2014. Effectively, salaries increased by 5.3% in 2015 over 2014, a lower year-on-year growth as compared with 7.9% in 2014 over 2013. The 2015 growth rate is by far the lowest over the past 8 years since this publication was first released.
Interestingly, one of the big contrast when analysing 2015 figures against previous years’ figures was the absence of high double digit growth for all categories and industries. Some of these impressive growth figures registered in the past years were from 20% to 50%, in particular Computers/IT hardware and software; Automotive and Heavy industry; and Agriculture. The highest growth recorded for 2015 (over 2014) in certain categories and industries was about 15% while the other end of the spectrum showed a low of 0.1%.
Since the last quarter of 2014, the Malaysian economy has been hit by a number of adverse factors. These included the weakening of the Malaysian Ringgit against major currencies, plummeting oil prices in the international market (taking a heavy toll on the country's revenue and posing budgetary challenges); fluctuating commodity prices especially palm oil; and the adverse publicity surrounding the 1MDB entity.
It was therefore not surprising that these economic woes are having an adverse impact on the ICT industry which in turn caused a ripple effect on the overall salary growth for 2015. While the industry expected a downturn, it certainly didn’t expect the impact to be of such magnitude. Perhaps it was also a good wake up call for the ICT industry to realise that while overall average monthly salary has been growing healthily for the past 8 years, future salary growth cannot be taken for granted.
SECTION C:
ICt Salary trendS & benChMarKIng
5000
5500
6000
6500
7000
7500
8000
8500
20162015201420132012201120102009
RIN
GG
IT M
ALAY
SIA
8.2%
6.9%
7.1%
7.9%
5.3%
4.7%
10.9%
8,4968,1147,7067,1426,6676,2385,6265,200
Source: Jobstret.com and PIKOM, 2015
Figure 1: Average Monthly Salary of ICT Professionals in Malaysia: 2009-2016
(An A�liate Company of Hitachi Sunway Information Systems) www.pws.my
BUILD TODAYthe DATA CENTRE
of TOMORROW
DATA CENTRE INFRASTRUCTURE PROVIDER
Datacentre Consultancy ServicesDatacentre Design & BuildDatacentre Project ManagementDatacentre Testing and Commissioning Green Building Index Facilitation & Consultancy ServicesDatacentre Professional ServicesICT Infrastructure Migration Services
ICT Job MarkeT ouTlook In MalaysIa | July, 2016 3131
Apart from macro-economic problems, the ICT sector was also plagued by a number of recurring industry issues. For years now, the industry had been experiencing an outflow of experienced professionals to lucrative markets in Asia, US and Europe, thus posing challenges for the industry to recruit the right candidates for the right jobs. In the absence of experienced personnel, the industry may have to contend with ICT professionals with lower qualifications and experience which is not healthy for the industry. Retrenchment in the thousands from multinationals worldwide has also significantly affected the ICT industry. There continues to be a rationalisation of roles and responsibilities in the industry and a “hiring freeze’’ is certainly an option that companies will consider if the economic woes persist and signs of recovery are not imminent.
While the GDP growth rate has been projected at 4.5% for both years on the premise of a strong
domestic driven growth; there is still concern over the volatility of the global economy with the latest US Federal Reserve report indicating softer macro-economic data, in particular increasing interest rates, strong US currency, slowdown of the Chinese economy and the ongoing anaemic growth in the Eurozone.
For the ICT Industry, taking into account the economic outlook and the inherent industry issues, PIKOM is projecting an overall average salary growth of 4.7% for 2016 (Figure 1), which will be lower than 2015. This trend may persist into 2017 if these internal and external factors continue to plague the economy.
by Job CategoryGenerally all ICT job categories registered a positive salary increase in 2015 as depicted in Table 1, albeit the growth was much lower than expected.
(An A�liate Company of Hitachi Sunway Information Systems) www.pws.my
BUILD TODAYthe DATA CENTRE
of TOMORROW
DATA CENTRE INFRASTRUCTURE PROVIDER
Datacentre Consultancy ServicesDatacentre Design & BuildDatacentre Project ManagementDatacentre Testing and Commissioning Green Building Index Facilitation & Consultancy ServicesDatacentre Professional ServicesICT Infrastructure Migration Services

ICT Job MarkeT ouTlook In MalaysIa | July, 20163232
Job Category Fresh Graduates: Entry Level
Junior Executives: 1-4 Years Working
Experience
Senior Executives: > 4 Years Working
Experience
Middle Level Manager Senior Manager Overall
Unit RM Y-o-Y(%) RM Y-o-Y
(%) RM Y-o-Y(%) RM Y-o-Y
(%) RM Y-o-Y(%) RM Y-o-Y
(%)
2009 1,971 2,800 4,332 6,163 10,368 5,200
2010 2,181 10.7 2,936 4.9 4,514 4.2 7,005 13.7 10,795 4.1 5,626 8.2
2011 2,238 2.6 3,151 7.3 5,039 11.6 7,837 11.9 12,166 12.7 6,238 10.9
2012 2,324 3.8 3,205 1.7 5,344 6.1 8,434 7.6 13,674 12.4 6,667 6.9
2013 2,438 4.9 3,439 7.3 5,744 7.5 8,986 6.5 14,661 7.2 7,142 7.1
2014 2,581 5.9 3,719 8.1 6,157 7.2 9,591 6.7 16,057 9.5 7,706 7.9
2015 2,718 5.3 3,894 4.7 6,483 5.3 10,195 6.3 17,053 6.2 8,114 5.3
2016 2,846 4.7 4,081 4.8 6,743 4.0 10,725 5.2 17,939 5.8 8,496 4.7
Annual Average Growth Rate
(AAGR):2010-2015
4.5 5.8 7.5 7.8 9.6 7.6
Job Category Fresh Graduates: Entry Level
Junior Executives: 1-4 Years Working
Experience
Senior Executives: > 4 Years Working
Experience
Middle Level Manager Senior Manager Overall
Unit Ratio Ratio Ratio Ratio Ratio Ratio
2009 1.00 1.42 2.20 3.13 5.26 2.64
2010 1.00 1.35 2.07 3.21 4.95 2.58
2011 1.00 1.41 2.25 3.50 5.44 2.79
2012 1.00 1.38 2.30 3.63 5.88 2.87
2013 1.00 1.41 2.36 3.69 6.01 2.93
2014 1.00 1.44 2.39 3.72 6.22 2.99
2015 1.00 1.43 2.39 3.75 6.27 2.99
2016 1.00 1.43 2.37 3.77 6.30 2.99
Source: Jobstreet.com and PIKOM, 2015
Table 1: Average Salary of ICT Professionals by Job Category: 2009-2016
Table 1 shows the average salary of ICT professionals by job category for the period 2009-2016, including projections for 2016. As before, ICT professionals in the managerial category recorded growth rates higher than those in the lower categories in 2015. Specifically, Middle Level Manager and Senior Manager categories enjoyed the highest increase at 6.3% and 6.2% respectively. Fresh Graduates and Senior Executives categories recorded a 5.3% growth while Junior Executives attained a 4.7% increase.
For 2016, PIKOM projects an overall average monthly salary growth for ICT professionals of 4.7% which is lower than 2015. It forecasts that the overall average ICT salary will rise from RM8,114 in 2015 to RM8,496 in 2016. It is also expected that Senior Managers and Middle Level Managers will continue to attain higher rates of salary growth; that is 5.8% and 5.2% respectively.
Table 1 also provides a comparison of the salary gaps by benchmarking against the Fresh Graduates level. It can be seen that the ICT salary gap is still widening for all job categories (albeit the rate of increase has reduced over the years) but is more pronounced in the upper rung job categories. Specifically, Senior Managers earned 6.27 times the salary of Fresh Graduates in 2015 (this gap was only 4.95 times five years ago in 2010).
The Middle Management category also registered a widening gap that increased from 3.21 to 3.75 times during the same 5-year period. While these gaps will always be inherent in the overall average salary structure, continued widening of these gaps is not healthy for the industry, in particular for fresh graduates entering the workforce as this may deter them from the industry.
ICT Job MarkeT ouTlook In MalaysIa | July, 2016 3333
IndustryOverall ICT Industry Y-0-Y:
2014 - 2015 (%)
AAGR: 2009 -
2015 (%)2009 2010 2011 2012 2013 2014 2015
Construction/Building/ Engineering 2,538 2,834 3,138 3,322 3,758 3,998 4,201 5.1 8.8
Education 2,775 2,974 3,418 3,534 3,934 4,248 4,549 7.1 8.6
Automotive/Heavy Industry/Machinery 3,495 3,880 4,331 4,526 5,066 5,428 5,715 5.3 8.5
Electrical & Electronics 2,926 3,145 3,648 3,964 3,988 4,588 4,778 4.2 8.5
Agriculture / Plantation / Aquaculture 4,069 4,195 4,720 5,106 5,578 6,031 6,413 6.3 7.9
Banking Services 3,721 4,015 4,392 4,678 4,753 5,419 5,633 4.0 7.2
Services: Social Services/NGO 3,284 3,608 3,846 4,272 4,523 4,719 4,952 4.9 7.1
Chemical / Fertilisers / Pesticides 4,659 4,893 5,619 6,016 6,508 6,571 6,992 6.4 7.0
Property / Real Estate 3,581 3,761 4,981 4,811 4,977 5,234 5,363 2.5 7.0
Science & Technology/Aerospace/BioTechnology 3,726 3,861 4,266 4,803 4,872 5,248 5,396 2.8 6.4
Computer/IT (Software) 3,710 3,877 4,185 4,322 4,534 5,100 5,324 4.4 6.2
Wholesale/Retail/Trading 3,211 3,412 3,999 4,159 4,236 4,394 4,597 4.6 6.2
Consulting (Business/Technical) 3,809 4,115 4,349 4,531 4,760 5,234 5,412 3.4 6.0
Call Center/IT-Enabled Services/BPO 3,822 4,025 4,344 4,426 4,632 5,181 5,296 2.2 5.6
Financial Services/Securities/Insurance 3,881 4,088 4,298 4,592 4,716 5,103 5,295 3.8 5.3
Transport/Storage/Freight/Shipping 4,013 4,127 4,377 4,424 4,899 5,160 5,343 3.5 4.9
Computer/IT (Hardware) 3,696 3,998 4,117 4,303 4,518 4,720 4,913 4.1 4.9
Hotel/Restaurant/Food Service/ Hospitality 3,092 3,272 3,376 3,682 3,837 3,951 4,103 3.8 4.8
Oil/Gas/Petroleum 4,465 4,800 5,096 5,447 5,504 5,723 5,888 2.9 4.7
Telecommunication 3,952 4,049 4,401 4,558 4,758 5,042 5,206 3.3 4.7
Semiconductor/Wafer Fabrication 3,998 4,114 4,671 4,803 4,813 4,978 5,238 5.2 4.6
Utilities 4,048 4,120 4,453 4,685 4,820 4,938 5,115 3.6 4.0
Manufacturing / Production 4,047 4,193 4,510 4,567 4,754 4,947 5,079 2.7 3.9
Printing/Publishing 3,079 3,200 3,327 3,432 3,597 3,659 3,731 2.0 3.3
Source: Jobstreet.com and PIKOM, 2015
Table 2: Average Salary of ICT Professionals by Job Industry: 2009-2015
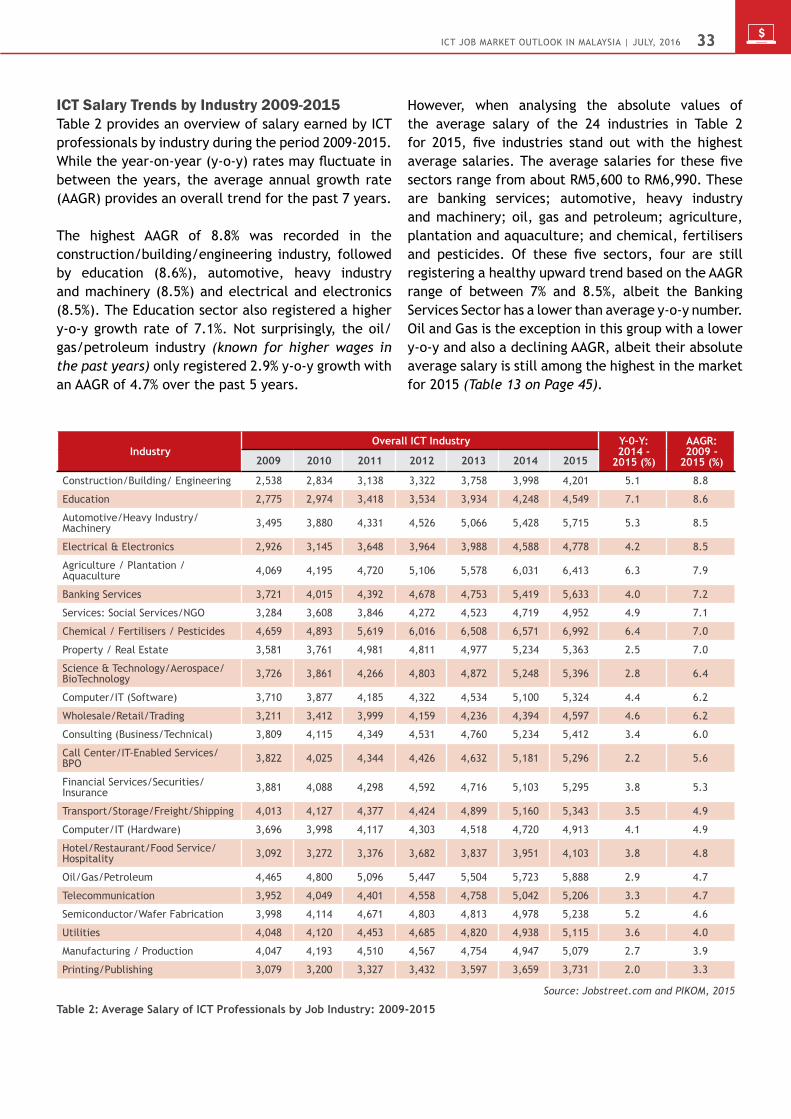
ICt Salary trends by Industry 2009-2015Table 2 provides an overview of salary earned by ICT professionals by industry during the period 2009-2015. While the year-on-year (y-o-y) rates may fluctuate in between the years, the average annual growth rate (AAGR) provides an overall trend for the past 7 years.
The highest AAGR of 8.8% was recorded in the construction/building/engineering industry, followed by education (8.6%), automotive, heavy industry and machinery (8.5%) and electrical and electronics (8.5%). The Education sector also registered a higher y-o-y growth rate of 7.1%. Not surprisingly, the oil/gas/petroleum industry (known for higher wages in the past years) only registered 2.9% y-o-y growth with an AAGR of 4.7% over the past 5 years.
However, when analysing the absolute values of the average salary of the 24 industries in Table 2 for 2015, five industries stand out with the highest average salaries. The average salaries for these five sectors range from about RM5,600 to RM6,990. These are banking services; automotive, heavy industry and machinery; oil, gas and petroleum; agriculture, plantation and aquaculture; and chemical, fertilisers and pesticides. Of these five sectors, four are still registering a healthy upward trend based on the AAGR range of between 7% and 8.5%, albeit the Banking Services Sector has a lower than average y-o-y number. Oil and Gas is the exception in this group with a lower y-o-y and also a declining AAGR, albeit their absolute average salary is still among the highest in the market for 2015 (Table 13 on Page 45).
ICT Job MarkeT ouTlook In MalaysIa | July, 20163434
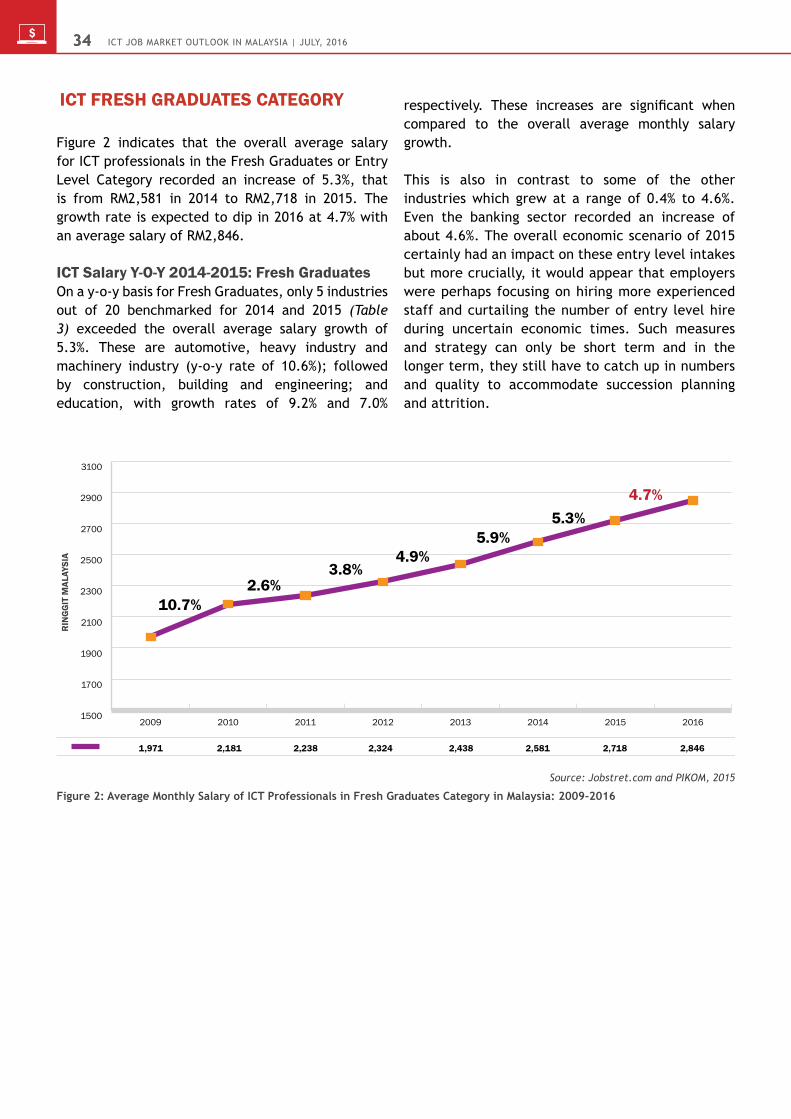
ICt FreSh gradUateS Category
Figure 2 indicates that the overall average salary for ICT professionals in the Fresh Graduates or Entry Level Category recorded an increase of 5.3%, that is from RM2,581 in 2014 to RM2,718 in 2015. The growth rate is expected to dip in 2016 at 4.7% with an average salary of RM2,846.
ICt Salary y-o-y 2014-2015: Fresh graduates On a y-o-y basis for Fresh Graduates, only 5 industries out of 20 benchmarked for 2014 and 2015 (Table 3) exceeded the overall average salary growth of 5.3%. These are automotive, heavy industry and machinery industry (y-o-y rate of 10.6%); followed by construction, building and engineering; and education, with growth rates of 9.2% and 7.0%
respectively. These increases are significant when compared to the overall average monthly salary growth.
This is also in contrast to some of the other industries which grew at a range of 0.4% to 4.6%. Even the banking sector recorded an increase of about 4.6%. The overall economic scenario of 2015 certainly had an impact on these entry level intakes but more crucially, it would appear that employers were perhaps focusing on hiring more experienced staff and curtailing the number of entry level hire during uncertain economic times. Such measures and strategy can only be short term and in the longer term, they still have to catch up in numbers and quality to accommodate succession planning and attrition.
1,971 2,181 2,238 2,324 2,438 2,581 2,718 2,846
1500
1700
1900
2100
2300
2500
2700
2900
3100
20162015201420132012201120102009
RIN
GG
IT M
ALAY
SIA
10.7%
3.8%4.9%
5.9%5.3%
4.7%
2.6%
Source: Jobstret.com and PIKOM, 2015
Figure 2: Average Monthly Salary of ICT Professionals in Fresh Graduates Category in Malaysia: 2009-2016

ICT Job MarkeT ouTlook In MalaysIa | July, 2016 3535
ICt Salary trends by Industry 2009-2015: Fresh graduatesHowever, examining the trend between the period 2009-2015, the average salary recorded for Fresh Graduates (Table 4) revealed that besides automotive, heavy industry and machinery; construction, building and engineering; and electrical and electronics industries have been registering significant AAGR.
Specifically, automotive, heavy industry and machinery; construction, building and engineering; and electrical and electronics recorded double digit AAGR of 15.8%, 13.1% and 12.8% respectively. Banking services and education also grew by 8.9% and 8.7% respectively.
However, it is important to also consider the AAGR percentage in addition to the y-o-y figures to better understand the trend, as this will provide a longer term outlook in terms of prospects and sustainability of potential upward movement of salaries in the industry.
ICt JUnIor eXeCUtIVe Category
ICt Salary y-o-y 2014-2015: Junior executives On a y-o-y basis, Junior Executive ICT professionals with between one and four years of working experience netted an overall average increase in salary of 4.7%, moving up from RM3,719 in 2014 to RM3,894 in 2015 (Figure 3). The growth rate in 2016 is projected to be higher at 4.8% with an average salary of RM4,081.
Industry
Percentile Y-o-Y: 2014-201525th 50th 75th 2014 2015
Ringgit Malaysia %
Automotive/Heavy Industry/Machinery 2,050 3,000 3,250 3,063 3,387 10.6
Construction/Building/ Engineering 2,000 2,400 2,775 2,494 2,722 9.2
Education 1,800 2,310 2,800 2,433 2,602 7.0
Semiconductor/Wafer Fabrication 3,280 3,500 3,500 3,280 3,500 6.7
Electrical & Electronics 1,950 2,850 3,175 2,931 3,110 6.1
Banking Services 2,000 3,000 3,300 2,875 3,008 4.6
Consulting (Business/Technical) 2,100 2,500 3,000 2,625 2,742 4.5
Computer/IT (Software) 2,200 2,750 3,650 2,763 2,861 3.6
Telecommunication 1,921 2,650 3,600 2,375 2,457 3.5
Wholesale/Retail/Trading 1,700 2,000 2,300 2,075 2,145 3.4
Call Center/IT-Enabled Services/BPO 1,800 2,500 2,800 2,575 2,660 3.3
Transport/Storage/Freight/Shipping 1,800 2,450 2,800 2,538 2,619 3.2
Oil/Gas/Petroleum 2,300 2,800 3,200 2,900 2,984 2.9
Financial Services/Securities/Insurance 2,088 2,400 3,250 2,500 2,565 2.6
Services: Social Services/NGO 2,625 3,000 3,375 2,223 2,280 2.6
Computer/IT (Hardware) 2,000 2,400 2,740 2,485 2,541 2.2
Manufacturing / Production 2,150 2,540 3,000 2,655 2,698 1.6
Hotel/Restaurant/Food Service/ Hospitality 1,800 1,870 3,750 2,340 2,362 0.9
Science & Technology/Aerospace/BioTechnology 2,150 2,500 2,650 2,500 2,521 0.8
Printing/Publishing 2,375 2,450 2,788 2,300 2,310 0.4
Estimated Average 2,059 2,544 3,039 2,602 2,741
Minimum 1,700 1,870 2,300 2,075 2,145
Maximum 3,280 3,500 3,750 3,280 3,500
Source: Jobstreet.com and PIKOM, 2015
Table 3: Average Monthly Salary of Fresh Graduates / Entry Level of ICT Professionals by Industry: 2014-2015
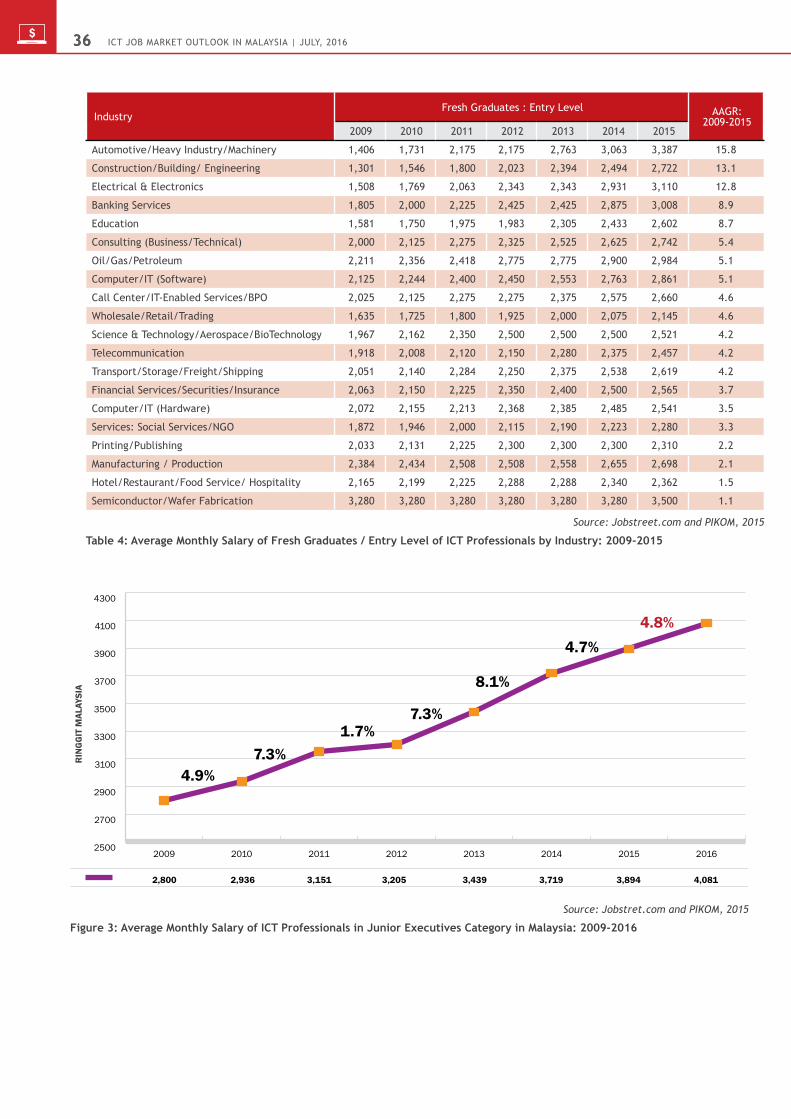
ICT Job MarkeT ouTlook In MalaysIa | July, 20163636
IndustryFresh Graduates : Entry Level AAGR:
2009-20152009 2010 2011 2012 2013 2014 2015
Automotive/Heavy Industry/Machinery 1,406 1,731 2,175 2,175 2,763 3,063 3,387 15.8
Construction/Building/ Engineering 1,301 1,546 1,800 2,023 2,394 2,494 2,722 13.1
Electrical & Electronics 1,508 1,769 2,063 2,343 2,343 2,931 3,110 12.8
Banking Services 1,805 2,000 2,225 2,425 2,425 2,875 3,008 8.9
Education 1,581 1,750 1,975 1,983 2,305 2,433 2,602 8.7
Consulting (Business/Technical) 2,000 2,125 2,275 2,325 2,525 2,625 2,742 5.4
Oil/Gas/Petroleum 2,211 2,356 2,418 2,775 2,775 2,900 2,984 5.1
Computer/IT (Software) 2,125 2,244 2,400 2,450 2,553 2,763 2,861 5.1
Call Center/IT-Enabled Services/BPO 2,025 2,125 2,275 2,275 2,375 2,575 2,660 4.6
Wholesale/Retail/Trading 1,635 1,725 1,800 1,925 2,000 2,075 2,145 4.6
Science & Technology/Aerospace/BioTechnology 1,967 2,162 2,350 2,500 2,500 2,500 2,521 4.2
Telecommunication 1,918 2,008 2,120 2,150 2,280 2,375 2,457 4.2
Transport/Storage/Freight/Shipping 2,051 2,140 2,284 2,250 2,375 2,538 2,619 4.2
Financial Services/Securities/Insurance 2,063 2,150 2,225 2,350 2,400 2,500 2,565 3.7
Computer/IT (Hardware) 2,072 2,155 2,213 2,368 2,385 2,485 2,541 3.5
Services: Social Services/NGO 1,872 1,946 2,000 2,115 2,190 2,223 2,280 3.3
Printing/Publishing 2,033 2,131 2,225 2,300 2,300 2,300 2,310 2.2
Manufacturing / Production 2,384 2,434 2,508 2,508 2,558 2,655 2,698 2.1
Hotel/Restaurant/Food Service/ Hospitality 2,165 2,199 2,225 2,288 2,288 2,340 2,362 1.5
Semiconductor/Wafer Fabrication 3,280 3,280 3,280 3,280 3,280 3,280 3,500 1.1
Source: Jobstreet.com and PIKOM, 2015
Table 4: Average Monthly Salary of Fresh Graduates / Entry Level of ICT Professionals by Industry: 2009-2015
2,800 2,936 3,151 3,205 3,439 3,719 3,894 4,081
2500
2700
2900
3100
3300
3500
3700
3900
4100
4300
20162015201420132012201120102009
RIN
GG
IT M
ALAY
SIA
4.9%
1.7%7.3%
8.1%
4.7%4.8%
7.3%
Source: Jobstret.com and PIKOM, 2015
Figure 3: Average Monthly Salary of ICT Professionals in Junior Executives Category in Malaysia: 2009-2016
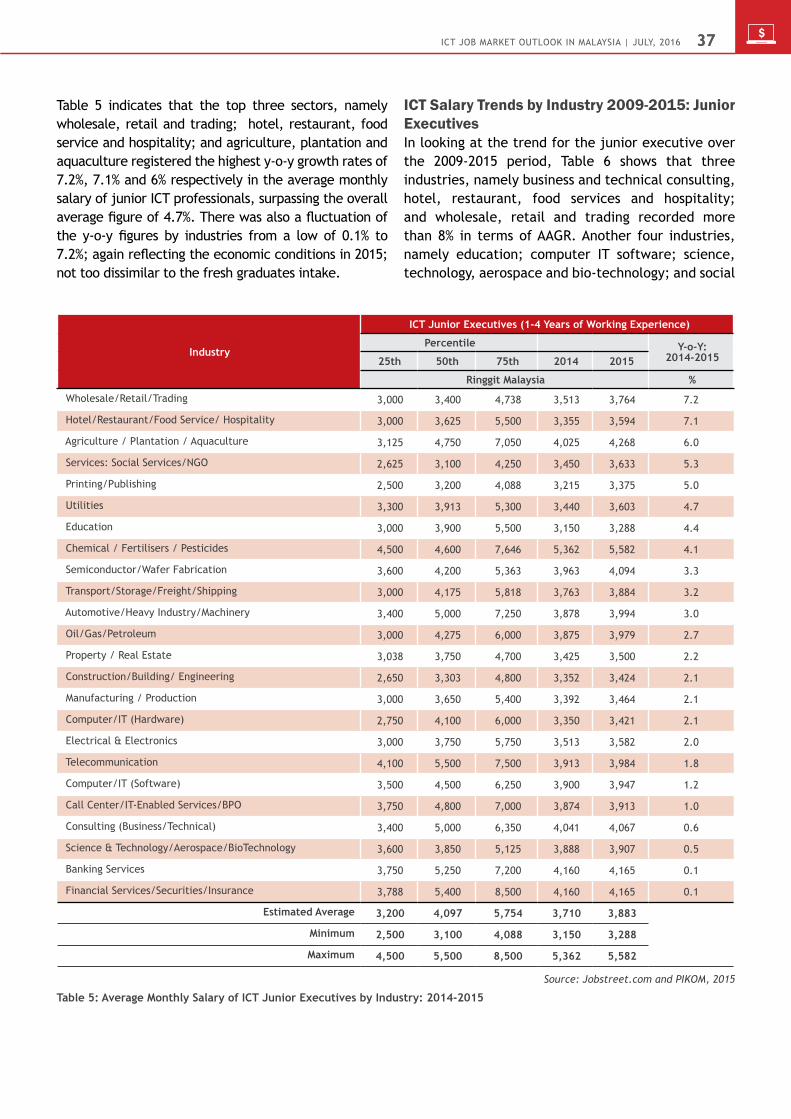
ICT Job MarkeT ouTlook In MalaysIa | July, 2016 3737
Industry
ICT Junior Executives (1-4 Years of Working Experience)
Percentile Y-o-Y: 2014-201525th 50th 75th 2014 2015
Ringgit Malaysia %
Wholesale/Retail/Trading 3,000 3,400 4,738 3,513 3,764 7.2
Hotel/Restaurant/Food Service/ Hospitality 3,000 3,625 5,500 3,355 3,594 7.1
Agriculture / Plantation / Aquaculture 3,125 4,750 7,050 4,025 4,268 6.0
Services: Social Services/NGO 2,625 3,100 4,250 3,450 3,633 5.3
Printing/Publishing 2,500 3,200 4,088 3,215 3,375 5.0
Utilities 3,300 3,913 5,300 3,440 3,603 4.7
Education 3,000 3,900 5,500 3,150 3,288 4.4
Chemical / Fertilisers / Pesticides 4,500 4,600 7,646 5,362 5,582 4.1
Semiconductor/Wafer Fabrication 3,600 4,200 5,363 3,963 4,094 3.3
Transport/Storage/Freight/Shipping 3,000 4,175 5,818 3,763 3,884 3.2
Automotive/Heavy Industry/Machinery 3,400 5,000 7,250 3,878 3,994 3.0
Oil/Gas/Petroleum 3,000 4,275 6,000 3,875 3,979 2.7
Property / Real Estate 3,038 3,750 4,700 3,425 3,500 2.2
Construction/Building/ Engineering 2,650 3,303 4,800 3,352 3,424 2.1
Manufacturing / Production 3,000 3,650 5,400 3,392 3,464 2.1
Computer/IT (Hardware) 2,750 4,100 6,000 3,350 3,421 2.1
Electrical & Electronics 3,000 3,750 5,750 3,513 3,582 2.0
Telecommunication 4,100 5,500 7,500 3,913 3,984 1.8
Computer/IT (Software) 3,500 4,500 6,250 3,900 3,947 1.2
Call Center/IT-Enabled Services/BPO 3,750 4,800 7,000 3,874 3,913 1.0
Consulting (Business/Technical) 3,400 5,000 6,350 4,041 4,067 0.6
Science & Technology/Aerospace/BioTechnology 3,600 3,850 5,125 3,888 3,907 0.5
Banking Services 3,750 5,250 7,200 4,160 4,165 0.1
Financial Services/Securities/Insurance 3,788 5,400 8,500 4,160 4,165 0.1
Estimated Average 3,200 4,097 5,754 3,710 3,883
Minimum 2,500 3,100 4,088 3,150 3,288
Maximum 4,500 5,500 8,500 5,362 5,582
Source: Jobstreet.com and PIKOM, 2015
Table 5: Average Monthly Salary of ICT Junior Executives by Industry: 2014-2015
Table 5 indicates that the top three sectors, namely wholesale, retail and trading; hotel, restaurant, food service and hospitality; and agriculture, plantation and aquaculture registered the highest y-o-y growth rates of 7.2%, 7.1% and 6% respectively in the average monthly salary of junior ICT professionals, surpassing the overall average figure of 4.7%. There was also a fluctuation of the y-o-y figures by industries from a low of 0.1% to 7.2%; again reflecting the economic conditions in 2015; not too dissimilar to the fresh graduates intake.
ICt Salary trends by Industry 2009-2015: Junior executivesIn looking at the trend for the junior executive over the 2009-2015 period, Table 6 shows that three industries, namely business and technical consulting, hotel, restaurant, food services and hospitality; and wholesale, retail and trading recorded more than 8% in terms of AAGR. Another four industries, namely education; computer IT software; science, technology, aerospace and bio-technology; and social
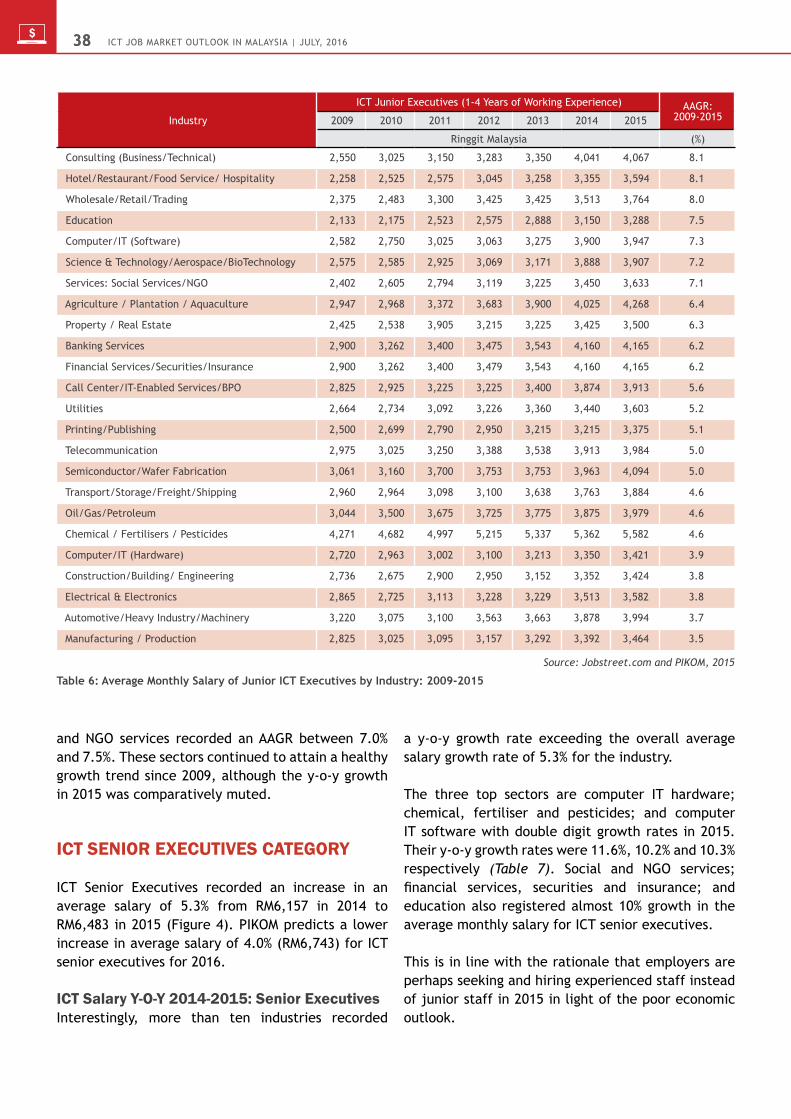
ICT Job MarkeT ouTlook In MalaysIa | July, 20163838
Industry
ICT Junior Executives (1-4 Years of Working Experience) AAGR: 2009-20152009 2010 2011 2012 2013 2014 2015
Ringgit Malaysia (%)
Consulting (Business/Technical) 2,550 3,025 3,150 3,283 3,350 4,041 4,067 8.1
Hotel/Restaurant/Food Service/ Hospitality 2,258 2,525 2,575 3,045 3,258 3,355 3,594 8.1
Wholesale/Retail/Trading 2,375 2,483 3,300 3,425 3,425 3,513 3,764 8.0
Education 2,133 2,175 2,523 2,575 2,888 3,150 3,288 7.5
Computer/IT (Software) 2,582 2,750 3,025 3,063 3,275 3,900 3,947 7.3
Science & Technology/Aerospace/BioTechnology 2,575 2,585 2,925 3,069 3,171 3,888 3,907 7.2
Services: Social Services/NGO 2,402 2,605 2,794 3,119 3,225 3,450 3,633 7.1
Agriculture / Plantation / Aquaculture 2,947 2,968 3,372 3,683 3,900 4,025 4,268 6.4
Property / Real Estate 2,425 2,538 3,905 3,215 3,225 3,425 3,500 6.3
Banking Services 2,900 3,262 3,400 3,475 3,543 4,160 4,165 6.2
Financial Services/Securities/Insurance 2,900 3,262 3,400 3,479 3,543 4,160 4,165 6.2
Call Center/IT-Enabled Services/BPO 2,825 2,925 3,225 3,225 3,400 3,874 3,913 5.6
Utilities 2,664 2,734 3,092 3,226 3,360 3,440 3,603 5.2
Printing/Publishing 2,500 2,699 2,790 2,950 3,215 3,215 3,375 5.1
Telecommunication 2,975 3,025 3,250 3,388 3,538 3,913 3,984 5.0
Semiconductor/Wafer Fabrication 3,061 3,160 3,700 3,753 3,753 3,963 4,094 5.0
Transport/Storage/Freight/Shipping 2,960 2,964 3,098 3,100 3,638 3,763 3,884 4.6
Oil/Gas/Petroleum 3,044 3,500 3,675 3,725 3,775 3,875 3,979 4.6
Chemical / Fertilisers / Pesticides 4,271 4,682 4,997 5,215 5,337 5,362 5,582 4.6
Computer/IT (Hardware) 2,720 2,963 3,002 3,100 3,213 3,350 3,421 3.9
Construction/Building/ Engineering 2,736 2,675 2,900 2,950 3,152 3,352 3,424 3.8
Electrical & Electronics 2,865 2,725 3,113 3,228 3,229 3,513 3,582 3.8
Automotive/Heavy Industry/Machinery 3,220 3,075 3,100 3,563 3,663 3,878 3,994 3.7
Manufacturing / Production 2,825 3,025 3,095 3,157 3,292 3,392 3,464 3.5
Source: Jobstreet.com and PIKOM, 2015
Table 6: Average Monthly Salary of Junior ICT Executives by Industry: 2009-2015
and NGO services recorded an AAGR between 7.0% and 7.5%. These sectors continued to attain a healthy growth trend since 2009, although the y-o-y growth in 2015 was comparatively muted.
ICt SenIor eXeCUtIVeS Category
ICT Senior Executives recorded an increase in an average salary of 5.3% from RM6,157 in 2014 to RM6,483 in 2015 (Figure 4). PIKOM predicts a lower increase in average salary of 4.0% (RM6,743) for ICT senior executives for 2016. ICt Salary y-o-y 2014-2015: Senior executives Interestingly, more than ten industries recorded
a y-o-y growth rate exceeding the overall average salary growth rate of 5.3% for the industry.
The three top sectors are computer IT hardware; chemical, fertiliser and pesticides; and computer IT software with double digit growth rates in 2015. Their y-o-y growth rates were 11.6%, 10.2% and 10.3% respectively (Table 7). Social and NGO services; financial services, securities and insurance; and education also registered almost 10% growth in the average monthly salary for ICT senior executives.
This is in line with the rationale that employers are perhaps seeking and hiring experienced staff instead of junior staff in 2015 in light of the poor economic outlook.

ICT Job MarkeT ouTlook In MalaysIa | July, 2016 3939
4,332 4,514 5,039 5,344 5,744 6,157 6,483 6,743
4000
4500
5000
5500
6000
6500
7000
20162015201420132012201120102009
RIN
GG
IT M
ALAY
SIA
4.2%
6.1%
7.5%
7.2%
5.3%4.0%
11.6%
Source: Jobstret.com and PIKOM, 2015
Figure 4: Average Monthly Salary of ICT Professionals in Senior Executives Category in Malaysia: 2009-2016
Industry
ICT Senior Executives (> 4 Years of Working Experience)
Percentile Y-o-Y: 2014-201525th 50th 75th 2014 2015
Ringgit Malaysia %
Computer/IT (Hardware) 4,500 5,800 6,750 5,410 6,038 11.6
Chemical / Fertilisers / Pesticides 7,300 7,878 10,302 8,484 9,354 10.3
Computer/IT (Software) 5,000 6,000 7,200 5,999 6,612 10.2
Services: Social Services/NGO 4,500 5,500 6,650 5,788 6,362 9.9
Financial Services/Securities/Insurance 5,000 6,750 7,500 6,319 6,938 9.8
Education 4,000 4,675 5,625 4,475 4,913 9.8
Agriculture / Plantation / Aquaculture 5,500 8,150 8,925 7,154 7,803 9.1
Banking Services 4,700 5,800 7,000 6,319 6,840 8.2
Science & Technology/Aerospace/BioTechnology 5,650 6,750 8,000 7,063 7,600 7.6
Hotel/Restaurant/Food Service/ Hospitality 4,300 4,950 9,800 6,050 6,399 5.8
Telecommunication 5,200 6,500 8,500 7,000 7,361 5.2
Electrical & Electronics 4,655 5,500 7,000 5,800 6,095 5.1
Manufacturing / Production 4,300 5,843 7,300 6,207 6,446 3.8
Property / Real Estate 5,400 6,200 6,600 6,250 6,483 3.7
Oil/Gas/Petroleum 5,800 7,500 9,500 8,000 8,291 3.6
Utilities 4,402 5,000 6,400 5,350 5,525 3.3
Transport/Storage/Freight/Shipping 4,250 5,250 7,000 6,730 6,943 3.2
Wholesale/Retail/Trading 3,900 4,800 5,700 5,025 5,170 2.9
Automotive/Heavy Industry/Machinery 4,500 5,375 6,075 5,400 5,550 2.8
Consulting (Business/Technical) 5,250 6,000 7,250 6,375 6,543 2.6
Semiconductor/Wafer Fabrication 4,213 5,250 6,400 6,225 6,303 1.3
Printing/Publishing 3,563 4,500 5,700 4,800 4,851 1.1
Construction/Building/ Engineering 4,100 5,000 6,000 5,322 5,364 0.8
Call Center/IT-Enabled Services/BPO 4,500 5,750 7,250 6,125 6,160 0.6
Estimated Average 4,661 5,721 7,069 6,020 6,340
Minimum 3,563 4,500 5,625 4,475 4,851
Maximum 7,300 8,150 10,302 8,484 9,354
Source: Jobstreet.com and PIKOM, 2015
Table 7: Average Monthly Salary of Senior ICT Executives by Industry: 2014-2015

ICT Job MarkeT ouTlook In MalaysIa | July, 20164040
Industry
ICT Senior Executives (> 4 Years of Working Experience) AAGR: 2009-2015
2009 2010 2011 2012 2013 2014 2015
Ringgit Malaysia (%)
Agriculture / Plantation / Aquaculture 3,683 3,967 4,600 5,033 5,943 7,154 7,803 13.3
Services: Social Services/NGO 3,175 3,925 4,200 5,213 5,538 5,788 6,362 12.3
Chemical / Fertilisers / Pesticides 5,124 5,124 6,417 7,107 8,340 8,484 9,354 10.6
Science & Technology/Aerospace/BioTechnology 4,575 4,515 5,031 6,500 6,500 7,063 7,600 8.8
Call Center/IT-Enabled Services/BPO 3,832 4,428 4,556 4,750 5,054 6,125 6,160 8.2
Electrical & Electronics 3,800 3,915 4,750 5,119 5,233 5,800 6,095 8.2
Education 3,225 3,225 4,100 4,100 4,165 4,475 4,913 7.3
Property / Real Estate 4,339 4,339 5,300 5,825 6,050 6,250 6,483 6.9
Computer/IT (Software) 4,475 4,505 4,769 5,160 5,400 5,999 6,612 6.7
Financial Services/Securities/Insurance 4,763 4,749 5,261 5,450 5,825 6,319 6,938 6.5
Hotel/Restaurant/Food Service/ Hospitality 4,433 4,801 4,801 5,475 5,925 6,050 6,399 6.3
Banking Services 4,763 4,749 5,395 5,575 5,825 6,319 6,840 6.2
Telecommunication 5,225 5,225 6,193 6,675 6,675 7,000 7,361 5.9
Computer/IT (Hardware) 4,315 4,577 4,769 4,835 5,110 5,410 6,038 5.8
Manufacturing / Production 4,650 4,525 5,175 5,298 5,822 6,207 6,446 5.6
Transport/Storage/Freight/Shipping 5,009 5,229 5,400 5,610 6,320 6,730 6,943 5.6
Construction/Building/ Engineering 3,922 4,250 4,500 4,575 4,700 5,322 5,364 5.4
Oil/Gas/Petroleum 6,100 6,209 7,500 7,500 7,575 8,000 8,291 5.2
Wholesale/Retail/Trading 4,050 4,100 4,800 4,800 4,800 5,025 5,170 4.2
Consulting (Business/Technical) 5,175 5,150 5,525 5,879 6,000 6,375 6,543 4.0
Utilities 4,550 4,550 4,710 5,201 5,201 5,350 5,525 3.3
Automotive/Heavy Industry/Machinery 4,690 4,814 4,989 5,050 5,189 5,400 5,550 2.8
Semiconductor/Wafer Fabrication 5,377 5,563 5,685 5,810 5,875 6,225 6,303 2.7
Printing/Publishing 4,150 4,000 4,150 4,154 4,550 4,800 4,851 2.6
Source: Jobstreet.com and PIKOM, 2015
Table 8: Average Monthly Salary of Senior ICT Executives by Industry: 2009-2015
ICt Salary trends by Industry 2009-2015: Senior executivesIn terms of trend, agriculture, plantation and aquaculture; social and NGO services; and chemical, fertilisers and pesticides experienced double digit growth, that is, 13.3%, 12.3% and 10.6% respectively during the 2009-2015 period (Table 8). Only 7 industries registered a growth rate lower than the overall average salary growth of 5.3%. Overall, the
salary growth trend for this category of experienced senior executives is healthy.
ICt MIddle ManageMent Category
For the Middle Management category, the average rise was 6.3% from RM9,591 in 2014 to RM10,195 in 2015. (Figure 5). Out of the five job categories,
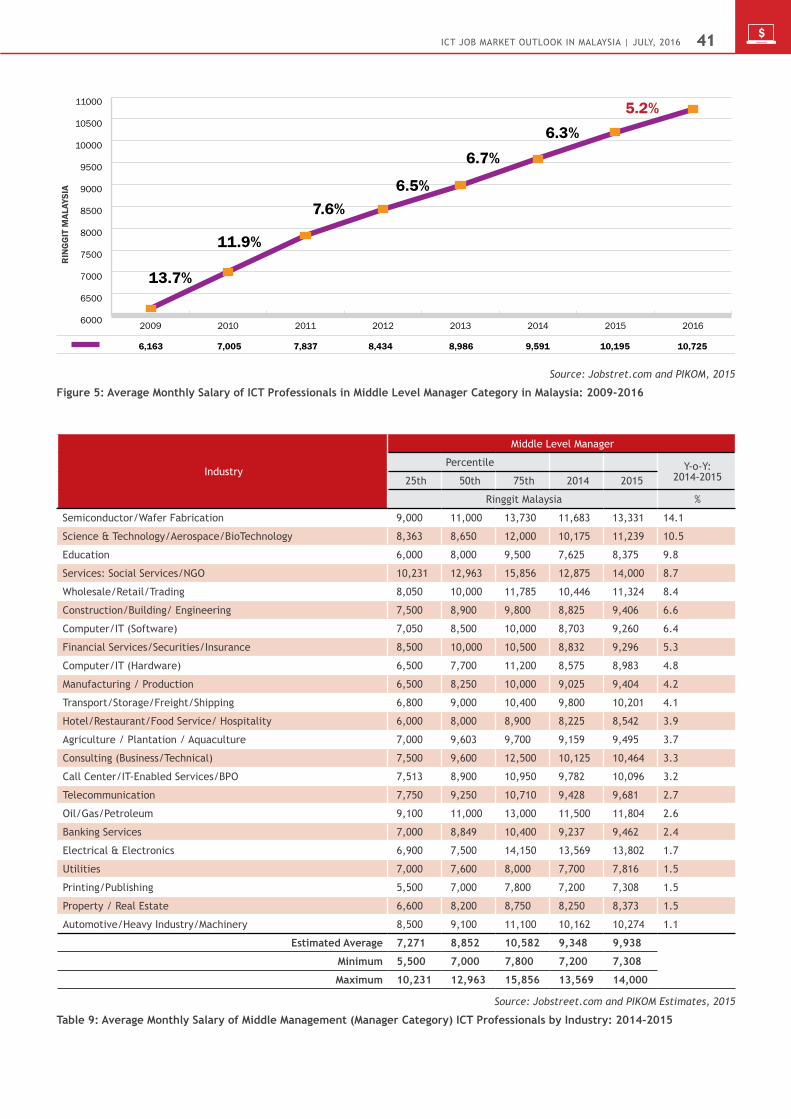
ICT Job MarkeT ouTlook In MalaysIa | July, 2016 4141
6,163 7,005 7,837 8,434 8,986 9,591 10,195 10,725
6000
6500
7000
7500
8000
8500
9000
9500
10000
10500
11000
20162015201420132012201120102009
RIN
GG
IT M
ALAY
SIA
13.7%
7.6%6.5%
6.7%
6.3%5.2%
11.9%
Source: Jobstret.com and PIKOM, 2015
Figure 5: Average Monthly Salary of ICT Professionals in Middle Level Manager Category in Malaysia: 2009-2016
Industry
Middle Level Manager
Percentile Y-o-Y: 2014-201525th 50th 75th 2014 2015
Ringgit Malaysia %
Semiconductor/Wafer Fabrication 9,000 11,000 13,730 11,683 13,331 14.1
Science & Technology/Aerospace/BioTechnology 8,363 8,650 12,000 10,175 11,239 10.5
Education 6,000 8,000 9,500 7,625 8,375 9.8
Services: Social Services/NGO 10,231 12,963 15,856 12,875 14,000 8.7
Wholesale/Retail/Trading 8,050 10,000 11,785 10,446 11,324 8.4
Construction/Building/ Engineering 7,500 8,900 9,800 8,825 9,406 6.6
Computer/IT (Software) 7,050 8,500 10,000 8,703 9,260 6.4
Financial Services/Securities/Insurance 8,500 10,000 10,500 8,832 9,296 5.3
Computer/IT (Hardware) 6,500 7,700 11,200 8,575 8,983 4.8
Manufacturing / Production 6,500 8,250 10,000 9,025 9,404 4.2
Transport/Storage/Freight/Shipping 6,800 9,000 10,400 9,800 10,201 4.1
Hotel/Restaurant/Food Service/ Hospitality 6,000 8,000 8,900 8,225 8,542 3.9
Agriculture / Plantation / Aquaculture 7,000 9,603 9,700 9,159 9,495 3.7
Consulting (Business/Technical) 7,500 9,600 12,500 10,125 10,464 3.3
Call Center/IT-Enabled Services/BPO 7,513 8,900 10,950 9,782 10,096 3.2
Telecommunication 7,750 9,250 10,710 9,428 9,681 2.7
Oil/Gas/Petroleum 9,100 11,000 13,000 11,500 11,804 2.6
Banking Services 7,000 8,849 10,400 9,237 9,462 2.4
Electrical & Electronics 6,900 7,500 14,150 13,569 13,802 1.7
Utilities 7,000 7,600 8,000 7,700 7,816 1.5
Printing/Publishing 5,500 7,000 7,800 7,200 7,308 1.5
Property / Real Estate 6,600 8,200 8,750 8,250 8,373 1.5
Automotive/Heavy Industry/Machinery 8,500 9,100 11,100 10,162 10,274 1.1
Estimated Average 7,271 8,852 10,582 9,348 9,938
Minimum 5,500 7,000 7,800 7,200 7,308
Maximum 10,231 12,963 15,856 13,569 14,000
Source: Jobstreet.com and PIKOM Estimates, 2015
Table 9: Average Monthly Salary of Middle Management (Manager Category) ICT Professionals by Industry: 2014-2015
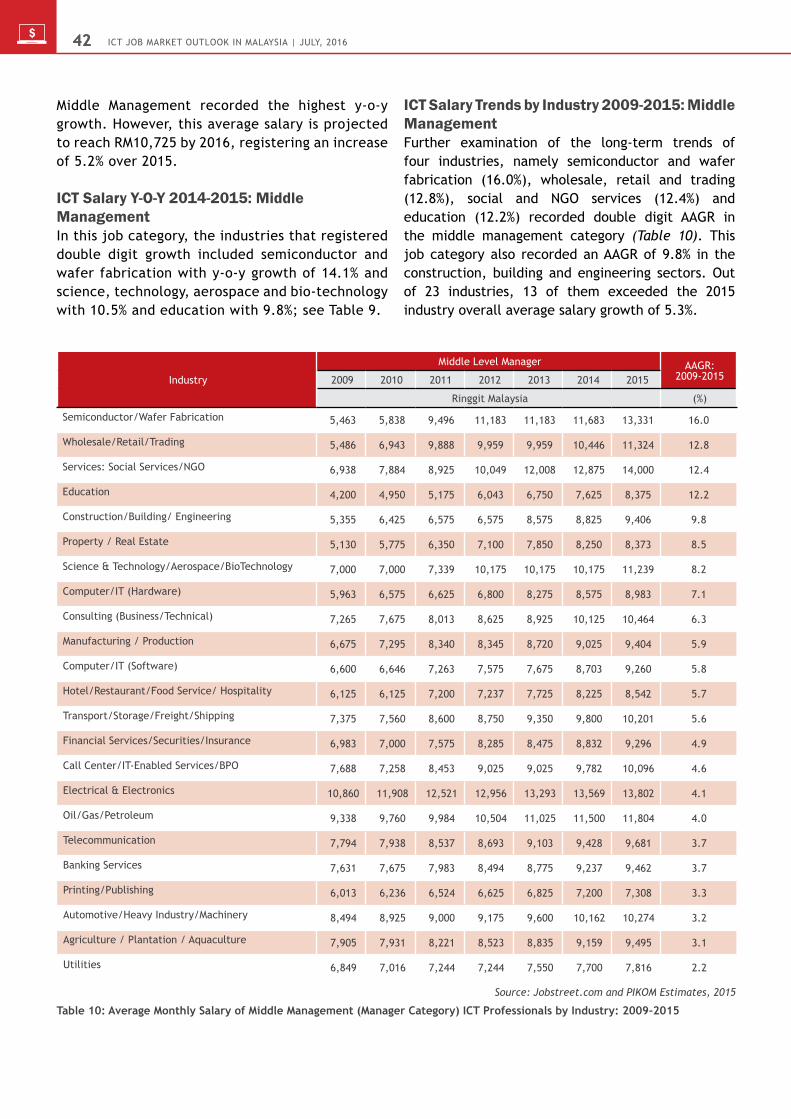
ICT Job MarkeT ouTlook In MalaysIa | July, 20164242
Industry
Middle Level Manager AAGR: 2009-20152009 2010 2011 2012 2013 2014 2015
Ringgit Malaysia (%)
Semiconductor/Wafer Fabrication 5,463 5,838 9,496 11,183 11,183 11,683 13,331 16.0
Wholesale/Retail/Trading 5,486 6,943 9,888 9,959 9,959 10,446 11,324 12.8
Services: Social Services/NGO 6,938 7,884 8,925 10,049 12,008 12,875 14,000 12.4
Education 4,200 4,950 5,175 6,043 6,750 7,625 8,375 12.2
Construction/Building/ Engineering 5,355 6,425 6,575 6,575 8,575 8,825 9,406 9.8
Property / Real Estate 5,130 5,775 6,350 7,100 7,850 8,250 8,373 8.5
Science & Technology/Aerospace/BioTechnology 7,000 7,000 7,339 10,175 10,175 10,175 11,239 8.2
Computer/IT (Hardware) 5,963 6,575 6,625 6,800 8,275 8,575 8,983 7.1
Consulting (Business/Technical) 7,265 7,675 8,013 8,625 8,925 10,125 10,464 6.3
Manufacturing / Production 6,675 7,295 8,340 8,345 8,720 9,025 9,404 5.9
Computer/IT (Software) 6,600 6,646 7,263 7,575 7,675 8,703 9,260 5.8
Hotel/Restaurant/Food Service/ Hospitality 6,125 6,125 7,200 7,237 7,725 8,225 8,542 5.7
Transport/Storage/Freight/Shipping 7,375 7,560 8,600 8,750 9,350 9,800 10,201 5.6
Financial Services/Securities/Insurance 6,983 7,000 7,575 8,285 8,475 8,832 9,296 4.9
Call Center/IT-Enabled Services/BPO 7,688 7,258 8,453 9,025 9,025 9,782 10,096 4.6
Electrical & Electronics 10,860 11,908 12,521 12,956 13,293 13,569 13,802 4.1
Oil/Gas/Petroleum 9,338 9,760 9,984 10,504 11,025 11,500 11,804 4.0
Telecommunication 7,794 7,938 8,537 8,693 9,103 9,428 9,681 3.7
Banking Services 7,631 7,675 7,983 8,494 8,775 9,237 9,462 3.7
Printing/Publishing 6,013 6,236 6,524 6,625 6,825 7,200 7,308 3.3
Automotive/Heavy Industry/Machinery 8,494 8,925 9,000 9,175 9,600 10,162 10,274 3.2
Agriculture / Plantation / Aquaculture 7,905 7,931 8,221 8,523 8,835 9,159 9,495 3.1
Utilities 6,849 7,016 7,244 7,244 7,550 7,700 7,816 2.2
Source: Jobstreet.com and PIKOM Estimates, 2015
Table 10: Average Monthly Salary of Middle Management (Manager Category) ICT Professionals by Industry: 2009-2015
Middle Management recorded the highest y-o-y growth. However, this average salary is projected to reach RM10,725 by 2016, registering an increase of 5.2% over 2015.
ICt Salary y-o-y 2014-2015: Middle Management In this job category, the industries that registered double digit growth included semiconductor and wafer fabrication with y-o-y growth of 14.1% and science, technology, aerospace and bio-technology with 10.5% and education with 9.8%; see Table 9.
ICt Salary trends by Industry 2009-2015: Middle ManagementFurther examination of the long-term trends of four industries, namely semiconductor and wafer fabrication (16.0%), wholesale, retail and trading (12.8%), social and NGO services (12.4%) and education (12.2%) recorded double digit AAGR in the middle management category (Table 10). This job category also recorded an AAGR of 9.8% in the construction, building and engineering sectors. Out of 23 industries, 13 of them exceeded the 2015 industry overall average salary growth of 5.3%.

ICT Job MarkeT ouTlook In MalaysIa | July, 2016 4343
10,368 10,795 12,166 13,674 14,661 16,057 17,053 17,939
9000
10000
11000
12000
13000
14000
15000
16000
17000
18000
19000
20162015201420132012201120102009
RIN
GG
IT M
ALAY
SIA
4.1%
12.4%
7.2%
9.5%
6.2%
5.8%
12.7%
Source: Jobstret.com and PIKOM, 2015
Figure 6: Average Monthly Salary of ICT Professionals in Senior Manager Category in Malaysia: 2009-2016
ICt SenIor ManageMent Category
As shown in Figure 6, the ICT Senior Managers category registered a growth of 6.2% from RM16,057 in 2014 to RM17,053 in 2015. The average monthly salary for the ICT Senior Managers category is projected to move up by another 5.8% in 2016, that is netting RM17,939. ICt Salary by Industry y-o-y 2014-2015: Senior ManagersSix industries recorded an average y-o-y increase of 6.0% and above in the senior management category. This included business and technical consulting; financial services, securities and insurance; banking services; transport, storage, freight and shipping; education; and manufacturing and production (Table 11). Interestingly traditional industries such as
Telecommunications, Computer/IT (hardware and software), Services and Call centres only registered a growth of 3.0% to 5.0% in 2015. Not surprisingly, the Oil and Gas industry recorded only 2.4% and this will continue until global crude oil prices recover.
ICt Salary trends by Industry 2009-2015: Senior ManagersWhen looking at the trend, only the Computer IT hardware industry achieved double digit growth with an AAGR of 11.1% for the senior managers category. Education, social and NGO services, financial services, securities and insurance recorded an average trend with an AAGR of no less than 9.0% during the 2009-2015 period (Table 12). It is again important to note that both y-o-y and AAGR have to be considered in ascertaining short and longer term outlook.

ICT Job MarkeT ouTlook In MalaysIa | July, 20164444
Industry
Senior Level Manager
Percentile Y-o-Y: 2014-201525th 50th 75th 2014 2015
Ringgit Malaysia %
Consulting (Business/Technical) 11,375 15,000 17,500 14,047 15,415 9.7
Financial Services/Securities/Insurance 11,000 13,050 19,800 14,700 15,950 8.5
Banking Services 10,500 13,000 19,800 14,700 15,820 7.6
Transport/Storage/Freight/Shipping 15,000 19,500 20,000 17,119 18,348 7.2
Education 9,000 11,750 13,800 10,666 11,408 7.0
Manufacturing 11,429 14,000 18,588 14,838 15,737 6.1
Telecommunication 11,000 14,325 18,000 15,119 15,824 4.7
Science & Technology/Aerospace/BioTechnology 13,700 19,800 19,800 17,951 18,744 4.4
Computer/IT (Software) 11,000 13,500 17,313 12,439 12,979 4.3
Computer/IT (Hardware) 10,000 13,400 18,383 17,566 18,242 3.8
Call Center/IT-Enabled Services/BPO 16,500 18,000 20,000 18,832 19,523 3.7
Services 13,000 14,500 15,000 14,409 14,888 3.3
Wholesale/Retail/Trading 10,000 12,000 16,200 13,050 13,478 3.3
Automotive/Heavy Industry/Machinery 14,100 20,000 20,800 18,795 19,308 2.7
Oil/Gas/Petroleum 14,055 16,000 20,000 17,000 17,403 2.4
Estimated Average 11,776 14,743 18,092 14,819 15,730
Minimum 9,000 11,750 13,800 10,666 11,408
Maximum 16,500 20,000 20,800 18,832 19,523
Source: Jobstreet.com and PIKOM, 2015
Table 11: Average Monthly Salary of Senior Management ICT Professionals by Industry: 2014-2015
Industry
Senior Level Manager AAGR: 2009-20152009 2010 2011 2012 2013 2014 2015
Ringgit Malaysia (%)
Computer/IT (Hardware) 9,713 12,751 14,528 15,789 16,767 17,566 18,242 11.1
Education 6,563 7,250 8,125 8,850 9,750 10,666 11,408 9.7
Services 8,838 9,392 10,885 11,661 13,334 14,409 14,888 9.1
Financial Services/Securities/Insurance 9,490 10,203 10,250 13,961 13,961 14,700 15,950 9.0
Banking Services 9,622 10,203 11,887 13,961 13,961 14,700 15,820 8.6
Science & Technology/Aerospace/BioTechnology 11,959 12,302 14,387 15,866 17,014 17,951 18,744 7.8
Transport/Storage/Freight/Shipping 11,743 11,997 12,460 14,150 16,811 17,119 18,348 7.7
Manufacturing 10,275 10,750 13,550 14,150 14,195 14,838 15,737 7.4
Automotive/Heavy Industry/Machinery 12,834 15,140 16,489 17,446 18,189 18,795 19,308 7.0
Computer/IT (Software) 8,703 9,250 10,000 10,375 11,094 12,439 12,979 6.9
Telecommunication 11,375 11,250 12,800 13,925 14,288 15,119 15,824 5.7
Consulting (Business/Technical) 11,138 11,196 11,516 12,098 12,942 14,047 15,415 5.6
Call Center/IT-Enabled Services/BPO 14,438 15,136 15,722 17,013 18,014 18,832 19,523 5.2
Wholesale/Retail/Trading 10,500 10,500 12,175 12,175 12,550 13,050 13,478 4.2
Oil/Gas/Petroleum 14,700 14,700 16,146 16,521 16,521 17,000 17,403 2.9
Source: Jobstreet.com and PIKOM, 2015
Table 12: Average Monthly Salary of Senior Management ICT Professionals by Industry: 2009-2015

ICT Job MarkeT ouTlook In MalaysIa | July, 2016 4545
Industry by Job Category Ringgit Malaysia (RM) Industry by Job Category Ringgit Malaysia
(RM)
ALL Categories ICT Senior Executives (> 4 Years of Working Experience)
Chemical / Fertilisers / Pesticides 6,992 Chemical / Fertilisers / Pesticides 9,354
Agriculture / Plantation / Aquaculture 6,413 Oil/Gas/Petroleum 8,291
Oil/Gas/Petroleum 5,888 Agriculture / Plantation / Aquaculture 7,803
Automotive/Heavy Industry/Machinery 5,715 Science & Technology/Aerospace/BioTechnology 7,600
Banking Services 5,633 Telecommunication 7,361
Fresh Graduates : Entry Level Middle Level Manager
Semiconductor/Wafer Fabrication 3,500 Services: Social Services/NGO 14,000
Automotive/Heavy Industry/Machinery 3,387 Electrical & Electronics 13,802
Electrical & Electronics 3,110 Semiconductor/Wafer Fabrication 13,331
Banking Services 3,008 Oil/Gas/Petroleum 11,804
Oil/Gas/Petroleum 2,984 Wholesale/Retail/Trading 11,324
ICT Junior Executives (1-4 Years of Working Experience) Senior Level Manager
Chemical / Fertilisers / Pesticides 5,582 Call Center/IT-Enabled Services/BPO 19,523
Agriculture / Plantation / Aquaculture 4,268 Automotive/Heavy Industry/Machinery 19,308
Banking Services 4,165 Science & Technology/Aerospace/BioTechnology 18,744
Financial Services/Securities/Insurance 4,165 Transport/Storage/Freight/Shipping 18,348
Semiconductor/Wafer Fabrication 4,094 Computer/IT (Hardware) 18,242
Source: Jobstreet.com and PIKOM, 2015
Table 13: Top Five Paying Industries by Category, 2015
toP FIVe PayIng IndUStrIeS
The overall top five paying group of industries for all job categories in 2015 are Chemicals/Fertiliser/ Pesticides; Agriculture/Plantation/Aquaculture; Oil/Gas/Petroleum; Automotive/Heavy Industry/Machinery; and Banking Services (Table 13). Average salaries for these five groups of industries range from about RM5,600 to RM6,990.
Despite the issues facing the oil and gas industry, the fresh graduates, senior executives and middle management job categories showed the industry was in the top five. The traditional Banking service and Telecommunications industries, which were often among the most attractive industries, only registered in the top five for the Fresh Graduates and Junior Executives categories; and in Senior Executives respectively.
In looking at these top five paying industries, it is also important to examine the y-o-y and AAGR figures to ascertain if these positions are sustainable in the short and long terms. In terms of AAGR (Table 2 on page 33), four of these sectors are still registering
a healthy upward trend ranging from 7% and 8.5%. However, the Banking sector has a lower than average y-o-y number. Oil and Gas is the exception in this group with a lower y-o-y and also a declining AAGR. Yet, its absolute average salary is still among the highest in the market for 2015 (Table 13). This declining trend is anticipated to continue for this sector until global crude oil price recovers.
SPeCIFIC ICt IndUStry SegMentS by Job Category
This section looks at the monthly average salaries for 2015 of three IT core industry segments, namely IT hardware, IT software and ICT-enabled services of the ICT industry, including call-centres encompassing both users and suppliers of the ICT products and services to other industries. The average monthly salary of ICT professionals (Table 14) for the period 2009-2015, shows that the Senior ICT Managers category in the ICT hardware segment recorded the highest average salary increase with an AAGR of 11.1%, from RM9,713 in 2009 to RM18,242 in 2015. This was followed by
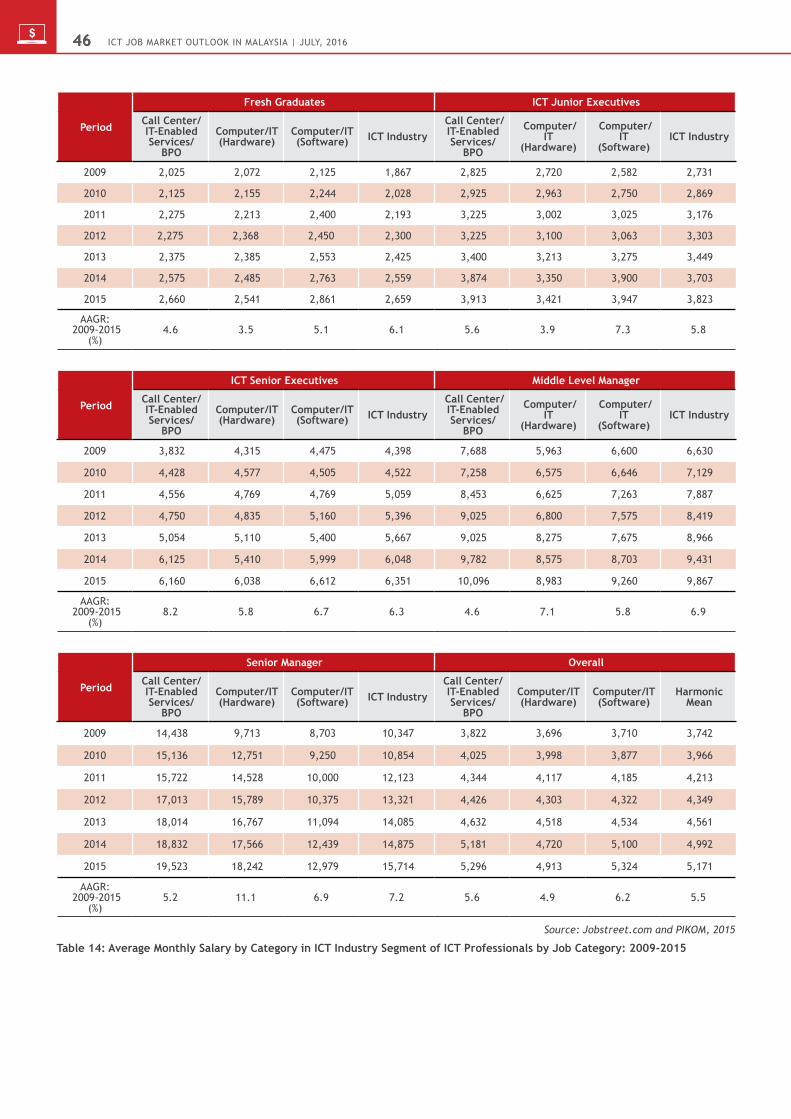
ICT Job MarkeT ouTlook In MalaysIa | July, 20164646
Period
Fresh Graduates ICT Junior Executives
Call Center/IT-Enabled Services/
BPO
Computer/IT (Hardware)
Computer/IT (Software) ICT Industry
Call Center/IT-Enabled Services/
BPO
Computer/IT
(Hardware)
Computer/IT
(Software) ICT Industry
2009 2,025 2,072 2,125 1,867 2,825 2,720 2,582 2,731
2010 2,125 2,155 2,244 2,028 2,925 2,963 2,750 2,869
2011 2,275 2,213 2,400 2,193 3,225 3,002 3,025 3,176
2012 2,275 2,368 2,450 2,300 3,225 3,100 3,063 3,303
2013 2,375 2,385 2,553 2,425 3,400 3,213 3,275 3,449
2014 2,575 2,485 2,763 2,559 3,874 3,350 3,900 3,703
2015 2,660 2,541 2,861 2,659 3,913 3,421 3,947 3,823
AAGR: 2009-2015
(%)4.6 3.5 5.1 6.1 5.6 3.9 7.3 5.8
Period
ICT Senior Executives Middle Level Manager
Call Center/IT-Enabled Services/
BPO
Computer/IT (Hardware)
Computer/IT (Software) ICT Industry
Call Center/IT-Enabled Services/
BPO
Computer/IT
(Hardware)
Computer/IT
(Software) ICT Industry
2009 3,832 4,315 4,475 4,398 7,688 5,963 6,600 6,630
2010 4,428 4,577 4,505 4,522 7,258 6,575 6,646 7,129
2011 4,556 4,769 4,769 5,059 8,453 6,625 7,263 7,887
2012 4,750 4,835 5,160 5,396 9,025 6,800 7,575 8,419
2013 5,054 5,110 5,400 5,667 9,025 8,275 7,675 8,966
2014 6,125 5,410 5,999 6,048 9,782 8,575 8,703 9,431
2015 6,160 6,038 6,612 6,351 10,096 8,983 9,260 9,867
AAGR: 2009-2015
(%)8.2 5.8 6.7 6.3 4.6 7.1 5.8 6.9
Period
Senior Manager Overall
Call Center/IT-Enabled Services/
BPO
Computer/IT (Hardware)
Computer/IT (Software) ICT Industry
Call Center/IT-Enabled Services/
BPO
Computer/IT (Hardware)
Computer/IT (Software)
Harmonic Mean
2009 14,438 9,713 8,703 10,347 3,822 3,696 3,710 3,742
2010 15,136 12,751 9,250 10,854 4,025 3,998 3,877 3,966
2011 15,722 14,528 10,000 12,123 4,344 4,117 4,185 4,213
2012 17,013 15,789 10,375 13,321 4,426 4,303 4,322 4,349
2013 18,014 16,767 11,094 14,085 4,632 4,518 4,534 4,561
2014 18,832 17,566 12,439 14,875 5,181 4,720 5,100 4,992
2015 19,523 18,242 12,979 15,714 5,296 4,913 5,324 5,171
AAGR: 2009-2015
(%)5.2 11.1 6.9 7.2 5.6 4.9 6.2 5.5
Source: Jobstreet.com and PIKOM, 2015
Table 14: Average Monthly Salary by Category in ICT Industry Segment of ICT Professionals by Job Category: 2009-2015

ICT Job MarkeT ouTlook In MalaysIa | July, 2016 4747
the ICT Senior Executives category with an AAGR of 8.2% for the Call Centre/ICT Enabled Services and AAGR of 7.3% for Computer IT software for the ICT junior executives category.
Interestingly, the senior and middle management categories tend to have higher AAGR for Computer/IT hardware as compared to Computer/IT software, in contrast to the junior categories where the Software sector tends to attain higher AAGR as compared to the Hardware sector. A hypothesis to this phenomenon is that IT hardware may be getting more specialised and complex, and hence more senior, better qualified and experienced professionals are required and/or perhaps more senior IT professionals are moving away from IT hardware related areas; giving rise to a
greater demand for these senior roles and leading to a trend of consistent salary increment. Nonetheless it can be concluded that at this juncture, the three specific IT segments continue to enjoy an overall positive salary increment trend with an AAGR of 5.5% for the period between 2009 and 2015.
ICt Core and USer SeCtor
Of the 24 industries assessed in this compilation, the ICT core sector comprises of six industries, namely IT hardware; IT software; ICT-enabled services including call centres; Telecommunications; Electrical and Electronics; and Semiconductor and Wafer fabrication. The others are classified under the ICT user sector.
FreshGraduates
ICT JuniorExecutives
ICT SeniorExecutives
Middle LevelManager
Senior LevelManager
2000
4000
6000
8000
10000
12000
14000
16000
18000
Non-ICTICTNon-ICTICTNon-ICTICTNon-ICTICTNon-ICTICT
Average Monthly Salary2015 15,70416,2419,57110,5426,3516,3983,8153,8082,6032,813
2,8133,808
6,398
10,542
9,571
16,24115,704
6,351
3,815
2,603
Source: Jobstreet.com and PIKOM, 2015
Figure 7 : Average Monthly ICT Salary by ICT Core and User Sector by Job Category, 2015
ICT Job MarkeT ouTlook In MalaysIa | July, 20164848
Many perceive that ICT professionals working in the ICT core sector tend to earn higher incomes than their counterparts in the ICT user sector. As in the past and with the data at hand, they do not adequately support this conjecture. It can be seen in Figure 7 that generally there is no distinct differences in salaries earned by ICT professionals in these two sectors except in the middle level manager category where the average salary in the ICT core sector was marginally higher compared to their counterparts in the ICT user sector.
CoUntrIeS and CItIeS benChMarKIng
As in past publications, a benchmarking of Malaysian ICT salaries against 18 other English-speaking countries and 100 cities - with a scaling factor free from the bias of foreign exchange fluctuation - was carried out. The comparison was conducted specifically for the job category of Project Managers in four career levels.
For this exercise, Malaysia assumed a scaling factor of one and the median data published by PayScale for the year 2015 was used. All measurements were tallied in US dollars. The average value for each country was compiled after taking into consideration one representative job category namely, Project Manager Information Technology. The roles and responsibilities of this job function were uniformly defined by Payscale.com in the countries under study and critical for meaningful comparison.
Two types of benchmarking scales were published, specifically one with purchasing power parity (PPP) adjusted that took into account inflation rates and fluctuation in the foreign exchange rate and the other without PPP adjustment. Technically speaking, PPP adjusted figures were a more realistic comparison. In recent years, selected Middle Eastern countries were also included into the comparison as a significant number of Malaysian professionals also sought jobs in these countries. These included Bahrain, Kuwait, Qatar, Saudi Arabia and United Arab Emirates (UAE).
While these salary gaps would always be inherent in the system, it was important to be mindful of these disparities in salary between countries and cities especially when today’s cross-border movement of labour is increasingly rampant. It was crucial for countries especially developing economies to ensure that these disparities are not widened in a long term and where possible the ‘gaps’ must be reduced especially with attractive destinations for employment.
Comparison based on atlas CriterionWithout any PPP adjustment (or popularly termed as Atlas Criterion by development practitioners), the results showed that United States recorded the highest average salary for IT Project Manager (PM) professionals at entry level, 3.40 times more against average remuneration earned by Malaysian counterparts in 2015 (Table 15). This was followed by UAE, Hong Kong and Australia at 3.21, 3.11 and 3.02 times more respectively. Further examination revealed that even at mid-career, experienced level and late career level, United States recorded the highest average salary. Comparing against Asian economies, at all job levels (entry level, mid-career, experienced and late career), Hong Kong ranked highest. Besides Hong Kong, ICT professionals in Singapore, China and Thailand earned more than their counterparts in Malaysia; see Table 15. In the Middle East, United Arab Emirates (UAE) recorded the highest in comparison to their neighbouring Arab countries in almost all levels (see Table 15). At entry level, the ICT professionals in the United Arab Emirates (UAE) earned 3.21 times, at mid-career level 2.79 times, and at experienced levels 2.4 times more than their counterparts in Malaysia. Notably, Bahrain, Qatar, Kuwait and Saudi Arabia too paid higher than Malaysia for their ICT professionals. The countries that paid lower than Malaysia included the Philippines, Indonesia, Vietnam and India. Without taking into consideration PPP adjustments, except for four countries in Asia, average salaries across all levels of PM for the remainder 14 countries were higher than Malaysia, which was a similar trend to previous years.
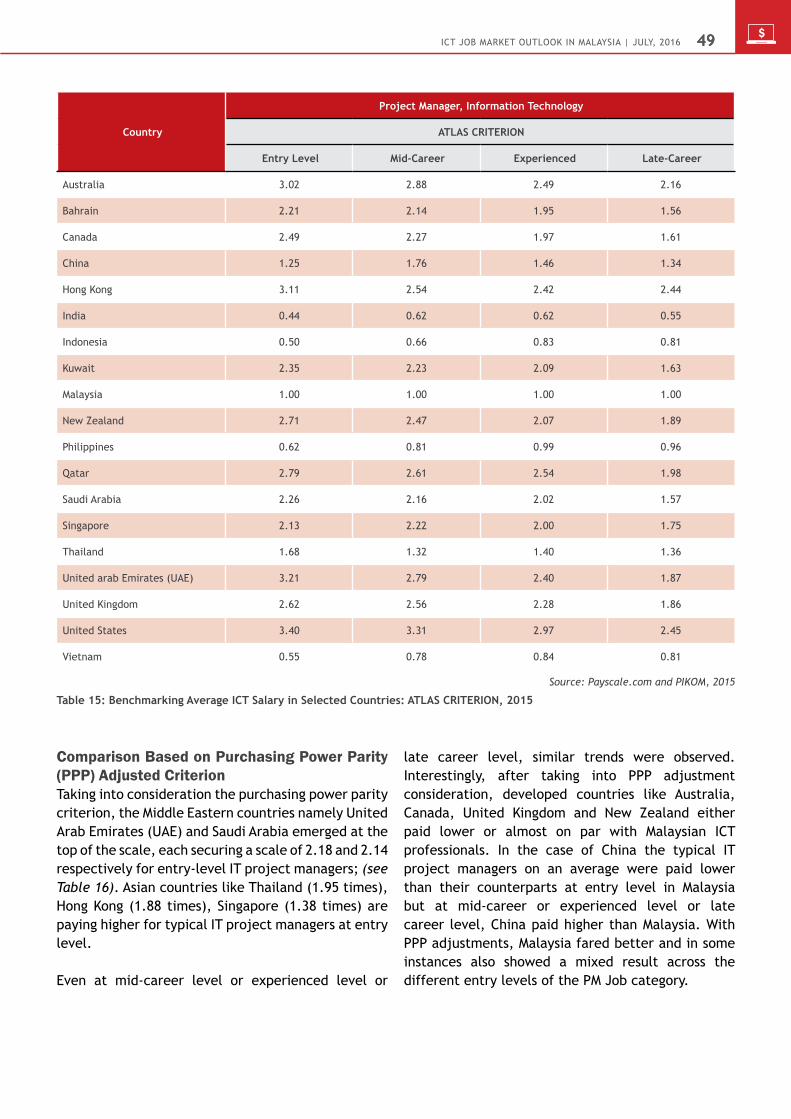
ICT Job MarkeT ouTlook In MalaysIa | July, 2016 4949
Country
Project Manager, Information Technology
ATLAS CRITERION
Entry Level Mid-Career Experienced Late-Career
Australia 3.02 2.88 2.49 2.16
Bahrain 2.21 2.14 1.95 1.56
Canada 2.49 2.27 1.97 1.61
China 1.25 1.76 1.46 1.34
Hong Kong 3.11 2.54 2.42 2.44
India 0.44 0.62 0.62 0.55
Indonesia 0.50 0.66 0.83 0.81
Kuwait 2.35 2.23 2.09 1.63
Malaysia 1.00 1.00 1.00 1.00
New Zealand 2.71 2.47 2.07 1.89
Philippines 0.62 0.81 0.99 0.96
Qatar 2.79 2.61 2.54 1.98
Saudi Arabia 2.26 2.16 2.02 1.57
Singapore 2.13 2.22 2.00 1.75
Thailand 1.68 1.32 1.40 1.36
United arab Emirates (UAE) 3.21 2.79 2.40 1.87
United Kingdom 2.62 2.56 2.28 1.86
United States 3.40 3.31 2.97 2.45
Vietnam 0.55 0.78 0.84 0.81
Source: Payscale.com and PIKOM, 2015
Table 15: Benchmarking Average ICT Salary in Selected Countries: ATLAS CRITERION, 2015
Comparison based on Purchasing Power Parity (PPP) adjusted CriterionTaking into consideration the purchasing power parity criterion, the Middle Eastern countries namely United Arab Emirates (UAE) and Saudi Arabia emerged at the top of the scale, each securing a scale of 2.18 and 2.14 respectively for entry-level IT project managers; (see Table 16). Asian countries like Thailand (1.95 times), Hong Kong (1.88 times), Singapore (1.38 times) are paying higher for typical IT project managers at entry level.
Even at mid-career level or experienced level or
late career level, similar trends were observed. Interestingly, after taking into PPP adjustment consideration, developed countries like Australia, Canada, United Kingdom and New Zealand either paid lower or almost on par with Malaysian ICT professionals. In the case of China the typical IT project managers on an average were paid lower than their counterparts at entry level in Malaysia but at mid-career or experienced level or late career level, China paid higher than Malaysia. With PPP adjustments, Malaysia fared better and in some instances also showed a mixed result across the different entry levels of the PM Job category.

ICT Job MarkeT ouTlook In MalaysIa | July, 20165050
Country
Project Manager, Information Technology
PURCHASING POWER PARITY ADJUSTED CRITERION
Entry Level Mid-Career Experienced Late-Career
Australia 0.95 0.90 0.78 0.68
Bahrain 1.79 1.73 1.57 1.26
Canada 0.96 0.88 0.76 0.62
China 0.96 1.35 1.12 1.03
Hong Kong 1.88 1.54 1.46 1.47
India 0.69 0.98 0.98 0.87
Indonesia 0.66 0.88 1.11 1.07
Kuwait 1.74 1.65 1.55 1.21
Malaysia 1.00 1.00 1.00 1.00
New Zealand 1.02 0.93 0.78 0.71
Philippines 0.66 0.87 1.06 1.03
Qatar 1.79 1.67 1.63 1.27
Saudi Arabia 2.14 2.04 1.91 1.49
Singapore 1.38 1.44 1.30 1.14
Thailand 1.95 1.53 1.63 1.58
United arab Emirates (UAE) 2.18 1.90 1.63 1.27
United Kingdom 0.99 0.97 0.86 0.70
United States 1.50 1.46 1.31 1.08
Vietnam 0.24 0.34 0.37 0.36
Source: Payscale.com and PIKOM, 2015
Table 16: Benchmarking Average ICT Salary in Selected Countries: Purchasing Power Parity (PPP) Adjusted Criterion, 2015
benchmarking Cities against Kuala lumpur Table 17 (Atlas Criterion) and Table 18 (PPP Adjusted Criterion) show the benchmarking scale comparing average ICT salaries earned by IT Project Managers in 101 major cities by assuming a scale of one for Kuala Lumpur. Under the Atlas Criterion, the top ten cities were in the United States with Washington on top of the list. This indicated an earning power of more than 3.70 times than Kuala Lumpur. However, under the PPP Adjusted criterion, the top ten cities were not just centred in the United States.
Payscale.com records show that ICT professionals in Riyadh (Saudi Arabia) earned 2.03 times more than
the ICT professionals in Kuala Lumpur followed by 1.97 times for Abu Dhabi in UAE. Within the top ten in the PPP adjusted list as shown in Table 18, three cities namely Rayong (1.91 times) and Phuket (1.69 times) in Thailand and Hong Kong ( 1.63 times) were from Asia and six cities from Middle Eastern countries. This indicated Asia and the Middle East are fast growing destinations for IT jobs that were once dominated by English-speaking Western nations. However, it must be noted here that a substantial number of ICT professionals working in the Middle East and even in Vietnam (paid in USD), were expatriates who were paid much more than the locals and often these were on contract basis.

ICT Job MarkeT ouTlook In MalaysIa | July, 2016 5151
Cities ATLAS Benchmarking (Kuala Lumpur =1.00) Cities ATLAS Benchmarking (Kuala Lumpur =1.00)
Washington 3.70 Winnipeg 2.04
San Francisco 3.66 Leeds 2.03
New York 3.60 Quebec City 1.99
Boston 3.48 Milton Keynes 1.99
Los Angeles 3.46 London (Canada) 1.98
Houston 3.45 Hamilton 1.98
Chicago 3.27 Tauranga 1.98
Dallas 3.23 Christchurch 1.92
Seattle 3.22 Palmerston North 1.89
Atlanta 3.19 Dunedin 1.85
Phoenix 3.03 Jeddah 1.81
Philadelphia 3.03 Da Nang 1.68
Austin 3.03 Rayong 1.64
Minneapolis 3.02 Shenzhen 1.54
Denver 2.99 Shanghai 1.49
Abu Dhabi 2.90 Tianjin 1.47
Sydney 2.71 Phuket 1.46
Hong Kong 2.69 Hangzhou 1.23
Canberra 2.68 Bangkok 1.23
London 2.68 Beijing 1.21
Brisbane 2.66 Chonburi 1.06
Melbourne 2.64 Pattaya 1.05
Dubai 2.64 Kuala Lumpur 1.00
Perth 2.61 Hanoi 1.00
Doha 2.53 Cyberjaya 0.93
Reading 2.46 Suzhou 0.93
Regina 2.38 Makati City 0.77
Calgary 2.33 Guangzhou 0.77
Adelaide 2.32 Manila 0.77
Auckland 2.28 Ho Chi Minh City 0.75
Edmonton 2.27 Gurgaon 0.70
Birmingham 2.26 Bangalore 0.68
Kuwait 2.24 Hyderabad 0.67
Toronto 2.23 Pune 0.67
Edinburgh 2.22 Taguig City 0.67
Wellington 2.18 Noida 0.67
Manchester 2.18 Vung Tau 0.63
Belfast 2.15 Mumbai 0.63
Riyadh 2.15 Chennai 0.63
Mississauga 2.14 Kolkota 0.63
Singapore 2.14 New Delhi 0.60
Ottawa 2.13 Trivandrum 0.55
Halifax 2.13 Ayutthaya 0.52
Oxford 2.12 Jakarta 0.51
Bahrain 2.12 Chiang Mai 0.51
Vancouver 2.08 Cebu City 0.47
Bristol 2.07 Pasig City 0.42
Gold Coast 2.05 Quezon City 0.39
Glasgow 2.05 Ahmedabad 0.39
Montreal 2.05 Mandaluyong City 0.22
Nottingham 2.04Source: Payscale.com and PIKOM, 2015
Table 17: Benchmarking Average ICT Salaries of Cities Against Kuala Lumpur Using Atlas Criterion, 2015
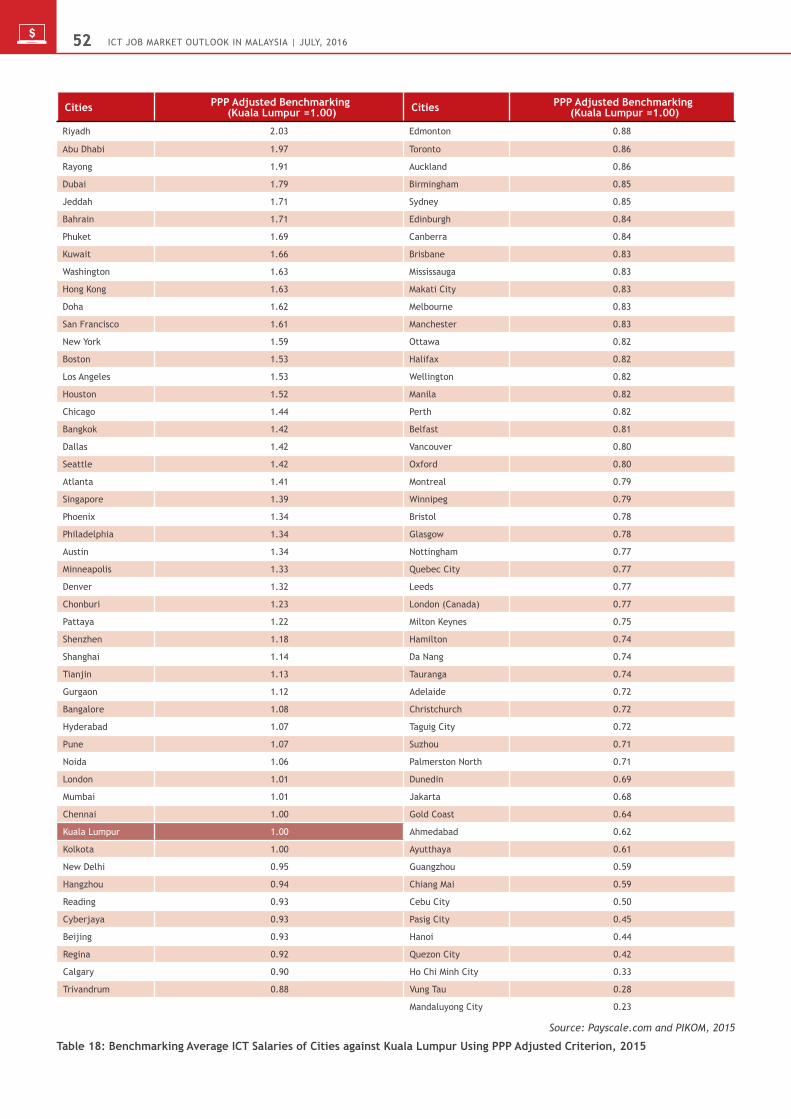
ICT Job MarkeT ouTlook In MalaysIa | July, 20165252
Cities PPP Adjusted Benchmarking (Kuala Lumpur =1.00) Cities PPP Adjusted Benchmarking
(Kuala Lumpur =1.00)
Riyadh 2.03 Edmonton 0.88
Abu Dhabi 1.97 Toronto 0.86
Rayong 1.91 Auckland 0.86
Dubai 1.79 Birmingham 0.85
Jeddah 1.71 Sydney 0.85
Bahrain 1.71 Edinburgh 0.84
Phuket 1.69 Canberra 0.84
Kuwait 1.66 Brisbane 0.83
Washington 1.63 Mississauga 0.83
Hong Kong 1.63 Makati City 0.83
Doha 1.62 Melbourne 0.83
San Francisco 1.61 Manchester 0.83
New York 1.59 Ottawa 0.82
Boston 1.53 Halifax 0.82
Los Angeles 1.53 Wellington 0.82
Houston 1.52 Manila 0.82
Chicago 1.44 Perth 0.82
Bangkok 1.42 Belfast 0.81
Dallas 1.42 Vancouver 0.80
Seattle 1.42 Oxford 0.80
Atlanta 1.41 Montreal 0.79
Singapore 1.39 Winnipeg 0.79
Phoenix 1.34 Bristol 0.78
Philadelphia 1.34 Glasgow 0.78
Austin 1.34 Nottingham 0.77
Minneapolis 1.33 Quebec City 0.77
Denver 1.32 Leeds 0.77
Chonburi 1.23 London (Canada) 0.77
Pattaya 1.22 Milton Keynes 0.75
Shenzhen 1.18 Hamilton 0.74
Shanghai 1.14 Da Nang 0.74
Tianjin 1.13 Tauranga 0.74
Gurgaon 1.12 Adelaide 0.72
Bangalore 1.08 Christchurch 0.72
Hyderabad 1.07 Taguig City 0.72
Pune 1.07 Suzhou 0.71
Noida 1.06 Palmerston North 0.71
London 1.01 Dunedin 0.69
Mumbai 1.01 Jakarta 0.68
Chennai 1.00 Gold Coast 0.64
Kuala Lumpur 1.00 Ahmedabad 0.62
Kolkota 1.00 Ayutthaya 0.61
New Delhi 0.95 Guangzhou 0.59
Hangzhou 0.94 Chiang Mai 0.59
Reading 0.93 Cebu City 0.50
Cyberjaya 0.93 Pasig City 0.45
Beijing 0.93 Hanoi 0.44
Regina 0.92 Quezon City 0.42
Calgary 0.90 Ho Chi Minh City 0.33
Trivandrum 0.88 Vung Tau 0.28
Mandaluyong City 0.23
Source: Payscale.com and PIKOM, 2015
Table 18: Benchmarking Average ICT Salaries of Cities against Kuala Lumpur Using PPP Adjusted Criterion, 2015
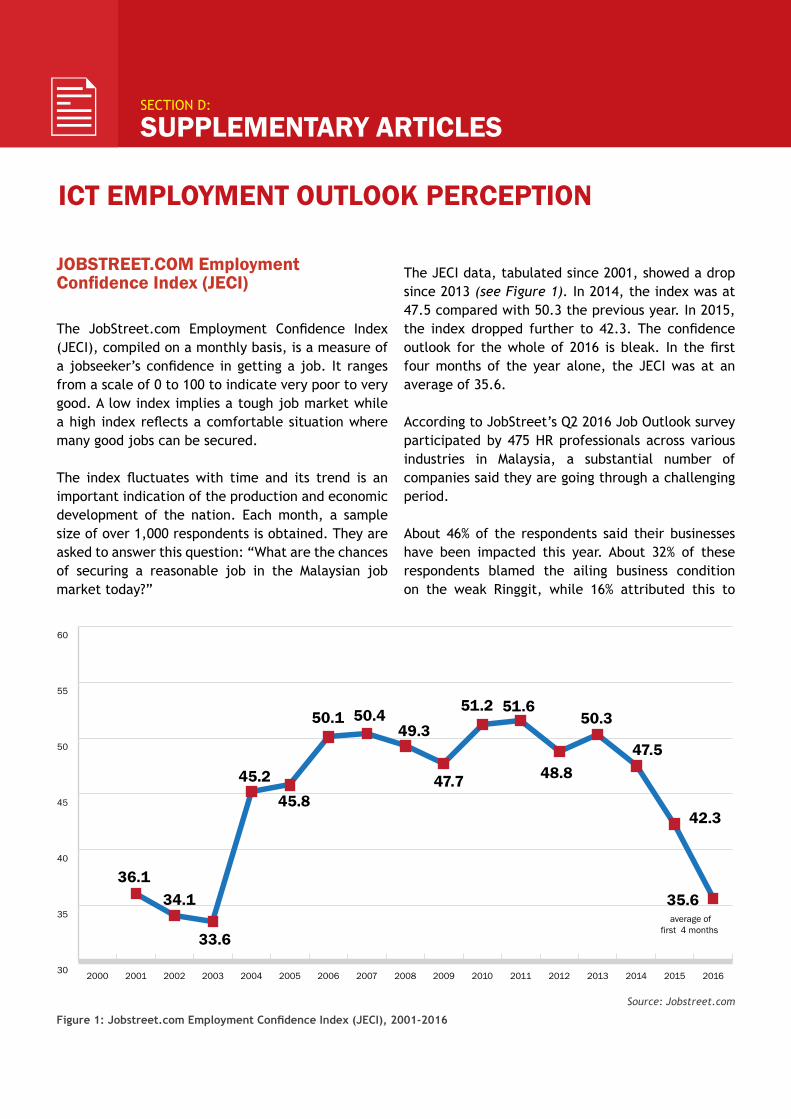
JobStreet.CoM employment Confidence Index (JECI)
The JobStreet.com Employment Confidence Index (JECI), compiled on a monthly basis, is a measure of a jobseeker’s confidence in getting a job. It ranges from a scale of 0 to 100 to indicate very poor to very good. A low index implies a tough job market while a high index reflects a comfortable situation where many good jobs can be secured.
The index fluctuates with time and its trend is an important indication of the production and economic development of the nation. Each month, a sample size of over 1,000 respondents is obtained. They are asked to answer this question: “What are the chances of securing a reasonable job in the Malaysian job market today?”
The JECI data, tabulated since 2001, showed a drop since 2013 (see Figure 1). In 2014, the index was at 47.5 compared with 50.3 the previous year. In 2015, the index dropped further to 42.3. The confidence outlook for the whole of 2016 is bleak. In the first four months of the year alone, the JECI was at an average of 35.6.
According to JobStreet’s Q2 2016 Job Outlook survey participated by 475 HR professionals across various industries in Malaysia, a substantial number of companies said they are going through a challenging period.
About 46% of the respondents said their businesses have been impacted this year. About 32% of these respondents blamed the ailing business condition on the weak Ringgit, while 16% attributed this to
SECTION D:
SUPPleMentary artICleS
30
35
40
45
50
55
60
20162015201420132012201120102009200820072006200520042003200220012000
36.134.1
33.6
45.245.8
50.1 50.449.3
47.7
51.2 51.6
48.8
50.3
47.5
42.3
35.6average of
first 4 months
Source: Jobstreet.com
Figure 1: Jobstreet.com Employment Confidence Index (JECI), 2001-2016
ICt eMPloyMent oUtlooK PerCePtIon
ICT Job MarkeT ouTlook In MalaysIa | July, 20165454
rising inflation. Generally, most ‘blame’ the drop in global oil prices, economic conditions and political uncertainties.
About 54% of the respondents also revealed that in view of the factors above, they would have to reassess their company’s expenditure and budgets with some even considering downsizing their organisations.
“We have to reassess our company’s expenses to determine if we should shut down our non-profitable outlets and reorganise our business structure” said one of the respondents.
However, the survey also showed that when it comes to the hiring decision, about 50% of employers expect
to increase their hiring, 39% expected no change and 11% expected a decrease.
“While some businesses may have been negatively impacted, some sectors such as construction, retail & merchandise and computer and information technology are still seeing growth,” said Chook Yuh Yng, country manager of JobStreet.com.
Regardless of the situation, jobseekers are advised to update their profiles and to continue enhancing their skill sets in order to increase their ‘attractiveness’ to potential employers.
Source: Jobstreet.com
ICT Job MarkeT ouTlook In MalaysIa | July, 2016 5555
In today’s environment where data comes in velocity, volume and veracity, ‘harvesting’ them efficiently and effectively is imperative to improving business decision-making in terms of timeliness and assurance of information integrity. With the volume of data growing at such an exponential rate due in part to the increased availability and usage of smart and connected devices, organizations must develop effective business strategy with a focus on data and its sources.
Is there a perfect recipe? It is important to bear in mind that BDA adoption is not a ‘technology play’ (but an enabler) and it is still very much a business driven mandate. Hence before even considering the Big Data Analytics (BDA) platform, organizations must first identify the key issues that are keeping them awake and what goals they wish to achieve in the mid to long term, including addressing the key question of what is the next level of the business that they wish to accentuate to. In this regard, there is perhaps no single perfect recipe.
Is there a perfect bda platform?Needless to say, a ‘perfect’ platform must at least be sufficiently robust, powerful and scalable - one that is able to provide real-time insights and yet user-friendly enough to use. The Return-On-Investment (ROI) must also be tangible and if possible immediate; and certainly must be value for money. Finally a perfect platform must also be accompanied by organizations (solution providers) that have the long term vision and strategy in this space including the human capital and resources to assist and guide their clients in this BDA journey.
technical featuresThe following are some of the key technical functionalities of an effective BDA platform:-a. Robust enough to consolidate all of the data being
gathered, and flexible enough to present the gathered data in multiple ways and mediums
b. Provide real-time insights such as recognizing relevant pain points and thresholds, and conveying
this immediately to the organization for prompt response.
c. It is adaptive such that it can meet all of its demands and connect the organization to all applicable sources of data, including files, legacy systems, cloud services and even social networking platforms.
d. Compatibility with ‘R’ programming language if organizations intend to perform predictive and prescriptive analytics or machine learning. It should seamlessly integrate with ‘R’ which will allow faster assimilation with existing data sets.
User-FriendlyA user-friendly and interactive, humanized BDA platform not only allows for faster and efficient report generation as business analysts and / or top management decision makers are able to extract and process the data themselves but also ease the acceptance by users especially the non-technical ones. Hence the BDA platform and tools must be easy to learn and use. This will further alleviate the pressures on the IT resources relieving them to perform other more technical tasks.
In a manufacturing environment, an effective BDA platform empowers top managers to run their own analysis, allowing them to manage and even conduct preventive maintenance more effectively, for instance when a particular machine is identified to be in need of repairs. In a sales situation, product pricing and inventory replenishment trigger-points can also be communicated immediately to the management; and trend analysis can be done to anticipate demands.
humanized analyticsWe are all aware that the search for insights in a ‘sea of data’ is a monumental and complex task. Although modern technologies have made such searches easier, some organizations may still lack the initial experience and knowledge of ‘what and where’ to look.
what MaKeS an eFFeCtIVe bIg data analytICS PlatForM?

In overcoming such a hurdle, BDA platforms such as Fusionex Insights (GIANT) introduced the Smart Search feature that easily bypasses the need to click through massive amounts of charts and graphs. It allows its users to discover insights simply by typing generic and key questions into the search bar, similar to how internet / online search engines are used. This inherent ability to recognize keywords and speech patterns will further humanize the search process and taking the overall user experience to an entirely different level.
Flexible deploymentA flexible roll-out approach is another critical factor in determining the success of a BDA platform. One commonly used approach is to start small; perhaps one department or entity at a time, then expanding their use as the organizations grow in confidence and familiar with its usage. Such flexibility certainly helps smaller organizations that require comparatively less data processing and analytics capacity. As the capacity and data are built up over time, they can then increase the coverage.
The increase in BDA adoptions today across multiple industries especially in Aviation, Banking and Telecommunications, with readily available data models and functional templates have also made it easier for new adopters to initiate their BDA journey.
ConclusionOver the years, the question of ‘is BDA important’ has evolved to ‘how should my organization utilize BDA technology and derive the most benefits from it’.
Designing the right BDA strategy is imperative and choosing the right solution partner, and platform aligned to the business strategy from the very beginning is equally critical. If these are implemented effectively, there will perhaps be immediate potential savings in data storage and analysis tools, including time and effort savings on transitioning and training.
• This article was contributed by Fusionex. Fortified with years of knowledge and experience in developing its BDA platform and having implemented analytics solutions in a multitude of companies from different industries, Fusionex has developed and continuously enhanced its BDA platform and technology; including the latest enhancement, recognizing generic questions and key words to allow ease of retrieval of information – Fusionex GIANT. With the advent of its latest iteration - GIANT 2016, the Fusionex BDA platform is in pole position to help even more organizations reap the rewards and value of Big Data.


Persatuan Industri Komputer Dan Multimedia Malaysia(The National ICT Association of Malaysia)
E1, Empire Damansara,No. 2, Jalan PJU 8/8a, Damansara Perdana47820 Petaling Jaya, SelangorT : +(603) 4065 0078 F : +(603) 4065 0079 E+ : [email protected] W+ : www.pikom.org.my
PIKOM, the National ICT Association of Malaysia, is a not-for-profit organisation. It is the largest associa-tion representing information and communications technology (ICT) players in Malaysia. Since its inception in 1986, PIKOM has come of age as the voice of the ICT industry. It has become an ICT referral centre for government and industry players, as well as international organisations. In this regard, PIKOM takes on the responsibility to publish ICT-relevant information in a periodic manner.
Editorial and design services by: MJLAIKC INFOWORKS | Tel: 6012 5050862 | E: [email protected] by: Era Konsep Sdn Bhd | Tel: 603 6272 4024 | E: [email protected]
ICT JOB MARKETOUTLOOK IN MALAYSIA
JULY, 2016
ICT JOB MARKETOUTLOOK IN MALAYSIA
JULY, 2016
IN COLLABORATION WITH