idaho department of fish and game · idaho department of fish and game ... hatchery creek fish...
TRANSCRIPT
IDAHO DEPARTMENT OF FISH AND GAME
FEDERAL AID IN SPORT FISH RESTORATION 2000 Annual Performance Report
Program F-71-R-25
REGIONAL FISHERIES MANAGEMENT INVESTIGATIONS UPPER SNAKE REGION (Subprojects I-G, II-G, III-G, IV-G)
PROJECT I. SURVEYS AND INVENTORIES
Job a. Upper Snake Region Mountain Lakes Investigations Job b. Upper Snake Region Lowland Lakes Investigations – Island Park Reservoir, Ririe Reservoir, Henrys Lake Job c1. Upper Snake Region Rivers and Streams Investigations-
Henrys Fork Snake River, Big Lost River Job c2. Upper Snake Region Rivers and Streams Investigations-
South Fork Snake River PROJECT II. TECHNICAL GUIDANCE PROJECT III. HABITAT MANAGEMENT PROJECT IV. POPULATION MANAGEMENT
By
Jeff Dillon, Regional Fishery Biologist
Mark Gamblin, Regional Fishery Manager William C. Schrader, Senior Fishery Research Biologist
October 2004
IDFG 04-09
i
TABLE OF CONTENTS
Page
SURVEYS AND INVENTORIES – Upper Snake Region – Mountain Lakes Investigations ABSTRACT ......................................................................................................... 1 SURVEYS AND INVENTORIES – Upper Snake Region – Lowland Lakes Investigations ABSTRACT ......................................................................................................... 2 OBJECTIVE ......................................................................................................... 4 METHODS ......................................................................................................... 4 Island Park Reservoir .............................................................................................. 4 Ririe Reservoir ........................................................................................................ 4 Henrys Lake ......................................................................................................... 4 Spawning Operation.................................................................................... 4 Genetic Analyses ........................................................................................ 5 Gillnetting .................................................................................................... 5 Tributary Fry Trapping................................................................................. 6 RESULTS AND DISCUSSION ........................................................................................... 6 Island Park Reservoir .............................................................................................. 6 Ririe Reservoir ........................................................................................................ 8 Henrys Lake ......................................................................................................... 8 Spawning Operation.................................................................................... 8 Genetic Analysis.......................................................................................... 11 Gillnetting .................................................................................................... 12 Tributary Fry Trapping................................................................................. 12 RECOMMENDATIONS....................................................................................................... 16 Island Park Reservoir .............................................................................................. 16 Ririe Reservoir ........................................................................................................ 16 Henrys Lake ......................................................................................................... 16
LIST OF TABLES
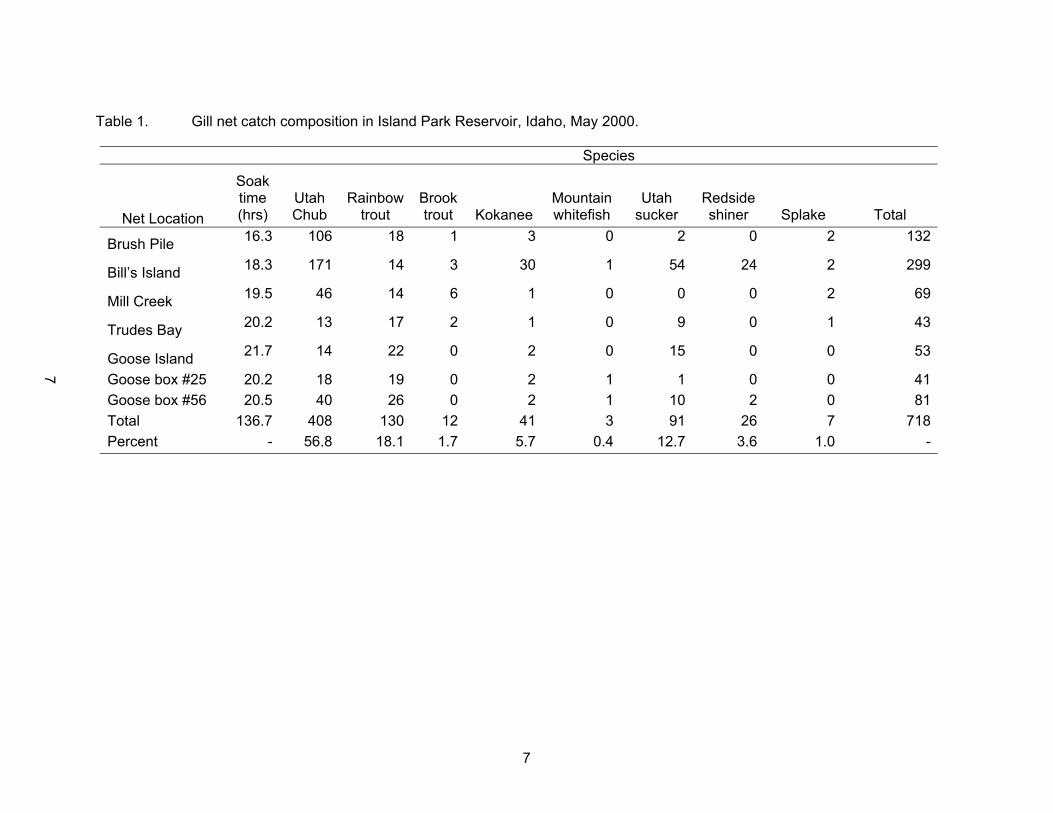
Table 1. Gill net catch composition in Island Park Reservoir, Idaho, May 2000........ 7
LIST OF FIGURES
Figure 1. Length-frequency distribution of cutthroat trout captured ascending the Hatchery Creek fish ladder, Henrys Lake, Idaho, in 2000........................... 9 Figure 2. Length-frequency distribution; of hybrid trout captured ascending the Hatchery Creek fish ladder, Henrys Lake, Idaho, in 2000........................... 10

ii
TABLE OF CONTENTS (continued)
Page
Figure 3. Catch composition of fish caught in six gillnet nights of effort on Henrys Lake, Idaho, in 2000 ....................................................................... 13 Figure 4. Catch composition of fish captured with six net-nights of effort with experimental gillnets on Henrys Lake, Idaho, in 2000. Nets were targeting nongame fish................................................................................ 14 Figure 5. Timing of trout fry emigration from various tributaries to Henrys Lake, Idaho in 2000. ...................................................................................................... 15 SURVEYS AND INVENTORIES – Upper Snake Region Rivers and Streams Investigations Henrys Fork Snake River, Big Lost River ABSTRACT ......................................................................................................... 17 OBJECTIVE ......................................................................................................... 18 METHODS ......................................................................................................... 18 Box Canyon Population Estimate............................................................................ 18 Big Lost River Population Estimates ....................................................................... 18 RESULTS AND DISCUSSION ........................................................................................... 18 Box Canyon Population Estimate............................................................................ 18 Big Lost River Population Estimates ....................................................................... 21 RECOMMENDATIONS....................................................................................................... 21 LITERATURE CITED ......................................................................................................... 24
LIST OF FIGURES
Figure 1. Length frequency distribution for wild rainbow trout collected electrofishing in the Box Canyon Reach of the Henrys Fork Snake River, Idaho, May 2000 19 Figure 2. Length frequency distribution for rainbow trout and brook trout captured electrofishing in the Bartlett Point Road area of the Big Lost River, Idaho 2000 ......................................................................................................... 22
LIST OF TABLES
Table 1. Estimated abundance of wild rainbow trout >150 mm in the Box Canyon Reach of the Henrys Fork of the Snake River, Idaho, 1993 – 2000 ............ 20
iii
TABLE OF CONTENTS (continued)
Page
Table 2. Trout population trends in three sections of the Big Lost River drainage, Idaho 1986-2000 ......................................................................................... 23 SURVEYS AND INVENTORIES – Upper Snake Region – Rivers and Streams Investigations South Fork Snake River ABSTRACT ......................................................................................................... 25 INTRODUCTION AND STUDY AREA................................................................................ 26 OBJECTIVES ......................................................................................................... 26 METHODS ......................................................................................................... 28 RESULTS ......................................................................................................... 29 Conant Electrofishing .............................................................................................. 29 Twin Bridges Electrofishing..................................................................................... 29 DISCUSSION ......................................................................................................... 37 RECOMMENDATIONS....................................................................................................... 37 ACKNOWLEDGEMENTS ................................................................................................... 39 LITERATURE CITED ......................................................................................................... 40
LIST OF FIGURES
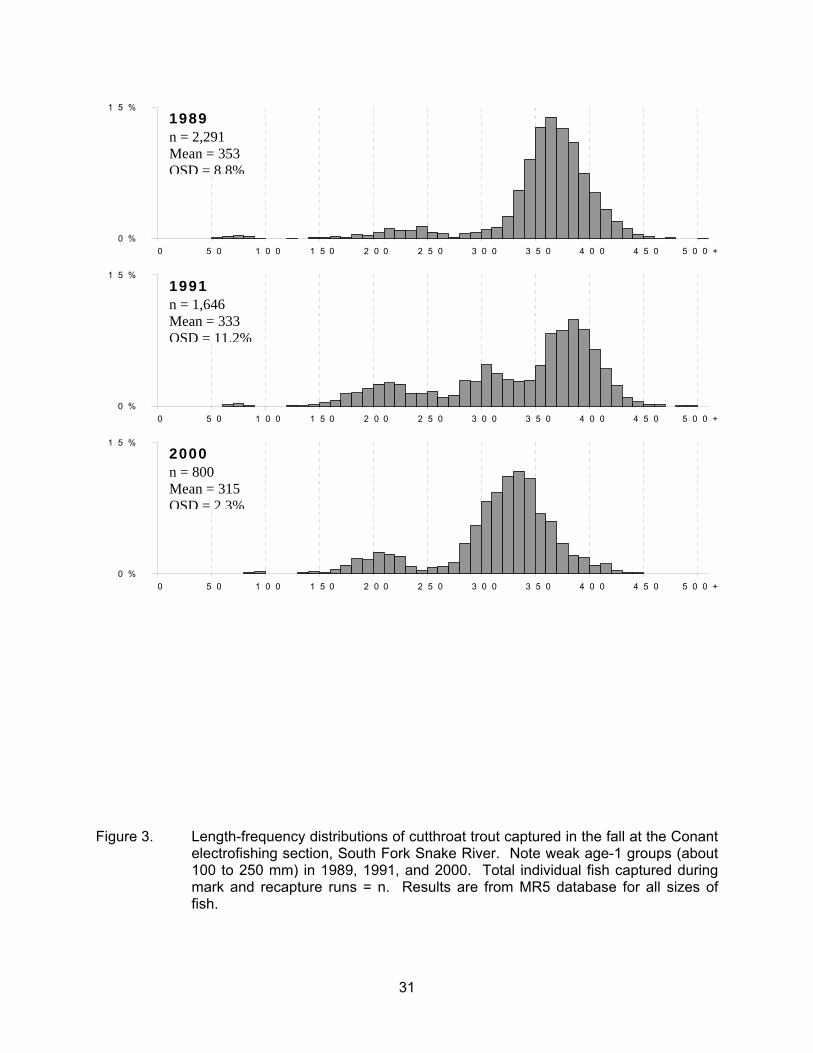
Figure 1. Map of South Fork Snake River showing electrofishing sections................ 27 Figure 2. Trout species composition and relative abundance at the Conant (top,n=1,205) and Twin Bridges (bottom, n=1,672) electrofishing sections, South Fork Snake River, 2000. Results are from the MR5 database for all sizes of fish ............................................................................................. 30 Figure 3. Length frequency distributions of cutthroat trout captured in the fall at the Conant electrofishing section, South Fork Snake River. Note weak age-1 groups (about 100 to 250 mm) in 1989, 1991, and 2000. Total individual fish captured during mark and recapture runs = n. Results are from MR5 database for all sizes of fish ........................................................................ 31

iv
TABLE OF CONTENTS (continued)
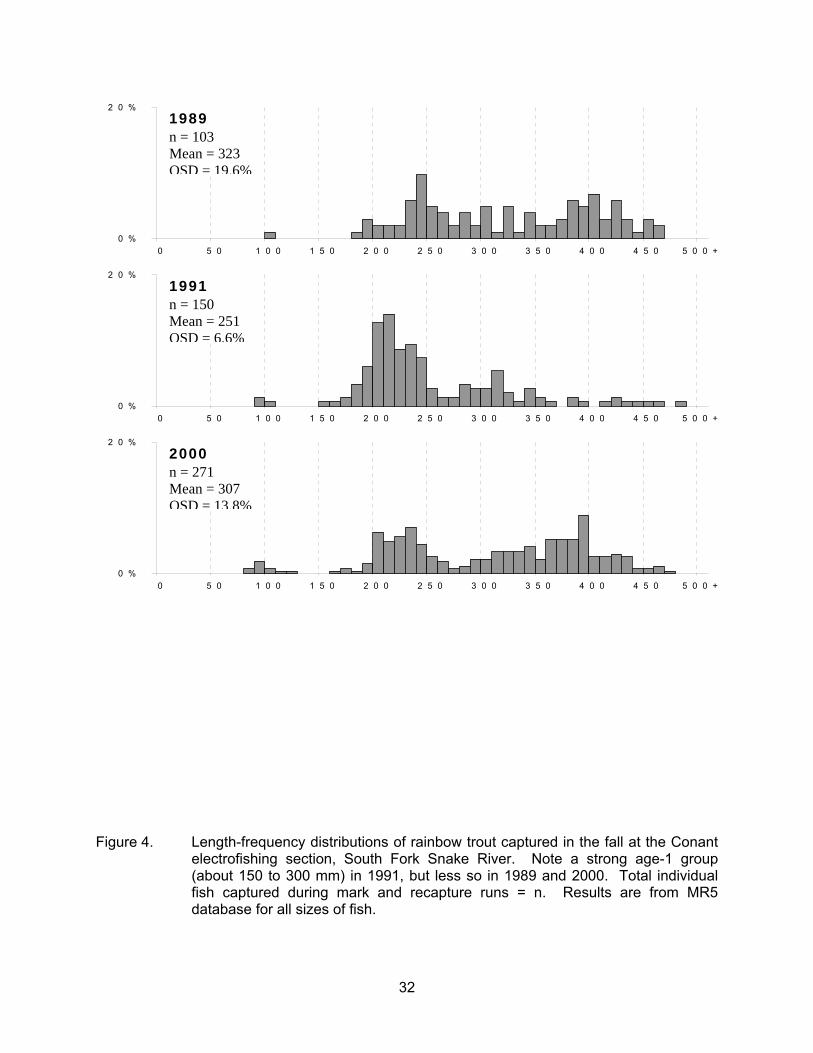
Page Figure 4. Length frequency distributions of rainbow trout captured in the fall at the Conant electrofishing section, South Fork Snake River. Note a strong age-1 groups (about 150 to 300 mm) in 1991 but less in 1989 and 2000. Total
individual fish captured during mark and recapture runs = n. Results are from MR5 database for all sizes of fish ............................................................... 32
Figure 5. Length frequency distributions of brown trout captured in the fall at the Conant electrofishing section, South Fork Snake River. Note a strong age-1 group (about 150 to 300 mm) in 1991 but less in 1989 and 2000. Total
individual fish captured during mark and recapture runs = n. Results are from MR5 database for all sizes of fish ............................................................... 33
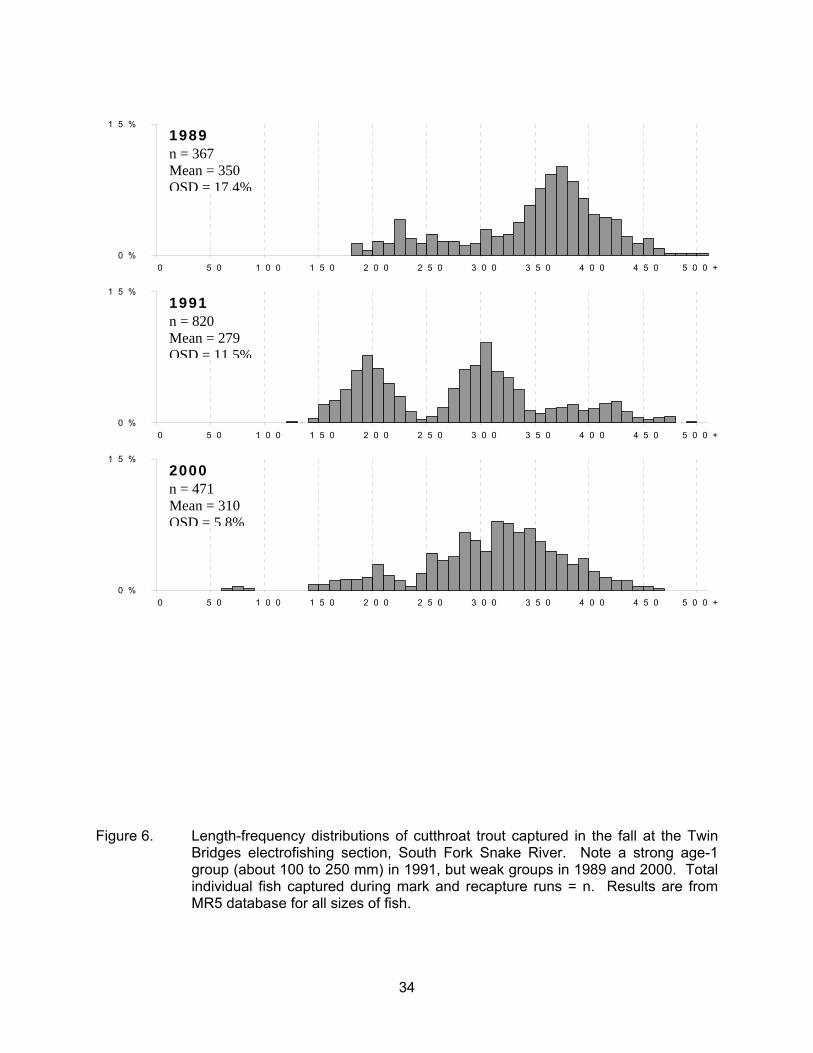
Figure 6. Length frequency distributions of cutthroat trout captured in the fall at the Twin Bridges electrofishing section, South Fork Snake River. Note a strong
age-1 group (about 100 to 250 mm) in 1991, but weak groups in 1989 and 2000. Total individual fish captured during mark and recapture runs = n. Results are from MR5 database for all sizes of fish ....................................................... 34
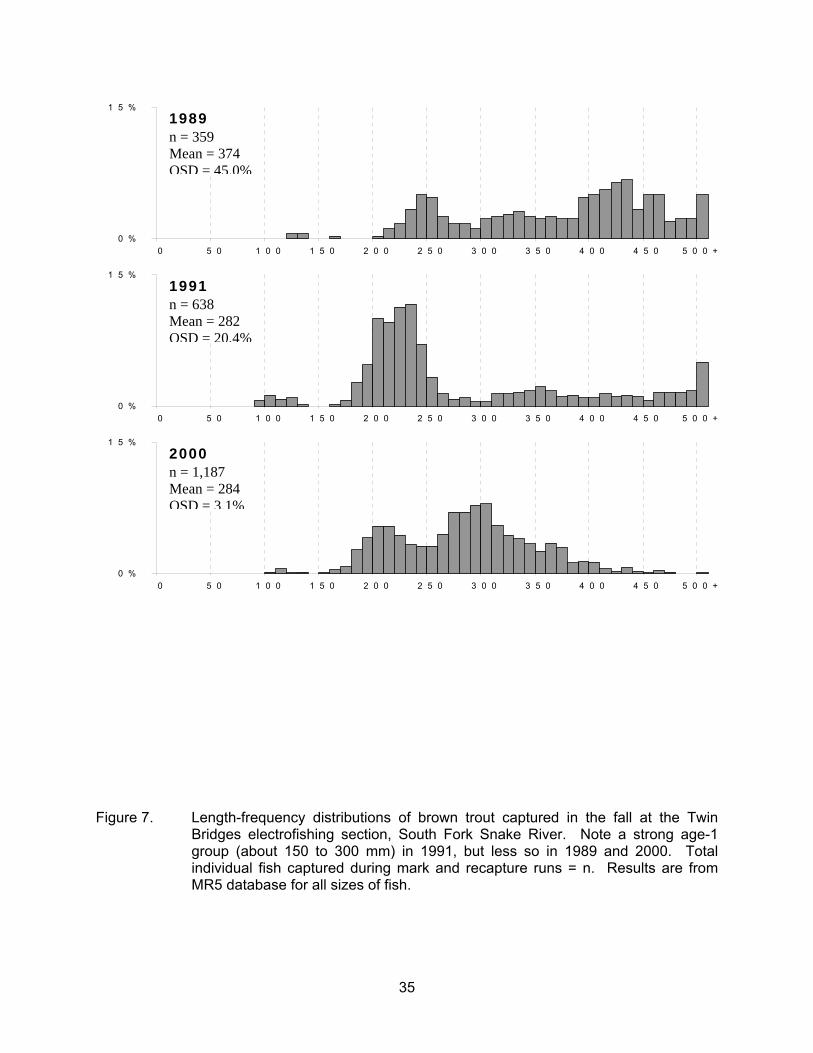
Figure 7. Length frequency distributions of brown trout captured in the fall at the Twin Bridges electrofishing section, South Fork Snake River. Note a strong age-1
group (about 150 to 300 mm) in 1991, but less so in 1989 and 2000. Total individual fish captured during mark and recapture runs = n. Results are from MR5 database for all sizes of fish ............................................................... 35
Figure 8. Abundance trends for age-1 and older cutthroat (top, ≥152 mm) at the Twin Bridges electrofishing section, South Fork Snake River, September and October 1989-2000. Confidence intervals are at 95%. Asterisks indicate Years when no estimate was made ............................................................ 36 Figure 9. Trout relative abundance trends at the Conant electrofishing section, South Fork Snake River, 1982 to 2000. Results are from MR5 database for all sizes of fish (Appendix C) except for 1982, which is from Moore and Schill (1984) ................................................................................................ 38 Figure 10. Cutthroat trout quality stock density (QSD) and mean total length trends at the Conant electrofishing section, South Fork Snake River, 1986 to 2000. Results are from MR5 database for all sizes of fish (Appendix D). ............. 38
LIST OF APPENDICES
Appendix A. South Fork Snake River fishing regulations 1970-2001 .............................. 42 Appendix B. Sampling dates, flows, and catch rates at the Conant electrofishing section, South Fork Snake River, 1986-2000. Flows were recorded at the USGS Irwin gage. Catch rate results are from the MR5 database for all sizes of fish .. 43
v
TABLE OF CONTENTS (continued)
Page
Appendix C. Trout species composition and relative abundance (%) at the Conant electrofishing section, South Fork Snake River, 1982-20-00. Total individual fish captured during mark and recapture runs are in parentheses. Results are from MR5 database for all sizes of fish ................................................. 43 Appendix D. Mean total length and quality stock density (QSD) of trout captured at the Conant electrofishing section, South Fork Snake River, 1986-2000. Total individual fish captured during mark and recapture runs equals n. QSD = (number ≥406 mm/number ≥203 mm) x 100. Results are from MR5 database for all sizes of fish ........................................................................ 44 Appendix E. Electrofishing statistics for the Conant section, South Fork Snake River, 1986-2000. Results are from MR5 database for all sizes of fish ................ 45 Appendix F. Estimated abundance (N) of age-1 and older cutthroat trout (≥152 mm), and
all trout (≥102 mm) at the Conant electrofishing section, South Fork Snake River, 1986-2000. Results are from MR5 database and analysis using the log-likelihood estimator. Standard deviations are in parentheses ........ 46
Appendix G. Sampling dates, flows, and catch rates at the Twin Bridges electrofishing section, South Fork Snake River, 1986-2000. Flows were recorded at the USGS Lorenzo gage. Catch rate results are from the MR5 database for all sizes of fish.................................................................................................. 47 Appendix H. Trout species composition and relative abundance (%) at the Twin Bridges electrofishing section, South Fork Snake River, 1989-2000. Total individual fish captured during mark and recapture runs are in parentheses. Results are from MR5 database for all sizes of fish ....................................................... 48 Appendix I. Mean total length and quality stock density (QSD) of trout captured at the Twin Bridges electrofishing section, South Fork Snake River, 1989-2000. Totalindividual fish captured during mark and recapture runs equals n. QSD = (number ≥406 mm/number ≥203 mm) x 100. Results are from MR5 database for all sizes of fish ........................................................................ 48 Appendix J. Electrofishing statistics for the Twin Bridges section, South Fork Snake River, 1989-2000. Results are from MR5 database for all sizes of fish ................ 49 Appendix K. Estimated abundance (N) of age-1 and older cutthroat trout (≥102 mm), rainbow
trout (≥102 mm), and all trout (≥102 mm) at the Twin Bridges electrofishing section, South Fork Snake River, 1989-2000. Results are from MR5 database and analysis using the log-likelihood estimator. Standard deviations are in parentheses................................................................................................. 50

vi
TABLE OF CONTENTS (continued)
Page SURVEYS AND INVENTORIES – Upper Snake Region – Technical Guidance ABSTRACT ......................................................................................................... 51 SURVEYS AND INVENTORIES – Upper Snake Region – Habitat Management ABSTRACT ......................................................................................................... 53 OBJECTIVES ......................................................................................................... 54 2000 ACTIVITIES ......................................................................................................... 54 Henrys Lake ......................................................................................................... 54 South Fork Snake River Tributaries ........................................................................ 54 Palisades Creek .......................................................................................... 54 Rainey Creek............................................................................................... 54 Burns Creek ................................................................................................ 54 Willow Creek Tributaries ......................................................................................... 55 Sellars Creek............................................................................................... 55 SURVEYS AND INVENTORIES – Upper Snake Region – Population Management ABSTRACT ......................................................................................................... 56 INTRODUCTION AND METHODS..................................................................................... 57 RESULTS AND DISCUSSION ........................................................................................... 57 RECOMMENDATIONS....................................................................................................... 57
LIST OF APPENDICES Appendix A. Final Report ................................................................................................. 58
1
2000 ANNUAL PERFORMANCE REPORT State of: Idaho Program: Fisheries Management F-71-R-25 Project: I-Surveys and Inventories Subproject: I-G Upper Snake Region Job No.: a Title: Mountain Lakes Investigations Contract Period: July 1 2000 to June 30 2001
ABSTRACT
There were no mountain lake surveys in the Upper Snake Region during this contract period. Author: Mark Gamblin Regional Fisheries Manager

2
2000 ANNUAL PERFORMANCE REPORT State of: Idaho Program: Fisheries Management F-71-R-25 Project I: Surveys and Inventories Subproject: I-G: Upper Snake Region Job: b - Island Park Reservoir, Ririe Title: Lowland Lakes Investigations
Reservoir, Henrys Lake Contract Period: July 1 2000 to June 30 2001
ABSTRACT
Gill nets were set on Island Park Reservoir on May 16, 2000 to assess species composition and monitor relative abundance of fish species. Gill net catch composition on Island Park Reservoir in May was 73% nongame fish (Utah chub Gila atraria, Utah sucker Catostomus ardens, and redside shiner Richardsonius balteatus). Hatchery and wild rainbow trout Oncorhynchus mykiss comprised 18%, while splake (lake trout Salvelinus namaycush x brook trout S. fontinalis), kokanee salmon O. nerka, brook trout and mountain whitefish Prosopium williamsoni accounted for 9% of the catch. Routine creel surveys were conducted on Ririe Reservoir to monitor catch rates and species composition, and to evaluate experimental stockings of catchable-size Yellowstone cutthroat trout O. clarki bouvieri and sterile triploid rainbow trout. Overall catch rate from June 9 to September 18 averaged 0.69 fish/h and harvest rate averaged 0.43 fish/h. Harvest composition was 48% hatchery rainbow trout, 21% yellow perch Perca flavescens, 19% kokanee salmon, and 10% Yellowstone cutthroat trout. Smallmouth bass Micropterus dolomieu and splake comprised about 2% of the harvest. Hatchery Yellowstone cutthroat trout comprised 9% of the total trout stocked and 10% of the trout harvest. Evaluation of sterile triploid rainbow trout was inconclusive due to improper identification of marked fish in the creel.
The 2000 spawning operations at Henrys Lake produced 1,436,500 eyed cutthroat trout eggs and 343,800 eyed hybrid trout eggs. All hybrid trout eggs were heat-shocked to produce sterile triploids. Cutthroat trout in the Hatchery Creek run averaged 436 mm and hybrid trout averaged 443 mm. No brook trout eggs were taken in 2000. Catch composition in six net-nights of gillnetting (custom nets) at Henrys Lake was 10% cutthroat trout, 52% hybrid trout, 28% brook trout, and 10% Utah chub. Catch composition in additional sampling with standard Idaho Department of Fish and Game (Department) experimental gillnets was 29% cutthroat trout, 13% hybrid trout, 6% brook trout, 50% Utah chub, and 2% redside shiner.
Natural production from three main spawning tributaries to Henrys Lake (Duck, Targhee,
and Howard creeks) was estimated at 138,640 fish. The apparent low production from these tributaries warrants further investigation.

3
Assessments of genetic status of Yellowstone cutthroat populations in Henrys Lake and
its tributaries were continued. In random lake samples of Oncorhynchus spp (n = 71), the overall introgression level was 14%. However, within this sample, those fish phenotypically identified as cutthroat trout (n = 37) were less than 1% introgressed. Authors: Jeff Dillon Regional Fisheries Biologist Mark Gamblin Regional Fisheries Manager
4
OBJECTIVE
To obtain current information for fishery management decisions on lowland lakes and
reservoirs, including angler use, success, harvest and opinions, fish population characteristics, stocking success, return-to-the-creel for hatchery trout, limnology and develop appropriate management recommendations.
METHODS
Island Park Reservoir
Since the 1992 drawdown and renovation of Island Park Reservoir, annual standardized gillnetting has been used to monitor species composition, relative abundance, and size structure of the fishery in the lake. On May 8-9, 2000, four sinking and three floating experimental gill nets were fished at standardized locations (seven net-nights; Dillon et al. 2000). Set and pull times for each net were recorded, and all captured fish were identified, enumerated, and measured. Relative abundance data were compiled and compared to data from 1993-1999.
Ririe Reservoir A routine creel survey was implemented on Ririe Reservoir to monitor catch and harvest rates and species composition in the harvest. Additional objectives in 2000 were to assess relative return to creel of sterile triploid and normal diploid hatchery rainbow trout Oncorhynchus mykiss, and to evaluate a stocking of catchable-size Yellowstone cutthroat trout O. clarki bouvieri. Triploid rainbow trout were given left pelvic fin clips, and diploids were given right pelvic fin clips. Hatchery cutthroat trout were obtained from Jackson National Fish Hatchery and reared at Mackay State Fish Hatchery to an average size of about 300 mm. Survey dates were June 8 to September 18, with random days and start times generated with the Department creel survey software. No angler counts were done. Creel clerks were instructed to identify and measure all fish observed in the harvest, and to inspect all harvested rainbow trout for fin clips.
Henrys Lake Spawning Operation
The Hatchery Creek fish ladder was opened on March 1 and remained in operation until May 5. Fish ascending the ladder were identified as cutthroat trout or hybrid trout (rainbow trout x cutthroat trout) and enumerated. A sub-sample of approximately 10% of each group was measured (fork length). Hybrid trout were produced with cutthroat trout eggs and Kamloops rainbow trout sperm obtained from Hayspur Hatchery. Cutthroat trout males and females were spawned to produce cutthroat trout for supplemental stocking in Henrys Lake and other Idaho fisheries. No brook trout Salvelinus fontinalis eggs were taken from Henrys Lake in 2000.
5
As in 1999, all hybrid eggs produced in 2000 were subjected to heat-shock to induce triploidy. In 1999, all eggs for hybrid production were taken the first four days the fish ladder was open. Because both eye-up and triploidy induction rates were relatively poor in 1999, we elected to take eggs for hybrid production later in the run in 2000. Eggs for hybrid trout production were taken on March 23 and 27 and on April 6 and 27. It is hypothesized that egg quality, and perhaps survival and induction rates, would improve with later egg collection. For each spawn day, cutthroat trout eggs (seven females, pooled) were fertilized with Hayspur Kamloops sperm (five males, pooled). Ten minutes after fertilization, eggs were poured into Heath trays and immersed in a 27°C circulating water bath for 20 min. Eye-up rates were monitored and compared to 1999 hybrid egg lots. All hybrid eggs were shipped to Mackay Hatchery for hatch and rearing. In early September, research personnel took blood samples from 60 fish, and had the samples analyzed for ploidy.
Disease samples were taken from fish collected from the cutthroat trout spawning run.
Ovarian fluids were collected from cutthroat trout (seven fish, pooled samples) during spawning at Henrys Lake Hatchery. Twelve batches of five fish each (60 fish total) were sacrificed for whirling disease sampling. All samples were sent to the Eagle Fish Health Laboratory (EFHL) for analysis. Genetic Analyses
The genetic inventory of the Henrys Lake cutthroat trout population continued in 2000. The focus of this inventory was to estimate the level of rainbow trout introgression in a random lake-wide sample of Oncorhynchus spp., and within this sample to estimate introgression in fish identified phenotypically as cutthroat trout. On July 13-15, ten experimental gill nets were set at random sites around the lake. By this date, it was assumed that all surviving spawners from the previous spring would have reentered the lake, and were randomly mixed within the lake. Each net was set at dusk and pulled the following morning. To avoid any bias in selection of fish, a sampling protocol was implemented before each net was pulled and before any fish were observed. For each set, every second or third Oncorhynchus encountered was included in the genetics sample. Each fish was placed on ice and returned to Henrys Lake Hatchery. At the hatchery, each fish was identified based on phenotype and measured (total length). Tissue samples (eye, liver, heart, and muscle) were collected from each fish, placed in labeled bags, and frozen. Samples were shipped frozen to the Washington Department of Fish and Wildlife genetics lab in Olympia, WA for genetic analysis using protein electrophoresis. A total of 13 protein loci were examined, eight of which were reliably diagnostic between rainbow trout and cutthroat trout. Genetic results were expressed as the overall level of rainbow trout introgression present in the sample (i.e., the number of rainbow trout alleles observed / total number of alleles examined).
Gillnetting
As part of routine population monitoring, gill net samples were collected from six standardized locations (total six net nights) on May 22-24. Nets were set at dusk and retrieved
6
the following morning. Set and pull times were recorded and captured fish were identified to species and measured (total length). Because the gill nets used for standard monitoring at Henrys Lake do not effectively sample Utah chub Gila atraria, trend data for chub abundance and size structure are lacking. On May 22-24, six additional gill net locations were established for using standard Department experimental nets. Again, set and pull times were recorded, and captured fish were identified and measured. Tributary Fry Trapping Prior to 2000, natural production to Henrys Lake had never been quantified. Tributary fencing, canal fish screens, and fish passage projects have been in place since the late 1980s, and habitat conditions in major spawning tributaries (Howard, Targhee, and Duck creeks) appear to have improved. However, natural reproduction in the lake appears to be insignificant. In 1998 fry trapping efforts, partial estimates of natural production in Howard Creek were obtained, but traps were installed too late to estimate total production. Based on observations of fin-clipped fish during the 1999 creel survey, hatchery fish comprised over 90% of the cutthroat trout harvest. During 2000, Krey-Meekin fry traps were used to monitor and estimate total fry production from Howard, Targhee, and Duck creeks. Traps were installed on June 7-8 near the mouths of each tributary. On June 23 an additional trap was installed on Duck Creek, approximately one kilometer upstream of the mouth, due to poor catch near the mouth. Each trap was checked daily. All captured fry were enumerated, and a sub-sample was measured (total length). When catch rates were sufficient, trapping efficiency was estimated by marking and releasing fry 200-400 m upstream of the trap. Marking was done by immersing 100-150 fry in a solution of Bismarck brown dye (0.75 g per 3 gal water) for 20 min. All marked fry were held overnight to assess mortality before release. Recaptures were identified and enumerated at each trap site. Total fry emigration for each mark-recapture interval was estimated by dividing the total number of new fry captured during that interval by the efficiency for that interval. Interval estimates and variances were summed to provide an overall estimate of fry emigration in each tributary.
RESULTS AND DISCUSSION
Island Park Reservoir
A total of 718 fish were captured with a combined gillnetting effort of seven net-nights (Table 1). Catch composition included nine species. Game fish (trout, char, mountain whitefish Prosopium williamsoni, and kokanee salmon O. nerka) comprised 27% of the total catch, compared to 37% in May 1999 samples. Utah chub, Utah sucker Catostomus ardens, and redside shiner Richardsonius balteatus comprised 73% of the catch, compared to 62% in 1999. Hatchery and wild rainbow trout comprised 18% of the catch, down from 23% in 1999 samples. A total of seven splake (brook trout x lake trout Salvelinus namaycush) and four Lahontan cutthroat trout were sampled.
7
Table 1. Gill net catch composition in Island Park Reservoir, Idaho, May 2000.
Species
Net Location
Soak time (hrs)
Utah Chub
Rainbow
trout
Brook trout
Kokanee
Mountain whitefish
Utah
sucker
Redside shiner
Splake
Total Brush Pile 16.3 106 18 1 3 0 2 0 2 132 Bill’s Island 18.3 171 14 3 30 1 54 24 2 299 Mill Creek 19.5 46 14 6 1 0 0 0 2 69 Trudes Bay 20.2 13 17 2 1 0 9 0 1 43 Goose Island 21.7 14 22 0 2 0 15 0 0 53
Goose box #25 20.2 18 19 0 2 1 1 0 0 41Goose box #56 20.5 40 26 0 2 1 10 2 0 81Total 136.7 408 130 12 41 3 91 26 7 718Percent - 56.8 18.1 1.7 5.7 0.4 12.7 3.6 1.0 -
7

8
Ririe Reservoir
From June 9 to September 18 creel clerks interviewed 247 anglers who fished 497 hours, caught 341 fish, and harvested 214 fish. Mean catch rate was 0.69 fish/h and mean harvest rate was 0.43 fish/h. Harvest composition was 48% hatchery rainbow trout, 21% yellow perch Perca flavescens, 19% kokanee salmon, and 10% Yellowstone cutthroat trout. Only one smallmouth bass Micropterus dolomieu was observed in the harvest. The experimental stocking of hatchery Yellowstone cutthroat trout appeared to be successful. The 1,500 fish stocked comprised about 9% of the total trout stocking and 10% of the observed trout harvest. Comparisons of triploid and normal rainbow trout were compromised by inadequate identification of fin clips in the field. Creel clerks inspected each harvested fish for left pelvic clips (triploids), but did not record right pelvic clips (diploid). Despite this uncertainty, fish recorded as triploids comprised over 60% of the trout harvest, whereas fish recorded as unmarked comprised only 22%. This suggests that triploid fish return to creel at a higher rate than diploid fish, but clearly a more rigorous evaluation is needed.
Henrys Lake Spawning Operation
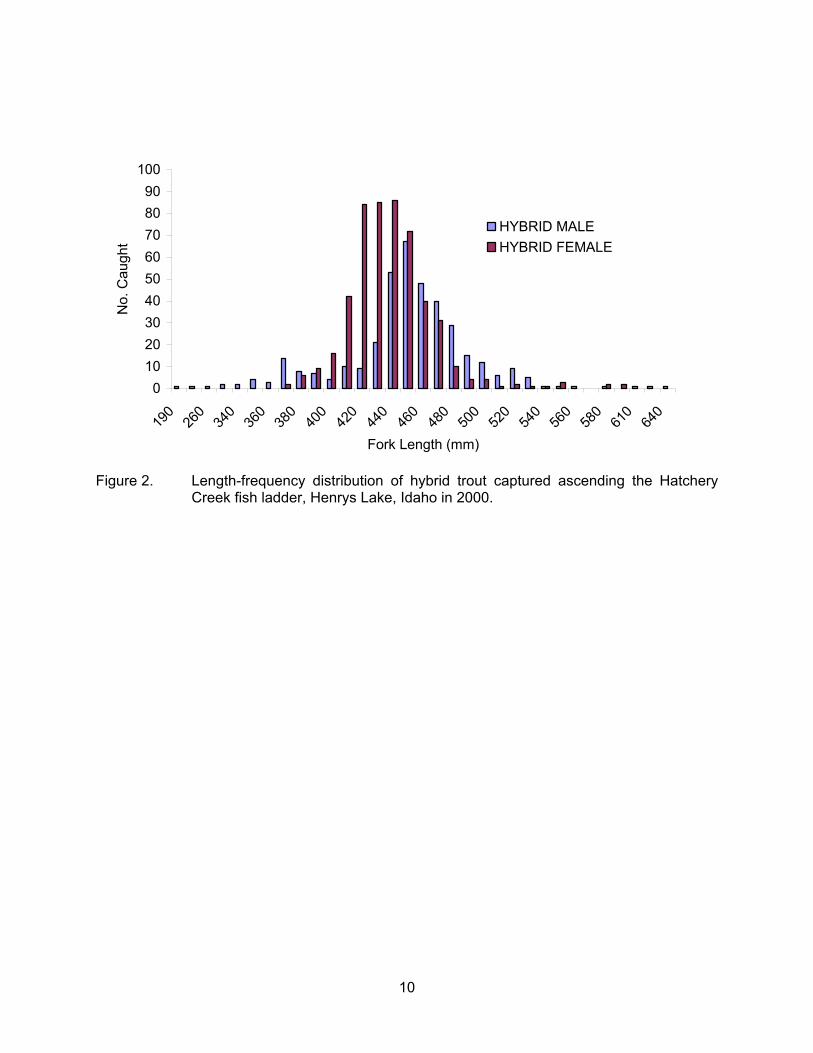
A total of 4,195 cutthroat trout ascended the spawning ladder between March 1 and May 5, with 2,215 males and 1,980 females. Hybrid trout totaled 8,530 fish, with 3,788 males and 4,742 females. Mean fork length for male and female cutthroat trout was 440 and 433 mm, respectively (Figure 1). Combined average cutthroat trout fork length was 437 mm. Hybrid trout males and females averaged 450 and 438 mm, respectively (Figure 2). Combined average hybrid trout length was 443 mm. The proportion of cutthroat trout in the spawning run was 33%, much lower than recorded in the recent past. Over the previous five years, cutthroat trout comprised an average of 70% of the spawning run. However, selection and classification at the hatchery ladder has changed markedly in the last year. With the recent emphasis on genetic analyses, awareness of genetic issues has increased, and hatchery and management personnel have been much more selective in determining which fish are classified as cutthroat trout. With this change in classification criteria, cutthroat trout numbers appear to be declining, both in the 2000 hatchery ladder data and in the 1999 creel survey data. Clearly, cutthroat trout numbers have not declined as dramatically as these data suggest, and this is largely an artifact of more conservative fish classification. It is also important to note that despite several decades of less stringent selection criteria at the hatchery ladder, current introgression levels in phenotypic cutthroat trout are low (see genetic analysis section below). In future monitoring activities, it is recommended that the ladder be sorted into three groups of fish: 1) phenotypically “pure” cutthroat trout which meet our intensive selection criteria and could be used for spawning; 2) cutthroat trout which are not obvious hybrids but do not meet the criteria, and, 3) obvious phenotypic hybrid trout.

9
Figure 1. Length-frequency distribution of cutthroat trout captured ascending the Hatchery Creek fish ladder, Henrys Lake, Idaho in 2000.
0
5
10
15
20
25
30
35
40
45
50
190
260
340
360
380
400
420
440
460
480
500
Fork Length (mm)
No.
Cau
ght
CUTTHROAT MALECUTTHROAT FEMALE
10
Figure 2. Length-frequency distribution of hybrid trout captured ascending the Hatchery Creek fish ladder, Henrys Lake, Idaho in 2000.
0102030405060708090
100
190
260
340
360
380
400
420
440
460
480
500
520
540
560
580
610
640
Fork Length (mm)
No.
Cau
ght
HYBRID MALEHYBRID FEMALE

11
Cutthroat trout green eggs totaled 2,386,437 from 904 females for an average fecundity of 2,639 eggs per female. Eyed cutthroat trout eggs totaled 1,436,528 for an overall eye-up rate of 60%.
Hybrid trout green eggs (all heat-shocked) totaled 993,750 from 375 cutthroat trout females for an average fecundity of 2,650 eggs per female. Eyed hybrid trout eggs totaled 343,798 for an overall eye-up rate of 35%.
Results from cutthroat trout ovarian fluid disease samples were not obtained in time for
inclusion in this report. Eleven of 12 pooled samples (five fish each) from the ladder tested positive for Myxobolus cerebralis, the causative agent for whirling disease.
This was the second year induction of triploidy was attempted for all Henrys Lake
hybrids. Overall eye-up rate was poor again (35%) and about 25-40% lower than typical for untreated hybrid eggs. Estimated overall triploidy induction rate was 65%, substantially lower than is being achieved in domestic Hayspur and kamloop rainbow trout. Additional modifications to the heat-shock process may be necessary to achieve induction rates approaching 100%. Hydrostatic pressure shock should also be investigated as a means of achieving sterility, although using this technique at a production level will be more difficult than heat-shocking. One additional alternative may be producing a reciprocal hybrid cross with cutthroat trout sperm and kamloop rainbow trout eggs, although performance of such a cross is unknown.
Genetic Analysis Lake-wide sampling effort (10 net-nights) resulted in capture of 298 fish. Seventy-one Oncorhynchus spp. were randomly selected for genetic analysis. Of these, 37 were phenotypically identified as cutthroat trout, 29 as hybrid trout, and 5 as undetermined. In the overall sample (n = 71 fish) 1,076 alleles were examined. Of these, 148 (14%) were rainbow trout alleles. This is probably the best estimate of the introgression level in the Henrys Lake trout population. In those fish phenotypically identified as cutthroat trout (n = 37) a total of 552 alleles were examined. Of these, only 4 (1%) were rainbow trout alleles. In phenotypically indeterminate fish (n = 5) a total of 78 alleles were examined, 6 (8%) were rainbow trout alleles. A number of conclusions can be drawn from these results. The most important is that, despite a long history of hybrid and rainbow trout stocking, the overall introgression level of rainbow trout genes in Henrys Lake is moderate. Note that this sample included hybrid trout that are produced at the hatchery and stocked annually. Fish that we identified in the field as cutthroat trout appear to be introgressed at a very low level (<1%). This suggests that hatchery selection for “pure” cutthroat trout has been quite successful over time, and that the reproductive contribution of hybrids to the overall lake population has been negligible.
In the six Henrys Lake tributaries sampled in 1998-1999, nuclear and mitochondrial DNA techniques did detect varying levels of introgression (Dillon and Gamblin 1999). Although phenotypic hybrid trout do ascend Henrys Lake tributaries and are assumed to spawn in the wild with other hybrids and with cutthroat trout, there is no evidence that this has resulted in extensive hybridization in the lake-wide cutthroat trout population. This could be because the

12
contribution of natural recruitment to the lake population is low (see Fry Trapping Section below). Alternatively, hybrid trout may be reproductively less fit than native cutthroat trout, or backcrossed hybrids may be less viable than F1 hybrids or native cutthroat trout. Gillnetting
A total of 81 fish were collected in the seven net-nights with standard Henrys Lake nets (Figure 3). Catch composition was 10% cutthroat trout, 52% hybrid trout, 28% brook trout, and 10% Utah chub. Cutthroat trout ranged from 274 to 482 mm total length, hybrid trout 225 to 536 mm, and brook trout 240 to 449 mm. Brook trout contribution to gill net catches has increased markedly in the last five years, up from 3% in 1995. Although total sample size is relatively small, the Utah chub component is the highest ever recorded for this standard netting effort, up from 8% in 1999.
Six experimental gill nets set to establish monitoring sites for Utah chub captured a total
of 193 fish (Figure 4). Utah chub comprised 50% of the sample, cutthroat trout 29%, hybrid trout 13%, brook trout 6%, and redside shiner 2%. Tributary Fry Trapping In each tributary, traps were installed prior to migration of trout fry back to Henrys Lake (June 7-8). Fry emigration peaked in early-July in Howard Creek, mid-July in Duck Creek, and late July in Targhee Creek (Figure 5). In Howard Creek, catch rates were sufficient to conduct seven efficiency estimates from June 16 to July 26. Efficiency ranged from 14% to 41%. Total fry outmigration from June 7 to September 2 was estimated at 41,737 (SE 8,389). In Duck Creek, the bulk of the emigration took place from July 5 to August 1. Four efficiency estimates were made during this time, ranging from 2% to 16%. Total fry outmigration from June 23 to September 12 was 86,809 (SE 30,175). Poor efficiency, particularly late in the outmigration period, contributed to broad confidence bounds for this estimate. In Targhee Creek, catch rates were much lower than in other tributaries. Only two efficiency estimates were attempted, on July 29 and August 5. Because estimated efficiencies were similar among intervals, results were pooled to provide an overall efficiency estimate of 13%. Based on this efficiency, total fry emigration from June 8 to September 19 was estimated at 10,094 (SE 1,823). The estimated total fry production from these three primary spawning tributaries was 138,640. Some additional emigration may have occurred outside our sampling period, but is considered minimal based on the declining catch rates observed by the end of the sampling period. Traps were run into the fall, anticipating additional emigration. However, because hatchery cutthroat trout fingerlings were stocked into tributaries from early to mid-September, traps were shut down at this time. Despite the uncertainty of fall migrations, production from these three tributaries appears minimal, especially placed in context of the 1,000,000 hatchery fingerlings stocked annually. Results from the 1999 creel survey also suggest that only a small

13
Figure 3. Catch composition of fish caught in six gill net nights of effort on Henrys Lake,
Idaho in 2000.
Hybrid trout52%
Yellowstone cutthroat trout10%
Utah chub10%
Brook trout28%
N=81

14
Figure 4. Catch composition of fish captured with six net-nights of effort with experimental
gill nets on Henrys Lake, Idaho in 2000. Nets were targeting nongame fish.
Redside shiner2%
Yellowstone cutthroat trout 29%
Hybrid trout13%
Brook trout6%
Utah chub50%
N=193

15
Figure 5. Timing of trout fry emigration from various tributaries to Henrys Lake, Idaho in
2000.
0
500
1000
6/8/20
00
7/8/20
00
8/7/20
00
9/6/20
00
10/6/
2000
Date
No.
Fry
Cau
ght
Targee CrDuck CrHoward Cr
16
fraction of the fishery is provided by naturally produced fish. Based on fin clips, virtually all of the cutthroat trout harvest in 1999 was hatchery fish. Additionally, if natural production was contributing a significant portion of the lake fishery, introgression levels in the lake-wide cutthroat trout population should have fallen somewhere between levels in tributary and hatchery ladder samples. In fact, introgression levels for phenotypic cutthroat trout selected randomly from the lake are almost identical to those at the hatchery ladder. It is unclear why natural reproduction is poor in these tributaries. Large spawning runs are observed annually in each, although spawning escapement has never been quantified. Habitat enhancements such as riparian fences and canal fish screens have been in place for a decade, and spawning and rearing habitat appears to be excellent. We suggest that additional investigations focus on spawner inventories, redd counts, and perhaps egg-to-fry survival in Henrys Lake tributaries. Also, because whirling disease is present in the drainage, we suggest capturing and rearing naturally produced fry to monitor survival.
RECOMMENDATIONS
Island Park Reservoir 1. Continue spring gill net surveys to monitor changes in species composition. 2. Institute lake-wide creel survey to monitor effort, catch composition, size of catch and
catch rates over the course of a fishing season.
Ririe Reservoir
1. Continue experimental stockings of hatchery Yellowstone cutthroat trout. 2. Institute a structured, lake-wide creel survey to monitor effort, catch rates, species
composition, and relative returns of various groups of stocked hatchery fish. Survey should encompass the entire fishing season.
Henrys Lake 1. Continue annual standard gill net surveys to describe general population trends. 2. Continue to evaluate sterile hybrid production and stocking program; develop evaluation
plans to assess triploid hybrid performance in Henrys Lake. Investigate alternative methods for triploidy induction.
3. Increase emphasis on evaluating spawning escapement, spawning habitat and natural
recruitment in key tributaries of Henrys Lake.

17
2000 ANNUAL PERFORMANCE REPORT State of: Idaho Program: Fisheries Management F-71-R-25 Project: I-Surveys and Inventories Subproject: I-G Upper Snake Region Job No.: c1 Henrys Fork Snake River Title: Rivers and Streams Investigations
Big Lost River Contract Period: July 1 2000 to June 30 2001 ABSTRACT
An electrofishing survey of the Box Canyon Reach of the Henrys Fork of the Snake
River was conducted during May 2000. With estimates derived from this sample, the population of recruited (>150 mm) wild rainbow trout (WRB) Oncorhynchus mykiss was estimated at 12,221 fish (SD 792). This represents a three-fold increase over the 1996 estimate conducted on this same stretch of river by the Idaho Fish and Game Department (Department). Historical trends in the Box Canyon Reach have shown a decline in WRB beginning in the early 1980s, followed by a gradual increase in densities after 1996.
Six sections of the Big Lost River drainage above Mackay Reservoir were electrofished during July 2000. These samples were used to estimate the population size of both rainbow trout and brook trout Salvelinus fontinalis. Salmonid densities in the Bartlett Point Road area (Harry Canyon) were estimated at 298 rainbow trout/ha and 54 brook trout/ha, and reflected an increase in both species over previous samples. Brook trout were the dominant salmonid in the East Fork sections (Whitworth and Fox creeks) and outnumbered rainbow trout. Estimates of abundance for rainbow trout in these sections were 139 (Whitworth Creek) and 110 (Fox Creek). Brook trout were estimated at 170 and 534, respectively. The estimates for the East Fork were similar to results found in 1997, and indicate a stable population exists in this area.
Authors: Jeff Dillon Regional Fisheries Biologist Bill Schrader Regional Fisheries Biologist Mark Gamblin Regional Fisheries Manager

18
OBJECTIVE
To obtain current information for fishery management decisions on rivers and streams, including angler use, success, harvest and opinions, fish population characteristics, spawning success, habitat characteristics, return-to-the-creel for hatchery trout and develop appropriate management recommendations.
METHODS
Box Canyon Population Estimate
Mark-Recapture density estimates were conducted on the Box Canyon Reach of the Henrys Fork. Two drift boat electrofishers made a total of eight passes during the marking event. All captured fish were identified, measured and given an upper caudal fin punch. Six passes were made during the recapture event. To avoid duplicate counting, fish captured during each recapture pass were given a lower caudal fin punch. Mark-recapture data were analyzed with MR5 software (MDFWP 1994).
Big Lost River Population Estimates Population estimates were derived for the Bartlett Point Road area (2.24 km long, 3.1 ha total area) and the East Fork (Fox Creek; 1.16 km long, 1.4 ha, and Whitworth Creek; 1.38 km long, 1.7 ha) of the Big Lost River. Multiple passes were made using backpack electrofishing gear. Fish were marked during the first run, and examined for marks on subsequent runs. Population estimates were derived using the MR5 data analysis program.
RESULTS AND DISCUSSION
Box Canyon Population Estimate
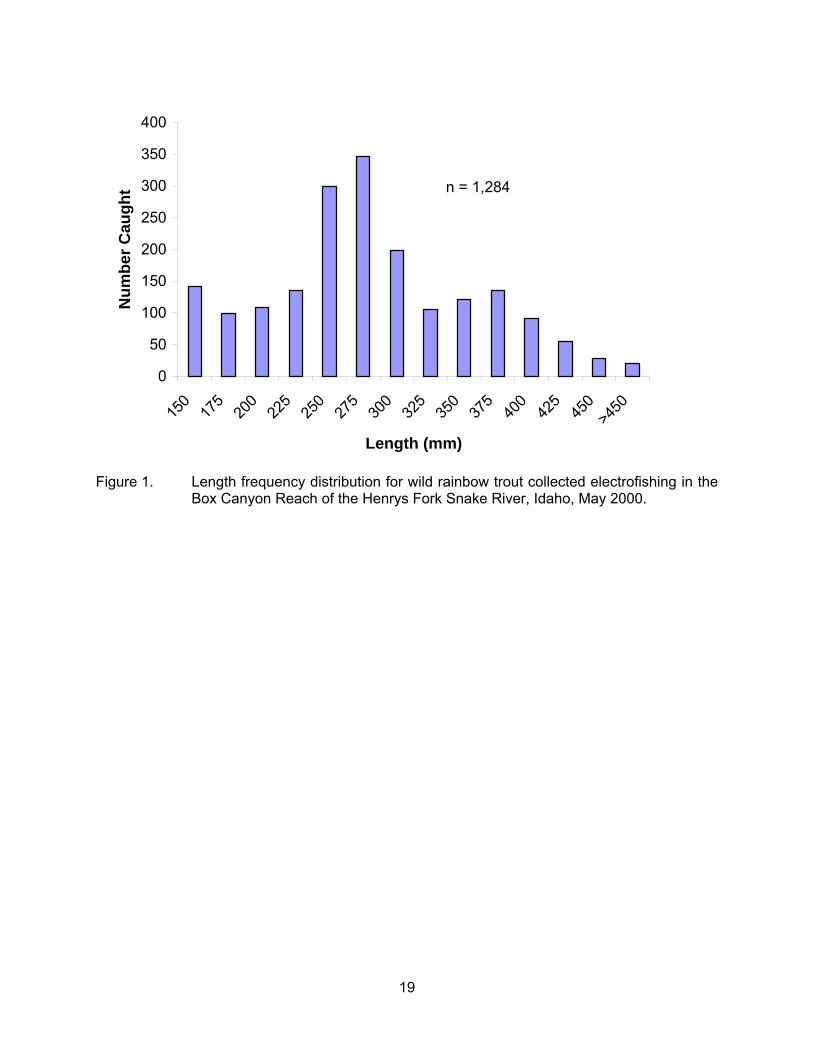
A total of 1,284 wild rainbow trout Oncorhynchus mykiss >150 mm were sampled in marking and recapture runs combined. Other fish sampled included brook trout Salvelinus fontinalis (n=2), rainbow x cutthroat trout O. clarki hybrids (n=4), kokanee O. nerka (n=2) and hatchery rainbow trout (n=6).
Wild rainbow trout sampled in this reach ranged in size from 150 to 575 mm (Figure 1). Sampling efficiency increased slightly with fish size. Estimated abundance of wild rainbow trout 150 mm was 13,447 fish using the modified Peterson method and 12,221 fish using the log-likelihood method (Table 1). Abundance estimates equate to about 3,362 fish/rkm. These estimates reflect the highest densities recorded since 1993, and reflect an increasing trend in abundance since the low recorded in 1996.
19
Figure 1. Length frequency distribution for wild rainbow trout collected electrofishing in the Box Canyon Reach of the Henrys Fork Snake River, Idaho, May 2000.
0
50
100
150
200
250
300
350
400
150
175
200
225
250
275
300
325
350
375
400
425
450
>450
Length (mm)
Num
ber C
augh
t n = 1,284

20
Table 1. Estimated abundance of wild rainbow trout >150 mm in the Box Canyon Reach of the Henrys Fork of the Snake River, Idaho, 1993 – 2000.
Season/Year
Modified Peterson method (MPM)
Log-likelihood method (LLM)
No./ River mile by
MPM (LLM) No./ Reach MPM (LLM)
RSD-Q (400 mm)
Fall 1993 ~10,000 ~4,200 11,800 NA
Spring 1994 7,234 9,359 3,014 (3,900)
8,489 (10,920)
39
Spring 1995 6,080 5,904 2,533 (2,460)
7,092 (6,888)
28
Spring 1996 3,390 4,210 1,413 (1,754)
3,965 (4,911)
20
Spring 1997 5,302 5,278 2,209 (2,199)
6,185 (6,157)
13
Spring 1998 6,619 8,527 2,758 (3,553)
7,722 (9,948)
12
Spring 1999 4,807 5,110 2,003 (2,129)
5,608 (5,961)
15
Spring 2000 13,447 12,221 5,603 (5,092)
15,744 (14,258)
10
21
Big Lost River Population Estimates
A total of 167 rainbow trout and 54 brook trout were collected in the Bartlett Point Road area of the Big Lost River. Rainbow trout ranged in size from 150 to 458 mm, while brook trout ranged in size from 150 to 346 mm (Figure 2). Density estimates in this area showed the rainbow trout population to be 295 fish/ha, the highest level estimated since 1988 (Table 2). Densities of brook trout were also higher than recorded previously; although this is the first year these fish were captured in sufficient numbers to estimate population size. Yellowstone cutthroat trout were captured in the 2000 survey, but in very low abundance. Population trends in the East Fork of the Big Lost River (Whitworth and Fox creeks) show rainbow trout populations to be relatively stable at 139 fish (82 fish/ha) in Whitworth and 110 fish (78.6 fish/ha) in Fox Creek. However, brook trout populations appear to have increased substantially over the past several years. Densities in Whitworth Creek have increased nearly three times levels found during 1996, while in Fox Creek; densities have nearly doubled from 1996 levels. Although Yellowstone cutthroat trout were present in both creeks, densities were lower than necessary to calculate abundance.
RECOMMENDATIONS
1. Continue monitoring of the Box Canyon reach of the Henrys Fork Snake River to address population changes over time.
2. Conduct additional sampling in the headwaters of the Big Lost River. Consider habitat
measurements and classifications in this sampling in order to attempt to explain the increase in brook trout population changes.

22
Figure 2. Length-frequency distribution for rainbow trout (WRB) and brook trout (BKT)
captured electrofishing in the Bartlett Point Road area of the Big Lost River, Idaho in 2000.
0
2
4
6
8
10
12
14
16
18
20
150
170
190
210
230
250
270
290
310
330
350
370
390
410
430
450
Length (mm)
No.
Cau
ght WRB BKT
23
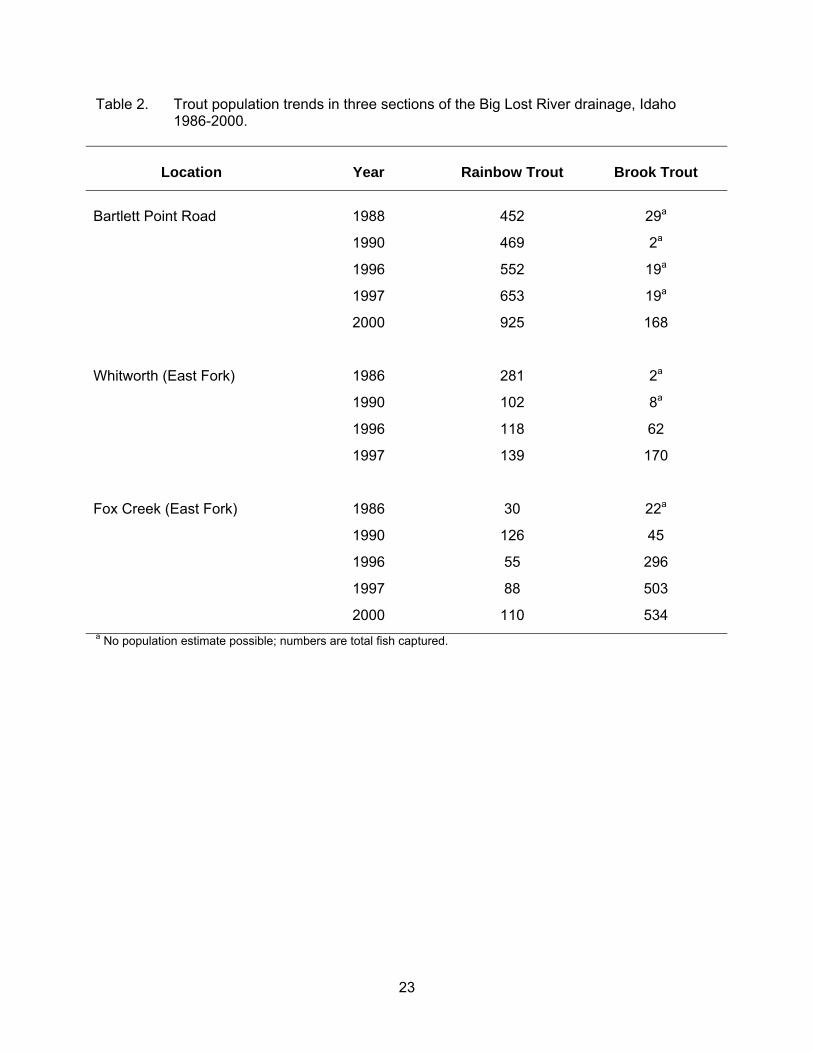
Table 2. Trout population trends in three sections of the Big Lost River drainage, Idaho 1986-2000.
Location Year Rainbow Trout Brook Trout
Bartlett Point Road 1988 452 29a
1990 469 2a
1996 552 19a
1997 653 19a
2000 925 168
Whitworth (East Fork) 1986 281 2a
1990 102 8a
1996 118 62
1997 139 170
Fox Creek (East Fork) 1986 30 22a
1990 126 45
1996 55 296
1997 88 503
2000 110 534 a No population estimate possible; numbers are total fish captured.

24
LITERATURE CITED Montana Department of Fish, Wildlife, and Parks. 1994. MARKRECAPTURE Version 4.0: A
software package for fishery population estimates. Montana Department of Fish, Wildlife, and Parks, Helena.
25
2000 ANNUAL PERFORMANCE REPORT
State of: Idaho Program: Fisheries Management F-71-R-25 Project I: Surveys and Inventories Subproject I-G: Upper Snake Region Job: c2 - South Fork Snake River Title: Rivers and Streams Investigations Contract Period: July 1, 2000 to June 30, 2001
ABSTRACT In the South Fork Snake River, a total of 1,205 trout were captured during two days of electrofishing at the Conant section in October 2000. Trout species composition and relative abundance were cutthroat trout Oncorhynchus clarki (66%), rainbow trout O. mykiss and hybrid rainbow X cutthroat trout O. clarki x mykiss (22%), and brown trout Salmo trutta (11%). No lake trout Salvelinus namaycush or kokanee O. nerka kennerlyi were caught. Fish densities were not estimated because of low flows. Mean total length was 315 mm for cutthroat trout, 307 mm for rainbow and hybrid trout, 312 mm for brown trout, and 313 mm for all species combined. Quality stock density (QSD) was 2.3% for cutthroat trout, 13.8% for rainbow and hybrid trout, 12.8% for brown trout, and 6.0% for all species combined. A total of 1,672 trout were captured during four days of electrofishing at the Twin Bridges section in September and October 2000. Trout species composition and relative abundance were cutthroat trout (28%), rainbow trout and hybrid trout (1%), and brown trout (71%). No lake trout or kokanee salmon were caught. Estimated densities were 654 fish/km for cutthroat trout, 1,820 fish/km for brown trout, and 2,503 fish/km for all species combined. Rainbow and hybrid trout density estimates were not possible due to the small sample size. Mean total length was 310 mm for cutthroat trout, 296 mm for rainbow and hybrid trout, 284 mm for brown trout, and 291 mm for all species combined. Quality stock density (QSD) was 5.8% for cutthroat trout, 0.0% for rainbow and hybrid trout, 3.1% for brown trout, and 3.9% for all species combined.
Rainbow and hybrid trout were not removed at Conant but were sacrificed at Twin Bridges during recapture runs (11 fish). Authors: William C. Schrader Senior Fishery Research Biologist Mark Gamblin Regional Fishery Manager
26
INTRODUCTION AND STUDY AREA Since 1986, trout populations in the South Fork Snake River have been monitored
annually using electrofishing. Four river sections have been electrofished (Figure 1): Palisades (5.0 km), Conant (4.9 km), Twin Bridges (2.9 km), and Lorenzo (4.8 km). However, only the Conant section has been sampled every year, a portion of which was sampled in 1982 as well (Moore and Schill 1984). The last creel census was conducted in 1996 (Schrader et al. 2003).
On August 14, 1998, Yellowstone cutthroat trout Oncorhynchus clarki bouvieri was
petitioned to be listed as a threatened species under the Endangered Species Act. The focus of work this year was to collect data supporting the Idaho Department of Fish and Game (Department) response to the petition (IDFG 2000a, 2000b). Besides providing multi-year trend monitoring data (Palisades, Conant, and Lorenzo sections), we assisted in a range-wide, paired-sampling project that covered 74 sites throughout Eastern Idaho. The objective was to compare density estimates from the late 1980s to those obtained in 1999 and 2000 at the same locations using the same methods. For the South Fork Snake River, we focused on the Conant and Lorenzo sections in 1999 and the Twin Bridges section in 2000. We did not sample at the Palisades section because of the difficulty distinguishing hatchery cutthroat trout (flushed from Palisades Reservoir). In 2000, we also sampled at the Menan section of the main Snake River just below the confluence of the South Fork and Henrys Fork Snake River, but these data are presented in separate reports (IDFG 2000b, Meyer et al. 2001, 2003). Finally, we collected 60-fish genetics samples (of random Oncorhynchus spp.) at Palisades, Conant, Twin Bridges, and Lorenzo in the South Fork Snake River and at Menan in the main Snake River. These samples were archived but have not been analyzed (M. Powell, University of Idaho, personal communication).
Special regulations restricting harvest of cutthroat trout were enacted upstream of the
Heise measuring cable to Irwin in 1984 and extended to Palisades Dam in 1988 (Appendix A). Based on this success, the restricted cutthroat trout harvest regulation was implemented throughout eastern Idaho in 1990 and included the lower South Fork (below Heise) and all South Fork tributaries. The two fish, none between 8-16 inches, regulation was extended to all trout species (including brown trout Salmo trutta) in the main stem (but not tributaries) in 1992. Emergency changes in 1999 removed rainbow trout O. mykiss (and later hybrid trout O. clarki x mykiss) from special regulations, returning them to the general six fish bag limit with no size restrictions. The minimum size restriction (8 inches) for cutthroat and brown trout was eliminated in 2000. The lower river (below the Heise cable) is open year-round to fishing, whereas the upper river is closed December 1 to Memorial Day weekend.
OBJECTIVES
To obtain current information for fishery management decisions on rivers and streams, including angler use and success, harvest and opinions, fish population characteristics, spawning success, habitat characteristics, return-to-the-creel for hatchery trout, and to develop appropriate management recommendations. Specific objectives related to the South Fork of the Snake River were to:

27
Figure 1. Map of South Fork Snake River showing electrofishing sections.

28
1. Monitor South Fork Snake River trout populations by electrofishing.
2. Summarize trout species composition, relative abundance, size structure, average fish
length, quality stock density (QSD), and density.
METHODS
During 2000, the Conant section was electrofished on October 19 and 26, and the Twin Bridges section was electrofished on September 28-29 and October 4-5. Recapture runs were not conducted at Conant because of low flows. The upper or lower half of a section was sampled each day. At Conant, flows varied from 87.8 to 95.2 m3/s (3,100 to 3,360 ft3/s) at the Irwin gage (USGS, unpublished data; Appendix B). At Twin Bridges, flows varied from 54.4 to 62.0 m3/s (1,920 to 2,190 ft3/s) at the Lorenzo gage (USGS, unpublished data; Appendix C). A minimum of 70.8 m3/s (2,500 ft3/s) is needed at either section for safe boat operation and efficient sampling.
Fish were captured using direct-current (DC) electrofishing gear (Coffelt VVP-15 powered by a Honda 5000 W generator) mounted in an 18-foot Alumaweld sled with a 150 hp outboard jet. We used pulsed DC current through two boom-and-dangler anodes fixed to the bow while driving downstream. The boat hull was the cathode. Similar to previous years, the VVP settings were at 150-200 V, 5-7 A, 20% pulse width, and 60-90 Hz (pulses per second).
We attempted to capture all species and sizes of trout. Hereinafter, “rainbow trout” will refer to rainbow and hybrid trout combined. Fish were anesthetized, identified, and measured to the nearest millimeter for total length (TL). Brown trout less than 150 mm and all other species less than 100 mm (approximately age-0) were not marked, as they are not effectively recruited to the gear. Age-1 and older fish were marked with a caudal fin punch and released. All rainbow trout caught during recapture runs at Twin Bridges were killed. In addition, 44 mountain whitefish at Twin Bridges and 49 mountain whitefish Prosopium williamsoni at Menan were sacrificed for a genetics study (A. Whitely, University of Montana, personal communication).
Electrofishing data were entered and analyzed using the computer program Mark Recapture 5.0 (MR5; Montana Department of Fish, Wildlife, and Parks 1994). Other data were entered and analyzed using Microsoft Excel. General statistical analysis was conducted according to Zar (1984).
We assumed capture probabilities did not vary with species, and relative abundance was estimated using proportions of all individual trout captured (excluding recaptures). Although capture probabilities vary with fish length (Schill 1992), population size structures (length-frequency distributions) and average fish lengths were estimated using all sizes of individual fish captured. Quality stock density was estimated using the number of individual fish captured >406 mm divided by the number >203 mm, multiplied by 100. Density was estimated using two methods in the MR5 computer program. The log-likelihood method was preferred over the modified Peterson method if modeled efficiency curves were acceptable (termcode = 1 and at least one of two chi-square p-values>0.05).

29
RESULTS
Conant Electrofishing A total of 1,205 trout were captured during two days of electrofishing in October 2000. Trout species composition and relative abundance were cutthroat trout (66%), rainbow trout (22%), and brown trout (11%; Figure 2, Appendix D). No lake trout Salvelinus namaycush or kokanee salmon O. nerka kennerlyi were caught. Less than 1% of the cutthroat trout captured was of hatchery origin. The cutthroat trout length frequency distribution shows a weak group of age-1 fish (about 100 to 250 mm), although age-2 and older fish (>250 mm) are well represented (Figure 3). In contrast, fairly strong groups of age-1 rainbow and brown trout (about 150 to 300 mm) were observed, but not as strong as in the past (Figures 4 and 5). Ages were approximated from these frequency distributions and will be validated with otoliths in the future.
Mean total length (TL) was 315 mm for cutthroat trout, 307 mm for rainbow trout, 312 mm for brown trout, and 313 mm for all species combined (Appendix E). Quality stock density (QSD) was 2.3% for cutthroat trout, 13.8% for rainbow trout, 12.8% for brown trout, and 6.0% for all species combined. Because recapture runs were not made, sample sizes were about half of previous years, and fish densities were not estimated (Appendix F and G).
Twin Bridges Electrofishing A total of 1,672 trout were captured during four days of electrofishing in September and October 2000. Trout species composition and relative abundance were cutthroat trout (28%), rainbow trout (1%), and brown trout (71%; Figure 2, Appendix H). No lake trout or kokanee salmon were caught. None of the cutthroat trout captured was of hatchery origin. The cutthroat trout length frequency distribution shows a weak group of age-1 fish (about 100 to 250 mm), although age-2 and older fish (>250 mm) are well represented (Figure 6). In contrast, a fairly strong group of age-1 brown trout (about 150 to 300 mm) was observed, but not as strong as in the past (Figure 7). Ages were approximated from these frequency distributions and will be validated with otoliths in the future.
Mean total length (TL) was 310 mm for cutthroat trout, 296 mm for rainbow trout, 284 mm for brown trout, and 291 mm for all species combined (Appendix I). Quality stock density (QSD) was 5.8% for cutthroat trout, 0.0% for rainbow trout, 3.1% for brown trout, and 3.9% for all species combined. Sample sizes were similar to previous years.
Electrofishing sampling efficiencies (R/C) were also similar to previous years and ranged
from 14% for brown trout to 27% for rainbow trout (Appendix J). Estimated densities of age-1 and older fish were 654 fish/km for cutthroat trout, 1,820 fish/km for brown trout, and 2,503 fish/km for all species combined (Figure 8; Appendix K). Similar to previous years, only 14 rainbow trout were captured and a density estimate was not possible. We killed all rainbow trout caught during recapture runs (11 fish).

30
Figure 2. Trout species composition and relative abundance at the Conant (top, n=1,205) and Twin Bridges (bottom, n=1,672) electrofishing sections, South Fork Snake River, 2000. Results are from the MR5 database for all sizes of fish.
Brown Trout11.1%
Lake Trout and Kokanee Salmon
0.0%
Cutthroat Trout66.4%
Rainbow Trout22.5%
Brown Trout71.0%
Lake Trout and Kokanee Salmon
0.0% Cutthroat Trout28.2%
Rainbow Trout0.8%
31
0 %
1 5 %
0 5 0 1 0 0 1 5 0 2 0 0 2 5 0 3 0 0 3 5 0 4 0 0 4 5 0 5 0 0 +
0 %
1 5 %
0 5 0 1 0 0 1 5 0 2 0 0 2 5 0 3 0 0 3 5 0 4 0 0 4 5 0 5 0 0 +
0 %
1 5 %
0 5 0 1 0 0 1 5 0 2 0 0 2 5 0 3 0 0 3 5 0 4 0 0 4 5 0 5 0 0 + Figure 3. Length-frequency distributions of cutthroat trout captured in the fall at the Conant
electrofishing section, South Fork Snake River. Note weak age-1 groups (about 100 to 250 mm) in 1989, 1991, and 2000. Total individual fish captured during mark and recapture runs = n. Results are from MR5 database for all sizes of fish.
1989 n = 2,291 Mean = 353 QSD = 8.8%
1991 n = 1,646 Mean = 333 QSD = 11.2%
2000 n = 800 Mean = 315 QSD = 2.3%
32
0 %
2 0 %
0 5 0 1 0 0 1 5 0 2 0 0 2 5 0 3 0 0 3 5 0 4 0 0 4 5 0 5 0 0 +
0 %
2 0 %
0 5 0 1 0 0 1 5 0 2 0 0 2 5 0 3 0 0 3 5 0 4 0 0 4 5 0 5 0 0 +
0 %
2 0 %
0 5 0 1 0 0 1 5 0 2 0 0 2 5 0 3 0 0 3 5 0 4 0 0 4 5 0 5 0 0 + Figure 4. Length-frequency distributions of rainbow trout captured in the fall at the Conant
electrofishing section, South Fork Snake River. Note a strong age-1 group (about 150 to 300 mm) in 1991, but less so in 1989 and 2000. Total individual fish captured during mark and recapture runs = n. Results are from MR5 database for all sizes of fish.
1989 n = 103 Mean = 323 QSD = 19.6%
1991 n = 150 Mean = 251 QSD = 6.6%
2000 n = 271 Mean = 307 QSD = 13.8%

33
0 %
2 0 %
0 5 0 1 0 0 1 5 0 2 0 0 2 5 0 3 0 0 3 5 0 4 0 0 4 5 0 5 0 0 +
0 %
2 0 %
0 5 0 1 0 0 1 5 0 2 0 0 2 5 0 3 0 0 3 5 0 4 0 0 4 5 0 5 0 0 +
0 %
2 0 %
0 5 0 1 0 0 1 5 0 2 0 0 2 5 0 3 0 0 3 5 0 4 0 0 4 5 0 5 0 0 + Figure 5. Length-frequency distributions of brown trout captured in the fall at the Conant
electrofishing section, South Fork Snake River. Note a strong age-1 group (about 150 to 300 mm) in 1991, but less so in 1989 and 2000. Total individual fish captured during mark and recapture runs = n. Results are from MR5 database for all sizes of fish.
1989 n = 175 Mean = 343 QSD = 38.5%
1991 n = 259 Mean = 274 QSD = 14.1%
2000 n = 134 Mean = 312 QSD = 12.8%
34
0 %
1 5 %
0 5 0 1 0 0 1 5 0 2 0 0 2 5 0 3 0 0 3 5 0 4 0 0 4 5 0 5 0 0 +
0 %
1 5 %
0 5 0 1 0 0 1 5 0 2 0 0 2 5 0 3 0 0 3 5 0 4 0 0 4 5 0 5 0 0 +
0 %
1 5 %
0 5 0 1 0 0 1 5 0 2 0 0 2 5 0 3 0 0 3 5 0 4 0 0 4 5 0 5 0 0 + Figure 6. Length-frequency distributions of cutthroat trout captured in the fall at the Twin
Bridges electrofishing section, South Fork Snake River. Note a strong age-1 group (about 100 to 250 mm) in 1991, but weak groups in 1989 and 2000. Total individual fish captured during mark and recapture runs = n. Results are from MR5 database for all sizes of fish.
1989 n = 367 Mean = 350 QSD = 17.4%
1991 n = 820 Mean = 279 QSD = 11.5%
2000 n = 471 Mean = 310 QSD = 5.8%
35
0 %
1 5 %
0 5 0 1 0 0 1 5 0 2 0 0 2 5 0 3 0 0 3 5 0 4 0 0 4 5 0 5 0 0 +
0 %
1 5 %
0 5 0 1 0 0 1 5 0 2 0 0 2 5 0 3 0 0 3 5 0 4 0 0 4 5 0 5 0 0 +
0 %
1 5 %
0 5 0 1 0 0 1 5 0 2 0 0 2 5 0 3 0 0 3 5 0 4 0 0 4 5 0 5 0 0 + Figure 7. Length-frequency distributions of brown trout captured in the fall at the Twin
Bridges electrofishing section, South Fork Snake River. Note a strong age-1 group (about 150 to 300 mm) in 1991, but less so in 1989 and 2000. Total individual fish captured during mark and recapture runs = n. Results are from MR5 database for all sizes of fish.
1989 n = 359 Mean = 374 QSD = 45.0%
1991 n = 638 Mean = 282 QSD = 20.4%
2000 n = 1,187 Mean = 284 QSD = 3.1%

36
0
5 ,0 0 0
1 0 ,0 0 0
1 5 ,0 0 0
2 0 ,0 0 0
1986*
1987*
1988*1989
1990*1991
1992*
1993*
1994*
1995*
1996*
1997*
1998*
1999*2000
Est
imat
ed N
umbe
r of F
ish/
Sect
ion C u t th ro a t T ro u t
0
5 ,0 0 0
1 0 ,0 0 0
1 5 ,0 0 0
2 0 ,0 0 0
1986*
1987*
1988*1989
1990*1991
1992*
1993*
1994*
1995*
1996*
1997*
1998*
1999*2000
Est
imat
ed N
umbe
r of F
ish/
Sect
ion B ro w n T ro u t
Figure 8. Abundance trends for age-1 and older cutthroat (top, >102 mm) and brown trout
(bottom, >152 mm) at the Twin Bridges electrofishing section, South Fork Snake River, September and October 1989-2000. Confidence intervals are at 95%. Asterisks indicate years when no estimate was made.
37
DISCUSSION At Twin Bridges in 2000, cutthroat trout density is similar to 1989 but significantly less
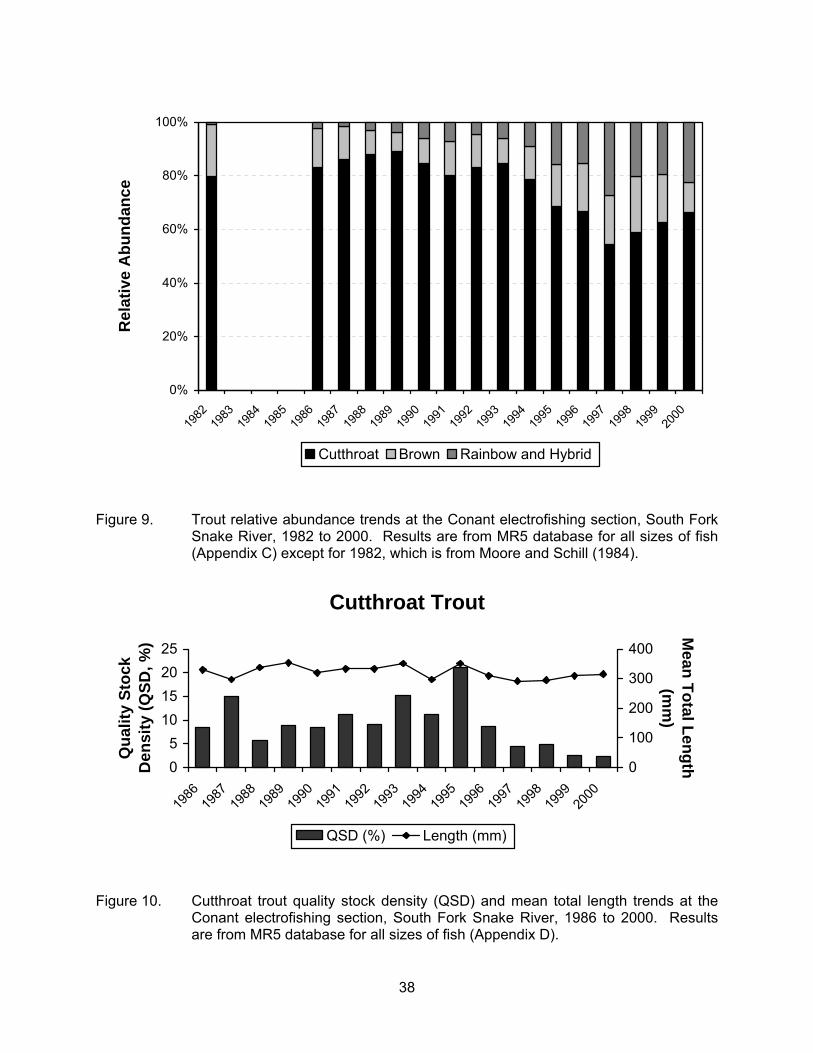
than 1991 (Figure 8). Their relative abundance has also declined with increasing brown trout. This may or may not be due to natural population variation. At Conant, cutthroat trout relative abundance has declined from 80-90% to 50-60% – although the 2000 estimate is similar to that observed since the mid-1990s. In contrast, rainbow trout relative abundance has increased steadily (Figure 9). Rainbow trout at Conant (but not Twin Bridges) have increased an order of magnitude since 1989 – the first year an estimate was possible. We conclude that this growing rainbow trout population in the upper river is the major threat to the genetic integrity and long-term viability of cutthroat trout in the South Fork. Hopefully, liberalized rainbow trout harvest regulations implemented in 1999 will reverse these trends.
Cutthroat trout are much less abundant in the lower South Fork (at Twin Bridges)
compared to the upper river (at Conant). This difference is probably due to recruitment limitations or irrigation diversion entrainment in the lower river. In contrast, brown trout are most abundant in the lower river and are increasing (Figure 8). Brown trout density estimates at Twin Bridges are highest on record - showing an upward trend similar to rainbow trout at Conant. It is likely that factors affecting cutthroat trout in South Fork have not had the same effect on rainbow and brown trout.
Cutthroat trout quality stock density (QSD) is the lowest on record at both Conant (2.3%;
Figure 10) and Twin Bridges (5.8%). In contrast, rainbow and brown trout QSDs have held steady at Conant but declined to record lows at Twin Bridges. The declines are due to fewer large (>400 mm) fish rather than more small fish. It is likely that harvest, rather than recruitment limitations, explains the difference.
Because the 1982, 1986, and 1987 electrofishing efforts were conducted in November
rather than in October, and the section was shortened in 1982 and 1987 resulting in smaller sample sizes, comparability of data from these years is somewhat limited. Similarly, the 1997 data may be confounded by significant habitat changes that occurred with near-record runoff of 1,275 m3/s (45,000 ft3/s).
RECOMMENDATIONS
1. Continue monitoring South Fork Snake River trout populations by electrofishing.
2. Develop length-weight regressions for each trout species. Predict fish weights from measured lengths and estimate biomass and standing crops for all sections and years. Compare relative weights.
38
Figure 9. Trout relative abundance trends at the Conant electrofishing section, South Fork
Snake River, 1982 to 2000. Results are from MR5 database for all sizes of fish (Appendix C) except for 1982, which is from Moore and Schill (1984).
Figure 10. Cutthroat trout quality stock density (QSD) and mean total length trends at the
Conant electrofishing section, South Fork Snake River, 1986 to 2000. Results are from MR5 database for all sizes of fish (Appendix D).
Cutthroat Trout
05
10152025
1986
1987
1988
1989
1990
1991
1992
1993
1994
1995
1996
1997
1998
1999
2000
Qua
lity
Stoc
k D
ensi
ty (Q
SD, %
)
0
100
200
300
400
Mean Total Length
(mm
)
QSD (%) Length (mm)
0%
20%
40%
60%
80%
100%
1982
1983
1984
1985
1986
1987
1988
1989
1990
1991
1992
1993
1994
1995
1996
1997
1998
1999
2000
Rel
ativ
e A
bund
ance
Cutthroat Brown Rainbow and Hybrid

39
ACKNOWLEDGMENTS Volunteers Bruce Penske (Department), John Hanson (Department), Don Kemner (Department), Ted Chu (Department-retired), Terry Thomas (Department), John O’Neill (Department), Dave Koehler (Department), Curtis Hendricks (Department), Brad Compton (Department), Matt Jaeger (MSU), and Wade Johnson (Department) helped with electrofishing. Paul Faulkner (Department) and Scott Host (Department) helped collect genetics samples. Fishery technician Ross Wehnke (Department) entered the data.

40
LITERATURE CITED
Idaho Department of Fish and Game (IDFG). 2000a. Comments to U.S. Fish and Wildlife Service regarding petition to list Yellowstone cutthroat trout as threatened under the endangered species act. Idaho Department of Fish and Game, Boise.
Idaho Department of Fish and Game (IDFG). 2000b. Yellowstone cutthroat listing petition, supplemental comments. Idaho Department of Fish and Game, Boise.
Meyer, K.A., D.J. Schill, F.S. Elle, W.C. Schrader, and J.A. Lamansky, Jr. 2001. Native species investigations. Idaho Department of Fish and Game, Report Number 01-45, Grant F-73-R-13, Boise.
Meyer, K.A., D.J. Schill, F.S. Elle, and W.C. Schrader. 2003. A long-term comparison of Yellowstone cutthroat trout abundance and size structure in their historical range in Idaho. North American Journal of Fisheries Management 23:149-162.
Montana Department of Fish, Wildlife, and Parks. 1994. MARKRECAPTURE: A software package for fishery population estimates. Montana Department of Fish, Wildlife, and Parks, Helena.
Moore, V., and D. Schill. 1984. South Fork Snake River fisheries investigations. Idaho
Department of Fish and Game, Job Completion Report, Project F-73-R-5, Boise. Schill, D.J. 1992. Statewide data summary. Idaho Department of Fish and Game, Wild Trout
Investigations Job Performance Report, Project F-73-R-13, Boise. Schrader, W.C., J. Dillon, and M. Gamblin. 2003. Regional fisheries management
investigations. Idaho Department of Fish and Game, 1996 Job Performance Report, Project F-71-R-21, Boise.
Zar, J.H. 1984. Biostatistical analysis, 2nd edition. Prentice-Hall, Englewood Cliffs, New
Jersey.

41
APPENDICES
42
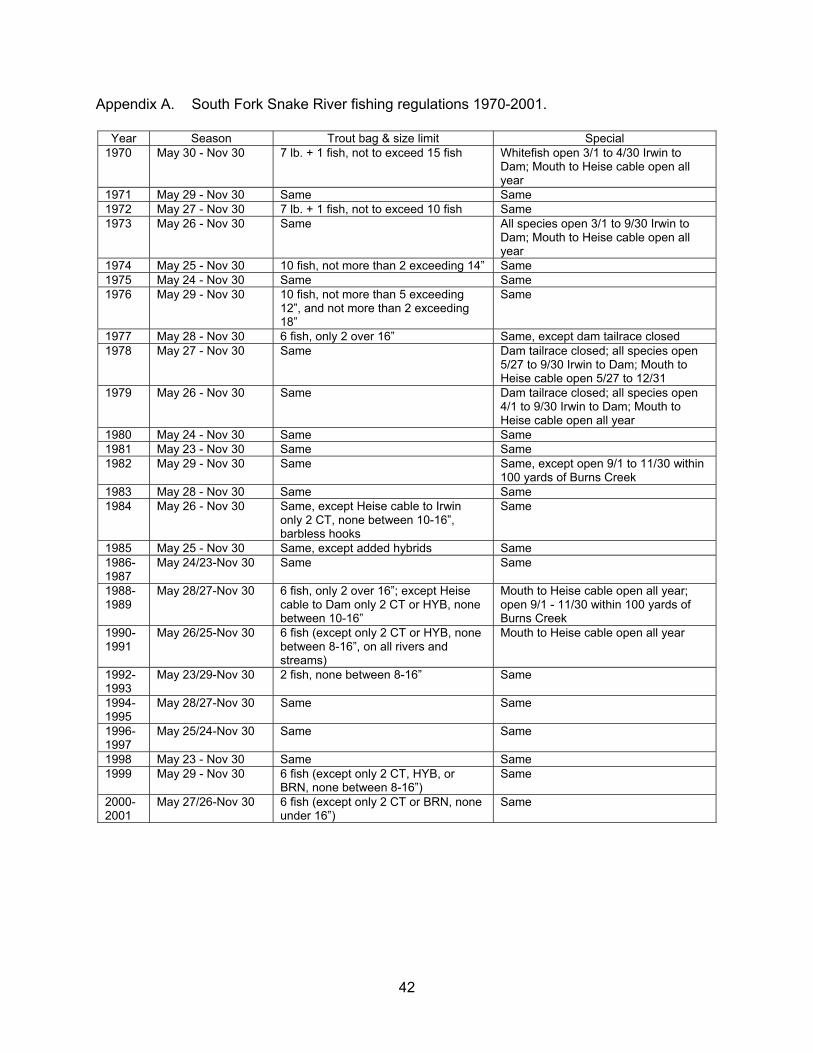
Appendix A. South Fork Snake River fishing regulations 1970-2001.
Year Season Trout bag & size limit Special 1970 May 30 - Nov 30 7 lb. + 1 fish, not to exceed 15 fish Whitefish open 3/1 to 4/30 Irwin to
Dam; Mouth to Heise cable open all year
1971 May 29 - Nov 30 Same Same 1972 May 27 - Nov 30 7 lb. + 1 fish, not to exceed 10 fish Same 1973 May 26 - Nov 30 Same All species open 3/1 to 9/30 Irwin to
Dam; Mouth to Heise cable open all year
1974 May 25 - Nov 30 10 fish, not more than 2 exceeding 14” Same 1975 May 24 - Nov 30 Same Same 1976 May 29 - Nov 30 10 fish, not more than 5 exceeding
12”, and not more than 2 exceeding 18”
Same
1977 May 28 - Nov 30 6 fish, only 2 over 16” Same, except dam tailrace closed 1978 May 27 - Nov 30 Same Dam tailrace closed; all species open
5/27 to 9/30 Irwin to Dam; Mouth to Heise cable open 5/27 to 12/31
1979 May 26 - Nov 30 Same Dam tailrace closed; all species open 4/1 to 9/30 Irwin to Dam; Mouth to Heise cable open all year
1980 May 24 - Nov 30 Same Same 1981 May 23 - Nov 30 Same Same 1982 May 29 - Nov 30 Same Same, except open 9/1 to 11/30 within
100 yards of Burns Creek 1983 May 28 - Nov 30 Same Same 1984 May 26 - Nov 30 Same, except Heise cable to Irwin
only 2 CT, none between 10-16”, barbless hooks
Same
1985 May 25 - Nov 30 Same, except added hybrids Same 1986- 1987
May 24/23-Nov 30 Same Same
1988- 1989
May 28/27-Nov 30 6 fish, only 2 over 16”; except Heise cable to Dam only 2 CT or HYB, none between 10-16”
Mouth to Heise cable open all year; open 9/1 - 11/30 within 100 yards of Burns Creek
1990- 1991
May 26/25-Nov 30 6 fish (except only 2 CT or HYB, none between 8-16”, on all rivers and streams)
Mouth to Heise cable open all year
1992- 1993
May 23/29-Nov 30 2 fish, none between 8-16” Same
1994- 1995
May 28/27-Nov 30 Same Same
1996- 1997
May 25/24-Nov 30 Same Same
1998 May 23 - Nov 30 Same Same 1999 May 29 - Nov 30 6 fish (except only 2 CT, HYB, or
BRN, none between 8-16”) Same
2000- 2001
May 27/26-Nov 30 6 fish (except only 2 CT or BRN, none under 16”)
Same

43
Appendix B. Sampling dates, flows, and catch rates at the Conant electrofishing section, South Fork Snake River, 1986-2000. Flows were recorded at the USGS Irwin gage. Catch rate results are from the MR5 database for all sizes of fish.
Sampling dates Range of flows
(m3/s) Range of flows
(ft3/s) Mean flow
(m3/s) Catch rate (fish/day)a
11/4,5, 6, 7,20 1986 100.2-107.0 3,540-3,780 101.7 413 11/5,6 1987b,c 24.6-26.6 869-941 25.6 174 10/3,4,11 1988 102.0-105.0 3,600-3,710 103.4 630 10/18,19,27 1989 84.7-86.7 2,990-3,060 86.1 930 10/11,12,18 1990 98.8-104.5 3,490-3,690 100.8 1,292 10/7,8,15 1991 127.2-135.7 4,490-4,790 131.7 741 10/14 1992b 60.3 2,130 60.3 719 10/13,14,21,22 1993 74.2-108.2 2,620-3,820 90.9 481 10/7,11,14 1994b 34.5-69.1 1,220-2,440 52.4 368 10/5,6,12,13 1995 72.8-115.8 2,570-4,090 93.2 436 10/3,4,10,11 1996 106.5-107.3 3,760-3,790 106.9 472 10/16,17,23,27 1997d 69.7-99.1 2,460-3,500 84.4 851 10/7,8,14,15 1998 91.5-126.6 3,230-4,470 109.6 593 10/13,14,20,21 1999 101.1-118.1 3,570-4,170 109.6 763 10/19,26 2000b 87.8-95.2 3,100-3,360 91.5 602
a Includes recaptured fish; catch rate = (M+C)/number days sampled. b No recapture runs due to low flows. c Only 3.2 km of larger 4.9 km section was electrofished with drift boat. d Major habitat changes with spring runoff.
Appendix C. Sampling dates, flows, and catch rates at the Twin Bridges electrofishing section,
South Fork Snake River, 1989-2000. Flows were recorded at the USGS Lorenzo gage. Catch rate results are from the MR5 database for all sizes of fish.
Sampling dates Range of flows
(m3/s) Range of flows
(ft3/s) Mean flow (m3/s)
Catch rate (fish/day)a
9/26,27; 10/4, 1989 52.4-55.8 1,850-1,970 53.8 264 9/9,10,17,24, 1991 62.6-104.5 2,210-3,690 87.3 388 9/28,29; 10/4,5, 2000 b 54.4-62.0 1,920-2,190 56.8 448
a Includes recaptured fish; catch rate = (M+C)/number days sampled. b Major habitat changes with spring, 1997, runoff.
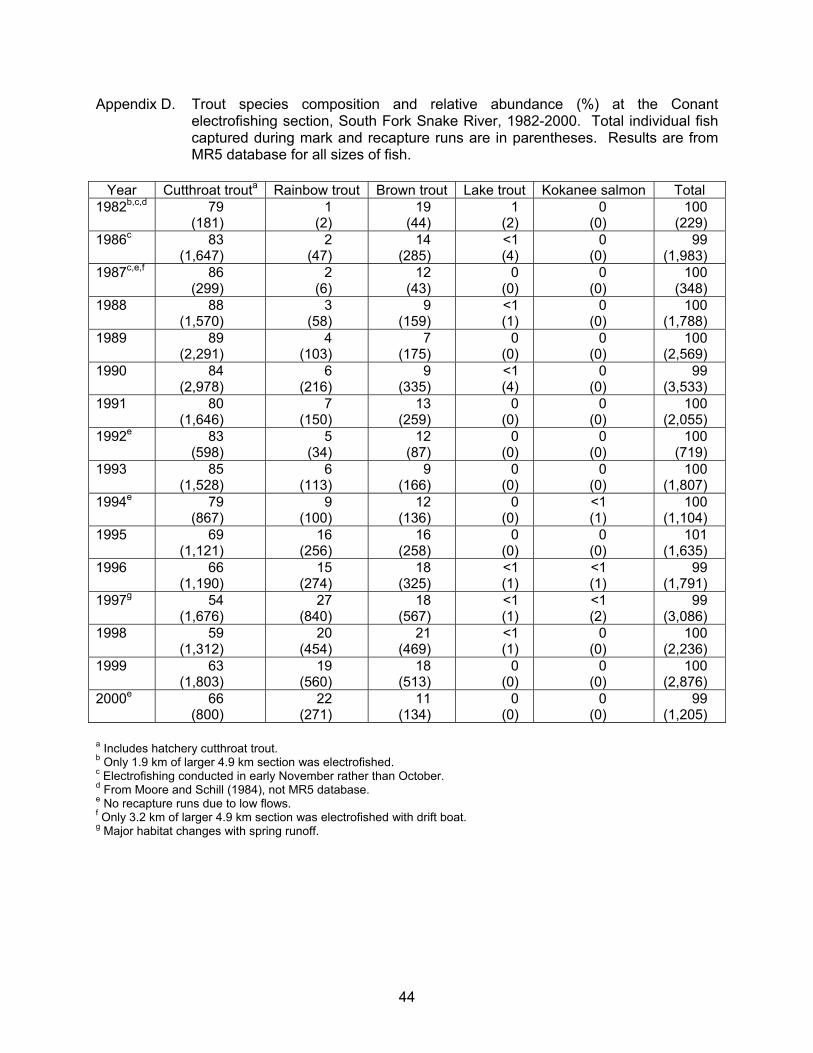
44
Appendix D. Trout species composition and relative abundance (%) at the Conant electrofishing section, South Fork Snake River, 1982-2000. Total individual fish captured during mark and recapture runs are in parentheses. Results are from MR5 database for all sizes of fish.
Year Cutthroat trouta Rainbow trout Brown trout Lake trout Kokanee salmon Total
1982b,c,d 79 (181)
1 (2)
19 (44)
1 (2)
0 (0)
100 (229)
1986c 83 (1,647)
2 (47)
14 (285)
<1 (4)
0 (0)
99 (1,983)
1987c,e,f 86 (299)
2 (6)
12 (43)
0 (0)
0 (0)
100 (348)
1988 88 (1,570)
3 (58)
9 (159)
<1 (1)
0 (0)
100 (1,788)
1989 89 (2,291)
4 (103)
7 (175)
0 (0)
0 (0)
100 (2,569)
1990 84 (2,978)
6 (216)
9 (335)
<1 (4)
0 (0)
99 (3,533)
1991 80 (1,646)
7 (150)
13 (259)
0 (0)
0 (0)
100 (2,055)
1992e 83 (598)
5 (34)
12 (87)
0 (0)
0 (0)
100 (719)
1993 85 (1,528)
6 (113)
9 (166)
0 (0)
0 (0)
100 (1,807)
1994e 79 (867)
9 (100)
12 (136)
0 (0)
<1 (1)
100 (1,104)
1995 69 (1,121)
16 (256)
16 (258)
0 (0)
0 (0)
101 (1,635)
1996 66 (1,190)
15 (274)
18 (325)
<1 (1)
<1 (1)
99 (1,791)
1997g 54 (1,676)
27 (840)
18 (567)
<1 (1)
<1 (2)
99 (3,086)
1998 59 (1,312)
20 (454)
21 (469)
<1 (1)
0 (0)
100 (2,236)
1999 63 (1,803)
19 (560)
18 (513)
0 (0)
0 (0)
100 (2,876)
2000e 66 (800)
22 (271)
11 (134)
0 (0)
0 (0)
99 (1,205)
a Includes hatchery cutthroat trout. b Only 1.9 km of larger 4.9 km section was electrofished. c Electrofishing conducted in early November rather than October. d From Moore and Schill (1984), not MR5 database. e No recapture runs due to low flows. f Only 3.2 km of larger 4.9 km section was electrofished with drift boat. g Major habitat changes with spring runoff.

45
Appendix E. Mean total length and quality stock density (QSD) of trout captured at the Conant electrofishing section, South Fork Snake River, 1986-2000. Total individual fish captured during mark and recapture runs equals n. QSD = (number >406 mm/number >203 mm) x 100. Results are from MR5 database for all sizes of fish.
Cutthroat trouta Rainbow trout Brown trout All troutb
Year n Mean (mm)
QSD (%) n
Mean(mm)
QSD (%) n
Mean(mm)
QSD (%) n
Mean(mm)
QSD(%)
1986c 1,647 330 8.5 47 307 11.4 285 338 29.0 1,983 330 11.51987c,d,e 299 297 14.9 6 262 0.0 43 249 11.5 348 292 14.31988 1,570 338 5.6 58 328 12.3 159 310 22.8 1,788 335 7.31989 2,291 353 8.8 103 323 19.6 175 343 38.5 2,569 351 11.21990 2,978 320 8.4 216 269 13.3 335 267 20.4 3,533 310 9.71991 1,646 333 11.2 150 251 6.6 259 274 14.1 2,055 320 11.31992d 598 333 9.0 34 282 2.9 87 264 6.6 719 323 8.41993 1,528 351 15.3 113 340 18.2 166 330 34.2 1,807 348 17.21994d 867 297 11.2 100 251 13.4 136 236 7.4 1,104 287 10.91995 1,121 351 21.2 256 277 10.6 258 287 15.8 1,635 328 18.71996 1,190 310 8.7 274 262 6.6 325 284 12.7 1,791 297 9.21997f 1,676 292 4.5 840 262 4.3 567 274 12.5 3,086 279 6.01998 1,312 295 4.8 454 318 13.3 469 279 8.4 2,236 297 7.41999 1,803 310 2.6 560 312 11.6 513 292 9.1 2,876 307 5.52000d 800 315 2.3 271 307 13.8 134 312 12.8 1,205 313 6.0
a Includes hatchery cutthroat trout. b Includes lake trout and kokanee salmon. c Electrofishing conducted in early November rather than October. d No recapture runs due to low flows. e Only 3.2 km of larger 4.9 km section was electrofished with drift boat. f Major habitat changes with spring runoff.

46
Appendix F. Electrofishing statistics for the Conant section, South Fork Snake River, 1986-2000. Results are from MR5 database for all sizes of fish.
Cutthroat trouta Rainbow trout Brown trout All troutb
Year
Mc
Cc
Rc
R/C
(%)
M
C
R
R/C
(%)
M
C
R
R/C
(%)
M
C
R
R/C
(%)
1986d 1,171 546 70 13 32 17 2 12 186 107 8 7 1,393 670 80 12
1987d,e,f 299 NDg ND ND 6 ND ND ND 43 ND ND ND 348 ND ND ND
1988 1,101 567 98 17 41 18 1 6 115 48 4 8 1,257 634 103 16
1989 1,424 1,067 200 19 58 55 10 18 107 79 11 14 1,589 1,201 221 18
1990 1,768 1,527 317 21 118 112 14 12 213 134 12 9 2,102 1,774 343 19
1991 1,159 627 140 22 105 54 9 17 158 120 19 16 1,422 801 168 21
1992e 598 ND ND ND 34 ND ND ND 87 ND ND ND 719 ND ND ND
1993 998 630 100 16 78 41 6 15 110 66 10 15 1,186 737 116 16
1994e 867 ND ND ND 100 ND ND ND 136 ND ND ND 1,104 ND ND ND
1995 633 565 77 14 130 143 17 12 154 117 13 11 917 825 107 13
1996 714 548 72 13 165 114 5 4 216 127 18 18 1,097 789 95 12
1997h 914 926 164 18 436 476 72 15 352 298 83 28 1,703 1,702 319 19
1998 679 694 61 9 221 259 26 10 276 242 49 20 1,176 1,196 136 11
1999 1,021 899 117 13 347 242 29 12 297 247 31 13 1,665 1,388 177 13
2000e 800 ND ND ND 271 ND ND ND 134 ND ND ND 1,205 ND ND ND
a Includes hatchery cutthroat trout. b Includes lake trout and kokanee salmon. c M=number of fish marked on marking run; C=total number of fish captured on recapture run; R=number of recaptured fish on recapture run. d Electrofishing conducted in early November rather than October. e No recapture runs due to low flows. f Only 3.2 km of larger 4.9 km section was electrofished with drift boat. g ND = no data; no recapture runs. h Major habitat changes with spring runoff.
46

47
Appendix G. Estimated abundance (N) of age-1 and older cutthroat trout (>102 mm), rainbow trout (>102 mm), brown trout (>152 mm), and all trout (>102 mm) at the Conant electrofishing section, South Fork Snake River, 1986-2000. Results are from MR5 database and analysis using the log-likelihood estimator. Standard deviations are in parentheses.
First Cutthroat trouta Rainbow trout Brown trout All troutb
marking date N/section N/km N/section N/km N/section N/km N/section N/km 11/4/86 14,161
(1,005) 2,890 NUEc NUE 3,142
(632)641 13,935
(608)2,844
11/5/87 NEd NE NE NE NE NE NE NE
10/3/88 7,306 (370)
1,491 NUE NUE 1,652(776)
337 9,005(434)
1,838
10/18/89 7,860 (269)
1,604 310(65)
63 936(405)
191 8,788(262)
1,793
10/11/90 11,416 (432)
2,330 1,004(161)
205 1,806(331)
369 14,633(435)
2,986
10/7/91 6,854 (340)
1,399 657(135)
134 954(129)
195 7,920(287)
1,616
10/14/92 NE NE NE NE NE NE NE NE
10/13/93 7,364 (374)
1,503 538(127)
110 663(194)
135 8,058(324)
1,644
10/7/94 NE NE NE NE NE NE NE NE
10/5/95 6,029 (367)
1,230 1,326(181)
271 1,442(440)
294 8,349(391)
1,704
10/3/96 7,361 (562)
1,502 2,982e
(1,076)609e 1,538
(196)314 11,233
(640)2,292
10/16/97f 5,609 (190)
1,145 3,037(183)
620 1,809(507)
369 9,659(234)
1,971
10/7/98 8,286 (510)
1,691 2,257(196)
461 1,189(90)
243 10,770(389)
2,198
10/13/99 9,051 (407)
1,847 3,207(317)
654 2,508(423)
512 13,873(443)
2,831
10/19/00 NE NE NE NE NE NE NE NE
a Includes hatchery cutthroat trout. b Includes lake trout and kokanee salmon. c NUE = no unbiased estimate possible as R < 3 (Ricker 1975). d NE = no estimate; recapture runs not made. e Modified Peterson rather than log-likelihood estimate. f Major habitat changes with spring runoff.
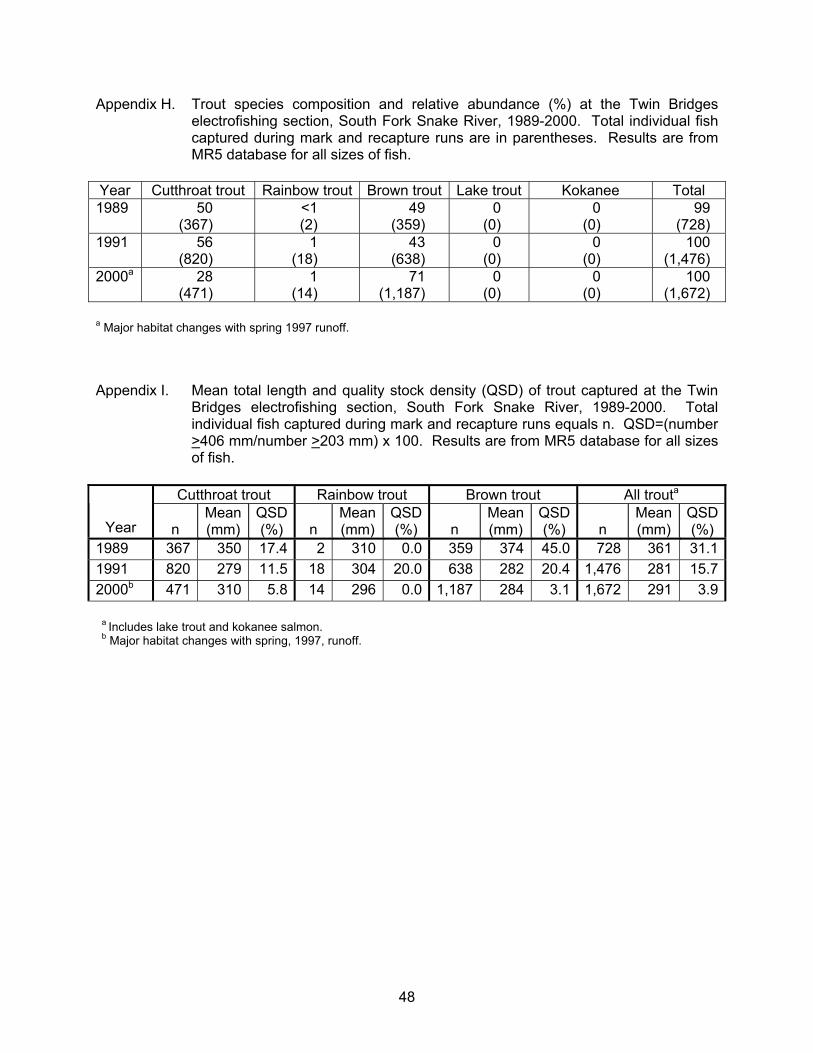
48
Appendix H. Trout species composition and relative abundance (%) at the Twin Bridges electrofishing section, South Fork Snake River, 1989-2000. Total individual fish captured during mark and recapture runs are in parentheses. Results are from MR5 database for all sizes of fish.
Year Cutthroat trout Rainbow trout Brown trout Lake trout Kokanee Total 1989 50
(367) <1 (2)
49 (359)
0 (0)
0 (0)
99 (728)
1991 56 (820)
1 (18)
43 (638)
0 (0)
0 (0)
100 (1,476)
2000a 28 (471)
1 (14)
71 (1,187)
0 (0)
0 (0)
100 (1,672)
a Major habitat changes with spring 1997 runoff. Appendix I. Mean total length and quality stock density (QSD) of trout captured at the Twin
Bridges electrofishing section, South Fork Snake River, 1989-2000. Total individual fish captured during mark and recapture runs equals n. QSD=(number >406 mm/number >203 mm) x 100. Results are from MR5 database for all sizes of fish.
Cutthroat trout Rainbow trout Brown trout All trouta
Year n Mean (mm)
QSD (%) n
Mean(mm)
QSD(%) n
Mean(mm)
QSD(%) n
Mean(mm)
QSD(%)
1989 367 350 17.4 2 310 0.0 359 374 45.0 728 361 31.11991 820 279 11.5 18 304 20.0 638 282 20.4 1,476 281 15.72000b 471 310 5.8 14 296 0.0 1,187 284 3.1 1,672 291 3.9
a Includes lake trout and kokanee salmon. b Major habitat changes with spring, 1997, runoff.

49
Appendix J. Electrofishing statistics for the Twin Bridges section, South Fork Snake River, 1989-2000. Results are from MR5 database for all sizes of fish.
Cutthroat trout Rainbow trout Brown trout All trouta
Year
Mb
Cb
Rb
R/C
(%)
M
C
R
R/C
(%)
M
C
R
R/C
(%)
M
C
R
R/C
(%)
1989 250 146 29 20 2 1 1 100 276 117 34 29 528 264 64 24
1991 527 331 38 11 11 8 1 12 329 346 37 11 867 685 76 11
2000c 261 246 36 15 6 11 3 27 680 587 80 14 947 844 119 14
a Includes lake trout and kokanee salmon. b M=number of fish marked on marking run; C=total number of fish captured on recapture run; R=number of recaptured fish on recapture run. c Major habitat changes with spring, 1997, runoff.
49

50
Appendix K. Estimated abundance (N) of age-1 and older cutthroat trout (>102 mm), rainbow trout (>102 mm), brown trout (>152 mm), and all trout (>102 mm) at the Twin Bridges electrofishing section, South Fork Snake River, 1989-2000. Results are from MR5 database and analysis using the log-likelihood estimator. Standard deviations are in parentheses.
First Cutthroat trout Rainbow trout Brown trout All trouta
marking date N/section N/km N/section N/km N/section N/km N/section N/km 9/26/89 1,665
(210) 574 NUEb NUE 994
(72)343 2,476
(134)854
9/9/91 6,151 (539)
2,121 NUE NUE 3,013(356)
1,039 8,566(413)
2,954
9/28/00d 1,896 (130)
654 NUE NUE 5,279(277)
1,820 7,260(292)
2,503
a Includes lake trout and kokanee salmon. b NUE = no unbiased estimate possible as R < 3 (Ricker 1975). c Modified Peterson rather than log-likelihood estimate. d Major habitat changes with spring, 1997, runoff.

51
2000 ANNUAL PERFORMANCE REPORT State of: Idaho Program: Fisheries Management F-71-R-25 Project II: Technical Guidance Subproject II-G: Upper Snake Region Contract Period: July 1 2000 to June 30 2001
ABSTRACT
Technical guidance was provided to federal, state, county, municipal, and private agencies and entities upon request. Technical guidance was also provided to organized sportsmen's groups, conservation organizations, and private citizens in the form of fish pond development, stocking and management advice, funding requests and project feasibility opinions, and various conservation and educational programs.
Upper Snake Region fisheries management staff provided technical assistance and guidance to the following government agency and private groups: Bingham County Idaho Department of Parks and Recreation Henrys Fork Foundation Idaho Department of Water Resources Island Park Sportsmen Association Idaho Department of Lands Sheridan Creek Restoration Committee U.S. Bureau of Reclamation Henry’s Fork Watershed Council (HFWC) Idaho Water Resource Board Henry’s Fork Foundation Eagle Rock Bass Masters Upper Snake River Fly Fishers City of Idaho Falls Snake River Cutthroats (TU chapter) Teton Regional Land Trust U.S. Fish and Wildlife Service Wyoming Game and Fish Department Jackson National Fish Hatchery Idaho National Environmental and Engineering Lab U.S. Forest Service Bonneville County U.S. Bureau of Land Management Fremont County City of Rexburg Henrys Lake Foundation North Fork Reservoir Company Idaho Division of Environmental Quality Palisades Creek Canal Company U.S. Natural Resources Conservation Service South Fork Watershed Advisory Group One Fly Committee Fall River Rural Electric Cooperative PacifiCorp The Nature Conservancy Idaho Fish and Wildlife Foundation HFWC Water Quality Subcommittee Southwest Flyfishers Boise Valley Fly Fishers Ted Trueblood Chapter Trout Unlimited Region 6 Wildlife Council HFWC Native Trout Sub-Committee

52
Staff responded to numerous requests for technical assistance and permit processing by private pond owners. Particular attention was given to private pond permit applications in the South Fork Snake River, Willow Creek, Teton River and Henrys Lake watersheds, where native Yellowstone cutthroat trout Oncorhynchus clarki bouvieri management goals might conflict with private requests to stock rainbow trout O. mykiss in those watersheds. Author: Mark Gamblin Regional Fisheries Manager
53
2000 ANNUAL PERFORMANCE REPORT State of: Idaho Program: Fisheries Management F-71-R-25
Project: III - Habitat Management Subproject: I-G Upper Snake Region Contract Period: July 1 2000 to June 30 2001 ABSTRACT The South Fork Snake River tributary weir and diversion screen projects have been under development since 1997. The objectives are to: 1) minimize entrainment of downstream migrating trout into the irrigation diversions; 2) provide adequate upstream fish passage through the diversion/fish weir structure; and 3) serve as a fish trapping facility to manage spawning escapement from the South Fork Snake River to Palisades Creek and minimize rainbow trout Oncorhynchus mykiss x cutthroat trout O. clarki introgression. The Palisades Creek irrigation and fish weir trapping facility was completed during 2000. However, the facility was not utilized during the 2000 spawning season. Improvements to the Rainey Creek weir site include floating, inclined plane weir panels and an upstream trash rack, which were installed in October 2000. With this final improvement, the Rainey Creek diversion is now complete and meets the outlined objectives. Construction of the Burns Creek fish trapping facility was started and completed during the fall of 2000. This facility, along with the other two facilities will begin operation in the spring of 2001. Author: Mark Gamblin Regional Fisheries Manager

54
OBJECTIVES
1. Work with landowners to improve/restore habitat on degraded streams on private property with good potential to enhance wild trout recruitment.
2. Provide upstream and downstream fish passage in key wild trout spawning and
recruitment streams.
2000 ACTIVITIES
Henrys Lake
The Henrys Lake tributary riparian fence and fish screen project operated without
significant problems in 2000. Several fish screens have been scheduled for maintenance or repair over the next several years.
South Fork Snake River Tributaries Palisades Creek
The fish screen on the Palisades Canal was operated and maintained in 2000. The Palisades Creek irrigation and fish weir trapping facility was completed during 2000. However, the facility was not utilized during the 2000 spawning season. Rainey Creek
The Rainey Creek diversion and fish ladder was operated in 2000 to provide fish passage over the diversion structure with the newly completed fish ladder. Improvements to the Rainey Creek weir site include floating, inclined plane weir panels and an upstream trash rack, which were installed in October 2000. Burns Creek
Construction of the Burns Creek fish trapping facility was started and completed during the fall of 2000. This facility will ensure irrigation water delivery and provide for fish passage and fish trapping capability at that site. This facility, along with the other two facilities will begin operation in the spring of 2001.

55
Willow Creek Tributaries Sellars Creek
The Sellars Creek fence was operated to improve and maintain riparian habitat on Sellars Creek.

56
2000 ANNUAL PERFORMANCE REPORT State of: Idaho Program: Fisheries Management F-71-R-25
Project: IV – Lake Restoration Subproject: I-G Upper Snake Region Job: Population Management Title: Lake Restoration Contract Period: July 1 2000 to June 30 2001
ABSTRACT
The Thurmon Creek drainage fish renovation project was implemented for a second time during October 2000. The 1999 Fintrol application appeared to be ineffective in spring and backwater areas common in the drainage, particularly on Middle Thurmon Creek and Golden Lake. Treatment included a combination of antimycin, liquid rotenone, and rotenone sand. Tributaries were treated with a combination of Fintrol drip stations (15µg/L), rotenone sand, and backpack sprayers with liquid rotenone. The lake perimeter was treated with liquid rotenone (3 mg/L) applied with an airboat. Rotenone sand was also applied to vegetated areas around the perimeter. The main body of the lake was then treated with Fintrol (15 µg/L), again applied by airboat. Mortalities were observed in all tributaries, with only a handful observed in the lake. No attempt was made to quantify mortalities. Throughout the 2000 treatment, there were no observed mortalities in live cage fish held downstream from the permanganate station. A comprehensive assessment will occur in spring 2001, prior to Yellowstone cutthroat trout Oncorhynchus clarki bouvieri reintroduction. A completed project report is included in Appendix A. Authors: Jeff Dillon Regional Fisheries Biologist Mark Gamblin Regional Fisheries Manager

57
INTRODUCTION AND METHODS
From late June through early August 2000, the Thurmon Creek drainage was sampled with backpack electrofishing gear to assess the effectiveness of the 1999 chemical renovation of Golden Lake and the Thurmon Creek drainage. This renovation was intended to remove undesirable trout species (rainbow trout Oncorhynchus mykiss and brook trout Salvelinus fontinalis) prior to reintroduction of Yellowstone cutthroat trout O. clarki bouvieri. Data collected during these surveys indicated the initial application of antimycin was unsuccessful, as over 700 brook trout were collected in Middle Thurmon Creek. The majority of these fish would have been young-of-the-year (YOY) during the initial treatment phase in 1999. Additional chemical treatments (antimycin in combination with rotenone) of the Thurmon Creek assemblage were applied during early October 2000. Drip stations were established on all tributaries to the lake (dispensing 15 µg/L Fintrol antimycin), and combined with the use of rotenone sand. Additional antimycin was applied to the lake with an airboat at the rate of 15 µg/L in combination with liquid rotenone applied at 3 mg/L. A detoxification drip station was established directly downstream from the dam, dispensing 4 mg/L of potassium permanganate.
RESULTS AND DISCUSSION Fish mortalities were observed in all tributaries to Golden Lake, while only a handful of
mortalities were observed in the lake. No attempts were made to quantify mortalities, as the 1999 treatment removed the bulk of fish in the Thurmon Creek drainage. Additionally, there were no observed mortalities from fish held in live cages below the detoxification station, or downstream from the 2000 activities. A detailed analysis of this project is presented in Appendix A.
RECOMMENDATIONS
1. Assess effects of the 2000 chemical renovation of Thurmon Creek prior to reintroduction of Yellowstone cutthroat trout.

58
APPENDIX A
FINAL REPORT
1999 and 2000 Thurmon Creek / Golden Lake Renovation
Jeff Dillon, Regional Fishery Biologist Mark Gamblin, Regional Fishery Manager
BACKGROUND
In 1997, the Native Trout Subcommittee of the Henrys Fork Watershed Council began work to identify and prioritize waters in the upper Snake River where Yellowstone cutthroat trout Oncorhynchus clarki bouvieri populations could be enhanced or reintroduced. The committee identified Thurmon Creek and Golden Lake, within the Harriman State Park and wildlife sanctuary, as a possible site for reintroduction. Non-native rainbow trout O. mykiss and brook trout Salvelinus fontinalis were the only trout species present in the drainage at that time, and no angling is permitted in the drainage. Because in most cases Yellowstone cutthroat trout do not persist over time with rainbow and brook trout populations, near-complete eradication of the existing fish community was considered necessary prior to reintroducing cutthroat trout.
TREATMENT AREA The headwaters of Thurmon Creek originate at the base of Thurmon Ridge north and west of Harriman State Park (Figure 1). Three separate spring complexes give rise to West, Middle, and East Thurmon creeks. West and Middle Thurmon creeks flow directly into Golden Lake. A small, unnamed spring complex to the southwest also flows directly into the lake. An irrigation diversion just above the mouth of Middle Thurmon Creek is currently inoperable. East Thurmon Creek is completely diverted into an irrigation canal near the lake. The canal follows the east shore of the lake, and is connected to the lake only by a culvert near the dam. When Golden Lake is full, virtually all of the East Thurmon Creek flow remains in the canal and is used for pasture irrigation and stock watering on Harriman State Park. During spring runoff, water in the canal can reach and flow into the Henrys Fork. Golden Lake covers approximately 54 acres at full pool, with a maximum depth of less than 10 ft. Volume at full pool is about 180 acre-feet. Dense aquatic vegetation is present throughout the lake. Below Golden Lake, Thurmon Creek flows approximately two miles into Silver Lake, which drains into the Henrys Fork. The entire Golden Lake – Thurmon Creek drainage lies within the Harriman Wildlife Sanctuary and no angling is permitted.

59
East T
hurm
on C
reek
Coyo
te Gulc
h
Middle Thurm
on Cr.
West Thurmon Creek
Golden Lake
Thurmon Cr.
Sillver Lake
Canal
Canal
1 0 1 Miles
N
EW
S
Henrys Fork
Figure 1 Map of Golden Lake, Thurman creeks and Silver Lake, Idaho.

60
Although Yellowstone cutthroat trout were the only trout native to the drainage, they have likely been absent for at least 50 years. In addition to rainbow and brook trout, the fish community prior to treatment included what are assumed to be native redside shiner Richardsonius balteatus, long nosed dace Rhinichthys cataractae, and sculpin Cottus spp. Introduced Utah chub Gila atraria were present in Golden Lake, but low in abundance. In late summer and early fall, brook trout and sculpin were the predominant species in tributaries, while all species were present in the lake.
Target Fish Species Rainbow and brook trout were the species specifically targeted for removal. Additional
non-target species expected to succumb were longnose dace, redside shiner, Utah chub, and sculpin. No estimate of biomass or number of fish killed was made. Native non-target species will be reintroduced to the treated drainage in addition to Yellowstone cutthroat trout.
Pre-Treatment Preparations
In late summer and fall of 1998, we collected flow and water chemistry data throughout the drainage. We measured flows (cfs) in each spring source and in the mainstem of each tributary. We estimated travel time for water from each spring source to the lake by adding fluoroscene dye and following its progression downstream. We used a digital meter to measure pH in the mainstem of each tributary and the Golden Lake outflow, and measured temperatures at the spring source for each. To assure an accurate estimate of the elevation-volume relationship for Golden Lake, we contracted calculations out to the engineering firm that had constructed a morphometric map for the lake in 1992. We were provided estimates of volume at one-foot intervals in elevation, and used these data to calculate chemical application rates for the lake treatment. To prevent non-native fish from re-colonizing the drainage after the treatment, we designed and installed permanent fish barriers on the three outlets on Golden Lake dam, and one barrier in the east Thurmon Creek canal approximately 400 m downstream of the dam. All barriers were self-cleaning grates constructed with ¾-inch steel pipe with ½-inch gaps between pipes.
1999 TREATMENT
Drawdown and Fish Salvage Three weeks prior to the treatment, Golden Lake was drawn down approximately three
feet to kill aquatic vegetation around the periphery. The lake was then filled again and allowed to spill over the spillway for several days to flush vegetation. Immediately prior to the treatment the lake was again drawn down to approximately 30-35 surface acres and 75 acre-feet. This
61
level is below normal spillway height and the only discharge from the dam was through a gated culvert approximately 50 ft east of the spillway.
To minimize risks to non-target fish outside the treatment area, we installed a temporary picket weir approximately one mile below Golden Lake dam, and salvaged fish in Thurmon Creek between the dam and the weir. We used two backpack shockers and a crew of 12 to 15 volunteers. A total of 40 to 50 adult rainbow and brook trout and over 1,000 juvenile trout were hauled to the Henrys Fork and released. Immediately prior to the treatment, Department and volunteer crews used a drift boat electrofisher in Golden Lake to salvage approximately 170 adult rainbow and brook trout and relocate them to the Henrys Fork.
Discharge Detoxification
We constructed a detoxification station below the Golden Lake dam spillway to neutralize any antimycin that flowed out of the lake. Potassium permanganate (KMnO4) was metered into the outlet with an electric hopper. The KmnO4 was put into solution with water and pumped into a perforated pipe suspended above the stream. Target application rate was 2ppm, which equated to 3.5 g/min of KmnO4 per cfs of stream flow. Two backup detoxification stations (30-gal drums filled with concentrated KmnO4 solution) were prepared, one just downstream from the hopper and one at the picket weir site.
Antimycin Treatment and Detoxification Tributary and lake treatments took place on October 5, with a crew of 22 assisting. All personnel were assigned a specific task for the treatment. Personal safety equipment (chemical gloves, goggles, respirators, Tyvek suits) was provided for any crewmember applying or in the vicinity of antimycin. To monitor effectiveness of the treatment, small live cages containing 3-5 hatchery rainbow trout were placed at the lower end of each tributary, at two sites in the lake, and in the spillway above the detoxification station. Live cages were retrieved 4-6 hours after the treatment started. Another live cage was placed downstream at the picket weir. These fish were inspected periodically throughout the duration of the treatment. Before treatments began the gated culvert on the dam was closed, allowing virtually no flow (<1 cfs) past the dam.
Tributary treatments began at 0900 hrs. Target application rate and duration for antimycin in tributaries was 15ppb for 3-4 hrs. We built constant-rate drip stations using standard plastic oil pans and plastic 5-gal buckets. Each bucket was notched with a one-inch hole in the top lip, and three ½-inch diameter holes were drilled approximately one inch below the notch. We drilled one 1/16-inch hole in the bottom edge of the oil pan. The bucket was then filled with 4 gallons of water and the prescribed amount of antimycin solution. The oil pan was placed on top of the bucket, and the whole apparatus inverted and placed on a platform above the stream. This provided a relatively constant flow through the 1/16-inch hole, which lasted approximately 3.0-3.5 hr. Antimycin concentration was adjusted for each tributary site based on stream flow at that site. We used a simple formula to calculate volume of stock antimycin

62
solution (10% concentration) to add to each bucket at each site to achieve a constant 15ppb application.
Volume antimycin (ml) = 15.1 x flow (cfs) x time (hrs)
Preliminary bioassays on East Thurmon Creek indicated that duration of toxicity in the
tributaries was approximately 2.5 hrs. Drip stations were spaced along each tributary so that water travel time between stations did not exceed 1.5 hours. Start time of each drip station was staggered so that the antimycin–treated water from each tributary entered the lake at approximately the same time. Total antimycin application for each tributary is provided in Table 1.
Table 1. Characteristics of Golden Lake tributaries, and October 1999 Fintrol treatment
protocols for each.
Tributary
Number of
primary springs
Total flow (cfs)
pH in mainstem
Number of Fintrol
drip stations
Total volume (pints)
of Fintrol used West Thurmon 5 13.5 8.4 7 3.2
Middle Thurmon 3 8.0 8.0 5 2.0
East Thurmon 2 5.0 8.2 6 2.7
In all visible seeps, springs, and backwaters not treatable with drip stations, antimycin
was applied using backpack pesticide sprayers filled with concentrated solution (10ppm). Personnel were instructed to spray each seep or spring three times over a period of three hours.
Lake application began at 1200 hrs, the time at which treated tributary water first
reached the lake. The target application rate in Golden Lake was 10 ppb antimycin. Because the lake was so shallow after the drawdown, conventional boat operation was impossible. We contracted with an airboat operator to treat the lake with an airboat rigged with boom sprayers. A total of 20 pints of 10% stock solution was diluted with water and applied to the lake surface.
We began operating the detoxification system below the spillway at 1200 hrs. We
estimated outflow to be <1cfs, and calibrated the KMnO4 hopper accordingly. Discharge from the dam remained at 1-2 cfs for over 12 hrs, at which time water levels reached the spillway and flow below the dam gradually increased. We continued to monitor flows and adjust KMnO4 application for 48 hrs post-treatment.
63
Post-treatment Sampling On October 14, 1999 we set two experimental mesh gill nets in Golden Lake. Nets were each fished for four hours. On November 17-19, Henrys Fork Foundation (HFF) crews made a total of four overnight net-sets. On November 30, HFF crews used backpack electrofishing gear to sample a total of approximately 2.5 stream miles in West, Middle, and East Thurmon creeks. From June 21 to August 9, 2000 we sampled the entire length of each tributary with backpack electrofishing gear.
RESULTS AND DISCUSSION
Antimycin Treatment and Detoxification Tributary and lake applications proceeded as planned, with few complications. Use of the airboat in the lake did produce high turbidity, particularly in the very shallow west end of the lake. Caps on some of the backpack sprayers leaked and had to be repaired. Consequently, some small seeps and springs did not receive the complete treatment protocol during the prescribed time frame. Most were sprayed at least twice.
Dead and dying fish were observed in the tributaries shortly after treatments began. All live cage fish near the mouths of tributaries were dead when live cages were recovered at approximately 1800 hours. Live cage fish in the lake were also dead. Live fish were observed in the lake up to 48 hours after the treatment, but all appeared to be suffering ill effects from antimycin exposure. Live cage fish below the dam were also ill but alive up to 48 hours post-treatment.
The detoxification station below the spillway was in operation for 48 hours. Prior to the
lake refilling and spilling, no dead or dying fish were observed in the stream below the dam. The live cage fish at the weir were dewatered when the dam discharge was stopped during the lake treatment. These fish died, but there were no other dead or dying fish in the vicinity.
Post-treatment Sampling Fall 1999 gillnetting effort in Golden Lake totaled over 78 net-hours with six sets. No fish were captured. Tributary electrofishing in 1999 yielded no fish in West or East Thurmon creeks. One brook trout (160 mm) was captured and removed from middle Thurmon Creek just above the diversion. Intensive tributary sampling in summer 2000 indicated few remaining fish in West Thurmon Creek (10 fish captured) and East Thurmon Creek (17 fish captured). In middle Thurmon Creek, however, over 700 brook trout were captured and removed. Almost all were yearlings (80 to 130 mm), indicating that Fintrol application in fall 1999 was not effective in removing age-0 brook trout.
64
We concluded that the 1999 Fintrol application greatly reduced brook and rainbow trout abundance in Golden Lake and in West and East Thurmon creeks. East and West Thurmon creeks originate in discrete spring complexes, and remain in discrete channels before entering Golden Lake. Few spring and seep areas are found on the lower ends of these tributaries. Fintrol treatment was unsuccessful in Middle Thurmon Creek, particularly for YOY brook trout. The lower ½-mile of Middle Thurmon Creek has extensive springs, seeps, and backwaters adjacent to the stream. Although these areas were treated 2-3 times each with backpack sprayers, we suspect that this Fintrol exposure was insufficient to kill fish. Because it was critical to remove as many potentially competing or hybridizing fish as possible prior to cutthroat reintroduction, it was decided to repeat the treatment, with some modifications, in fall of 2000.
2000 TREATMENT Because the 1999 Fintrol application appeared to be ineffective in spring and backwater areas common in the drainage, particularly on Middle Thurmon Creek, the 2000 treatment included a combination of Fintrol, liquid rotenone, and powdered rotenone. In September, flow, volume, and water chemistry data were collected to assure there were no significant differences from 1999 data (Tables 2 and 3). We increased the number of Fintrol drip stations on tributary mainstems.
Drawdown and Fish Salvage Prior to the 2000 treatment, fish were again salvaged below Golden Lake, and a temporary picket weir installed approximately ½-mile downstream. The lake was drawn down, filled, and flushed as in 1999, again leaving 75 acre-feet, or about 40% of full pool volume. No attempt was made to salvage the lake because few fish survived the first treatment. One fish barrier was repaired.
Chemical Application and Detoxification
East Thurmon Creek was treated on October 9, and remaining tributaries and Golden Lake were treated on October 11 (Tables 2 and 3). Both rotenone (liquid and powder) and Fintrol were used in the 2000 treatment. Powdered rotenone was used to formulate rotenone sand, using the directions in the AFS rotenone procedures manual. Tributaries were treated with a combination of Fintrol drip stations (15 ppb), rotenone sand, and backpack sprayers with liquid rotenone. The lake perimeter was treated with liquid rotenone (3 ppm) applied with an airboat. Rotenone sand was also applied to vegetated areas around the perimeter. The main body of the lake was then treated with Fintrol (15 ppb), again applied by airboat.

65
Table 2. Characteristics of tributaries to Golden Lake, and Fintrol and rotenone application rates used in the October, 2000 treatment.
Location
Treatment date
# of
primary springs
Stream length (km)
Dis-
charge (cfs)
Temperature (oC)
pH
Travel time headwaters
to lake (hr:min)
# of Fintrol
drip stations
Total volume Fintrol used
(pints)
Total rotenone powder
applied (lbs)
Total Nusyn-Noxfish
applied (gal)
East Thurmon
10/9/00
2
5.3
6
8-10
8.2
7:00
10
5.3
10
0 Middle Thurmon
10/11/00
3
1.8
8
7-8
8.0
1:25
5
2.9
40
13 West Thurmon
10/11/00
5
2.4
14
9
8.4
1:40
6
4.2
25
7
65

66
Table 3. Characteristics of Golden Lake, and Fintrol and rotenone application rates used in the October 2000 treatment.
Surface area at full pool 54 acres
Volume at full pool 181 ac-ft
Volume at drawdown 75 ac-ft
Temperature (oC) 3-8
pH 10.7
Total volume Fintrol used 22.6 pints
Total volume Nusyn-Noxfish used 20 gal
Total wt rotenone powder used 75 lbs

67
Live-car fish were distributed in the lake and near the mouth of each tributary to monitor success of the treatment. Additional live-cars were placed between the dam spillway and the detoxification station, and at the picket weir ½-mile downstream.
To alleviate public concerns over impacts to invertebrates, Forest Service personnel collected an array of invertebrates from tributaries just prior to the treatment. These were held in sealed containers until after the treatment, and then released back into tributaries.
The Golden Lake discharge was turned off at the time of chemical application. Less than two cfs of seepage initially exited the lake. This gradually increased over the next 48 hours until the lake filled and began passing inflow (25 cfs). Potassium permanganate (4 ppm) was applied just below the dam to neutralize both rotenone and antimycin entering Thurmon Creek. The live-car between the dam and permanganate drip was periodically restocked with fish to monitor toxicity of the discharge. The permanganate drip was shut down after five days, at which time live-car fish no longer showed signs of rotenone or antimycin exposure.
Treatment Conditions
Lake water temperatures in 2000 varied from 3oC to 8oC during the course of the treatment and detoxification. Tributary temperatures at the springs were consistently 8°C to 9oC. Lake pH was 10.7 and tributary pH ranged from 8.0 to 8.4. Weather on the main treatment day was cold and breezy, with occasional snow flurries.
RESULTS AND DISCUSSION Mortalities were observed in all tributaries, with only a handful observed in the lake. No attempt was made to quantify mortalities. Throughout the 2000 treatment, there were no observed mortalities in live-car fish held downstream from the permanganate station. A comprehensive assessment will occur in spring 2001 prior to cutthroat trout reintroduction. This will include backpack electrofishing the entire length of each tributary.
Problems Encountered
Due to the complexity of both treatments, most of the problems were logistical and did not affect the outcome of the treatment. With over 20 people used for the main treatments (many of whom were not familiar with the area), a great deal of effort went into detailing assignments and ensuring each individual had appropriate instruction and safety training. During the 2000 treatment there were minor miscommunications with some of the crews detailed to tributary drip stations, which resulted in one station starting about 20 minutes later than planned. Formulation and use of the rotenone sand was problematic. Ten days prior to the treatment, the sand, rotenone powder, and gelatin were mixed in a small concrete mixer. We added water while mixing until the mixture began to clump. At the time the sand mixture was

68
placed into buckets for storage the texture seemed to match that described in the manual. However, we suspect that too much water was added to the mixture. The mixture apparently fermented within three days, blowing the lids off many of the buckets, and also turned to a thick slurry which was difficult to handle. Consequently, distributing the sand at prescribed rates at the treatment sites was more difficult than expected. For future applications of rotenone sand, we suggest mixing small test batches and adjusting the amount of water. Test batches should be checked after several days, after which the best ratio of ingredients can be selected and used for large-scale production. Because of the shallow nature of Golden Lake, using an airboat to distribute chemicals to the lake was the only feasible option in this case. However, this is probably not a preferred method, particularly for applying antimycin. Antimycin can cause painful eye irritation, and prop wash from the airboat sometimes misted shore support crews. Although all personnel were provided with protective goggles, and no eye irritation was reported, crews had to be very conscious of eye protection at all times. Another potential hurdle was the regulatory requirements for aquatic pesticide applications. Two Idaho Department of Agriculture inspectors were on site for the treatment. Although they did not halt the treatment, they did point out several procedural shortcomings. They indicated that having only one or two certified applicators for a treatment of this scale was insufficient. Each applicator (backpack sprayer, mixer, boat operator, drip station attendant) is required to be certified for aquatic pesticide application, or must be under the direct supervision (within eyesight) of a certified applicator. There was also confusion over legal requirements for product labeling, safety, and record keeping (application rates, area, etc.). All of this information was available on-site, but in our case the certified applicators were not the people who actually calculated the application rates. We expect that Department of Agriculture oversight of fish eradication projects will increase, and recommend planning for future projects include meeting with inspectors for review and approval of chemical application and safety protocols.

69
Submitted by: Approved by: Mark Gamblin Regional Fishery Manager ___________________________________ Bob Saban William C. Schrader Regional Supervisor Senior Fishery Research Biologist Jeff Dillon Regional Fishery Biologist