idaho travel impacts · monthly averages, jan 2016 through december 2017 sources: overseas...
TRANSCRIPT

Idaho Travel Impacts2010-2017p
September 2018

Idaho Travel Impacts2010-2017p
Prepared forIdaho Commerce - Tourism Development
Primary Research Conducted By Dean Runyan Associates
Portland, Oregon
September 2018

Executive Summary
This report describes the economic impacts of travel to and through Idaho and the
state’s forty-four counties and seven tourism regions. The statewide estimates for
2017 are preliminary and will be revised as more complete source data becomes
available. The estimates of spending, earnings, employment and tax receipts are
also used as input data to derive estimates of other economic measures, including
gross domestic product (GDP) and secondary effects of the travel industry.[1]
Summary of Recent Trends· Total direct travel spending in Idaho was $3.7 billion in 2017p. This
represents a 6.5 percent increase over the preceding year in current dollars.
In real dollars (adjusted for inflation) Idaho travel spending increased by 4.5
percent.
· Direct travel-generated employment was 45,800 in 2017p. Employment has
increased by 3.1 percent per year since 2010. Earnings ($1.1 billion in
2017p) have increased by 5.8 percent per year since 2010.
· Local, state and federal tax revenue generated by travel spending totaled
$475 million in 2017p: $286 million state and local, and $188 million
federal. This is equivalent to $740 for each Idaho household (state and local
tax revenue is equivalent to $450 for each Idaho household).
· The Gross Domestic Product of the Idaho travel industry was $1.6 billion in
2017p. In 2016 travel GDP was $1.4 billion compared to $4.9 billion for
Agriculture and Food Products Manufacturing and $2.2 billion for Computer
and Electronics Manufacturing. However, in many rural areas of the state,
travel is the most important export-oriented industry. (Note: 2016 is the most
recent year for GDP industry estimates are available.)
· The economic impacts directly generated by visitor spending also contribute
to significant secondary impacts. The total (direct plus secondary)
employment supported by the Idaho travel industry was 63,300 jobs. The
total earnings supported by the travel industry were $1.76 billion. These
total impacts reflect the re-spending of income by travel industry employees
and businesses on additional goods and services.
[1]. The estimates of the direct impacts associated with traveler spending in Idaho were produced using the Regional Travel Impact Model (RTIM) developed by Dean Runyan Associates. The estimates for Idaho are generally comparable to the U.S. Travel and Tourism Satellite Accounts produced by the Bureau of Economic Analysis.
PAGE i DEAN RUNYAN ASSOCIATES

The Idaho Travel Industry Benefits All Areas of the State
The travel industry benefits counties that have some of the highest and lowest levels of total employment in the state.
The chart on the left shows the top ten counties by travel employment share in Idaho. This illustrates the importance of the travel industry in certain counties, some being more rural than others. The chart on the right shows the top ten counties by total employment for comparison.
0% 4% 8% 12% 16% 20% 24% 28%
Blaine
Valley
Custer
Fremont
Boise
Kootenai
Bear Lake
Bonner
Teton
Bannock
Top 10 Counties Travel Share of TotalEmployment
2017p
0K 50K 100K 150K 200K 250K 300K 350K
Ada
Canyon
Kootenai
Bonneville
Twin Falls
Bannock
Nez Perce
Madison
Bingham
Latah
Total Less Travel Travel
Top 10 Counties by Total Employment &Travel Employment
2017p
2017p Idaho Travel Travel Indicators
Visitor Spending Impacts
Amount of Visitor Spending that supports 1 job $74,485
Employee Earnings generated by $100 Visitor Spending $31
Visitor Tax Revenues Generated by $100 Visitor Spending $5.77
Visitor Volume
Additional visitor spending from one additional overnight visitor per resident household (in thousands)
$143,427
Additional employment from one additional overnight visitor per resident household 1,926
Visitor Shares
Travel Share of Total Employment 4.6 %
Overnight Vistor Day Share** 5.7 %
*Includes only point of sale taxes directly generated from visitor spending. **The annual share of visitor nights in relation to the total population.
DEAN RUNYAN ASSOCIATESPAGE ii

The purpose of this study is to document the economic significance of the travel industry in Idaho from 2010 to 2017. These findings show the level of travel spending by visitors traveling to and within the state, and the impact this spending had on the economy in terms of earnings, employment and tax revenue.
Dean Runyan Associates has specialized in research and planning services for the travel, tourism and recreation industry since 1984. With respect to economic impact analysis, the firm developed and currently maintains the Regional Travel Impact Model (RTIM), a proprietary computer model for analyzing travel economic impacts at the state, regional and local level. Dean Runyan Associates also has extensive experience in project feasibility analysis, market evaluation, survey research and travel and tourism planning. Many individuals and organizations provided data and assistance for this report. State agencies include the Idaho State Tax Commission, Idaho Department of Commerce, and Idaho State Parks. Federal agencies that maintain data essential for this report include the Bureau of Economic Analysis, the Department of Labor, the Department of Transportation, the U.S. Forest Service, and the National Park Service. In addition, local jurisdictions, Convention and Visitors Bureaus, and travel and tourism organizations throughout the state of Idaho contributed information essential for this report.
Dean Runyan Associates833 SW 11th Ave., Suite 920
Portland, OR 97205
(503) [email protected]
Preface
PAGE iii DEAN RUNYAN ASSOCIATES
TABLE OF CONTENTS
I. U.S. Travel 1
II. Idaho Travel 5
Summary of Idaho Travel 6
Travel Trends 7
Visitor Origin 8
Government Revenue 10
Idaho Travel Industry Gross Domestic Product 11
Gross Domestic Product of Idaho Export-Oriented Industries 12
Direct, Secondary & Total Impacts 13
Idaho Overnight Volume and Average Daily Spend 17
Travel Impact Details 18
III. Regional Travel Impacts 19
IV. County Travel Impacts 44
V. Legislative District Travel Impacts 62
VI. Lodging Sales 98
Appendices 101
A. 2017 Travel Impact Estimates 102
B. Key Terms and Definitions 105
C. Regional Travel Impact Model 106
D. Travel Industry Accounts 107
E. Idaho Earnings and Employment by Industry Sector 118
F. Secondary Impacts Industry Groups 119
DEAN RUNYAN ASSOCIATESPAGE iv

page
I. US Travel
Annual Direct Travel Spending in U.S., 2000-2017p 2
Spending by Foreign and Resident Travelers in U.S. 2
Overseas Arrivals 3
Relative Value of Selected Foreign Currencies compared to U.S. Dollar 3
U.S. Travel Industry Employment 4
Components of U.S. Travel Industry Employment 4
II. Idaho Travel 5
Direct Travel Impacts, 2010-2017p 7
Idaho Direct Travel Spending, Real and Current Dollars, 2010-2017p 8
Idaho Overnight Person Trips, 2010-2017 8
Air Passenger Visitor Arrivals to Idaho, US Air Carriers, 2000-2017 8
Idaho Visitor Spending by Origin of Visitor, 2017p 9
International Visitor Spending in Idaho, 2010-2017p 9
Local, State & Federal Revenue 2017p 10
State & Local Revenue by Tax Category 2017p 10
State & Local Revenue by Visitor and Business/Employee 2017p 10
Idaho Travel Industry Gross Domestic Product, 2017p 11
Idaho Gross Domestic Product, 2016 (Selected Export-Oriented Industries) 12
Total Employment and Earnings Generated by Travel Spending in Idaho, 2017p 14
Direct & Secondary Employment Generated by Travel Spending, 2017p (graph) 15
Direct & Secondary Earnings Generated by Travel Spending, 2017p (graph) 15
Direct & Secondary Employment Generated by Travel Spending, 2017p (table) 16
Direct & Secondary Earnings Generated by Travel Spending, 2017p (table) 16
Idaho Overnight Visitor Volume and Average Daily Spend, 2010-2017p 17
Idaho Direct Travel Impacts, 2010-2017p 18
III. Regional Travel Impacts 19
Regional Impact Summary Tables 21
Regional Impact Detail Tables, 2010-2017p 22-42
IV. County Travel Impacts 44
Travel-Generated Employment and Earnings Shares by County, 2017p 45
County Impact Summary Table 2017p 46
County Impact Detail Tables, 2008-2017p 47-61
V. Legislative District Travel Impacts 62
Legislative District Travel Impacts Tables 63-97
VI. Lodging Sales 98
Regional Share of Taxable Lodging Sales 2017 99
Taxable Lodging Sales by Region & Quarter 2017 99
Taxable Lodging Sales by Quarter 2017 99
Idaho Taxable Lodging Sales by County 2010-2017 100
List of Tables and Figures
PAGE v DEAN RUNYAN ASSOCIATES

This page intentionally blank
DEAN RUNYAN ASSOCIATESPAGE vi

I. NATIONAL TRAVEL TRENDS
PAGE 1 DEAN RUNYAN ASSOCIATES

The national level data in this section focuses on visitor spending trends in current and
real dollars, resident and foreign visitor spending in the U.S., and trends in
travel-generated employment.
The following two graphs are derived from the Bureau of Economic Analysis Travel and Tourism Satellite Accounts*. Both graphs show direct tourism output for the United States - spending by resident and foreign visitors. The 2017 values are based on the first three quarters of the year.
$400
$500
$600
$700
$800
$900
$1,000
0001
0203
0405
0607
0809
1011
1213
1415
1617
Current Real
Year
Ou
tpu
t (B
illio
ns)
Annual Direct Travel Spending in U.S., 2000-17p Spending by resident and
foreign visitors was $933
billion in 2017 in current
dollars. This represents a
3.0 percent increase over
2016. When adjusted for
changes in prices (real
dollars), spending increased
by 2.3 percent from 2016
to 2017 compared to a 4.7
percent increase for the
preceding year.
60
80
100
120
140
160
180
200
0001
0203
0405
0607
0809
1011
1213
1415
1617
Foreign Resident
Year
Ou
tpu
t (Y
ear
20
00
=1
00
)
Spending by Foreign and Resident Travelers in U.S.
(Curent Dollars; Year 2000=100)
The bottom chart compares
the change in current dollar
spending by resident and
foreign visitors since 2000.
In 2017, the increase in
spending by resident
visitors (4.7 percent)
compares to a 2.0 percent
decrease in non-resident
spending. Visitor spending
by non-residents increased
by 5.2 percent from 2014
to 2015. Note: Foreign visitor spending does not include expenditures on health and educational services or expenditures by short term seasonal workers.
*See http://www.bea.gov/industry/index.htm#satellite.
DEAN RUNYAN ASSOCIATESPAGE 2

Foreign arrivals increased 4.3 percent from 2016 to 2017. The dollar continues to
remain strong against selected foreign currencies. This can apply downward pressure
on international spending by lessening the purchasing power of the international
visitor that has traveled to the U.S.
0M
10M
20M
30M
40M
50M
60M
70M
80M
0001
0203
0405
0607
0809
1011
1213
1415
1617
Arr
ival
s
Overseas arrivals to the U.S.
7580859095
100105110115120
1/20
16
8/20
16
3/20
17
10/2
017
Euro Canada Japan China
GBP
Relative Value of Selected Foreign Currencies comparedto U.S. Dollar
Monthly Averages, Jan 2016 through December 2017
Sources:
Overseas Arrivals: 2017 has been estimated using Tourism Economics annual change for overseas visitors from 2017 to 2016. The original source data is under review by the NTTO. National Travel and Tourism Office, U.S. Department of Commerce. Tourism Economics.*NTTO press release.https://bit.ly/2JTgmH1
Relative Value of Selected Foreign Currencies: USForex, Inc. (www.usforex.com)
PAGE 3 DEAN RUNYAN ASSOCIATES

0
500
1000
1500
2000
2500
3000
3500
4000
0001
0203
0405
0607
0809
1011
1213
1415
1617
Leisure & Hosp. Transport & Other
Th
ou
san
ds
Components of U.S. Travel Employment
4.4
4.6
4.8
5.0
5.2
5.4
5.6
5.8
6.0
0001
0203
0405
0607
0809
1011
1213
1415
1617
Emp
loym
ent
(Mil
lio
ns)
U.S. Travel Industry Employment
Source: Bureau of Economic Analysis Travel & Tourism Satellite Accounts.
The following two graphs show employment trends since 2000 and the composition
of travel industry employment since the recession. The first graph shows that
travel-generated employment recovered from the 2008-09 recession by 2016. There
has been no significant employment growth in the industry beyond the recession
recovery. Leisure and hospitality employment was 3.5 million in 2017 or 65 percent
of total travel industry employment, compared to 3.6 million in 2000 or 61 percent of
the total. Most of this growth was due to food services employment. However,
employment in transportation and other industries declined over the same period from
2.3 million to 1.8 million, mostly due to decreased employment in the airline and
related transportation industries.
Source: Bureau of Economic Analysis Travel & Tourism Satellite Accounts.Leisure & hospitality includes accommodations, food services, and arts, entertainment & recreation. Transportation and other includes retail and all other industries.
DEAN RUNYAN ASSOCIATESPAGE 4
II. IDAHO TRAVEL IMPACTS & VISTOR VOLUME
Idaho
PAGE 5 DEAN RUNYAN ASSOCIATES

The multi-billion dollar travel industry in Idaho is an important part of the state and local economies. The industry is represented primarily by businesses in the leisure and hospitality sector, transportation, and retail. The money that visitors spend on various goods and services while in Idaho produces business receipts at these firms, which in turn generate earnings and employment for Idaho residents. In addition, state and local governments collect taxes that are generated from visitor spending. Most of these taxes are imposed on the sale of goods and services to visitors, thus avoiding a tax burden on local residents. The economic impacts directly generated by visitor spending also contribute to significant secondary impacts. A portion of the business receipts generated by visitor spending is spent by businesses within Idaho for other goods and services (indirect impacts). Visitor generated earnings are also spent by employees for goods and services produced in Idaho (induced impacts).
Summary of Idaho Travel
· Total direct travel spending in Idaho was $3.7 billion in 2017p. The increase of 6.5 percent was due to continued growth in spending on commercial lodging and an increase in motor fuel prices. Non-transportation visitor spending increased by 4.8 percent. Travel spending in real (inflation-adjusted) dollars has increased by 4.5 percent in 2017p.
· Lodging sales increased by 7.4 percent in 2017 following a 13.4 percent increase the preceding year. The strong growth in room sales over that past two years has been equally attributable to increased room rates and room demand (STR, Inc.).
· Visitor air travel on domestic flights to Idaho destinations increased by 9.3 percent in 2017p. Visitor air arrivals to the state have increased an average of 8 percent per year since 2014.
· Direct travel-generated employment was 45,800 in 2017p. This represents an addition of 2,100 jobs, an increase of 4.9 percent.
· The Gross Domestic Product of the travel industry was $1.6 billion in 2017p. In 2016 travel GDP was $1.4 billion compared to $4.9 for Agriculture and $2.2 billion for Computer and Electronics Manufacturing. However, in many rural areas of the state, travel is the most important export-oriented industry. (Note: 2016 is the most recent year for GDP industry estimates.)
· The re-spending of travel-related revenues by businesses and employees creates secondary impacts. In 2017p, the secondary impacts were 17,500 jobs with $646 million in earnings.
DEAN RUNYAN ASSOCIATESPAGE 6

Travel Trends
The Idaho travel industry experienced strong growth in 2017. Travel spending increased by 6.5 percent from 2016 to 2017p, following a 4.8 percent increase the preceding year; the rebound in motor fuel prices helped lift travel spending. Non-transportation visitor spending increased by 4.8 percent in 2017p, compared to a 6.4 percent increase the preceding year. Earnings, employment and tax revenue have also experienced substantial growth over the past two years.
Avg. Annual %Chg.
Direct Travel Impacts, 2010-2017p
2010 2012 2014 2015 2016 2017 16-17p 10-17pTotal (Current $) 2,696 3,035 3,257 3,304 3,462 3,686 6.5% 4.6%
Other 282 310 300 312 336 370 10.0% 4.0%
Visitor 2,414 2,725 2,957 2,991 3,126 3,316 6.1% 4.6%
Non-transportation 1,791 1,939 2,172 2,293 2,440 2,557 4.8% 5.2%
Transportation 623 786 785 699 686 759 10.7% 2.9%
Spending ($Millions)
Earnings (Current $) 749 808 901 952 1,029 1,113 8.2% 5.8%
Earnings ($Millions)
Employment 37.1 38.2 40.6 41.7 43.7 45.8 4.9% 3.1%
Employment (Thousands)
Total (Current $) 330 346 390 411 444 475 6.8% 5.3%
Local 25 26 29 31 33 35 6.9% 5.1%
State 171 185 203 215 234 251 7.2% 5.6%
Federal 135 135 158 166 177 188 6.4% 4.9%
Tax Revenue ($Millions)
Other spending includes resident air travel, travel arrangement and reservation services, and convention and trade show organizers. Non-transportation visitor spending includes accommodations, food services, retail, food stores, and arts, entertainment & recreation. Visitor transportation spending includes private auto, auto rental, other local ground transportation and one-way airfares.Earnings include wages & salaries, earned benefits and proprietor income.Employment includes all full- and part-time employment of payroll employees and proprietors.Local tax revenue includes lodging taxes, sales taxes, auto rental taxes and airport passenger facility charges paid by visitors, and the property tax payments and sales tax payments attributable to the travel industry income of employees and businesses.State tax revenue includes lodging, sales and motor fuel tax payments of visitors, and the income tax and sales tax payments attributable to the travel industry income of businesses and employees.Federal tax revenue includes motor fuel excise taxes and airline ticket taxes paid by visitors, and the payroll and income taxes attributable to the travel industry income of employees and businesses.
PAGE 7 DEAN RUNYAN ASSOCIATES

$0
$1
$2
$3
$4
$5
10 11 12 13 14 15 16 17p
Current Real
Tra
vel Sp
end
ing
(Billio
ns)
Idaho Direct Spending
Real and Current DollarsIn real dollars (adjusted for inflation) Idaho travel spending increased by 4.5 percent over 2016. In current dollars, the increase was 6.5 percent.
Sources: STR, Inc., Energy Information Administration, U.S. Department of Transportation Origin and Destination Survey, and Bureau of Labor Statistics CPI-West Urban.
Overnight person trips increased
by 2.2 percent from 2016 to 2017.
Since 2010, overnight person trips
have increased by 2.5 percent per
year. (A more detailed breakout of
overnight visitor volume is shown on
next page)
0
2
4
6
8
10
12
14
10 11 12 13 14 15 16 17p
Mil
lio
ns
Overnight Person Trips
Sources: Dean Runyan Associates
500
550
600
650
700
750
800
850
900
950
0001
0203
0405
0607
0809
1011
1213
1415
1617p
Idaho SpokaneMil
lio
ns
of
Vis
ito
r A
rriv
als
Visitor Air Arrivals (Millions)
Visitor air arrivals to Idaho increased
by 9.2 percent in the most recent
year following a 9.0 percent increase
from 2015 to 2016. Also, visitor air
arrivals to Spokane, Washington, an
airport used by those traveling to
northern Idaho, followed a similiar
pattern.
Source: Bureau of Transportation Origin and Destination Survey
DEAN RUNYAN ASSOCIATESPAGE 8

International Travel to Idaho State and Visitor Origin
In recent years, residents of other states and countries have accounted for over three-fourths of all visitor spending in Idaho State - seven percent international and sixty-nine percent other states in the U.S. (See pie chart, below.)
Note: The estimates for Idaho resident and domestic non-resident travel were calculated by Dean Runyan Associates from TNS TravelsAmerica survey data.
23%Idaho
69%Out of State
7%International
Visitor Spending in Idaho by Origin, 2017p
The share of international travel spending has declined slightly since 2013. Even with the decrease in share, international spending continues to increase gradually.
$0
$40
$80
$120
$160
$200
$240
$280
0%
4%
8%
12%
16%
20%
1011
1213
1415
1617p
Spending Share
Spen
din
g in
Rea
l (2
01
7)
Do
llar
s (M
illi
on
s)Sh
are of V
isitor Sp
end
ing (%
)
Sources: Dean Runyan Associates, International Trade Administration and Bureau of Economic Analysis, Bureau of Transportation Statistics. See first graph on preceding page for real dollar estimates. Real dollar visitor spending does not include “Other Travel.”
International Visitor Spending in Idaho
PAGE 9 DEAN RUNYAN ASSOCIATES

Travel-Generated Tax Revenue
Federal 39.7%$188M
Local 7.4%$35M
State 52.9%$251M
Total: 100.0%$475M
Local, State & Federal Revenue2017p
The top pie chart shows the distribution of travel-generated government revenue. Federal taxes include income, payroll, airline ticket and motor fuel taxes. State and local taxes are shown in the next pie chart.
Total local, state and federal tax revenue is equivalent to $740 per resident Idaho household. State and local tax revenue amounts to $450 per household.
Income 11.7%$33M
Local 12.3%$35M
Motor Fuel 14.5%$41M
State 61.6%$176M
Total: 100.0%$286M
State & Local Revenue by Tax Category2017p
Local taxes include property tax payments attributable to the travel-generated income of employees and businesses, airport passenger facility charges on visitor air travel, and local option sales and lodging taxes. Sales tax revenue reflects the revenue generated by visitor spending and the sales tax payments attributable to the income of travel industry employees.
Two-thirds of all local and state tax revenue is attributable to visitor spending on goods and services (including both Idaho residents and out-of-state visitors). Travel businesses and employee tax payments include sales, income, and property taxes.
Emp/Bus 33.1%$95M
Visitor 66.9%$191M
Total: 100.0%$286M
State & Local Revenue by Visitor andBusiness/Employee
2017p
DEAN RUNYAN ASSOCIATESPAGE 10

Idaho Travel Industry Gross Domestic Product
In concept, the Gross Domestic Product (GDP) of a particular industry is equal to gross output (sales or receipts) minus intermediate inputs (the goods and services purchased from other industries). GDP is always smaller than output or sales because GDP measures only the “value added” of an industry and does not include the cost of the inputs that are also necessary to produce a good or service. Alternatively, GDP can be thought of as the sum of earnings, indirect business taxes (primarily excise and property taxes) and other operating surplus (including profits). Estimates of travel spending and travel industry GDP are shown in the chart below. Idaho travel industry GDP amounted to $1.6 billion in 2017p. Idaho travel industry GDP represents about 2.0 percent of total state GDP in recent years.
About 57 percent of all travel spending in Idaho is attributed to intermediate inputs and goods resold at retail. Intermediate inputs cover a range of goods and services that are purchased by travel industry businesses for the purpose of creating a product or service for the traveler. For example, lodging establishments purchase cable television services. Restaurants purchase food and beverages from vendors. In both cases, these inputs are classified as the GDP of other industries. In addition, travel spending occurs at many retail establishments where the goods purchased from the retailer are purchased as finished goods from suppliers. These resold goods are also counted as products of other industries. This would include motor fuel, groceries and most of the commodities sold at retail establishments.
$0
$1
$1
$2
$2
$3
$3
$4
$4
$0.5 $0.5
$1.1 $1.1
$2.1
Inputs
Earnings
Surplus & Taxes
Spending ($3.7) GDP ($1.6)
Idaho Travel Industry Gross Domestic Product, 2017p
Sources: Dean Runyan Associates, Bureau of Economic Analysis, and Implan Group, LLC. Details may not add to totals due to rounding.
PAGE 11 DEAN RUNYAN ASSOCIATES

Gross Domestic Product of Idaho Export-Oriented Industries
$0 $1 $2 $3 $4 $5
Agriculture
Computer/Elec. Manufacturing
Mining
Travel
Gross Domestic Product (Billions)
GDP of Major Idaho Export Industries
Export-oriented industries are those industries that primarily market their products
and services to other regions, states or nations. Agriculture, mining, and manufacturing are the best examples of export-oriented industries. Clearly, there are cases in each of these three sectors where the products are sold within the local or regional market. Nonetheless, in general most businesses within these industries depend on export markets. The travel industry is also an export-oriented industry because goods and services are sold to visitors, rather than residents. The travel industry injects money into the local economy, as do the exports of other industries. Exports are not necessarily more important than locally traded goods and services. However, diverse export-oriented industries in any economy are a source of strength - in part because they generate income that contributes to the development of other local services and amenities. Such industries characterize the “comparative advantage” of the local economy within larger regional, national and global markets. A comparison of the GDPs of the leading export-oriented industries in Idaho is shown below.
Source: Bureau of Economic Analysis, Bureau of Labor Statistics and Dean Runyan Associates. 2016 is the most recent year for which GDP estimates are available at the industry detail level.
DEAN RUNYAN ASSOCIATESPAGE 12
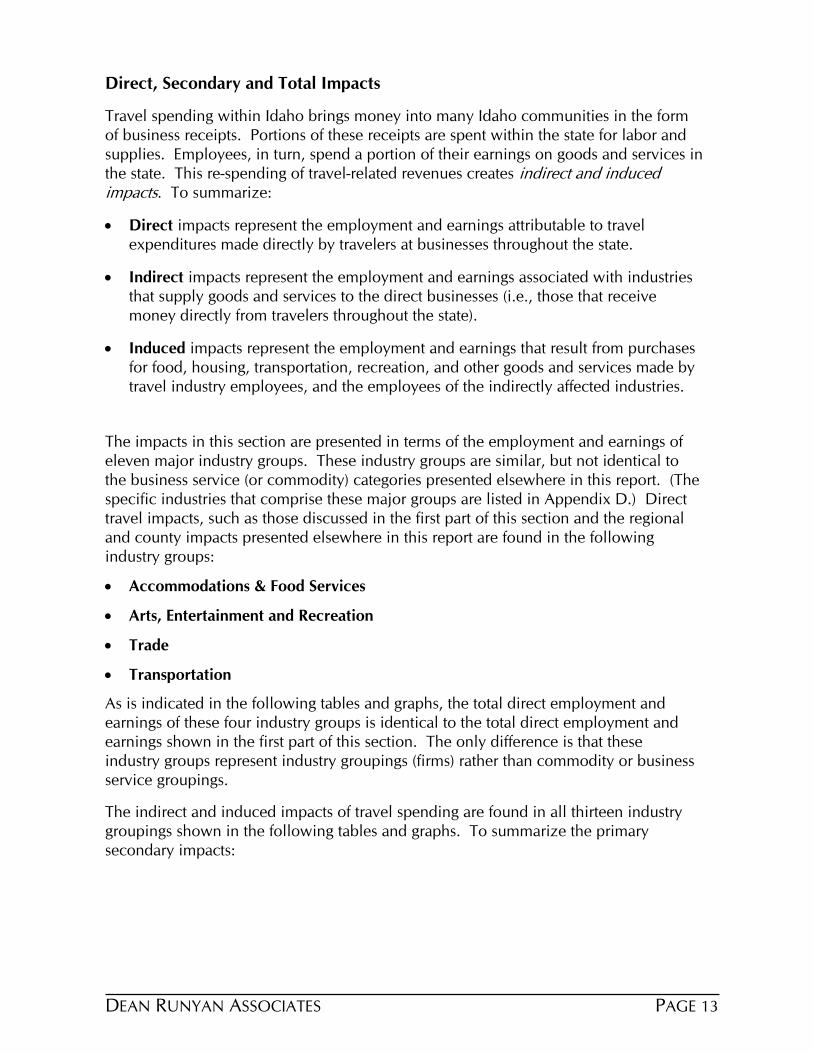
Direct, Secondary and Total Impacts
Travel spending within Idaho brings money into many Idaho communities in the form of business receipts. Portions of these receipts are spent within the state for labor and supplies. Employees, in turn, spend a portion of their earnings on goods and services in the state. This re-spending of travel-related revenues creates indirect and induced impacts. To summarize:
· Direct impacts represent the employment and earnings attributable to travelexpenditures made directly by travelers at businesses throughout the state.
· Indirect impacts represent the employment and earnings associated with industriesthat supply goods and services to the direct businesses (i.e., those that receive money directly from travelers throughout the state).
· Induced impacts represent the employment and earnings that result from purchasesfor food, housing, transportation, recreation, and other goods and services made bytravel industry employees, and the employees of the indirectly affected industries.
The impacts in this section are presented in terms of the employment and earnings of eleven major industry groups. These industry groups are similar, but not identical to the business service (or commodity) categories presented elsewhere in this report. (The specific industries that comprise these major groups are listed in Appendix D.) Direct travel impacts, such as those discussed in the first part of this section and the regional and county impacts presented elsewhere in this report are found in the following industry groups:
· Accommodations & Food Services
· Arts, Entertainment and Recreation
· Trade
· Transportation
As is indicated in the following tables and graphs, the total direct employment and earnings of these four industry groups is identical to the total direct employment and earnings shown in the first part of this section. The only difference is that these industry groups represent industry groupings (firms) rather than commodity or business service groupings.
The indirect and induced impacts of travel spending are found in all thirteen industry groupings shown in the following tables and graphs. To summarize the primary secondary impacts:
PAGE 13 DEAN RUNYAN ASSOCIATES

Total Employment and Earnings Generated byTravel Spending in Idaho, 2017p
45.8K
8.0K4.6K
Direct 78.4%
Indirect 13.7%
Induced 7.9%
Total: 100.0%
Employment
$1.11
$0.35$0.19
Direct 67.5%
Indirect 21.0%
Induced 11.5%
Total: 100.0%
Earnings(Billions)
Sources: Dean Runyan Associates with IMPLAN GROUP, LLC. Total employment was 58,400 jobs. The employment multiplier for 2017 is 1.27 (58.41/45.82). Total earnings were $1.65 Billion. The earnings multiplier is 1.48 (1.65/1.11).
· Professional & Business Services (3,500 jobs and $173 million earnings). A variety of administrative services (e.g., accounting and advertising) are utilized by travel businesses (indirect effect). Employees of these firms also purchase professional services (induced effect).
· Other Services (1,100 jobs and $47 million earnings). Employees of travel-related businesses purchase services from various providers, such as dry cleaners and repair shops. Similarly, travel businesses utilize a number of service providers, such as laundry, maintenance and business services.
· Government (390 jobs and $32 million earnings). Employees of travel-related businesses pay fees to attend public educational institutions and to operate motor vehicles.
· Finance, Insurance and Real Estate (2,840 jobs and $93 million earnings). Employees and businesses use the services of financial institutions, insurers and real estate businesses.
DEAN RUNYAN ASSOCIATESPAGE 14

0K 4K 8K 12K 16K 20K 24K 28K
Accommodation & Food Services
Arts, Entertainment & Recreation
Trade
Professional and Business Services
Transport
Other Services
Information
Public Administration
Construction
Manufacturing & Utilities
Natural Resources and Mining
Direct Secondary
Direct and Secondary EmploymentGenerated by Travel Spending in Idaho
0.0 0.1 0.2 0.3 0.4 0.5 0.6
Accommodation & Food Services
Arts, Entertainment & Recreation
Trade
Professional and Business Services
Transport
Other Services
Public Administration
Information
Manufacturing & Utilities
Construction
Natural Resources and Mining
Direct Secondary $Billions
Direct and Secondary EarningsGenerated by Travel Spending in Idaho
Detailed estimates are reported in the following table. It should be emphasized that the
estimates of indirect and induced impacts reported here apply to the entire state of Idaho
and do not necessarily reflect economic patterns for individual counties, regions or
sub-regions within the state. While total economic impacts can be calculated on a county
or regional level, such a detailed analysis is not included in this study. In general,
geographic areas with lower levels of aggregate economic activity will have smaller
secondary impacts within those same geographic boundaries.
PAGE 15 DEAN RUNYAN ASSOCIATES

Direct and Secondary Travel-Generated Earnings in Idaho, 2017p($Million)
Direct Grand TotalIndirect Induced TotalSecondary
Industry Group
536 575 16 23 39Accommodation & Food Services
293 313 16 4 20Arts, Entertainment & Recreation
133 234 39 62 101Trade
116 160 35 9 44Transport
35 209 140 34 174Professional and Business Services
47 21 27 47Other Services
32 25 7 32Public Administration
18 13 5 18Construction
10 6 4 10Natural Resources and Mining
24 17 7 24Manufacturing & Utilities
27 20 7 27Information
110 3 107 110Education and Health Services
1,113 351 296 646 1,759Total Earnings
Direct and Secondary Travel-Generated Employment in Idaho, 2017p(thousand jobs)
Direct Indirect Induced Total Grand TotalSecondary
Industry Group
24.1 0.6 1.0 1.6 25.8Accommodation & Food Services
13.8 1.5 0.2 1.7 15.5Arts, Entertainment & Recreation
4.5 0.9 1.3 2.2 6.7Trade
2.6 0.7 0.2 0.9 3.5Transport
0.7 2.8 0.7 3.5 4.2Professional and Business Services
0.4 0.7 1.1 1.1Other Services
0.3 0.1 0.4 0.4Public Administration
0.3 0.1 0.4 0.4Construction
0.1 0.0 0.1 0.1Natural Resources and Mining
0.2 0.1 0.3 0.3Manufacturing & Utilities
0.3 0.1 0.4 0.4Information
1.9 1.0 2.8 2.8Financial Activities
0.1 1.9 2.0 2.0Education and Health Services
Source: Dean Runyan Associates and Minnesota Implan Group.
Note: These industry groups are not equivalent to the categories used in the direct impact tables used in this report. See Appendix G. Details may not add to totals due to rounding.
45.8 10.0 7.4 17.5 63.3Total Employment
DEAN RUNYAN ASSOCIATESPAGE 16
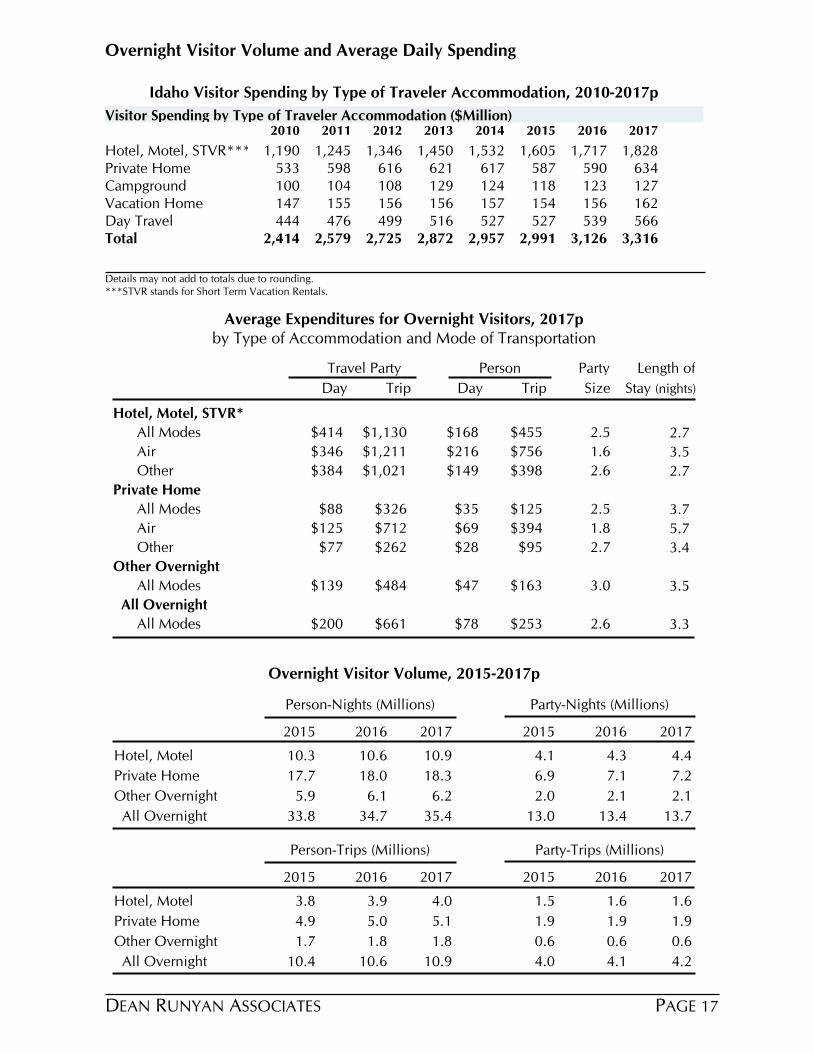
Overnight Visitor Volume and Average Daily Spending
Visitor Spending by Type of Traveler Accommodation ($Million)2010 2011 2012 2013 2014 2015 2016 2017
Hotel, Motel, STVR*** 1,190 1,245 1,346 1,450 1,532 1,605 1,717 1,828Private Home 533 598 616 621 617 587 590 634Campground 100 104 108 129 124 118 123 127Vacation Home 147 155 156 156 157 154 156 162Day Travel 444 476 499 516 527 527 539 566Total 2,414 2,579 2,725 2,872 2,957 2,991 3,126 3,316
Idaho Visitor Spending by Type of Traveler Accommodation, 2010-2017p
Details may not add to totals due to rounding.***STVR stands for Short Term Vacation Rentals.
Average Expenditures for Overnight Visitors, 2017pby Type of Accommodation and Mode of Transportation
Travel Party Person Party Length of
Day Trip Day Trip Size Stay (nights)
Hotel, Motel, STVR*
$414 $1,130 $168 $455 2.5 2.7All Modes
$346 $1,211 $216 $756 1.6 3.5Air
$384 $1,021 $149 $398 2.6 2.7Other
Private Home
$88 $326 $35 $125 2.5 3.7All Modes
$125 $712 $69 $394 1.8 5.7Air
$77 $262 $28 $95 2.7 3.4Other
Other Overnight
$139 $484 $47 $163 3.0 3.5All Modes
All Overnight
$200 $661 $78 $253 2.6 3.3All Modes
Overnight Visitor Volume, 2015-2017p
Person-Nights (Millions) Party-Nights (Millions)
2015 2016 2017 2015 2016 2017
Hotel, Motel 10.3 10.6 10.9 4.1 4.3 4.4
Private Home 17.7 18.0 18.3 6.9 7.1 7.2
Other Overnight 5.9 6.1 6.2 2.0 2.1 2.1
All Overnight 33.8 34.7 35.4 13.0 13.4 13.7
Person-Trips (Millions) Party-Trips (Millions)
2015 2016 2017 2015 2016 2017
Hotel, Motel 3.8 3.9 4.0 1.5 1.6 1.6
Private Home 4.9 5.0 5.1 1.9 1.9 1.9
Other Overnight 1.7 1.8 1.8 0.6 0.6 0.6
All Overnight 10.4 10.6 10.9 4.0 4.1 4.2
PAGE 17 DEAN RUNYAN ASSOCIATES

Idaho Direct Travel Impacts, 2010-2017pTotal Direct Travel Spending ($Million)
2010 2011 2012 2013 2014 2015 2016 2017
Destination Spending 2,414 2,579 2,725 2,872 2,957 2,991 3,126 3,316
Other Travel* 282 298 310 310 300 312 336 370
Total 2,696 2,877 3,035 3,182 3,257 3,304 3,462 3,686
Visitor Spending by Type of Traveler Accommodation ($Million)2010 2011 2012 2013 2014 2015 2016 2017
Hotel, Motel 1,190 1,245 1,346 1,450 1,532 1,605 1,717 1,828
Private Home 533 598 616 621 617 587 590 634
Campground 100 104 108 129 124 118 123 127
Vacation Home 147 155 156 156 157 154 156 162
Day Travel 444 476 499 516 527 527 539 566
Total 2,414 2,579 2,725 2,872 2,957 2,991 3,126 3,316
Visitor Spending by Commodity Purchased ($Million)2010 2011 2012 2013 2014 2015 2016 2017
Accommodations 355 355 384 419 458 503 566 607
Food Service 552 569 612 658 694 735 784 832
Food Stores 143 149 156 167 174 180 185 188
Local Tran. & Gas 471 599 624 617 604 508 486 547
Arts, Ent. & Rec. 372 374 397 419 432 450 470 487
Retail Sales 369 377 391 408 415 424 435 444
Visitor Air Tran. 152 156 162 186 181 190 200 212
Total 2,414 2,579 2,725 2,872 2,957 2,991 3,126 3,316
Industry Earnings Generated by Travel Spending ($Million)2010 2011 2012 2013 2014 2015 2016 2017
Accom. & Food Serv. 344 355 375 393 425 454 494 536
Arts, Ent. & Rec. 193 199 209 219 239 250 270 293
Retail** 99 100 104 110 117 121 127 133
Ground Tran. 36 36 37 37 41 43 45 47
Visitor Air Tran. 21 22 22 27 25 27 28 31
Other Travel* 55 59 60 64 55 58 64 73
Total 749 771 808 850 901 952 1,029 1,113
Industry Employment Generated by Travel Spending (Thousand Jobs)2010 2011 2012 2013 2014 2015 2016 2017
Accom. & Food Serv. 18.7 19.0 19.6 20.3 21.3 22.0 23.1 24.1
Arts, Ent. & Rec. 11.3 11.2 11.5 11.6 12.1 12.2 13.0 13.8
Retail** 4.1 4.1 4.2 4.3 4.4 4.4 4.4 4.5
Ground Tran. 1.4 1.4 1.4 1.4 1.5 1.5 1.6 1.6
Visitor Air Tran. 0.4 0.4 0.4 0.4 0.4 0.4 0.5 0.5
Other Travel* 1.2 1.2 1.2 1.2 1.0 1.0 1.1 1.3
Total 37.1 37.2 38.2 39.3 40.6 41.7 43.7 45.8
Tax Receipts Generated by Travel Spending ($Million)2010 2011 2012 2013 2014 2015 2016 2017
Local Tax Receipts 25 26 26 28 29 31 33 35
State Tax Receipts 171 176 185 194 203 215 234 251
Federal Tax Receipts 135 129 135 153 158 166 177 188
Total 330 331 346 375 390 411 444 475Details may not add to totals due to rounding.*Other Travel includes resident air travel, travel arrangements & reservation services, and convention & trade organizers.**Retail includes gasoline.***STVR stands for Short Term Vacation Rentals.
DEAN RUNYAN ASSOCIATESPAGE 18

III: REGIONAL TRAVEL IMPACTS2008-2017p
PAGE 19 DEAN RUNYAN ASSOCIATES

This section of the report provides summary measures of the economic impacts of travel for
each of Idaho’s seven tourism regions.
The first two tables on page 20 provide summary measures of economic impacts, overnight
visitor volume and average overnight visitor spending for 2017:
Detailed tables for each of the tourism regions follow. These tables are:
· 2017 Regional Travel Indicators. This table includes the amounts of spending that
support employment, earnings and tax revenue; the amount of additional
employment and tax revenue generated by an increase in overnight visitor volume;
the travel share of total employment; and the amount of overnight visitation in
relation to the total resident population.
· 2010-2017 Travel Trends. This table shows the annual percentage change in travel
spending, employment, earnings and tax revenue.
· 2010-2017 Economic Impacts. This table shows detailed estimates of spending by
type of commodity and travel-generated industry employment and earnings.
· 2010-2017 Spending by Type of Traveler Accommodation. The accommodation
categories include paid and unpaid overnight accommodations and day travel.
· 2017 Average Overnight Spending by Type of Accommodation. Average overnight
spending for persons and travel parties per night and per trip.
· 2015-2017 Overnight Visitor Volume by Type of Accommodation. Total person
and travel party-nights, and person and party-trips.
Appendices A and B provide a glossary of terms and a discussion of methodology.
Appendix C illustrates the relationships between spending, visitor volume and average
spending for overnight visitors.
DEAN RUNYAN ASSOCIATESPAGE 20

2017p Regional Travel Impacts
TotalStateLocalTax Revenue ($Millions)Employment
($Millions)Earnings
DestinationAll TravelSpending ($Millions)
(Thousands)
Northern 754 627 275 11 8 53 61
North Central 159 137 47 2 1 11 12
Southwestern 1,581 1,218 391 15 13 98 111
South Central 209 196 57 3 1 15 17
Southeastern 255 217 71 4 2 19 21
Eastern 383 350 117 5 3 29 32
Central 346 335 156 6 6 27 33
3,686 3,080 1,113 46 35 251 286Total
Note: The sum of destination spending for the regions will be less than statewide destination spending because of the treatment of transportation expenditures (only a portion of ground transportation is allocated to destination spending).
2017 Regional Overnight Visitor Volume and Average Spending
Overnight Visitor Volume (thousands) Average Overnight SpendingNights Trips Nights Trips
Person Party Person Party Person Party Person Party
Northern 6,068 2,233 1,891 686 $87 $236 $279 $767
North Central 2,156 805 674 251 $51 $137 $164 $440
Southwestern 13,241 5,481 3,965 1,595 $77 $186 $257 $638
South Central 3,141 1,174 962 360 $46 $123 $151 $402
Southeastern 3,357 1,258 1,025 386 $46 $124 $152 $403
Eastern 5,010 1,898 1,539 582 $55 $146 $180 $476
Central 2,440 887 822 300 $134 $369 $398 $1,092
35,413Total 13,737 10,877 4,160 $72 $186 $235 $615
Note: The sum of trips for the regions is greater than the state total because some travelers visit more than one region on the same trip to the state.
PAGE 21 DEAN RUNYAN ASSOCIATES

Central Region Travel Impacts and Visitor Volume
Travel Indicators (Blaine, Butte, Custer, Lemhi Counties)
Visitor Spending Impacts
Amount of Visitor Spending that supports 1 Job $56,798
Employee Earnings generated by $100 Visitor Spending $46
Visitor Tax Revenues generated by $100 Visitor Spending* $1.17
Visitor Volume
Additional visitor spending if each resident household encouraged one additional overnight visitor (in thousands)
$6,182
Additional employment if each resident household encouraged one additional overnight visitor
109
Visitor Shares
Travel Share of Total Employment 15.8%
Overnight Visitor Day Share** 18.2%
Direct Travel Impacts, 2010-2017p
Avg. Annual Chg.
Spending ($M) 2010 2012 2014 2015 2016 2017 16-17 10-17
Total (Current $) 265 266 279 281 315 346 9.8% 3.9%
Other 7 7 9 9 9 10 11.5% 6.4%
Visitor 258 258 270 272 306 335 9.8% 3.8%
Non-transportation 230 227 237 241 273 298 9.3% 3.8%
Transportation 28 32 33 31 33 37 13.9% 4.0%
Earnings ($M)
Earnings (Current $) 97 99 116 117 137 156 13.9% 7.0%
Employment (Jobs)
Employment 4,830 4,500 4,860 4,800 5,400 5,950 10.3% 3.0%
Tax Revenue ($M)
Total (Current $) 23 23 25 26 30 33 11.6% 5.3%
Local 4 4 5 5 6 6 12.1% 6.6%
State 19 19 20 21 24 27 11.5% 5.0%
Other spending includes resident air travel, travel arrangement and reservation services. Non-transportation visitor spending includes accommodations, food services, retail, food stores, and arts, entertainment & recreation. Visitor transportation spending includes private auto, auto rental, other local ground transportation and one-way airfares.Earnings include wages & salaries, earned benefits and proprietor income.Employment includes all full- and part-time employment of payroll employees and proprietors.Visitor generated tax revenue includes lodging, sales, motor fuel, auto rental taxes and airport passenger facility charges paid by visitors.Business or employee tax includes state business and personal income taxes, local property taxes and the sales tax payments of travel industry employees. This tax revenue is attributed to the travel-generated income of businesses and employees.
DEAN RUNYAN ASSOCIATESPage 22
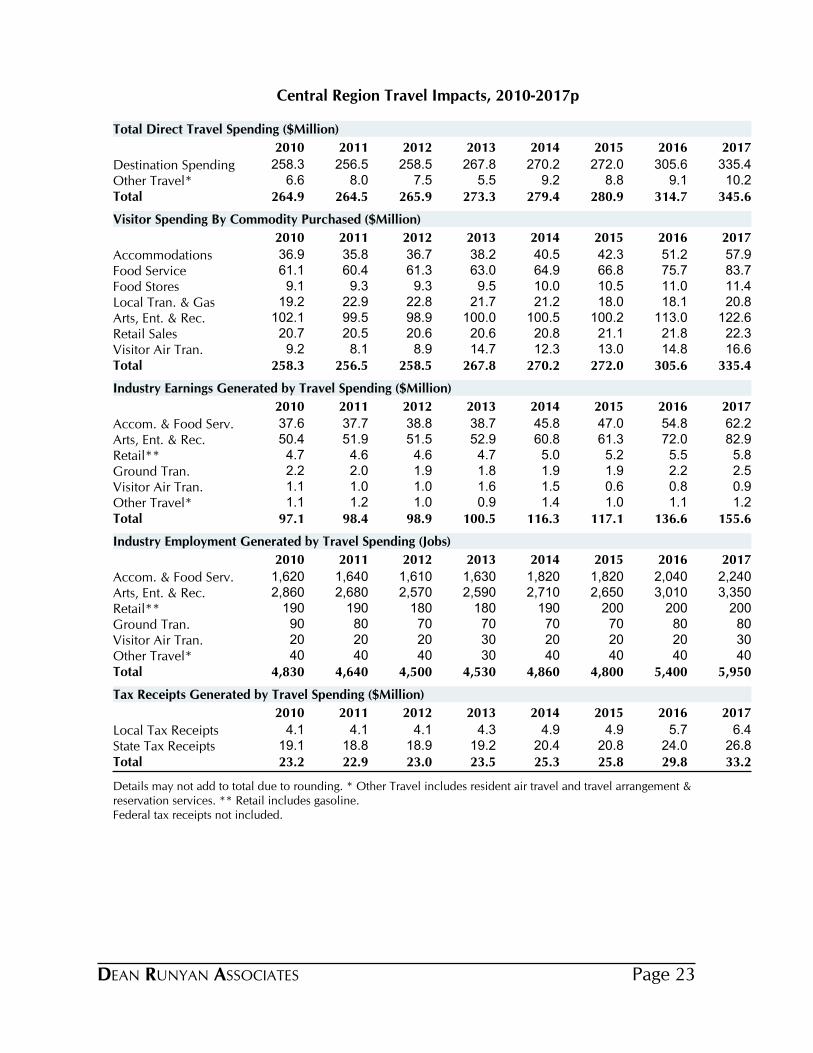
Central Region Travel Impacts, 2010-2017p
2010 2011 2012 2013 2014 2015 2016 2017
Destination Spending 258.3 256.5 258.5 267.8 270.2 272.0 305.6 335.4Other Travel* 6.6 8.0 7.5 5.5 9.2 8.8 9.1 10.2Total 264.9 264.5 265.9 273.3 279.4 280.9 314.7 345.6
Total Direct Travel Spending ($Million)
2010 2011 2012 2013 2014 2015 2016 2017
Accommodations 36.9 35.8 36.7 38.2 40.5 42.3 51.2 57.9Food Service 61.1 60.4 61.3 63.0 64.9 66.8 75.7 83.7Food Stores 9.1 9.3 9.3 9.5 10.0 10.5 11.0 11.4Local Tran. & Gas 19.2 22.9 22.8 21.7 21.2 18.0 18.1 20.8Arts, Ent. & Rec. 102.1 99.5 98.9 100.0 100.5 100.2 113.0 122.6Retail Sales 20.7 20.5 20.6 20.6 20.8 21.1 21.8 22.3Visitor Air Tran. 9.2 8.1 8.9 14.7 12.3 13.0 14.8 16.6Total 258.3 256.5 258.5 267.8 270.2 272.0 305.6 335.4
Visitor Spending By Commodity Purchased ($Million)
2010 2011 2012 2013 2014 2015 2016 2017
Accom. & Food Serv. 37.6 37.7 38.8 38.7 45.8 47.0 54.8 62.2Arts, Ent. & Rec. 50.4 51.9 51.5 52.9 60.8 61.3 72.0 82.9Retail** 4.7 4.6 4.6 4.7 5.0 5.2 5.5 5.8Ground Tran. 2.2 2.0 1.9 1.8 1.9 1.9 2.2 2.5Visitor Air Tran. 1.1 1.0 1.0 1.6 1.5 0.6 0.8 0.9Other Travel* 1.1 1.2 1.0 0.9 1.4 1.0 1.1 1.2Total 97.1 98.4 98.9 100.5 116.3 117.1 136.6 155.6
Industry Earnings Generated by Travel Spending ($Million)
2010 2011 2012 2013 2014 2015 2016 2017
Accom. & Food Serv. 1,620 1,640 1,610 1,630 1,820 1,820 2,040 2,240Arts, Ent. & Rec. 2,860 2,680 2,570 2,590 2,710 2,650 3,010 3,350Retail** 190 190 180 180 190 200 200 200Ground Tran. 90 80 70 70 70 70 80 80Visitor Air Tran. 20 20 20 30 20 20 20 30Other Travel* 40 40 40 30 40 40 40 40Total 4,830 4,640 4,500 4,530 4,860 4,800 5,400 5,950
Industry Employment Generated by Travel Spending (Jobs)
2010 2011 2012 2013 2014 2015 2016 2017
Local Tax Receipts 4.1 4.1 4.1 4.3 4.9 4.9 5.7 6.4State Tax Receipts 19.1 18.8 18.9 19.2 20.4 20.8 24.0 26.8Total 23.2 22.9 23.0 23.5 25.3 25.8 29.8 33.2
Tax Receipts Generated by Travel Spending ($Million)
Details may not add to total due to rounding. * Other Travel includes resident air travel and travel arrangement & reservation services. ** Retail includes gasoline.Federal tax receipts not included.
DEAN RUNYAN ASSOCIATES Page 23

Central Region Visitor Spending and Visitor Volume
Visitor Spending by Type of Traveler Accommodation ($Million), 2017p
2010 2012 2014 2015 2016 2017
Total Destination Spending 258 258 270 272 306 335All Overnight 252 252 263 265 298 327
Hotel, Motel, STVR* 181 178 186 186 216 243
Private Home 38 40 42 42 45 47
Other Overnight 33 34 35 37 37 38
Day Travel 7 7 7 7 8 8
Day Travel 7 7 7 7 8 8
Average Expenditures for Overnight Visitors, 2017p
Travel Party PersonParty Length of
Day Trip Day Trip Size Stay (Nights)
$674 $1,801 $252 $675Hotel, Motel, STVR* 2.7 2.7
$195 $565 $74 $214Private Home 2.6 2.9
$132 $461 $45 $156Other Overnight 3.0 3.5
$369 $1,092 $134 $398 All Overnight 2.8 3.0
Overnight Visitor Volume, 2015-2017p
Person-Nights (000) Party-Nights (000)
2015 2016 2017 2015 2016 2017
Hotel, Motel, STVR* 793 880 962 297 329 360
Private Home 609 622 631 231 237 241
Other Overnight 833 840 848 281 284 286
All Overnight 2,236 2,343 2,440 809 850 887
Person-Trips (000) Party-Trips (000)
2015 2016 2017 2015 2016 2017
Hotel, Motel, STVR* 296 329 360 111 123 135
Private Home 212 216 219 80 82 83
Other Overnight 239 241 243 81 81 82
All Overnight 747 786 822 271 286 300
"Hotel, Motel, STVR" category includes all lodging where a lodging tax is collected except campgrounds. "Other Overnight" category includes campgrounds and vacation homes.
DEAN RUNYAN ASSOCIATESPage 24
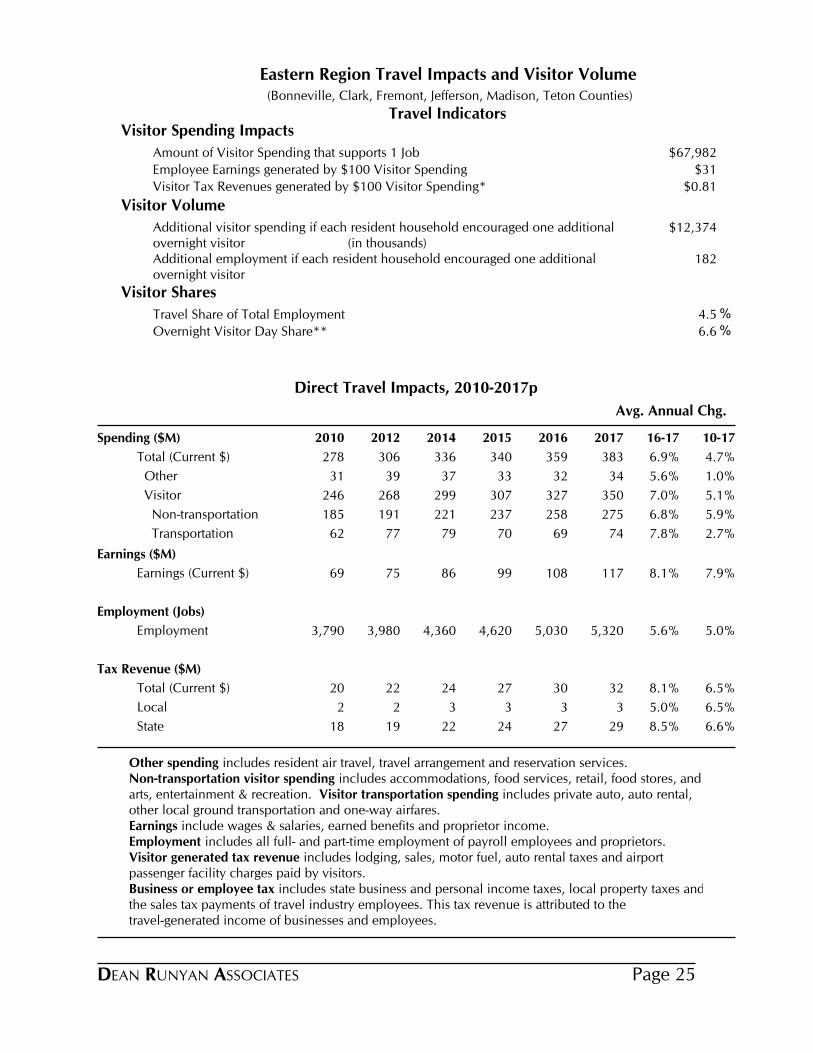
Eastern Region Travel Impacts and Visitor Volume
Travel Indicators (Bonneville, Clark, Fremont, Jefferson, Madison, Teton Counties)
Visitor Spending Impacts
Amount of Visitor Spending that supports 1 Job $67,982
Employee Earnings generated by $100 Visitor Spending $31
Visitor Tax Revenues generated by $100 Visitor Spending* $0.81
Visitor Volume
Additional visitor spending if each resident household encouraged one additional overnight visitor (in thousands)
$12,374
Additional employment if each resident household encouraged one additional overnight visitor
182
Visitor Shares
Travel Share of Total Employment 4.5%
Overnight Visitor Day Share** 6.6%
Direct Travel Impacts, 2010-2017p
Avg. Annual Chg.
Spending ($M) 2010 2012 2014 2015 2016 2017 16-17 10-17
Total (Current $) 278 306 336 340 359 383 6.9% 4.7%
Other 31 39 37 33 32 34 5.6% 1.0%
Visitor 246 268 299 307 327 350 7.0% 5.1%
Non-transportation 185 191 221 237 258 275 6.8% 5.9%
Transportation 62 77 79 70 69 74 7.8% 2.7%
Earnings ($M)
Earnings (Current $) 69 75 86 99 108 117 8.1% 7.9%
Employment (Jobs)
Employment 3,790 3,980 4,360 4,620 5,030 5,320 5.6% 5.0%
Tax Revenue ($M)
Total (Current $) 20 22 24 27 30 32 8.1% 6.5%
Local 2 2 3 3 3 3 5.0% 6.5%
State 18 19 22 24 27 29 8.5% 6.6%
Other spending includes resident air travel, travel arrangement and reservation services. Non-transportation visitor spending includes accommodations, food services, retail, food stores, and arts, entertainment & recreation. Visitor transportation spending includes private auto, auto rental, other local ground transportation and one-way airfares.Earnings include wages & salaries, earned benefits and proprietor income.Employment includes all full- and part-time employment of payroll employees and proprietors.Visitor generated tax revenue includes lodging, sales, motor fuel, auto rental taxes and airport passenger facility charges paid by visitors.Business or employee tax includes state business and personal income taxes, local property taxes and the sales tax payments of travel industry employees. This tax revenue is attributed to the travel-generated income of businesses and employees.
DEAN RUNYAN ASSOCIATES Page 25
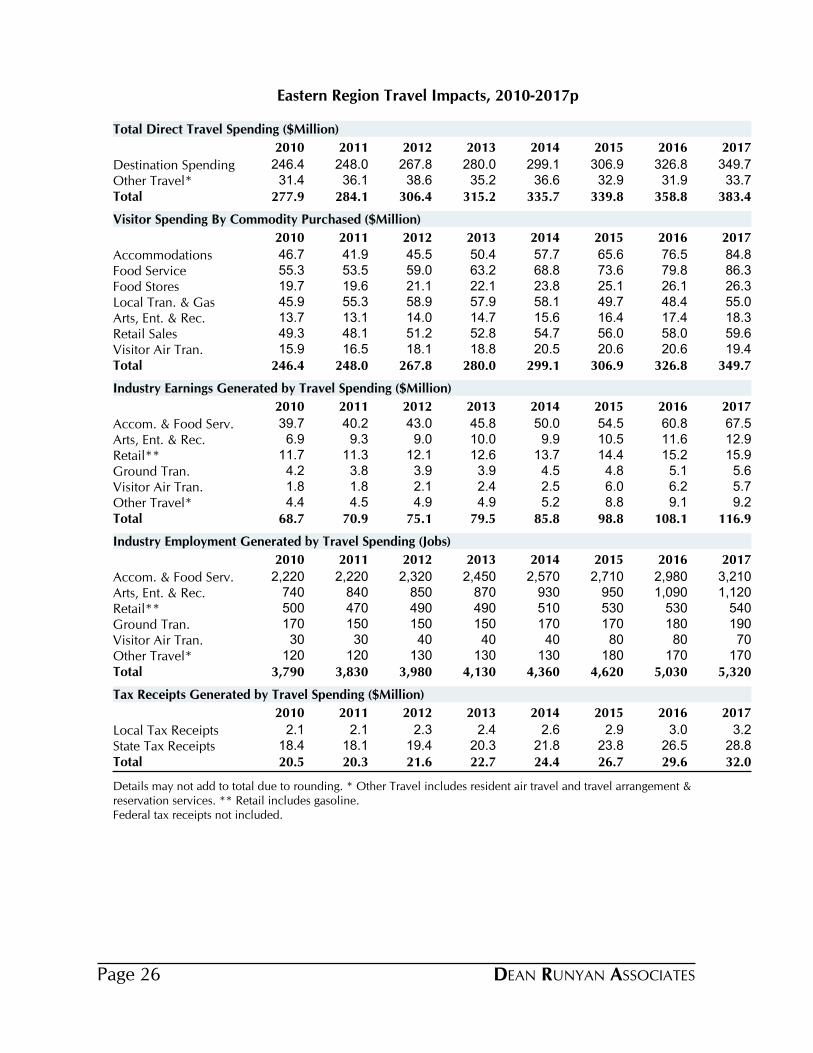
Eastern Region Travel Impacts, 2010-2017p
2010 2011 2012 2013 2014 2015 2016 2017
Destination Spending 246.4 248.0 267.8 280.0 299.1 306.9 326.8 349.7Other Travel* 31.4 36.1 38.6 35.2 36.6 32.9 31.9 33.7Total 277.9 284.1 306.4 315.2 335.7 339.8 358.8 383.4
Total Direct Travel Spending ($Million)
2010 2011 2012 2013 2014 2015 2016 2017
Accommodations 46.7 41.9 45.5 50.4 57.7 65.6 76.5 84.8Food Service 55.3 53.5 59.0 63.2 68.8 73.6 79.8 86.3Food Stores 19.7 19.6 21.1 22.1 23.8 25.1 26.1 26.3Local Tran. & Gas 45.9 55.3 58.9 57.9 58.1 49.7 48.4 55.0Arts, Ent. & Rec. 13.7 13.1 14.0 14.7 15.6 16.4 17.4 18.3Retail Sales 49.3 48.1 51.2 52.8 54.7 56.0 58.0 59.6Visitor Air Tran. 15.9 16.5 18.1 18.8 20.5 20.6 20.6 19.4Total 246.4 248.0 267.8 280.0 299.1 306.9 326.8 349.7
Visitor Spending By Commodity Purchased ($Million)
2010 2011 2012 2013 2014 2015 2016 2017
Accom. & Food Serv. 39.7 40.2 43.0 45.8 50.0 54.5 60.8 67.5Arts, Ent. & Rec. 6.9 9.3 9.0 10.0 9.9 10.5 11.6 12.9Retail** 11.7 11.3 12.1 12.6 13.7 14.4 15.2 15.9Ground Tran. 4.2 3.8 3.9 3.9 4.5 4.8 5.1 5.6Visitor Air Tran. 1.8 1.8 2.1 2.4 2.5 6.0 6.2 5.7Other Travel* 4.4 4.5 4.9 4.9 5.2 8.8 9.1 9.2Total 68.7 70.9 75.1 79.5 85.8 98.8 108.1 116.9
Industry Earnings Generated by Travel Spending ($Million)
2010 2011 2012 2013 2014 2015 2016 2017
Accom. & Food Serv. 2,220 2,220 2,320 2,450 2,570 2,710 2,980 3,210Arts, Ent. & Rec. 740 840 850 870 930 950 1,090 1,120Retail** 500 470 490 490 510 530 530 540Ground Tran. 170 150 150 150 170 170 180 190Visitor Air Tran. 30 30 40 40 40 80 80 70Other Travel* 120 120 130 130 130 180 170 170Total 3,790 3,830 3,980 4,130 4,360 4,620 5,030 5,320
Industry Employment Generated by Travel Spending (Jobs)
2010 2011 2012 2013 2014 2015 2016 2017
Local Tax Receipts 2.1 2.1 2.3 2.4 2.6 2.9 3.0 3.2State Tax Receipts 18.4 18.1 19.4 20.3 21.8 23.8 26.5 28.8Total 20.5 20.3 21.6 22.7 24.4 26.7 29.6 32.0
Tax Receipts Generated by Travel Spending ($Million)
Details may not add to total due to rounding. * Other Travel includes resident air travel and travel arrangement & reservation services. ** Retail includes gasoline.Federal tax receipts not included.
DEAN RUNYAN ASSOCIATESPage 26

Eastern Region Visitor Spending and Visitor Volume
Visitor Spending by Type of Traveler Accommodation ($Million), 2017p
2010 2012 2014 2015 2016 2017
Total Destination Spending 246 268 299 307 327 350All Overnight 189 206 233 240 258 277
Hotel, Motel, STVR* 112 117 142 152 169 186
Private Home 51 61 61 57 57 59
Other Overnight 27 28 30 31 33 32
Day Travel 57 62 66 66 69 73
Day Travel 57 62 66 66 69 73
Average Expenditures for Overnight Visitors, 2017p
Travel Party PersonParty Length of
Day Trip Day Trip Size Stay (Nights)
$272 $741 $111 $302Hotel, Motel, STVR* 2.4 2.7
$62 $232 $23 $85Private Home 2.7 3.7
$120 $419 $40 $141Other Overnight 3.0 3.5
$146 $476 $55 $180 All Overnight 2.6 3.3
Overnight Visitor Volume, 2015-2017p
Person-Nights (000) Party-Nights (000)
2015 2016 2017 2015 2016 2017
Hotel, Motel, STVR* 1,455 1,555 1,673 598 637 684
Private Home 2,447 2,491 2,558 913 929 952
Other Overnight 766 819 779 258 275 262
All Overnight 4,668 4,864 5,010 1,769 1,842 1,898
Person-Trips (000) Party-Trips (000)
2015 2016 2017 2015 2016 2017
Hotel, Motel, STVR* 536 572 616 219 234 251
Private Home 670 682 700 246 250 256
Other Overnight 220 235 223 74 79 75
All Overnight 1,426 1,488 1,539 539 562 582
"Hotel, Motel, STVR" category includes all lodging where a lodging tax is collected except campgrounds. "Other Overnight" category includes campgrounds and vacation homes.
DEAN RUNYAN ASSOCIATES Page 27
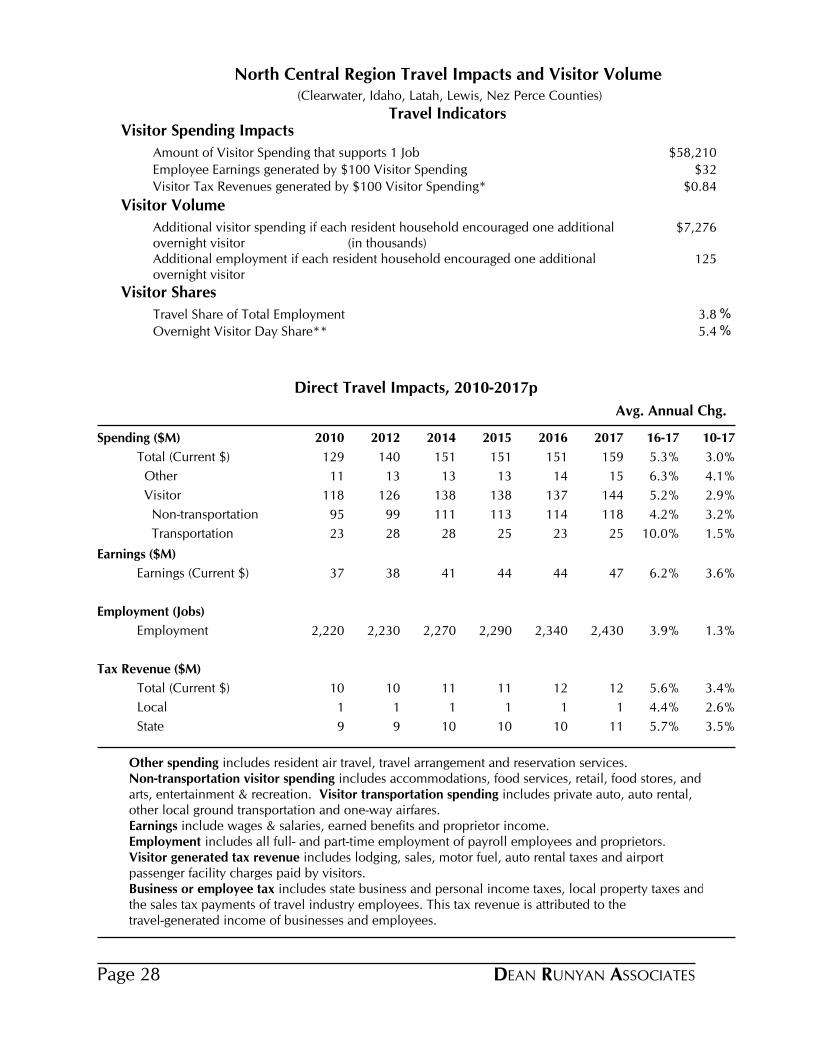
North Central Region Travel Impacts and Visitor Volume
Travel Indicators (Clearwater, Idaho, Latah, Lewis, Nez Perce Counties)
Visitor Spending Impacts
Amount of Visitor Spending that supports 1 Job $58,210
Employee Earnings generated by $100 Visitor Spending $32
Visitor Tax Revenues generated by $100 Visitor Spending* $0.84
Visitor Volume
Additional visitor spending if each resident household encouraged one additional overnight visitor (in thousands)
$7,276
Additional employment if each resident household encouraged one additional overnight visitor
125
Visitor Shares
Travel Share of Total Employment 3.8%
Overnight Visitor Day Share** 5.4%
Direct Travel Impacts, 2010-2017p
Avg. Annual Chg.
Spending ($M) 2010 2012 2014 2015 2016 2017 16-17 10-17
Total (Current $) 129 140 151 151 151 159 5.3% 3.0%
Other 11 13 13 13 14 15 6.3% 4.1%
Visitor 118 126 138 138 137 144 5.2% 2.9%
Non-transportation 95 99 111 113 114 118 4.2% 3.2%
Transportation 23 28 28 25 23 25 10.0% 1.5%
Earnings ($M)
Earnings (Current $) 37 38 41 44 44 47 6.2% 3.6%
Employment (Jobs)
Employment 2,220 2,230 2,270 2,290 2,340 2,430 3.9% 1.3%
Tax Revenue ($M)
Total (Current $) 10 10 11 11 12 12 5.6% 3.4%
Local 1 1 1 1 1 1 4.4% 2.6%
State 9 9 10 10 10 11 5.7% 3.5%
Other spending includes resident air travel, travel arrangement and reservation services. Non-transportation visitor spending includes accommodations, food services, retail, food stores, and arts, entertainment & recreation. Visitor transportation spending includes private auto, auto rental, other local ground transportation and one-way airfares.Earnings include wages & salaries, earned benefits and proprietor income.Employment includes all full- and part-time employment of payroll employees and proprietors.Visitor generated tax revenue includes lodging, sales, motor fuel, auto rental taxes and airport passenger facility charges paid by visitors.Business or employee tax includes state business and personal income taxes, local property taxes and the sales tax payments of travel industry employees. This tax revenue is attributed to the travel-generated income of businesses and employees.
DEAN RUNYAN ASSOCIATESPage 28

North Central Region Travel Impacts, 2010-2017p
2010 2011 2012 2013 2014 2015 2016 2017
Destination Spending 117.9 123.4 126.2 132.2 138.4 137.9 136.5 143.6Other Travel* 11.5 12.5 13.4 13.0 12.6 12.7 14.3 15.2Total 129.4 136.0 139.6 145.2 150.9 150.6 150.8 158.7
Total Direct Travel Spending ($Million)
2010 2011 2012 2013 2014 2015 2016 2017
Accommodations 24.5 23.7 24.9 26.6 29.4 30.7 31.2 32.5Food Service 28.1 28.6 30.0 32.2 34.0 35.5 35.8 37.9Food Stores 9.3 9.6 9.8 10.2 11.0 10.7 10.7 10.9Local Tran. & Gas 17.6 21.8 22.2 21.8 21.6 18.1 16.6 18.6Arts, Ent. & Rec. 12.0 12.4 12.2 13.0 13.4 13.5 13.4 14.0Retail Sales 21.4 21.9 21.8 22.6 23.0 22.8 22.5 23.1Visitor Air Tran. 5.1 5.5 5.5 5.7 6.0 6.5 6.3 6.6Total 117.9 123.4 126.2 132.2 138.4 137.9 136.5 143.6
Visitor Spending By Commodity Purchased ($Million)
2010 2011 2012 2013 2014 2015 2016 2017
Accom. & Food Serv. 20.7 20.9 22.0 22.4 23.2 24.2 24.4 26.0Arts, Ent. & Rec. 7.0 7.3 7.1 7.6 7.9 8.0 8.1 8.8Retail** 4.6 4.6 4.6 4.8 5.2 5.2 5.2 5.5Ground Tran. 1.9 1.8 1.8 1.7 1.9 2.0 2.0 2.1Visitor Air Tran. 0.7 0.7 0.7 0.8 0.8 1.5 1.4 1.4Other Travel* 2.0 2.0 2.2 2.2 2.0 3.0 3.3 3.4Total 36.8 37.2 38.3 39.5 40.9 43.9 44.3 47.1
Industry Earnings Generated by Travel Spending ($Million)
2010 2011 2012 2013 2014 2015 2016 2017
Accom. & Food Serv. 1,320 1,320 1,340 1,350 1,350 1,370 1,380 1,420Arts, Ent. & Rec. 560 580 560 580 580 570 600 640Retail** 200 190 200 200 210 200 200 200Ground Tran. 80 70 70 70 70 70 70 70Visitor Air Tran. 10 10 10 10 10 20 20 20Other Travel* 50 50 60 50 50 60 70 80Total 2,220 2,230 2,230 2,270 2,270 2,290 2,340 2,430
Industry Employment Generated by Travel Spending (Jobs)
2010 2011 2012 2013 2014 2015 2016 2017
Local Tax Receipts 1.2 1.2 1.2 1.2 1.3 1.4 1.3 1.4State Tax Receipts 8.5 8.6 8.8 9.2 9.6 10.0 10.3 10.8Total 9.7 9.7 10.0 10.4 10.9 11.4 11.6 12.2
Tax Receipts Generated by Travel Spending ($Million)
Details may not add to total due to rounding. * Other Travel includes resident air travel and travel arrangement & reservation services. ** Retail includes gasoline.Federal tax receipts not included.
DEAN RUNYAN ASSOCIATES Page 29

North Central Region Visitor Spending and Visitor Volume
Visitor Spending by Type of Traveler Accommodation ($Million), 2017p
2010 2012 2014 2015 2016 2017
Total Destination Spending 118 126 138 138 137 144All Overnight 91 99 109 109 108 113
Hotel, Motel, STVR* 56 60 68 72 71 75
Private Home 21 23 23 23 22 23
Other Overnight 14 15 17 14 15 15
Day Travel 26 27 30 29 29 30
Day Travel 26 27 30 29 29 30
Average Expenditures for Overnight Visitors, 2017p
Travel Party PersonParty Length of
Day Trip Day Trip Size Stay (Nights)
$266 $739 $105 $292Hotel, Motel, STVR* 2.5 2.8
$56 $195 $21 $72Private Home 2.7 3.5
$125 $437 $42 $147Other Overnight 3.0 3.5
$137 $440 $51 $164 All Overnight 2.7 3.2
Overnight Visitor Volume, 2015-2017p
Person-Nights (000) Party-Nights (000)
2015 2016 2017 2015 2016 2017
Hotel, Motel, STVR* 703 674 691 277 265 273
Private Home 1,108 1,086 1,111 412 404 414
Other Overnight 337 357 354 113 120 119
All Overnight 2,149 2,117 2,156 802 788 805
Person-Trips (000) Party-Trips (000)
2015 2016 2017 2015 2016 2017
Hotel, Motel, STVR* 252 242 248 99 95 98
Private Home 324 317 324 119 116 119
Other Overnight 97 102 101 32 34 34
All Overnight 673 661 674 250 246 251
"Hotel, Motel, STVR" category includes all lodging where a lodging tax is collected except campgrounds. "Other Overnight" category includes campgrounds and vacation homes.
DEAN RUNYAN ASSOCIATESPage 30

Northern Region Travel Impacts and Visitor Volume
Travel Indicators (Benewah, Bonner, Boundary, Kootenai, Shoshone Counties)
Visitor Spending Impacts
Amount of Visitor Spending that supports 1 Job $60,108
Employee Earnings generated by $100 Visitor Spending $43
Visitor Tax Revenues generated by $100 Visitor Spending* $1.06
Visitor Volume
Additional visitor spending if each resident household encouraged one additional overnight visitor (in thousands)
$26,128
Additional employment if each resident household encouraged one additional overnight visitor
435
Visitor Shares
Travel Share of Total Employment 8.2%
Overnight Visitor Day Share** 7.1%
Direct Travel Impacts, 2010-2017p
Avg. Annual Chg.
Spending ($M) 2010 2012 2014 2015 2016 2017 16-17 10-17
Total (Current $) 551 627 689 710 726 754 3.8% 4.6%
Other 11 12 11 10 10 12 18.2% 1.7%
Visitor 541 614 678 700 716 741 3.6% 4.6%
Non-transportation 487 543 609 641 660 680 2.9% 4.9%
Transportation 54 71 69 59 55 62 11.6% 2.0%
Earnings ($M)
Earnings (Current $) 192 208 236 250 261 275 5.3% 5.3%
Employment (Jobs)
Employment 9,160 9,470 9,840 10,100 10,190 10,520 3.3% 2.0%
Tax Revenue ($M)
Total (Current $) 43 47 52 55 58 61 4.8% 5.1%
Local 5 6 7 7 7 8 3.8% 4.9%
State 37 41 45 48 50 53 4.9% 5.1%
Other spending includes resident air travel, travel arrangement and reservation services. Non-transportation visitor spending includes accommodations, food services, retail, food stores, and arts, entertainment & recreation. Visitor transportation spending includes private auto, auto rental, other local ground transportation and one-way airfares.Earnings include wages & salaries, earned benefits and proprietor income.Employment includes all full- and part-time employment of payroll employees and proprietors.Visitor generated tax revenue includes lodging, sales, motor fuel, auto rental taxes and airport passenger facility charges paid by visitors.Business or employee tax includes state business and personal income taxes, local property taxes and the sales tax payments of travel industry employees. This tax revenue is attributed to the travel-generated income of businesses and employees.
DEAN RUNYAN ASSOCIATES Page 31
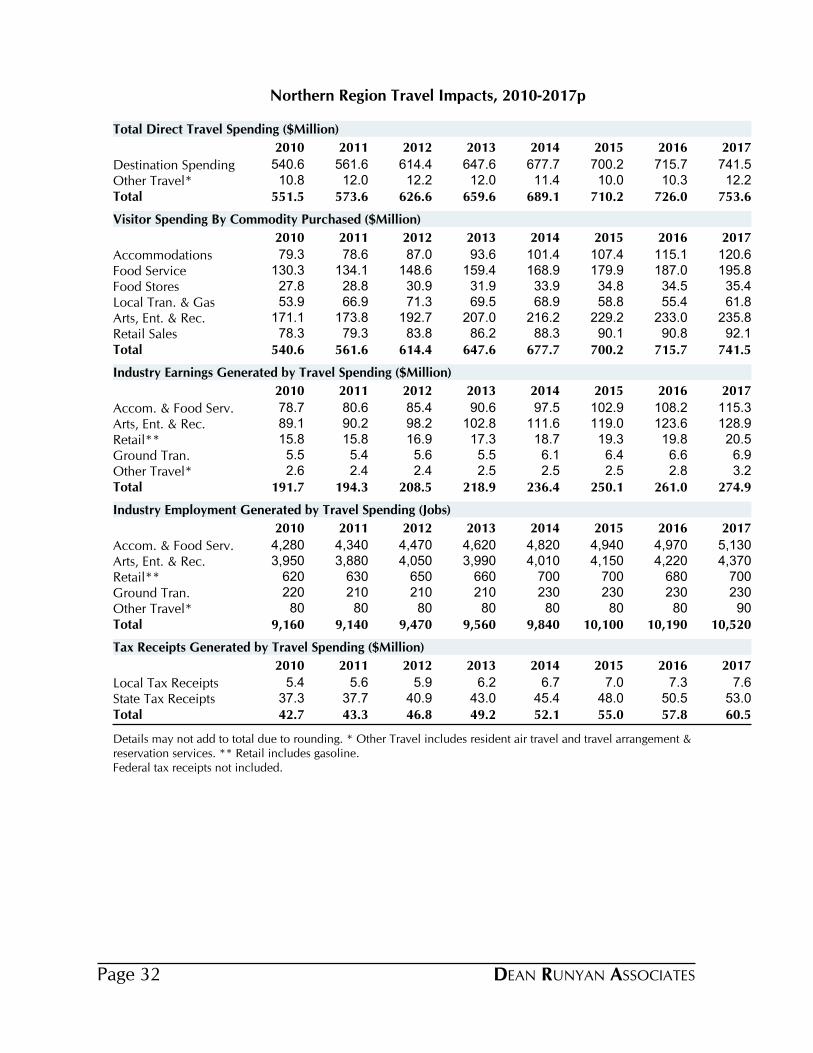
Northern Region Travel Impacts, 2010-2017p
2010 2011 2012 2013 2014 2015 2016 2017
Destination Spending 540.6 561.6 614.4 647.6 677.7 700.2 715.7 741.5Other Travel* 10.8 12.0 12.2 12.0 11.4 10.0 10.3 12.2Total 551.5 573.6 626.6 659.6 689.1 710.2 726.0 753.6
Total Direct Travel Spending ($Million)
2010 2011 2012 2013 2014 2015 2016 2017
Accommodations 79.3 78.6 87.0 93.6 101.4 107.4 115.1 120.6Food Service 130.3 134.1 148.6 159.4 168.9 179.9 187.0 195.8Food Stores 27.8 28.8 30.9 31.9 33.9 34.8 34.5 35.4Local Tran. & Gas 53.9 66.9 71.3 69.5 68.9 58.8 55.4 61.8Arts, Ent. & Rec. 171.1 173.8 192.7 207.0 216.2 229.2 233.0 235.8Retail Sales 78.3 79.3 83.8 86.2 88.3 90.1 90.8 92.1Total 540.6 561.6 614.4 647.6 677.7 700.2 715.7 741.5
Visitor Spending By Commodity Purchased ($Million)
2010 2011 2012 2013 2014 2015 2016 2017
Accom. & Food Serv. 78.7 80.6 85.4 90.6 97.5 102.9 108.2 115.3Arts, Ent. & Rec. 89.1 90.2 98.2 102.8 111.6 119.0 123.6 128.9Retail** 15.8 15.8 16.9 17.3 18.7 19.3 19.8 20.5Ground Tran. 5.5 5.4 5.6 5.5 6.1 6.4 6.6 6.9Other Travel* 2.6 2.4 2.4 2.5 2.5 2.5 2.8 3.2Total 191.7 194.3 208.5 218.9 236.4 250.1 261.0 274.9
Industry Earnings Generated by Travel Spending ($Million)
2010 2011 2012 2013 2014 2015 2016 2017
Accom. & Food Serv. 4,280 4,340 4,470 4,620 4,820 4,940 4,970 5,130Arts, Ent. & Rec. 3,950 3,880 4,050 3,990 4,010 4,150 4,220 4,370Retail** 620 630 650 660 700 700 680 700Ground Tran. 220 210 210 210 230 230 230 230Other Travel* 80 80 80 80 80 80 80 90Total 9,160 9,140 9,470 9,560 9,840 10,100 10,190 10,520
Industry Employment Generated by Travel Spending (Jobs)
2010 2011 2012 2013 2014 2015 2016 2017
Local Tax Receipts 5.4 5.6 5.9 6.2 6.7 7.0 7.3 7.6State Tax Receipts 37.3 37.7 40.9 43.0 45.4 48.0 50.5 53.0Total 42.7 43.3 46.8 49.2 52.1 55.0 57.8 60.5
Tax Receipts Generated by Travel Spending ($Million)
Details may not add to total due to rounding. * Other Travel includes resident air travel and travel arrangement & reservation services. ** Retail includes gasoline.Federal tax receipts not included.
DEAN RUNYAN ASSOCIATESPage 32
Northern Region Visitor Spending and Visitor Volume
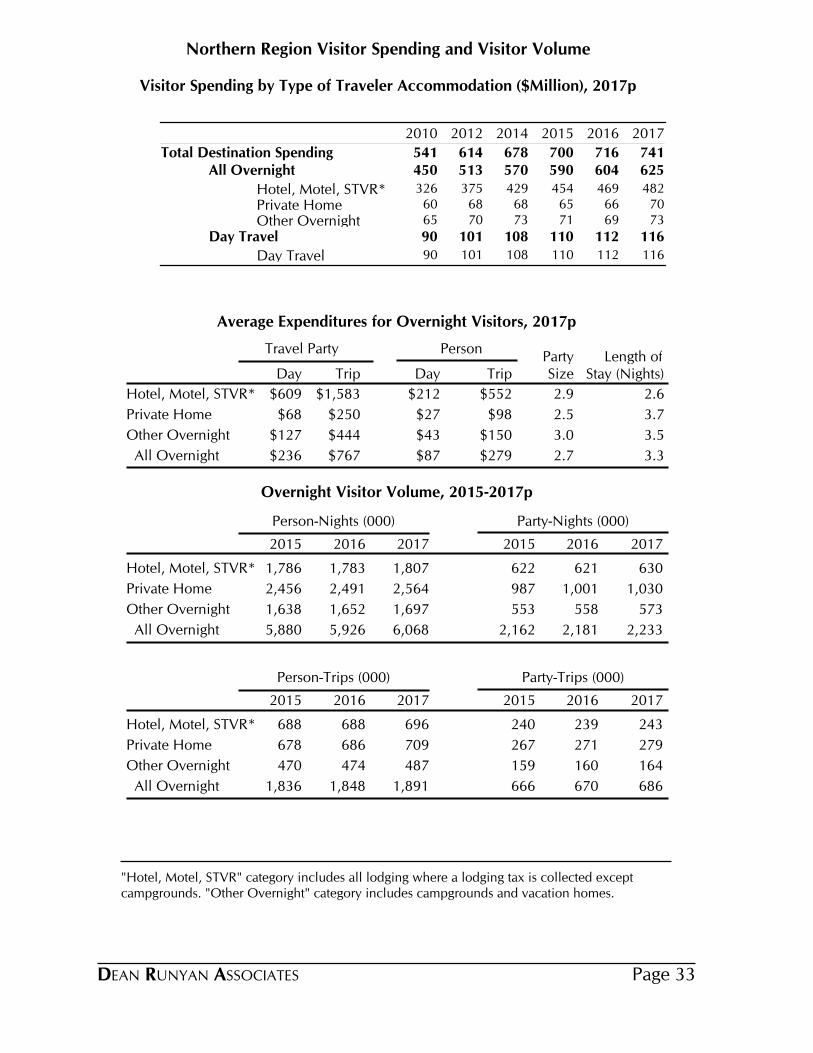
Visitor Spending by Type of Traveler Accommodation ($Million), 2017p
2010 2012 2014 2015 2016 2017
Total Destination Spending 541 614 678 700 716 741All Overnight 450 513 570 590 604 625
Hotel, Motel, STVR* 326 375 429 454 469 482
Private Home 60 68 68 65 66 70
Other Overnight 65 70 73 71 69 73
Day Travel 90 101 108 110 112 116
Day Travel 90 101 108 110 112 116
Average Expenditures for Overnight Visitors, 2017p
Travel Party PersonParty Length of
Day Trip Day Trip Size Stay (Nights)
$609 $1,583 $212 $552Hotel, Motel, STVR* 2.9 2.6
$68 $250 $27 $98Private Home 2.5 3.7
$127 $444 $43 $150Other Overnight 3.0 3.5
$236 $767 $87 $279 All Overnight 2.7 3.3
Overnight Visitor Volume, 2015-2017p
Person-Nights (000) Party-Nights (000)
2015 2016 2017 2015 2016 2017
Hotel, Motel, STVR* 1,786 1,783 1,807 622 621 630
Private Home 2,456 2,491 2,564 987 1,001 1,030
Other Overnight 1,638 1,652 1,697 553 558 573
All Overnight 5,880 5,926 6,068 2,162 2,181 2,233
Person-Trips (000) Party-Trips (000)
2015 2016 2017 2015 2016 2017
Hotel, Motel, STVR* 688 688 696 240 239 243
Private Home 678 686 709 267 271 279
Other Overnight 470 474 487 159 160 164
All Overnight 1,836 1,848 1,891 666 670 686
"Hotel, Motel, STVR" category includes all lodging where a lodging tax is collected except campgrounds. "Other Overnight" category includes campgrounds and vacation homes.
DEAN RUNYAN ASSOCIATES Page 33

South Central Region Travel Impacts and Visitor Volume
Travel Indicators (Camas, Cassia, Gooding, Jerome, Lincoln, Minidoka, Twin Falls Counties)
Visitor Spending Impacts
Amount of Visitor Spending that supports 1 Job $67,008
Employee Earnings generated by $100 Visitor Spending $28
Visitor Tax Revenues generated by $100 Visitor Spending* $0.71
Visitor Volume
Additional visitor spending if each resident household encouraged one additional overnight visitor (in thousands)
$9,393
Additional employment if each resident household encouraged one additional overnight visitor
140
Visitor Shares
Travel Share of Total Employment 2.9%
Overnight Visitor Day Share** 4.9%
Direct Travel Impacts, 2010-2017p
Avg. Annual Chg.
Spending ($M) 2010 2012 2014 2015 2016 2017 16-17 10-17
Total (Current $) 151 173 186 190 204 209 2.3% 4.7%
Other 7 8 13 11 11 13 14.3% 8.1%
Visitor 144 165 173 180 193 196 1.6% 4.5%
Non-transportation 115 127 136 147 161 161 0.3% 4.9%
Transportation 29 37 38 33 33 35 7.9% 3.0%
Earnings ($M)
Earnings (Current $) 38 41 45 50 56 57 2.9% 6.1%
Employment (Jobs)
Employment 2,270 2,380 2,650 2,850 3,020 3,020 0.0% 4.1%
Tax Revenue ($M)
Total (Current $) 12 13 14 15 16 17 2.2% 5.3%
Local 1 1 1 1 1 1 1.4% 5.1%
State 11 12 12 13 15 15 2.2% 5.4%
Other spending includes resident air travel, travel arrangement and reservation services. Non-transportation visitor spending includes accommodations, food services, retail, food stores, and arts, entertainment & recreation. Visitor transportation spending includes private auto, auto rental, other local ground transportation and one-way airfares.Earnings include wages & salaries, earned benefits and proprietor income.Employment includes all full- and part-time employment of payroll employees and proprietors.Visitor generated tax revenue includes lodging, sales, motor fuel, auto rental taxes and airport passenger facility charges paid by visitors.Business or employee tax includes state business and personal income taxes, local property taxes and the sales tax payments of travel industry employees. This tax revenue is attributed to the travel-generated income of businesses and employees.
DEAN RUNYAN ASSOCIATESPage 34
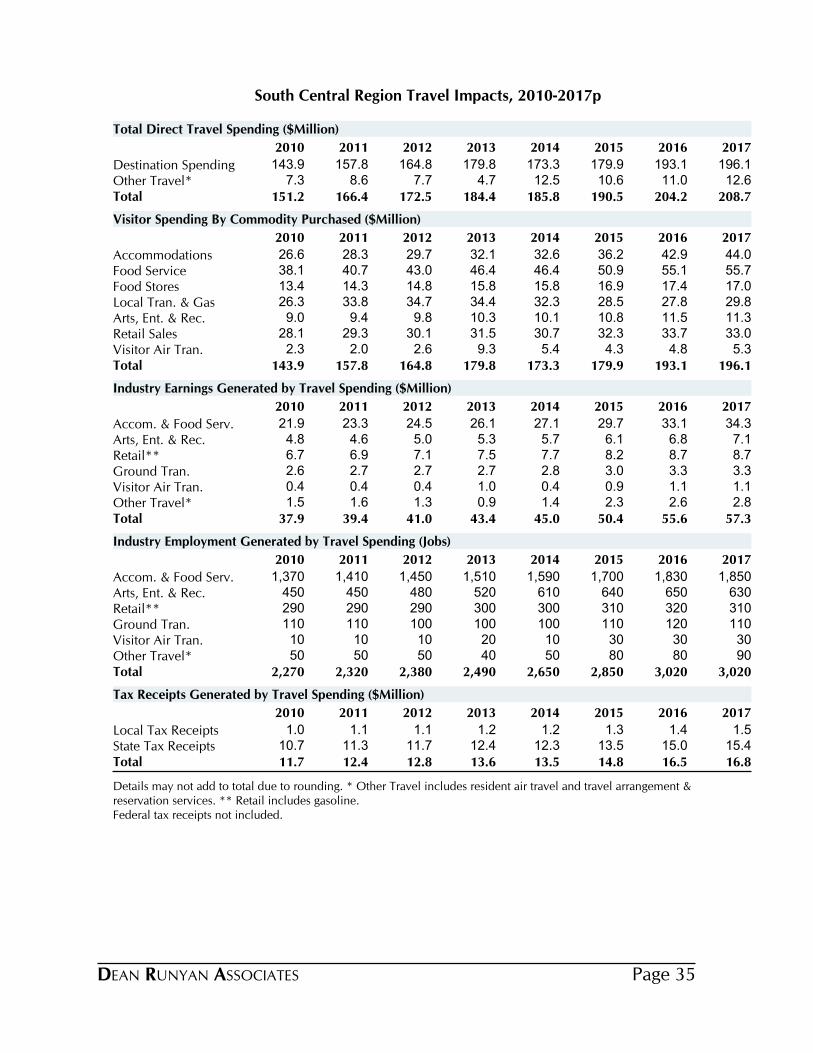
South Central Region Travel Impacts, 2010-2017p
2010 2011 2012 2013 2014 2015 2016 2017
Destination Spending 143.9 157.8 164.8 179.8 173.3 179.9 193.1 196.1Other Travel* 7.3 8.6 7.7 4.7 12.5 10.6 11.0 12.6Total 151.2 166.4 172.5 184.4 185.8 190.5 204.2 208.7
Total Direct Travel Spending ($Million)
2010 2011 2012 2013 2014 2015 2016 2017
Accommodations 26.6 28.3 29.7 32.1 32.6 36.2 42.9 44.0Food Service 38.1 40.7 43.0 46.4 46.4 50.9 55.1 55.7Food Stores 13.4 14.3 14.8 15.8 15.8 16.9 17.4 17.0Local Tran. & Gas 26.3 33.8 34.7 34.4 32.3 28.5 27.8 29.8Arts, Ent. & Rec. 9.0 9.4 9.8 10.3 10.1 10.8 11.5 11.3Retail Sales 28.1 29.3 30.1 31.5 30.7 32.3 33.7 33.0Visitor Air Tran. 2.3 2.0 2.6 9.3 5.4 4.3 4.8 5.3Total 143.9 157.8 164.8 179.8 173.3 179.9 193.1 196.1
Visitor Spending By Commodity Purchased ($Million)
2010 2011 2012 2013 2014 2015 2016 2017
Accom. & Food Serv. 21.9 23.3 24.5 26.1 27.1 29.7 33.1 34.3Arts, Ent. & Rec. 4.8 4.6 5.0 5.3 5.7 6.1 6.8 7.1Retail** 6.7 6.9 7.1 7.5 7.7 8.2 8.7 8.7Ground Tran. 2.6 2.7 2.7 2.7 2.8 3.0 3.3 3.3Visitor Air Tran. 0.4 0.4 0.4 1.0 0.4 0.9 1.1 1.1Other Travel* 1.5 1.6 1.3 0.9 1.4 2.3 2.6 2.8Total 37.9 39.4 41.0 43.4 45.0 50.4 55.6 57.3
Industry Earnings Generated by Travel Spending ($Million)
2010 2011 2012 2013 2014 2015 2016 2017
Accom. & Food Serv. 1,370 1,410 1,450 1,510 1,590 1,700 1,830 1,850Arts, Ent. & Rec. 450 450 480 520 610 640 650 630Retail** 290 290 290 300 300 310 320 310Ground Tran. 110 110 100 100 100 110 120 110Visitor Air Tran. 10 10 10 20 10 30 30 30Other Travel* 50 50 50 40 50 80 80 90Total 2,270 2,320 2,380 2,490 2,650 2,850 3,020 3,020
Industry Employment Generated by Travel Spending (Jobs)
2010 2011 2012 2013 2014 2015 2016 2017
Local Tax Receipts 1.0 1.1 1.1 1.2 1.2 1.3 1.4 1.5State Tax Receipts 10.7 11.3 11.7 12.4 12.3 13.5 15.0 15.4Total 11.7 12.4 12.8 13.6 13.5 14.8 16.5 16.8
Tax Receipts Generated by Travel Spending ($Million)
Details may not add to total due to rounding. * Other Travel includes resident air travel and travel arrangement & reservation services. ** Retail includes gasoline.Federal tax receipts not included.
DEAN RUNYAN ASSOCIATES Page 35

South Central Region Visitor Spending and Visitor Volume
Visitor Spending by Type of Traveler Accommodation ($Million), 2017p
2010 2012 2014 2015 2016 2017
Total Destination Spending 144 165 173 180 193 196All Overnight 103 119 126 131 142 145
Hotel, Motel, STVR* 60 71 77 83 94 96
Private Home 33 37 38 36 36 38
Other Overnight 10 11 11 11 12 11
Day Travel 41 46 47 49 51 51
Day Travel 41 46 47 49 51 51
Average Expenditures for Overnight Visitors, 2017p
Travel Party PersonParty Length of
Day Trip Day Trip Size Stay (Nights)
$255 $693 $104 $281Hotel, Motel, STVR* 2.5 2.7
$52 $189 $19 $68Private Home 2.7 3.6
$140 $492 $46 $162Other Overnight 3.0 3.5
$123 $402 $46 $151 All Overnight 2.7 3.3
Overnight Visitor Volume, 2015-2017p
Person-Nights (000) Party-Nights (000)
2015 2016 2017 2015 2016 2017
Hotel, Motel, STVR* 893 952 924 361 386 375
Private Home 1,972 1,988 1,974 715 722 719
Other Overnight 238 257 243 79 85 80
All Overnight 3,102 3,196 3,141 1,154 1,193 1,174
Person-Trips (000) Party-Trips (000)
2015 2016 2017 2015 2016 2017
Hotel, Motel, STVR* 328 351 340 133 142 138
Private Home 553 554 552 199 200 199
Other Overnight 68 73 69 22 24 23
All Overnight 949 978 962 354 366 360
"Hotel, Motel, STVR" category includes all lodging where a lodging tax is collected except campgrounds. "Other Overnight" category includes campgrounds and vacation homes.
DEAN RUNYAN ASSOCIATESPage 36
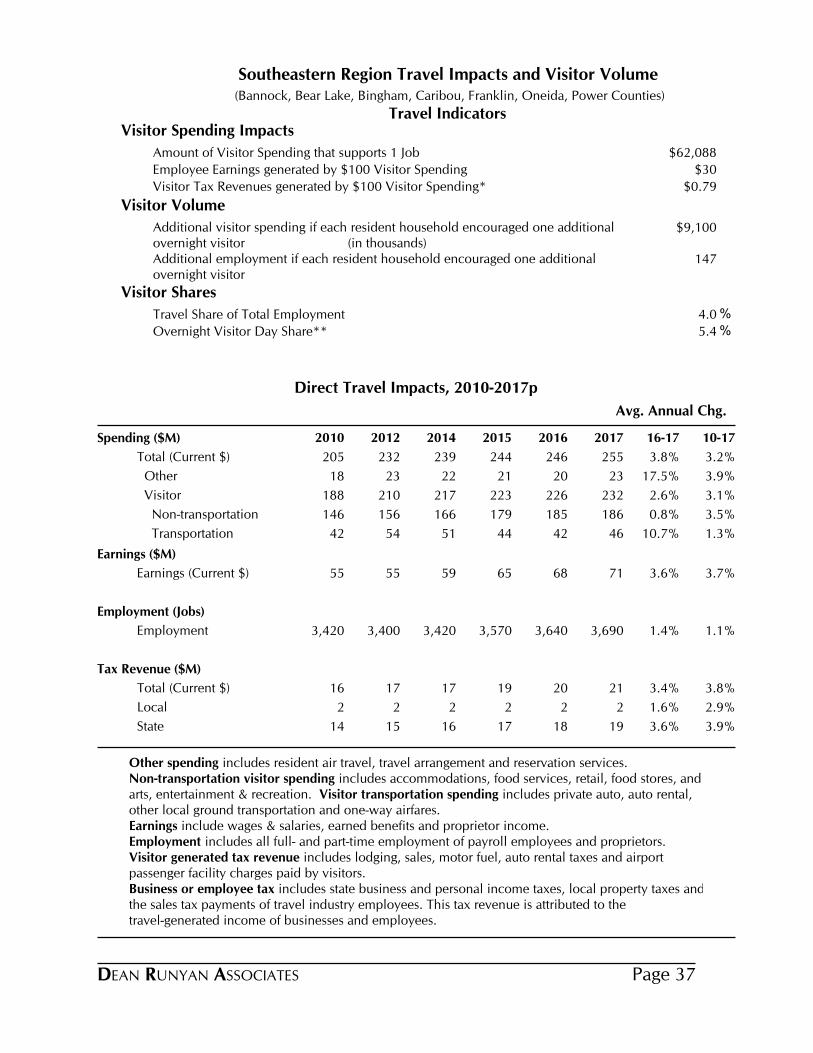
Southeastern Region Travel Impacts and Visitor Volume
Travel Indicators (Bannock, Bear Lake, Bingham, Caribou, Franklin, Oneida, Power Counties)
Visitor Spending Impacts
Amount of Visitor Spending that supports 1 Job $62,088
Employee Earnings generated by $100 Visitor Spending $30
Visitor Tax Revenues generated by $100 Visitor Spending* $0.79
Visitor Volume
Additional visitor spending if each resident household encouraged one additional overnight visitor (in thousands)
$9,100
Additional employment if each resident household encouraged one additional overnight visitor
147
Visitor Shares
Travel Share of Total Employment 4.0%
Overnight Visitor Day Share** 5.4%
Direct Travel Impacts, 2010-2017p
Avg. Annual Chg.
Spending ($M) 2010 2012 2014 2015 2016 2017 16-17 10-17
Total (Current $) 205 232 239 244 246 255 3.8% 3.2%
Other 18 23 22 21 20 23 17.5% 3.9%
Visitor 188 210 217 223 226 232 2.6% 3.1%
Non-transportation 146 156 166 179 185 186 0.8% 3.5%
Transportation 42 54 51 44 42 46 10.7% 1.3%
Earnings ($M)
Earnings (Current $) 55 55 59 65 68 71 3.6% 3.7%
Employment (Jobs)
Employment 3,420 3,400 3,420 3,570 3,640 3,690 1.4% 1.1%
Tax Revenue ($M)
Total (Current $) 16 17 17 19 20 21 3.4% 3.8%
Local 2 2 2 2 2 2 1.6% 2.9%
State 14 15 16 17 18 19 3.6% 3.9%
Other spending includes resident air travel, travel arrangement and reservation services. Non-transportation visitor spending includes accommodations, food services, retail, food stores, and arts, entertainment & recreation. Visitor transportation spending includes private auto, auto rental, other local ground transportation and one-way airfares.Earnings include wages & salaries, earned benefits and proprietor income.Employment includes all full- and part-time employment of payroll employees and proprietors.Visitor generated tax revenue includes lodging, sales, motor fuel, auto rental taxes and airport passenger facility charges paid by visitors.Business or employee tax includes state business and personal income taxes, local property taxes and the sales tax payments of travel industry employees. This tax revenue is attributed to the travel-generated income of businesses and employees.
DEAN RUNYAN ASSOCIATES Page 37

Southeastern Region Travel Impacts, 2010-2017p
2010 2011 2012 2013 2014 2015 2016 2017
Destination Spending 187.6 202.3 209.7 212.7 216.9 222.9 226.0 231.9Other Travel* 17.9 22.7 22.7 19.4 22.1 21.1 19.9 23.4Total 205.4 225.0 232.4 232.0 239.1 244.1 245.9 255.3
Total Direct Travel Spending ($Million)
2010 2011 2012 2013 2014 2015 2016 2017
Accommodations 27.6 28.2 29.6 29.4 32.8 37.1 39.9 39.8Food Service 42.2 43.9 46.4 47.2 50.4 54.4 56.5 58.0Food Stores 15.7 16.4 16.9 17.2 18.3 19.3 19.6 19.6Local Tran. & Gas 39.9 50.8 52.1 49.3 48.3 40.9 38.0 42.0Arts, Ent. & Rec. 23.3 23.7 24.4 24.4 25.5 27.2 27.5 27.6Retail Sales 36.9 37.5 38.3 38.3 39.3 40.9 41.0 41.0Visitor Air Tran. 1.9 1.7 2.0 6.8 2.3 3.1 3.5 4.0Total 187.6 202.3 209.7 212.7 216.9 222.9 226.0 231.9
Visitor Spending By Commodity Purchased ($Million)
2010 2011 2012 2013 2014 2015 2016 2017
Accom. & Food Serv. 25.6 24.7 25.3 25.8 27.0 29.4 31.0 32.1Arts, Ent. & Rec. 14.5 14.7 15.1 15.4 16.2 17.4 17.9 18.4Retail** 8.2 8.2 8.5 8.5 9.2 9.7 10.0 10.2Ground Tran. 3.0 3.0 2.9 2.7 3.0 3.3 3.3 3.4Visitor Air Tran. 0.3 0.2 0.3 0.8 0.3 0.6 1.0 1.0Other Travel* 3.2 3.3 3.2 3.0 3.4 4.3 5.0 5.6Total 54.7 54.1 55.4 56.2 59.1 64.7 68.3 70.7
Industry Earnings Generated by Travel Spending ($Million)
2010 2011 2012 2013 2014 2015 2016 2017
Accom. & Food Serv. 1,630 1,570 1,560 1,560 1,610 1,700 1,740 1,740Arts, Ent. & Rec. 1,080 1,100 1,130 1,120 1,090 1,130 1,170 1,200Retail** 400 410 410 410 420 430 420 430Ground Tran. 120 120 110 100 110 120 120 110Visitor Air Tran. 0 0 0 10 0 10 10 10Other Travel* 180 180 180 180 180 190 190 200Total 3,420 3,380 3,400 3,390 3,420 3,570 3,640 3,690
Industry Employment Generated by Travel Spending (Jobs)
2010 2011 2012 2013 2014 2015 2016 2017
Local Tax Receipts 1.5 1.5 1.5 1.6 1.6 1.7 1.8 1.8State Tax Receipts 14.3 14.7 15.1 15.0 15.7 16.9 18.0 18.7Total 15.8 16.2 16.6 16.6 17.3 18.6 19.8 20.5
Tax Receipts Generated by Travel Spending ($Million)
Details may not add to total due to rounding. * Other Travel includes resident air travel and travel arrangement & reservation services. ** Retail includes gasoline.Federal tax receipts not included.
DEAN RUNYAN ASSOCIATESPage 38

Southeastern Region Visitor Spending and Visitor Volume
Visitor Spending by Type of Traveler Accommodation ($Million), 2017p
2010 2012 2014 2015 2016 2017
Total Destination Spending 188 210 217 223 226 232All Overnight 128 144 150 154 157 162
Hotel, Motel, STVR* 71 81 86 94 97 97
Private Home 39 45 43 40 39 41
Other Overnight 18 18 20 20 22 23
Day Travel 60 65 67 69 69 70
Day Travel 60 65 67 69 69 70
Average Expenditures for Overnight Visitors, 2017p
Travel Party PersonParty Length of
Day Trip Day Trip Size Stay (Nights)
$240 $644 $99 $266Hotel, Motel, STVR* 2.4 2.7
$58 $210 $21 $76Private Home 2.7 3.6
$141 $493 $47 $164Other Overnight 3.0 3.5
$124 $403 $46 $152 All Overnight 2.7 3.3
Overnight Visitor Volume, 2015-2017p
Person-Nights (000) Party-Nights (000)
2015 2016 2017 2015 2016 2017
Hotel, Motel, STVR* 934 935 916 386 386 379
Private Home 1,979 1,941 1,950 723 712 716
Other Overnight 430 478 491 144 159 164
All Overnight 3,343 3,355 3,357 1,252 1,258 1,258
Person-Trips (000) Party-Trips (000)
2015 2016 2017 2015 2016 2017
Hotel, Motel, STVR* 350 349 342 145 144 141
Private Home 549 540 542 200 197 198
Other Overnight 123 137 140 41 46 47
All Overnight 1,022 1,027 1,025 385 387 386
"Hotel, Motel, STVR" category includes all lodging where a lodging tax is collected except campgrounds. "Other Overnight" category includes campgrounds and vacation homes.
DEAN RUNYAN ASSOCIATES Page 39

Southwestern Region Travel Impacts and Visitor Volume
Travel Indicators (Ada, Adams, Boise, Canyon, Elmore, Gem, Owyhee, Payette, Valley, Washington Counties)
Visitor Spending Impacts
Amount of Visitor Spending that supports 1 Job $90,614
Employee Earnings generated by $100 Visitor Spending $26
Visitor Tax Revenues generated by $100 Visitor Spending* $0.78
Visitor Volume
Additional visitor spending if each resident household encouraged one additional overnight visitor (in thousands)
$74,036
Additional employment if each resident household encouraged one additional overnight visitor
817
Visitor Shares
Travel Share of Total Employment 3.2%
Overnight Visitor Day Share** 4.6%
Direct Travel Impacts, 2010-2017p
Avg. Annual Chg.
Spending ($M) 2010 2012 2014 2015 2016 2017 16-17 10-17
Total (Current $) 1,115 1,292 1,377 1,388 1,462 1,581 8.1% 5.1%
Other 290 337 316 310 326 362 11.1% 3.3%
Visitor 826 955 1,062 1,078 1,135 1,218 7.3% 5.7%
Non-transportation 534 597 693 734 791 839 6.2% 6.7%
Transportation 292 358 369 343 345 379 9.8% 3.8%
Earnings ($M)
Earnings (Current $) 262 291 317 327 355 391 10.0% 5.9%
Employment (Jobs)
Employment 11,390 12,220 13,230 13,410 14,070 14,890 5.8% 3.9%
Tax Revenue ($M)
Total (Current $) 72 80 88 93 102 111 8.5% 6.3%
Local 10 10 11 11 12 13 8.5% 4.8%
State 63 70 77 81 90 98 8.5% 6.5%
Other spending includes resident air travel, travel arrangement and reservation services. Non-transportation visitor spending includes accommodations, food services, retail, food stores, and arts, entertainment & recreation. Visitor transportation spending includes private auto, auto rental, other local ground transportation and one-way airfares.Earnings include wages & salaries, earned benefits and proprietor income.Employment includes all full- and part-time employment of payroll employees and proprietors.Visitor generated tax revenue includes lodging, sales, motor fuel, auto rental taxes and airport passenger facility charges paid by visitors.Business or employee tax includes state business and personal income taxes, local property taxes and the sales tax payments of travel industry employees. This tax revenue is attributed to the travel-generated income of businesses and employees.
DEAN RUNYAN ASSOCIATESPage 40

Southwestern Region Travel Impacts, 2010-2017p
2010 2011 2012 2013 2014 2015 2016 2017
Destination Spending 825.9 905.2 955.1 1,027.3 1,061.8 1,077.6 1,135.5 1,218.1Other Travel* 289.6 321.9 336.6 345.3 315.5 310.2 326.2 362.4Total 1,115.5 1,227.1 1,291.7 1,372.6 1,377.3 1,387.8 1,461.6 1,580.5
Total Direct Travel Spending ($Million)
2010 2011 2012 2013 2014 2015 2016 2017
Accommodations 113.8 118.7 130.3 148.6 163.3 183.6 209.2 227.0Food Service 196.6 207.9 223.4 246.3 260.4 274.4 294.3 315.0Food Stores 48.0 51.2 53.4 60.3 60.7 63.0 65.3 67.3Local Tran. & Gas 174.9 223.0 233.2 237.4 234.1 200.3 195.4 218.7Arts, Ent. & Rec. 40.6 42.3 44.8 49.0 50.6 52.3 54.5 57.4Retail Sales 134.7 140.3 145.3 155.6 158.0 161.1 167.2 172.4Visitor Air Tran. 117.3 121.8 124.8 130.1 134.8 142.9 149.6 160.2Total 825.9 905.2 955.1 1,027.3 1,061.8 1,077.6 1,135.5 1,218.1
Visitor Spending By Commodity Purchased ($Million)
2010 2011 2012 2013 2014 2015 2016 2017
Accom. & Food Serv. 119.5 127.5 136.3 143.9 154.7 165.9 182.0 198.8Arts, Ent. & Rec. 20.6 21.3 23.2 25.4 26.4 27.4 30.1 33.4Retail** 30.9 31.8 33.2 36.1 38.1 39.5 41.8 44.1Ground Tran. 16.6 17.5 18.1 18.6 20.4 21.3 22.6 23.7Visitor Air Tran. 17.3 18.0 17.6 20.0 19.9 17.5 17.9 20.6Other Travel* 57.0 60.5 62.5 67.6 58.0 55.8 60.7 70.1Total 261.9 276.6 290.9 311.8 317.5 327.3 355.1 390.7
Industry Earnings Generated by Travel Spending ($Million)
2010 2011 2012 2013 2014 2015 2016 2017
Accom. & Food Serv. 6,230 6,510 6,800 7,220 7,520 7,800 8,200 8,530Arts, Ent. & Rec. 1,680 1,650 1,820 1,950 2,140 2,150 2,300 2,510Retail** 1,140 1,150 1,180 1,260 1,240 1,240 1,260 1,320Ground Tran. 650 650 660 680 730 740 760 770Visitor Air Tran. 310 310 310 340 330 280 280 310Other Travel* 1,390 1,390 1,450 1,490 1,270 1,210 1,270 1,450Total 11,390 11,690 12,220 12,940 13,230 13,410 14,070 14,890
Industry Employment Generated by Travel Spending (Jobs)
2010 2011 2012 2013 2014 2015 2016 2017
Local Tax Receipts 9.5 10.0 10.2 10.8 11.1 11.5 12.2 13.3State Tax Receipts 62.7 66.4 70.0 75.1 77.4 81.4 89.9 97.6Total 72.2 76.4 80.1 86.0 88.5 92.9 102.1 110.8
Tax Receipts Generated by Travel Spending ($Million)
Details may not add to total due to rounding. * Other Travel includes resident air travel and travel arrangement & reservation services. ** Retail includes gasoline.Federal tax receipts not included.
DEAN RUNYAN ASSOCIATES Page 41
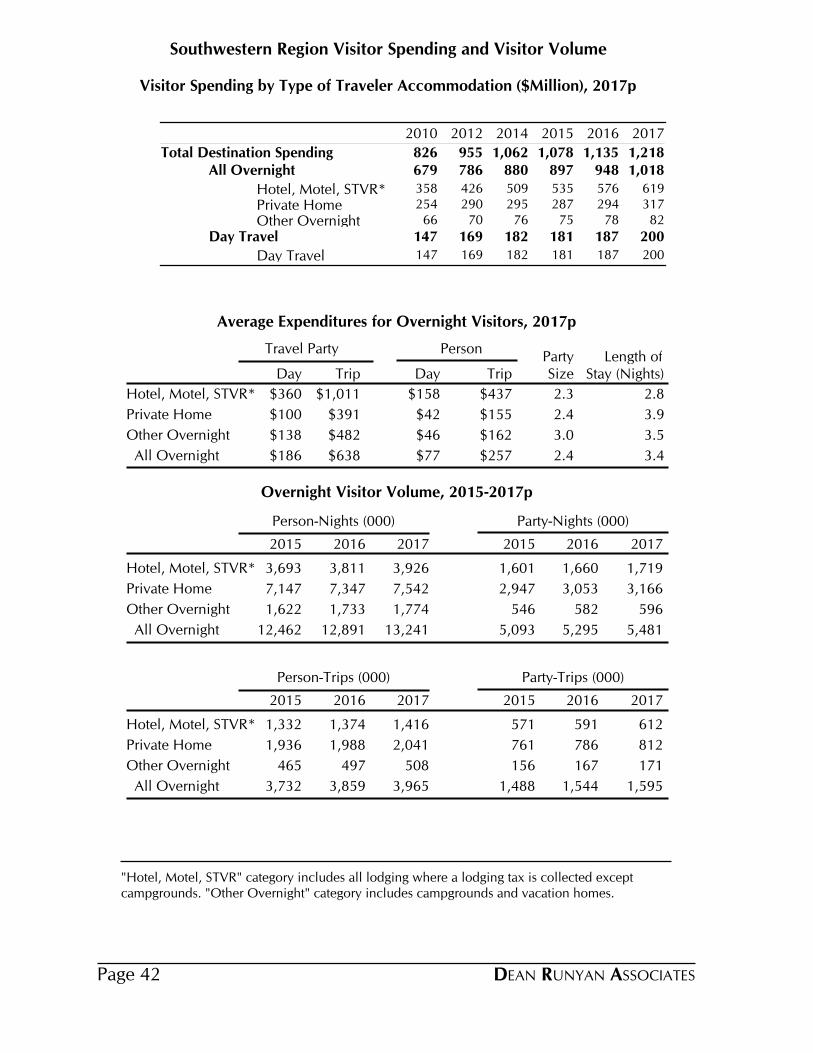
Southwestern Region Visitor Spending and Visitor Volume
Visitor Spending by Type of Traveler Accommodation ($Million), 2017p
2010 2012 2014 2015 2016 2017
Total Destination Spending 826 955 1,062 1,078 1,135 1,218All Overnight 679 786 880 897 948 1,018
Hotel, Motel, STVR* 358 426 509 535 576 619
Private Home 254 290 295 287 294 317
Other Overnight 66 70 76 75 78 82
Day Travel 147 169 182 181 187 200
Day Travel 147 169 182 181 187 200
Average Expenditures for Overnight Visitors, 2017p
Travel Party PersonParty Length of
Day Trip Day Trip Size Stay (Nights)
$360 $1,011 $158 $437Hotel, Motel, STVR* 2.3 2.8
$100 $391 $42 $155Private Home 2.4 3.9
$138 $482 $46 $162Other Overnight 3.0 3.5
$186 $638 $77 $257 All Overnight 2.4 3.4
Overnight Visitor Volume, 2015-2017p
Person-Nights (000) Party-Nights (000)
2015 2016 2017 2015 2016 2017
Hotel, Motel, STVR* 3,693 3,811 3,926 1,601 1,660 1,719
Private Home 7,147 7,347 7,542 2,947 3,053 3,166
Other Overnight 1,622 1,733 1,774 546 582 596
All Overnight 12,462 12,891 13,241 5,093 5,295 5,481
Person-Trips (000) Party-Trips (000)
2015 2016 2017 2015 2016 2017
Hotel, Motel, STVR* 1,332 1,374 1,416 571 591 612
Private Home 1,936 1,988 2,041 761 786 812
Other Overnight 465 497 508 156 167 171
All Overnight 3,732 3,859 3,965 1,488 1,544 1,595
"Hotel, Motel, STVR" category includes all lodging where a lodging tax is collected except campgrounds. "Other Overnight" category includes campgrounds and vacation homes.
DEAN RUNYAN ASSOCIATESPage 42

This page intentionally blank
DEAN RUNYAN ASSOCIATES Page 43

IV. COUNTY TRAVEL IMPACTS2008-2017p
DEAN RUNYAN ASSOCIATESPAGE 44
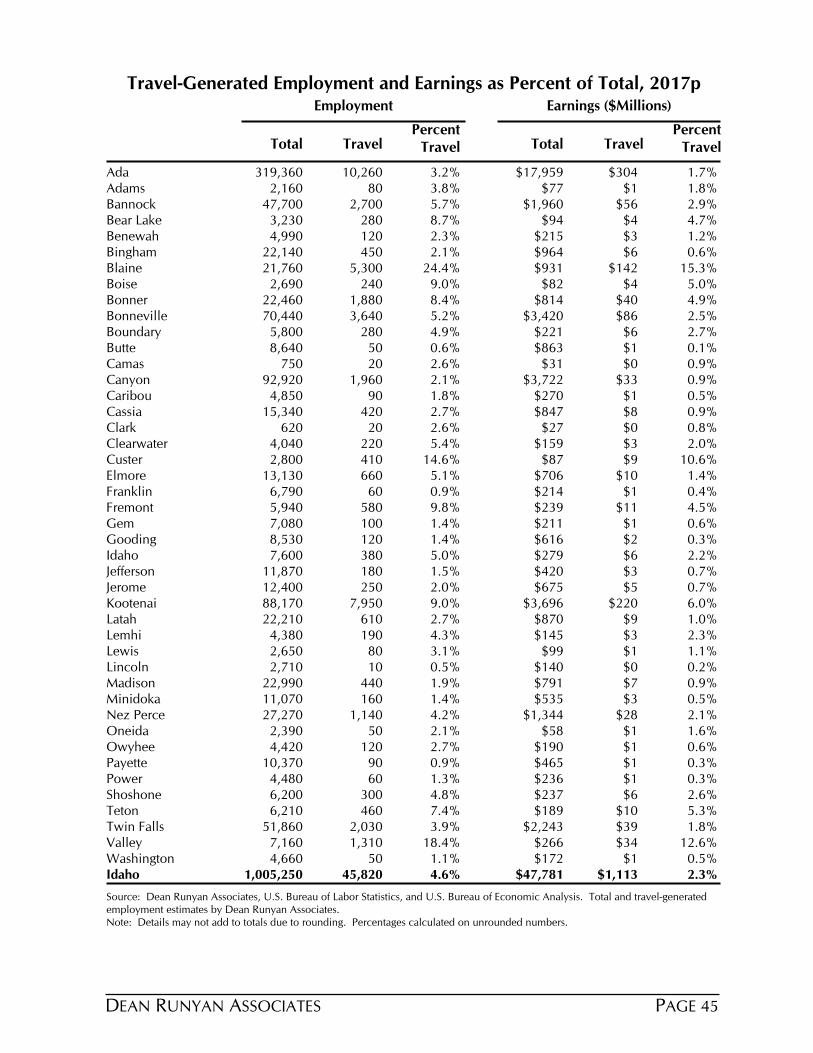
Travel-Generated Employment and Earnings as Percent of Total, 2017pEmployment Earnings ($Millions)
Total TravelPercent
TravelPercent
TravelTravelTotal
Ada 319,360 10,260 3.2% 1.7%$17,959 $304Adams 2,160 80 3.8% 1.8%$77 $1Bannock 47,700 2,700 5.7% 2.9%$1,960 $56Bear Lake 3,230 280 8.7% 4.7%$94 $4Benewah 4,990 120 2.3% 1.2%$215 $3Bingham 22,140 450 2.1% 0.6%$964 $6Blaine 21,760 5,300 24.4% 15.3%$931 $142Boise 2,690 240 9.0% 5.0%$82 $4Bonner 22,460 1,880 8.4% 4.9%$814 $40Bonneville 70,440 3,640 5.2% 2.5%$3,420 $86Boundary 5,800 280 4.9% 2.7%$221 $6Butte 8,640 50 0.6% 0.1%$863 $1Camas 750 20 2.6% 0.9%$31 $0Canyon 92,920 1,960 2.1% 0.9%$3,722 $33Caribou 4,850 90 1.8% 0.5%$270 $1Cassia 15,340 420 2.7% 0.9%$847 $8Clark 620 20 2.6% 0.8%$27 $0Clearwater 4,040 220 5.4% 2.0%$159 $3Custer 2,800 410 14.6% 10.6%$87 $9Elmore 13,130 660 5.1% 1.4%$706 $10Franklin 6,790 60 0.9% 0.4%$214 $1Fremont 5,940 580 9.8% 4.5%$239 $11Gem 7,080 100 1.4% 0.6%$211 $1Gooding 8,530 120 1.4% 0.3%$616 $2Idaho 7,600 380 5.0% 2.2%$279 $6Jefferson 11,870 180 1.5% 0.7%$420 $3Jerome 12,400 250 2.0% 0.7%$675 $5Kootenai 88,170 7,950 9.0% 6.0%$3,696 $220Latah 22,210 610 2.7% 1.0%$870 $9Lemhi 4,380 190 4.3% 2.3%$145 $3Lewis 2,650 80 3.1% 1.1%$99 $1Lincoln 2,710 10 0.5% 0.2%$140 $0Madison 22,990 440 1.9% 0.9%$791 $7Minidoka 11,070 160 1.4% 0.5%$535 $3Nez Perce 27,270 1,140 4.2% 2.1%$1,344 $28Oneida 2,390 50 2.1% 1.6%$58 $1Owyhee 4,420 120 2.7% 0.6%$190 $1Payette 10,370 90 0.9% 0.3%$465 $1Power 4,480 60 1.3% 0.3%$236 $1Shoshone 6,200 300 4.8% 2.6%$237 $6Teton 6,210 460 7.4% 5.3%$189 $10Twin Falls 51,860 2,030 3.9% 1.8%$2,243 $39Valley 7,160 1,310 18.4% 12.6%$266 $34Washington 4,660 50 1.1% 0.5%$172 $1Idaho 1,005,250 45,820 4.6% 2.3%$47,781 $1,113
Source: Dean Runyan Associates, U.S. Bureau of Labor Statistics, and U.S. Bureau of Economic Analysis. Total and travel-generated employment estimates by Dean Runyan Associates.Note: Details may not add to totals due to rounding. Percentages calculated on unrounded numbers.
PAGE 45 DEAN RUNYAN ASSOCIATES

2017p Idaho County Travel Impacts
Related Travel-Generated Impacts
TaxesTravel Spending
Total($Million)
*Visitor($Million)
Earnings($Million)
Employment(Jobs)
Visitor ($Million)
*Emp($Million)
Total($Million)
1,267Ada 889 304 10,260 56.3 26.3 82.6
4Adams 4 1 80 0.3 0.1 0.4
199Bannock 173 56 2,700 10.8 4.7 15.5
15Bear Lake 14 4 280 0.9 0.4 1.3
8Benewah 7 3 120 0.6 0.2 0.8
26Bingham 18 6 450 1.9 0.5 2.4
308Blaine 297 142 5,300 17.5 12.0 29.5
13Boise 12 4 240 0.8 0.3 1.1
130Bonner 122 40 1,880 8.8 3.5 12.3
277Bonneville 233 86 3,640 15.3 7.4 22.7
16Boundary 14 6 280 0.7 0.5 1.2
3Butte 2 1 50 0.2 0.1 0.3
1Camas 1 0 20 0.1 0.0 0.1
139Canyon 99 33 1,960 10.1 2.8 12.8
5Caribou 4 1 90 0.4 0.1 0.5
28Cassia 23 8 420 1.9 0.7 2.5
1Clark 1 0 20 0.1 0.0 0.1
11Clearwater 10 3 220 0.7 0.3 1.0
23Custer 22 9 410 1.6 0.8 2.3
33Elmore 27 10 660 2.1 0.8 2.9
4Franklin 4 1 60 0.2 0.1 0.3
44Fremont 44 11 580 2.8 0.9 3.7
4Gem 4 1 100 0.2 0.1 0.3
6Gooding 6 2 120 0.3 0.1 0.5
18Idaho 18 6 380 1.2 0.5 1.7
10Jefferson 10 3 180 0.6 0.2 0.8
20Jerome 20 5 250 1.2 0.4 1.6
577Kootenai 571 220 7,950 26.0 18.4 44.4
31Latah 30 9 610 1.9 0.8 2.7
12Lemhi 12 3 190 0.9 0.3 1.1
4Lewis 4 1 80 0.2 0.1 0.3
1Lincoln 1 0 10 0.0 0.0 0.1
22Madison 22 7 440 1.3 0.6 1.9
9Minidoka 9 3 160 0.5 0.2 0.8
95Nez Perce 81 28 1,140 4.1 2.4 6.5
2Oneida 2 1 50 0.1 0.1 0.2
4Owyhee 4 1 120 0.2 0.1 0.3
6Payette 6 1 90 0.3 0.1 0.4
3Power 3 1 60 0.2 0.1 0.3
23Shoshone 23 6 300 1.4 0.5 1.9
30Teton 30 10 460 1.9 0.9 2.8
144Twin Falls 134 39 2,030 7.8 3.4 11.2
107Valley 106 34 1,310 6.6 3.0 9.6
3Washington 3 1 50 0.2 0.1 0.3
Details may not add to totals due to rounding. The sum of county visitor spending is less than statewide visitor spending because a portion of county ground transportation is allocated to “other travel” at the county level.
3,686 3,116 1,113 45,820 191 95 286Idaho
DEAN RUNYAN ASSOCIATESPAGE 46

Ada County Travel Impacts, 2010-2017p
2010 2012 2014 2015 2016 2017 16-17 10-17
Total Direct Spending (million) 882 1,020 1,087 1,107 1,173 1,267 8.0% 5.3%
Visitor Spending 579 662 751 782 833 889 6.6% 6.3%
Overnight 471 540 617 645 690 737 6.8% 6.6%
Day 108 122 134 137 143 152 6.0% 5.0%
Total Direct Earnings (million) 205 229 247 254 276 304 10.2% 5.8%
Total Direct Employment 7,135 7,827 8,330 8,475 8,926 9,473 6.1% 4.1%
State & Local Gov't Rev.(million) 53.3 59.5 65.6 69.1 76.2 82.6 8.4% 6.5%
Visitor 35.2 39.6 44.4 47.2 52.3 56.3 7.7% 7.0%
Employer/Employee 18.1 19.8 21.2 21.9 23.9 26.3 10.0% 5.5%
Adams County Travel Impacts, 2010-2017p
2010 2012 2014 2015 2016 2017 16-17 10-17
Total Direct Spending (million) 4.56 4.92 5.05 4.54 4.39 4.49 2.2% -0.2%
Visitor Spending 3.82 3.92 4.16 3.84 3.76 3.73 -0.8% -0.3%
Overnight 3.61 3.70 3.94 3.63 3.56 3.52 -1.1% -0.4%
Day 0.20 0.21 0.22 0.21 0.21 0.21 4.2% 0.7%
Total Direct Earnings (million) 1.52 1.36 1.59 1.48 1.52 1.41 -7.2% -1.0%
Total Direct Employment 93.5 78.8 84.9 75.5 78.8 66.4 -15.8% -4.8%
State & Local Gov't Rev.(million) 0.38 0.38 0.40 0.39 0.40 0.40 -0.6% 0.6%
Visitor 0.27 0.27 0.28 0.27 0.28 0.29 2.3% 1.1%
Employer/Employee 0.11 0.10 0.12 0.11 0.12 0.11 -7.5% -0.6%
Bannock County Travel Impacts, 2010-2017p
2010 2012 2014 2015 2016 2017 16-17 10-17
Total Direct Spending (million) 159 176 183 191 192 199 3.5% 3.3%
Visitor Spending 139 150 158 168 170 173 1.8% 3.2%
Overnight 89 96 102 110 113 115 1.8% 3.7%
Day 50 53 55 58 58 59 1.7% 2.3%
Total Direct Earnings (million) 44 43 46 52 54 56 3.4% 3.5%
Total Direct Employment 2,303 2,208 2,234 2,383 2,411 2,412 0.0% 0.7%
State & Local Gov't Rev.(million) 12.1 12.4 13.0 14.2 15.1 15.5 3.0% 3.6%
Visitor 8.3 8.8 9.2 9.9 10.5 10.8 2.9% 3.8%
Employer/Employee 3.8 3.6 3.8 4.3 4.6 4.7 3.2% 3.3%
PAGE 47 DEAN RUNYAN ASSOCIATES
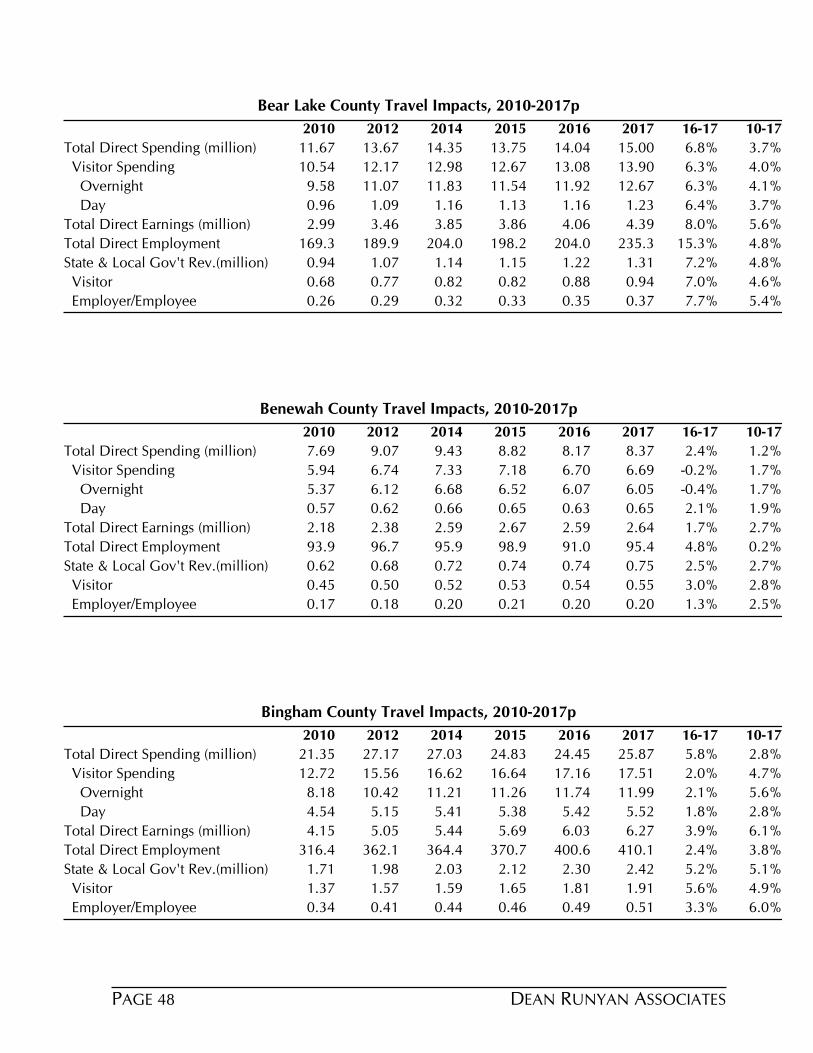
Bear Lake County Travel Impacts, 2010-2017p
2010 2012 2014 2015 2016 2017 16-17 10-17
Total Direct Spending (million) 11.67 13.67 14.35 13.75 14.04 15.00 6.8% 3.7%
Visitor Spending 10.54 12.17 12.98 12.67 13.08 13.90 6.3% 4.0%
Overnight 9.58 11.07 11.83 11.54 11.92 12.67 6.3% 4.1%
Day 0.96 1.09 1.16 1.13 1.16 1.23 6.4% 3.7%
Total Direct Earnings (million) 2.99 3.46 3.85 3.86 4.06 4.39 8.0% 5.6%
Total Direct Employment 169.3 189.9 204.0 198.2 204.0 235.3 15.3% 4.8%
State & Local Gov't Rev.(million) 0.94 1.07 1.14 1.15 1.22 1.31 7.2% 4.8%
Visitor 0.68 0.77 0.82 0.82 0.88 0.94 7.0% 4.6%
Employer/Employee 0.26 0.29 0.32 0.33 0.35 0.37 7.7% 5.4%
Benewah County Travel Impacts, 2010-2017p
2010 2012 2014 2015 2016 2017 16-17 10-17
Total Direct Spending (million) 7.69 9.07 9.43 8.82 8.17 8.37 2.4% 1.2%
Visitor Spending 5.94 6.74 7.33 7.18 6.70 6.69 -0.2% 1.7%
Overnight 5.37 6.12 6.68 6.52 6.07 6.05 -0.4% 1.7%
Day 0.57 0.62 0.66 0.65 0.63 0.65 2.1% 1.9%
Total Direct Earnings (million) 2.18 2.38 2.59 2.67 2.59 2.64 1.7% 2.7%
Total Direct Employment 93.9 96.7 95.9 98.9 91.0 95.4 4.8% 0.2%
State & Local Gov't Rev.(million) 0.62 0.68 0.72 0.74 0.74 0.75 2.5% 2.7%
Visitor 0.45 0.50 0.52 0.53 0.54 0.55 3.0% 2.8%
Employer/Employee 0.17 0.18 0.20 0.21 0.20 0.20 1.3% 2.5%
Bingham County Travel Impacts, 2010-2017p
2010 2012 2014 2015 2016 2017 16-17 10-17
Total Direct Spending (million) 21.35 27.17 27.03 24.83 24.45 25.87 5.8% 2.8%
Visitor Spending 12.72 15.56 16.62 16.64 17.16 17.51 2.0% 4.7%
Overnight 8.18 10.42 11.21 11.26 11.74 11.99 2.1% 5.6%
Day 4.54 5.15 5.41 5.38 5.42 5.52 1.8% 2.8%
Total Direct Earnings (million) 4.15 5.05 5.44 5.69 6.03 6.27 3.9% 6.1%
Total Direct Employment 316.4 362.1 364.4 370.7 400.6 410.1 2.4% 3.8%
State & Local Gov't Rev.(million) 1.71 1.98 2.03 2.12 2.30 2.42 5.2% 5.1%
Visitor 1.37 1.57 1.59 1.65 1.81 1.91 5.6% 4.9%
Employer/Employee 0.34 0.41 0.44 0.46 0.49 0.51 3.3% 6.0%
DEAN RUNYAN ASSOCIATESPAGE 48

Blaine County Travel Impacts, 2010-2017p
2010 2012 2014 2015 2016 2017 16-17 10-17
Total Direct Spending (million) 235 236 248 247 280 308 9.8% 3.9%
Visitor Spending 228 227 237 238 271 297 9.8% 3.9%
Overnight 222 221 231 232 264 290 9.9% 3.9%
Day 6 6 6 6 7 7 7.4% 3.5%
Total Direct Earnings (million) 88 90 106 106 125 142 14.1% 7.1%
Total Direct Employment 4,178 3,892 4,199 4,113 4,677 5,184 10.8% 3.1%
State & Local Gov't Rev.(million) 20.5 20.4 22.3 22.6 26.4 29.5 11.8% 5.4%
Visitor 12.9 12.8 13.4 13.6 15.8 17.5 10.5% 4.5%
Employer/Employee 7.6 7.6 8.9 9.0 10.6 12.0 13.8% 6.8%
Boise County Travel Impacts, 2010-2017p
2010 2012 2014 2015 2016 2017 16-17 10-17
Total Direct Spending (million) 11.83 12.26 12.16 11.26 12.10 13.07 8.0% 1.4%
Visitor Spending 10.50 10.53 10.60 10.03 10.95 11.74 7.2% 1.6%
Overnight 9.44 9.42 9.47 8.95 9.81 10.53 7.3% 1.6%
Day 1.07 1.11 1.12 1.08 1.15 1.22 6.3% 1.9%
Total Direct Earnings (million) 3.48 3.28 3.41 3.31 3.77 4.12 9.5% 2.5%
Total Direct Employment 141.6 136.6 143.8 133.0 158.6 164.1 3.5% 2.1%
State & Local Gov't Rev.(million) 0.97 0.93 0.94 0.92 1.05 1.14 8.7% 2.4%
Visitor 0.68 0.67 0.67 0.66 0.75 0.81 8.5% 2.5%
Employer/Employee 0.28 0.26 0.27 0.26 0.30 0.33 9.4% 2.2%
Bonner County Travel Impacts, 2010-2017p
2010 2012 2014 2015 2016 2017 16-17 10-17
Total Direct Spending (million) 102 116 122 119 120 130 8.1% 3.5%
Visitor Spending 94 105 113 111 113 122 7.6% 3.7%
Overnight 88 99 106 104 106 114 7.6% 3.7%
Day 6 7 7 7 7 7 7.6% 3.2%
Total Direct Earnings (million) 29 31 35 35 37 40 10.0% 4.7%
Total Direct Employment 1,601 1,590 1,627 1,598 1,567 1,676 6.9% 0.7%
State & Local Gov't Rev.(million) 8.9 9.6 10.4 10.5 11.3 12.3 8.8% 4.7%
Visitor 6.3 6.9 7.4 7.5 8.1 8.8 8.4% 4.8%
Employer/Employee 2.6 2.7 3.0 3.0 3.2 3.5 9.7% 4.4%
PAGE 49 DEAN RUNYAN ASSOCIATES

Bonneville County Travel Impacts, 2010-2017p
2010 2012 2014 2015 2016 2017 16-17 10-17
Total Direct Spending (million) 207 234 252 250 259 277 6.8% 4.2%
Visitor Spending 166 182 203 207 218 233 6.6% 4.9%
Overnight 121 132 149 153 162 174 7.0% 5.3%
Day 45 50 54 54 56 59 5.3% 3.9%
Total Direct Earnings (million) 50 56 64 74 80 86 7.7% 8.2%
Total Direct Employment 2,340 2,549 2,776 2,939 3,176 3,344 5.3% 5.2%
State & Local Gov't Rev.(million) 14.7 15.9 17.6 19.2 21.0 22.7 8.0% 6.4%
Visitor 10.4 11.2 12.2 12.8 14.1 15.3 8.4% 5.6%
Employer/Employee 4.3 4.8 5.4 6.3 6.9 7.4 7.3% 8.0%
Boundary County Travel Impacts, 2010-2017p
2010 2012 2014 2015 2016 2017 16-17 10-17
Total Direct Spending (million) 13.80 15.62 14.49 14.49 13.25 15.72 18.7% 1.9%
Visitor Spending 11.37 12.85 11.96 12.51 11.36 13.55 19.2% 2.5%
Overnight 10.59 12.01 11.17 11.69 10.57 12.65 19.7% 2.6%
Day 0.78 0.85 0.79 0.82 0.79 0.90 12.7% 2.0%
Total Direct Earnings (million) 4.66 4.85 5.02 5.36 4.87 5.88 20.7% 3.4%
Total Direct Employment 228.5 242.6 228.5 237.4 224.6 267.7 19.2% 2.3%
State & Local Gov't Rev.(million) 0.94 1.00 0.97 1.04 1.01 1.19 17.4% 3.4%
Visitor 0.56 0.61 0.57 0.60 0.62 0.71 15.5% 3.5%
Employer/Employee 0.39 0.39 0.40 0.44 0.40 0.48 20.5% 3.1%
Butte County Travel Impacts, 2010-2017p
2010 2012 2014 2015 2016 2017 16-17 10-17
Total Direct Spending (million) 2.75 2.33 2.30 2.27 2.46 2.84 15.5% 0.4%
Visitor Spending 2.21 1.63 1.70 1.80 2.05 2.36 15.1% 1.0%
Overnight 2.10 1.55 1.61 1.71 1.96 2.25 15.2% 1.0%
Day 0.11 0.08 0.09 0.09 0.10 0.11 12.2% 0.6%
Total Direct Earnings (million) 0.65 0.46 0.54 0.59 0.69 0.80 16.6% 3.0%
Total Direct Employment 36.7 25.3 30.6 32.4 34.4 43.7 27.0% 2.5%
State & Local Gov't Rev.(million) 0.22 0.17 0.18 0.19 0.22 0.26 15.3% 2.1%
Visitor 0.17 0.13 0.13 0.14 0.17 0.19 14.9% 1.9%
Employer/Employee 0.05 0.04 0.04 0.05 0.06 0.07 16.4% 2.7%
DEAN RUNYAN ASSOCIATESPAGE 50
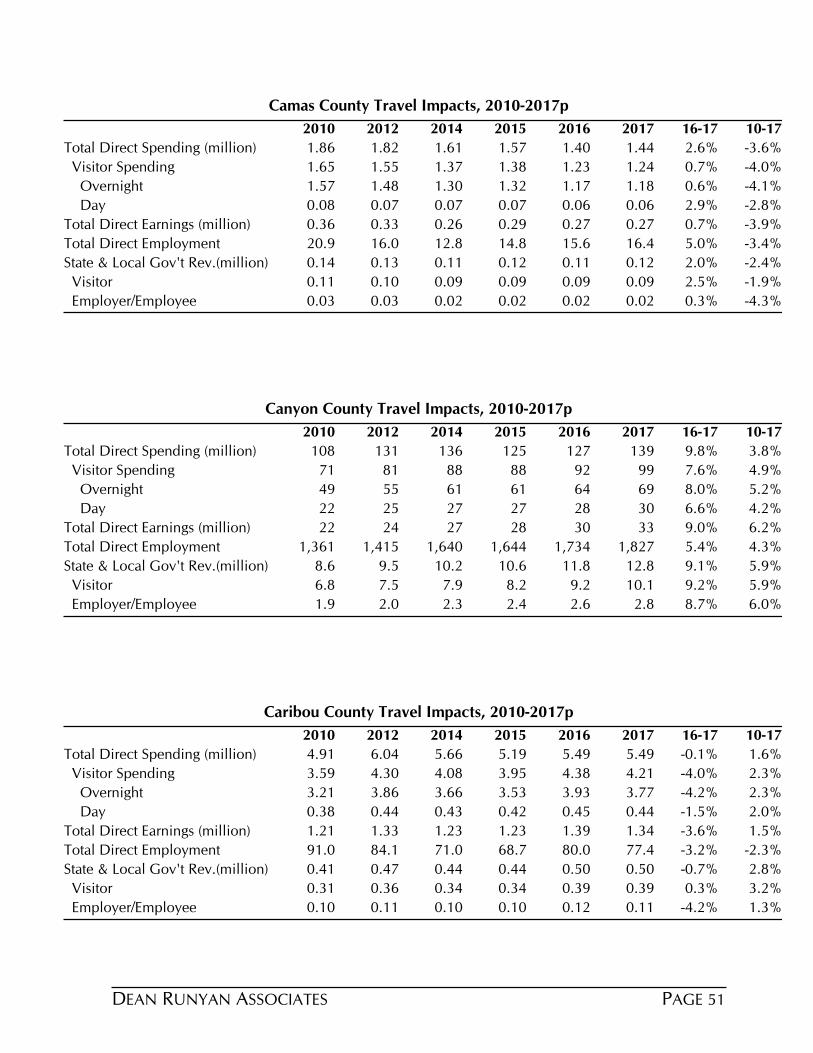
Camas County Travel Impacts, 2010-2017p
2010 2012 2014 2015 2016 2017 16-17 10-17
Total Direct Spending (million) 1.86 1.82 1.61 1.57 1.40 1.44 2.6% -3.6%
Visitor Spending 1.65 1.55 1.37 1.38 1.23 1.24 0.7% -4.0%
Overnight 1.57 1.48 1.30 1.32 1.17 1.18 0.6% -4.1%
Day 0.08 0.07 0.07 0.07 0.06 0.06 2.9% -2.8%
Total Direct Earnings (million) 0.36 0.33 0.26 0.29 0.27 0.27 0.7% -3.9%
Total Direct Employment 20.9 16.0 12.8 14.8 15.6 16.4 5.0% -3.4%
State & Local Gov't Rev.(million) 0.14 0.13 0.11 0.12 0.11 0.12 2.0% -2.4%
Visitor 0.11 0.10 0.09 0.09 0.09 0.09 2.5% -1.9%
Employer/Employee 0.03 0.03 0.02 0.02 0.02 0.02 0.3% -4.3%
Canyon County Travel Impacts, 2010-2017p
2010 2012 2014 2015 2016 2017 16-17 10-17
Total Direct Spending (million) 108 131 136 125 127 139 9.8% 3.8%
Visitor Spending 71 81 88 88 92 99 7.6% 4.9%
Overnight 49 55 61 61 64 69 8.0% 5.2%
Day 22 25 27 27 28 30 6.6% 4.2%
Total Direct Earnings (million) 22 24 27 28 30 33 9.0% 6.2%
Total Direct Employment 1,361 1,415 1,640 1,644 1,734 1,827 5.4% 4.3%
State & Local Gov't Rev.(million) 8.6 9.5 10.2 10.6 11.8 12.8 9.1% 5.9%
Visitor 6.8 7.5 7.9 8.2 9.2 10.1 9.2% 5.9%
Employer/Employee 1.9 2.0 2.3 2.4 2.6 2.8 8.7% 6.0%
Caribou County Travel Impacts, 2010-2017p
2010 2012 2014 2015 2016 2017 16-17 10-17
Total Direct Spending (million) 4.91 6.04 5.66 5.19 5.49 5.49 -0.1% 1.6%
Visitor Spending 3.59 4.30 4.08 3.95 4.38 4.21 -4.0% 2.3%
Overnight 3.21 3.86 3.66 3.53 3.93 3.77 -4.2% 2.3%
Day 0.38 0.44 0.43 0.42 0.45 0.44 -1.5% 2.0%
Total Direct Earnings (million) 1.21 1.33 1.23 1.23 1.39 1.34 -3.6% 1.5%
Total Direct Employment 91.0 84.1 71.0 68.7 80.0 77.4 -3.2% -2.3%
State & Local Gov't Rev.(million) 0.41 0.47 0.44 0.44 0.50 0.50 -0.7% 2.8%
Visitor 0.31 0.36 0.34 0.34 0.39 0.39 0.3% 3.2%
Employer/Employee 0.10 0.11 0.10 0.10 0.12 0.11 -4.2% 1.3%
PAGE 51 DEAN RUNYAN ASSOCIATES
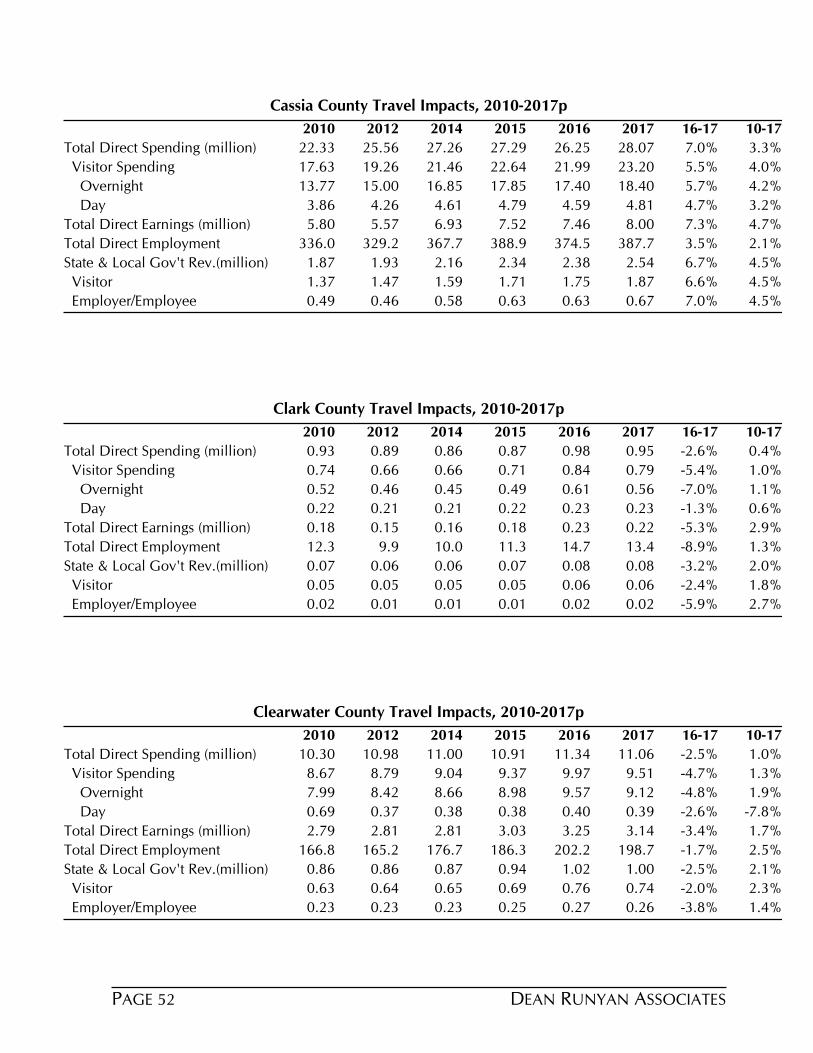
Cassia County Travel Impacts, 2010-2017p
2010 2012 2014 2015 2016 2017 16-17 10-17
Total Direct Spending (million) 22.33 25.56 27.26 27.29 26.25 28.07 7.0% 3.3%
Visitor Spending 17.63 19.26 21.46 22.64 21.99 23.20 5.5% 4.0%
Overnight 13.77 15.00 16.85 17.85 17.40 18.40 5.7% 4.2%
Day 3.86 4.26 4.61 4.79 4.59 4.81 4.7% 3.2%
Total Direct Earnings (million) 5.80 5.57 6.93 7.52 7.46 8.00 7.3% 4.7%
Total Direct Employment 336.0 329.2 367.7 388.9 374.5 387.7 3.5% 2.1%
State & Local Gov't Rev.(million) 1.87 1.93 2.16 2.34 2.38 2.54 6.7% 4.5%
Visitor 1.37 1.47 1.59 1.71 1.75 1.87 6.6% 4.5%
Employer/Employee 0.49 0.46 0.58 0.63 0.63 0.67 7.0% 4.5%
Clark County Travel Impacts, 2010-2017p
2010 2012 2014 2015 2016 2017 16-17 10-17
Total Direct Spending (million) 0.93 0.89 0.86 0.87 0.98 0.95 -2.6% 0.4%
Visitor Spending 0.74 0.66 0.66 0.71 0.84 0.79 -5.4% 1.0%
Overnight 0.52 0.46 0.45 0.49 0.61 0.56 -7.0% 1.1%
Day 0.22 0.21 0.21 0.22 0.23 0.23 -1.3% 0.6%
Total Direct Earnings (million) 0.18 0.15 0.16 0.18 0.23 0.22 -5.3% 2.9%
Total Direct Employment 12.3 9.9 10.0 11.3 14.7 13.4 -8.9% 1.3%
State & Local Gov't Rev.(million) 0.07 0.06 0.06 0.07 0.08 0.08 -3.2% 2.0%
Visitor 0.05 0.05 0.05 0.05 0.06 0.06 -2.4% 1.8%
Employer/Employee 0.02 0.01 0.01 0.01 0.02 0.02 -5.9% 2.7%
Clearwater County Travel Impacts, 2010-2017p
2010 2012 2014 2015 2016 2017 16-17 10-17
Total Direct Spending (million) 10.30 10.98 11.00 10.91 11.34 11.06 -2.5% 1.0%
Visitor Spending 8.67 8.79 9.04 9.37 9.97 9.51 -4.7% 1.3%
Overnight 7.99 8.42 8.66 8.98 9.57 9.12 -4.8% 1.9%
Day 0.69 0.37 0.38 0.38 0.40 0.39 -2.6% -7.8%
Total Direct Earnings (million) 2.79 2.81 2.81 3.03 3.25 3.14 -3.4% 1.7%
Total Direct Employment 166.8 165.2 176.7 186.3 202.2 198.7 -1.7% 2.5%
State & Local Gov't Rev.(million) 0.86 0.86 0.87 0.94 1.02 1.00 -2.5% 2.1%
Visitor 0.63 0.64 0.65 0.69 0.76 0.74 -2.0% 2.3%
Employer/Employee 0.23 0.23 0.23 0.25 0.27 0.26 -3.8% 1.4%
DEAN RUNYAN ASSOCIATESPAGE 52

Custer County Travel Impacts, 2010-2017p
2010 2012 2014 2015 2016 2017 16-17 10-17
Total Direct Spending (million) 17.36 17.67 18.79 20.16 20.77 23.40 12.6% 4.4%
Visitor Spending 15.95 15.95 17.19 18.75 19.34 21.70 12.2% 4.5%
Overnight 15.28 15.27 16.43 17.91 18.49 20.76 12.2% 4.5%
Day 0.67 0.68 0.76 0.84 0.84 0.94 11.5% 5.0%
Total Direct Earnings (million) 5.60 5.63 6.91 7.64 8.07 9.22 14.3% 7.4%
Total Direct Employment 272.2 250.5 291.6 313.0 329.6 351.8 6.7% 3.7%
State & Local Gov't Rev.(million) 1.59 1.56 1.73 1.92 2.05 2.31 13.0% 5.5%
Visitor 1.12 1.10 1.17 1.30 1.39 1.56 12.6% 4.9%
Employer/Employee 0.47 0.46 0.56 0.62 0.66 0.75 14.0% 7.0%
Elmore County Travel Impacts, 2010-2017p
2010 2012 2014 2015 2016 2017 16-17 10-17
Total Direct Spending (million) 25.00 29.33 29.56 28.40 30.60 32.54 6.3% 3.8%
Visitor Spending 19.30 22.03 22.92 23.02 25.62 26.71 4.2% 4.8%
Overnight 14.63 16.77 17.48 17.67 19.85 20.72 4.4% 5.1%
Day 4.67 5.27 5.43 5.35 5.77 5.99 3.8% 3.6%
Total Direct Earnings (million) 6.57 6.93 7.74 7.99 9.05 9.63 6.4% 5.6%
Total Direct Employment 433.9 436.4 528.9 528.6 595.8 614.9 3.2% 5.1%
State & Local Gov't Rev.(million) 2.04 2.20 2.28 2.38 2.71 2.88 6.1% 5.1%
Visitor 1.50 1.65 1.67 1.74 1.99 2.11 6.1% 5.0%
Employer/Employee 0.54 0.56 0.61 0.64 0.73 0.77 6.0% 5.2%
Franklin County Travel Impacts, 2010-2017p
2010 2012 2014 2015 2016 2017 16-17 10-17
Total Direct Spending (million) 3.09 3.40 3.56 3.63 3.75 3.90 4.1% 3.4%
Visitor Spending 3.09 3.40 3.56 3.63 3.75 3.90 4.1% 3.4%
Overnight 2.63 2.90 3.04 3.10 3.20 3.33 4.1% 3.4%
Day 0.45 0.50 0.51 0.53 0.55 0.57 3.8% 3.3%
Total Direct Earnings (million) 0.75 0.72 0.71 0.76 0.81 0.85 5.2% 1.9%
Total Direct Employment 53.4 48.0 43.4 45.3 47.1 49.0 3.9% -1.2%
State & Local Gov't Rev.(million) 0.24 0.24 0.25 0.27 0.29 0.30 4.5% 3.6%
Visitor 0.17 0.18 0.19 0.20 0.22 0.23 4.3% 4.3%
Employer/Employee 0.06 0.06 0.06 0.07 0.07 0.07 4.8% 1.7%
PAGE 53 DEAN RUNYAN ASSOCIATES
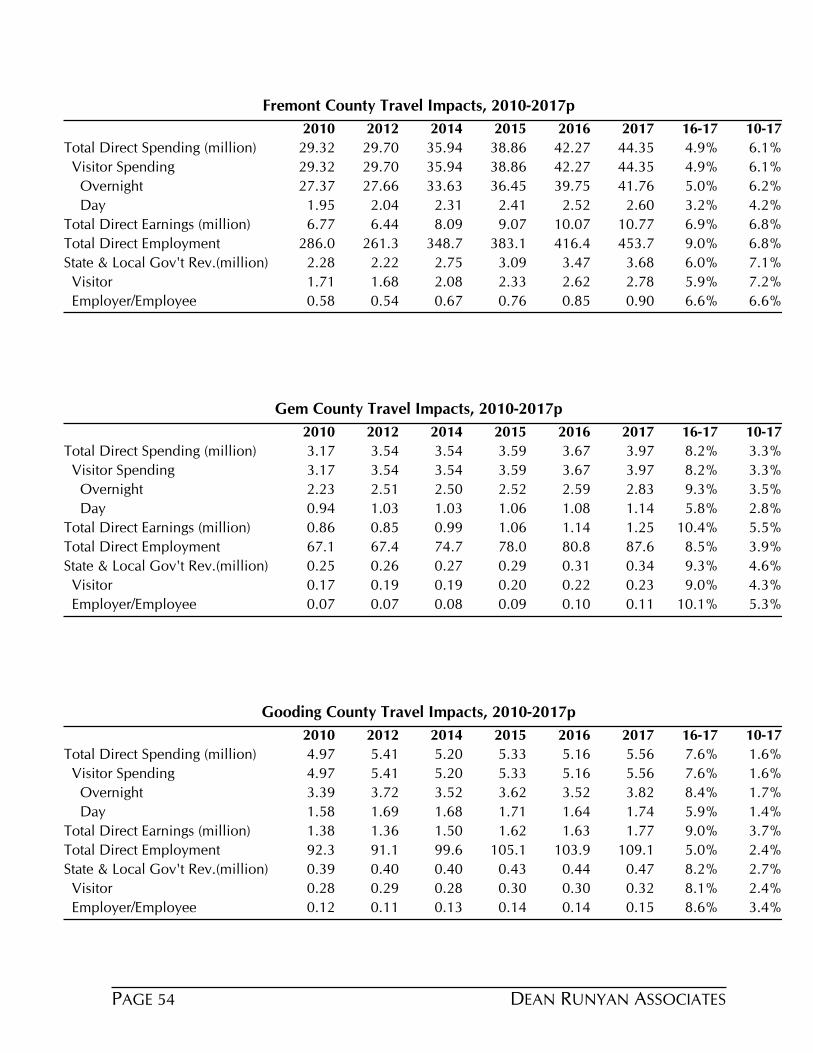
Fremont County Travel Impacts, 2010-2017p
2010 2012 2014 2015 2016 2017 16-17 10-17
Total Direct Spending (million) 29.32 29.70 35.94 38.86 42.27 44.35 4.9% 6.1%
Visitor Spending 29.32 29.70 35.94 38.86 42.27 44.35 4.9% 6.1%
Overnight 27.37 27.66 33.63 36.45 39.75 41.76 5.0% 6.2%
Day 1.95 2.04 2.31 2.41 2.52 2.60 3.2% 4.2%
Total Direct Earnings (million) 6.77 6.44 8.09 9.07 10.07 10.77 6.9% 6.8%
Total Direct Employment 286.0 261.3 348.7 383.1 416.4 453.7 9.0% 6.8%
State & Local Gov't Rev.(million) 2.28 2.22 2.75 3.09 3.47 3.68 6.0% 7.1%
Visitor 1.71 1.68 2.08 2.33 2.62 2.78 5.9% 7.2%
Employer/Employee 0.58 0.54 0.67 0.76 0.85 0.90 6.6% 6.6%
Gem County Travel Impacts, 2010-2017p
2010 2012 2014 2015 2016 2017 16-17 10-17
Total Direct Spending (million) 3.17 3.54 3.54 3.59 3.67 3.97 8.2% 3.3%
Visitor Spending 3.17 3.54 3.54 3.59 3.67 3.97 8.2% 3.3%
Overnight 2.23 2.51 2.50 2.52 2.59 2.83 9.3% 3.5%
Day 0.94 1.03 1.03 1.06 1.08 1.14 5.8% 2.8%
Total Direct Earnings (million) 0.86 0.85 0.99 1.06 1.14 1.25 10.4% 5.5%
Total Direct Employment 67.1 67.4 74.7 78.0 80.8 87.6 8.5% 3.9%
State & Local Gov't Rev.(million) 0.25 0.26 0.27 0.29 0.31 0.34 9.3% 4.6%
Visitor 0.17 0.19 0.19 0.20 0.22 0.23 9.0% 4.3%
Employer/Employee 0.07 0.07 0.08 0.09 0.10 0.11 10.1% 5.3%
Gooding County Travel Impacts, 2010-2017p
2010 2012 2014 2015 2016 2017 16-17 10-17
Total Direct Spending (million) 4.97 5.41 5.20 5.33 5.16 5.56 7.6% 1.6%
Visitor Spending 4.97 5.41 5.20 5.33 5.16 5.56 7.6% 1.6%
Overnight 3.39 3.72 3.52 3.62 3.52 3.82 8.4% 1.7%
Day 1.58 1.69 1.68 1.71 1.64 1.74 5.9% 1.4%
Total Direct Earnings (million) 1.38 1.36 1.50 1.62 1.63 1.77 9.0% 3.7%
Total Direct Employment 92.3 91.1 99.6 105.1 103.9 109.1 5.0% 2.4%
State & Local Gov't Rev.(million) 0.39 0.40 0.40 0.43 0.44 0.47 8.2% 2.7%
Visitor 0.28 0.29 0.28 0.30 0.30 0.32 8.1% 2.4%
Employer/Employee 0.12 0.11 0.13 0.14 0.14 0.15 8.6% 3.4%
DEAN RUNYAN ASSOCIATESPAGE 54

Idaho County Travel Impacts, 2010-2017p
2010 2012 2014 2015 2016 2017 16-17 10-17
Total Direct Spending (million) 18.17 18.86 17.91 18.90 17.63 18.41 4.4% 0.2%
Visitor Spending 17.81 18.49 17.91 18.90 17.63 18.41 4.4% 0.5%
Overnight 17.03 17.65 17.11 18.07 16.85 17.59 4.4% 0.5%
Day 0.78 0.84 0.80 0.84 0.79 0.82 4.6% 0.7%
Total Direct Earnings (million) 5.68 5.68 5.69 6.20 5.84 6.22 6.4% 1.3%
Total Direct Employment 347.4 356.3 342.6 363.7 348.9 343.1 -1.7% -0.2%
State & Local Gov't Rev.(million) 1.63 1.62 1.60 1.75 1.66 1.75 5.2% 1.0%
Visitor 1.15 1.16 1.14 1.24 1.18 1.24 4.8% 1.0%
Employer/Employee 0.48 0.47 0.46 0.51 0.48 0.51 6.1% 1.0%
Jefferson County Travel Impacts, 2010-2017p
2010 2012 2014 2015 2016 2017 16-17 10-17
Total Direct Spending (million) 6.18 7.60 7.83 7.36 8.13 9.89 21.5% 6.9%
Visitor Spending 6.18 7.60 7.83 7.36 8.13 9.89 21.5% 6.9%
Overnight 3.89 4.94 5.08 4.69 5.30 6.66 25.6% 8.0%
Day 2.29 2.66 2.75 2.67 2.83 3.23 14.0% 5.0%
Total Direct Earnings (million) 1.75 1.96 1.98 1.96 2.24 2.74 22.3% 6.6%
Total Direct Employment 121.2 121.3 119.0 116.8 134.2 150.7 12.3% 3.2%
State & Local Gov't Rev.(million) 0.48 0.56 0.57 0.56 0.65 0.79 21.9% 7.4%
Visitor 0.33 0.40 0.41 0.40 0.47 0.57 21.9% 7.9%
Employer/Employee 0.15 0.16 0.16 0.16 0.18 0.22 22.0% 6.3%
Jerome County Travel Impacts, 2010-2017p
2010 2012 2014 2015 2016 2017 16-17 10-17
Total Direct Spending (million) 13.43 16.41 17.62 18.57 21.35 20.15 -5.6% 6.0%
Visitor Spending 13.43 16.41 17.62 18.57 21.35 20.15 -5.6% 6.0%
Overnight 10.21 12.67 13.69 14.43 16.83 15.85 -5.8% 6.5%
Day 3.21 3.75 3.93 4.14 4.52 4.30 -4.9% 4.2%
Total Direct Earnings (million) 3.59 3.70 3.99 4.35 5.11 4.88 -4.4% 4.5%
Total Direct Employment 186.2 172.8 191.9 203.5 231.7 224.3 -3.2% 2.7%
State & Local Gov't Rev.(million) 1.08 1.24 1.33 1.45 1.73 1.64 -4.9% 6.1%
Visitor 0.77 0.92 0.99 1.08 1.29 1.23 -5.0% 6.8%
Employer/Employee 0.31 0.31 0.34 0.37 0.44 0.42 -4.7% 4.2%
PAGE 55 DEAN RUNYAN ASSOCIATES
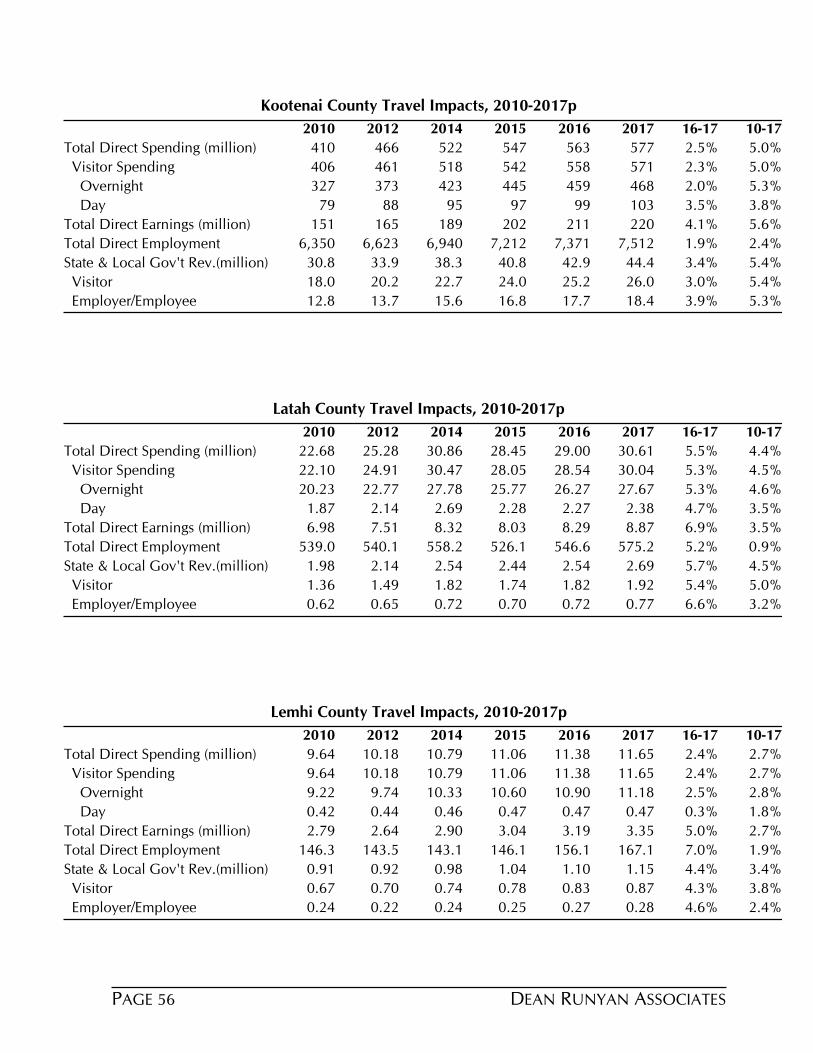
Kootenai County Travel Impacts, 2010-2017p
2010 2012 2014 2015 2016 2017 16-17 10-17
Total Direct Spending (million) 410 466 522 547 563 577 2.5% 5.0%
Visitor Spending 406 461 518 542 558 571 2.3% 5.0%
Overnight 327 373 423 445 459 468 2.0% 5.3%
Day 79 88 95 97 99 103 3.5% 3.8%
Total Direct Earnings (million) 151 165 189 202 211 220 4.1% 5.6%
Total Direct Employment 6,350 6,623 6,940 7,212 7,371 7,512 1.9% 2.4%
State & Local Gov't Rev.(million) 30.8 33.9 38.3 40.8 42.9 44.4 3.4% 5.4%
Visitor 18.0 20.2 22.7 24.0 25.2 26.0 3.0% 5.4%
Employer/Employee 12.8 13.7 15.6 16.8 17.7 18.4 3.9% 5.3%
Latah County Travel Impacts, 2010-2017p
2010 2012 2014 2015 2016 2017 16-17 10-17
Total Direct Spending (million) 22.68 25.28 30.86 28.45 29.00 30.61 5.5% 4.4%
Visitor Spending 22.10 24.91 30.47 28.05 28.54 30.04 5.3% 4.5%
Overnight 20.23 22.77 27.78 25.77 26.27 27.67 5.3% 4.6%
Day 1.87 2.14 2.69 2.28 2.27 2.38 4.7% 3.5%
Total Direct Earnings (million) 6.98 7.51 8.32 8.03 8.29 8.87 6.9% 3.5%
Total Direct Employment 539.0 540.1 558.2 526.1 546.6 575.2 5.2% 0.9%
State & Local Gov't Rev.(million) 1.98 2.14 2.54 2.44 2.54 2.69 5.7% 4.5%
Visitor 1.36 1.49 1.82 1.74 1.82 1.92 5.4% 5.0%
Employer/Employee 0.62 0.65 0.72 0.70 0.72 0.77 6.6% 3.2%
Lemhi County Travel Impacts, 2010-2017p
2010 2012 2014 2015 2016 2017 16-17 10-17
Total Direct Spending (million) 9.64 10.18 10.79 11.06 11.38 11.65 2.4% 2.7%
Visitor Spending 9.64 10.18 10.79 11.06 11.38 11.65 2.4% 2.7%
Overnight 9.22 9.74 10.33 10.60 10.90 11.18 2.5% 2.8%
Day 0.42 0.44 0.46 0.47 0.47 0.47 0.3% 1.8%
Total Direct Earnings (million) 2.79 2.64 2.90 3.04 3.19 3.35 5.0% 2.7%
Total Direct Employment 146.3 143.5 143.1 146.1 156.1 167.1 7.0% 1.9%
State & Local Gov't Rev.(million) 0.91 0.92 0.98 1.04 1.10 1.15 4.4% 3.4%
Visitor 0.67 0.70 0.74 0.78 0.83 0.87 4.3% 3.8%
Employer/Employee 0.24 0.22 0.24 0.25 0.27 0.28 4.6% 2.4%
DEAN RUNYAN ASSOCIATESPAGE 56

Lewis County Travel Impacts, 2010-2017p
2010 2012 2014 2015 2016 2017 16-17 10-17
Total Direct Spending (million) 2.74 2.93 3.49 3.84 4.10 4.00 -2.3% 5.6%
Visitor Spending 2.74 2.93 3.49 3.84 4.10 4.00 -2.3% 5.6%
Overnight 2.50 2.67 3.20 3.53 3.77 3.68 -2.4% 5.6%
Day 0.24 0.26 0.30 0.32 0.33 0.33 -1.1% 4.6%
Total Direct Earnings (million) 0.79 0.74 0.85 0.99 1.08 1.06 -1.6% 4.2%
Total Direct Employment 55.7 54.8 61.8 70.7 73.4 72.4 -1.3% 3.8%
State & Local Gov't Rev.(million) 0.22 0.22 0.27 0.31 0.34 0.33 -2.4% 5.7%
Visitor 0.15 0.16 0.19 0.22 0.25 0.24 -2.5% 6.5%
Employer/Employee 0.07 0.06 0.07 0.08 0.09 0.09 -1.9% 4.0%
Lincoln County Travel Impacts, 2010-2017p
2010 2012 2014 2015 2016 2017 16-17 10-17
Total Direct Spending (million) 0.77 0.84 0.87 0.81 0.78 0.81 4.2% 0.8%
Visitor Spending 0.77 0.84 0.87 0.81 0.78 0.81 4.2% 0.8%
Overnight 0.63 0.69 0.71 0.65 0.63 0.65 4.3% 0.6%
Day 0.14 0.15 0.16 0.16 0.15 0.16 3.6% 1.6%
Total Direct Earnings (million) 0.18 0.20 0.21 0.20 0.21 0.22 5.2% 2.5%
Total Direct Employment 10.1 10.0 8.6 8.2 9.4 9.1 -3.2% -1.6%
State & Local Gov't Rev.(million) 0.06 0.06 0.06 0.06 0.06 0.07 4.7% 1.9%
Visitor 0.04 0.04 0.05 0.04 0.05 0.05 4.6% 1.7%
Employer/Employee 0.02 0.02 0.02 0.02 0.02 0.02 4.9% 2.3%
Madison County Travel Impacts, 2010-2017p
2010 2012 2014 2015 2016 2017 16-17 10-17
Total Direct Spending (million) 17.15 16.78 18.22 18.85 19.64 21.74 10.7% 3.4%
Visitor Spending 17.15 16.78 18.22 18.85 19.64 21.74 10.7% 3.4%
Overnight 12.99 12.43 13.63 14.20 14.94 16.71 11.9% 3.7%
Day 4.16 4.35 4.60 4.65 4.70 5.03 6.9% 2.8%
Total Direct Earnings (million) 5.53 5.21 5.39 5.79 6.18 6.96 12.6% 3.4%
Total Direct Employment 330.4 313.5 313.1 326.8 359.1 397.6 10.7% 2.7%
State & Local Gov't Rev.(million) 1.48 1.38 1.49 1.60 1.73 1.93 11.6% 3.8%
Visitor 1.01 0.95 1.04 1.12 1.21 1.35 11.4% 4.1%
Employer/Employee 0.47 0.43 0.45 0.48 0.52 0.58 12.3% 3.1%
PAGE 57 DEAN RUNYAN ASSOCIATES

Minidoka County Travel Impacts, 2010-2017p
2010 2012 2014 2015 2016 2017 16-17 10-17
Total Direct Spending (million) 7.40 8.34 8.04 8.85 8.66 8.99 3.8% 2.8%
Visitor Spending 7.40 8.34 8.04 8.85 8.66 8.99 3.8% 2.8%
Overnight 5.22 5.91 5.68 6.28 6.18 6.42 3.8% 3.0%
Day 2.18 2.43 2.37 2.56 2.48 2.57 3.6% 2.4%
Total Direct Earnings (million) 2.07 2.18 2.32 2.67 2.69 2.83 5.3% 4.6%
Total Direct Employment 119.9 119.4 125.9 141.6 137.5 142.8 3.9% 2.5%
State & Local Gov't Rev.(million) 0.60 0.64 0.64 0.74 0.75 0.78 4.4% 3.8%
Visitor 0.42 0.46 0.44 0.51 0.52 0.54 4.1% 3.5%
Employer/Employee 0.18 0.19 0.20 0.23 0.23 0.24 4.9% 4.3%
Nez Perce County Travel Impacts, 2010-2017p
2010 2012 2014 2015 2016 2017 16-17 10-17
Total Direct Spending (million) 75 82 88 88 89 95 6.7% 3.3%
Visitor Spending 66 70 76 77 76 81 6.9% 3.0%
Overnight 43 46 51 51 50 54 7.5% 3.4%
Day 23 24 26 26 25 27 5.7% 2.2%
Total Direct Earnings (million) 21 22 23 26 26 28 7.5% 4.4%
Total Direct Employment 910 919 921 942 967 1,035 7.1% 1.9%
State & Local Gov't Rev.(million) 5.0 5.1 5.6 5.9 6.0 6.5 7.4% 3.8%
Visitor 3.2 3.3 3.6 3.8 3.8 4.1 7.6% 3.6%
Employer/Employee 1.8 1.8 2.0 2.2 2.2 2.4 7.2% 4.2%
Oneida County Travel Impacts, 2010-2017p
2010 2012 2014 2015 2016 2017 16-17 10-17
Total Direct Spending (million) 2.08 2.70 2.25 2.21 2.48 2.48 0.1% 2.5%
Visitor Spending 2.08 2.70 2.25 2.21 2.48 2.48 0.1% 2.5%
Overnight 1.45 1.94 1.58 1.54 1.75 1.75 -0.2% 2.7%
Day 0.63 0.75 0.67 0.66 0.73 0.73 0.7% 2.2%
Total Direct Earnings (million) 0.69 0.82 0.76 0.78 0.90 0.91 1.0% 4.0%
Total Direct Employment 30.4 35.6 31.1 30.9 36.2 38.4 5.9% 3.4%
State & Local Gov't Rev.(million) 0.17 0.21 0.18 0.18 0.21 0.21 0.3% 3.5%
Visitor 0.11 0.15 0.12 0.12 0.14 0.14 0.1% 3.3%
Employer/Employee 0.05 0.06 0.06 0.06 0.07 0.07 0.6% 3.9%
DEAN RUNYAN ASSOCIATESPAGE 58

Owyhee County Travel Impacts, 2010-2017p
2010 2012 2014 2015 2016 2017 16-17 10-17
Total Direct Spending (million) 4.00 4.14 4.12 3.93 4.09 4.22 3.2% 0.8%
Visitor Spending 4.00 4.14 4.12 3.93 4.09 4.22 3.2% 0.8%
Overnight 3.75 3.88 3.86 3.67 3.82 3.94 3.1% 0.7%
Day 0.25 0.27 0.27 0.26 0.27 0.28 4.4% 1.9%
Total Direct Earnings (million) 1.02 0.95 1.06 1.07 1.15 1.20 4.6% 2.4%
Total Direct Employment 93.2 78.2 86.3 84.3 95.6 102.5 7.2% 1.4%
State & Local Gov't Rev.(million) 0.30 0.29 0.30 0.30 0.32 0.33 3.9% 1.6%
Visitor 0.21 0.21 0.21 0.21 0.23 0.24 3.7% 1.3%
Employer/Employee 0.09 0.08 0.09 0.09 0.10 0.10 4.2% 2.1%
Payette County Travel Impacts, 2010-2017p
2010 2012 2014 2015 2016 2017 16-17 10-17
Total Direct Spending (million) 4.51 4.93 4.93 5.00 4.94 5.56 12.5% 3.0%
Visitor Spending 4.51 4.93 4.93 5.00 4.94 5.56 12.5% 3.0%
Overnight 2.67 2.93 2.89 2.93 2.91 3.35 15.4% 3.3%
Day 1.84 2.01 2.04 2.07 2.03 2.20 8.3% 2.6%
Total Direct Earnings (million) 1.13 1.06 1.12 1.21 1.25 1.44 15.5% 3.5%
Total Direct Employment 70.4 61.1 61.9 64.9 65.7 71.8 9.3% 0.3%
State & Local Gov't Rev.(million) 0.33 0.34 0.34 0.37 0.38 0.43 14.1% 3.9%
Visitor 0.24 0.25 0.25 0.27 0.28 0.32 13.8% 4.1%
Employer/Employee 0.10 0.09 0.09 0.10 0.10 0.12 15.1% 3.2%
Power County Travel Impacts, 2010-2017p
2010 2012 2014 2015 2016 2017 16-17 10-17
Total Direct Spending (million) 3.24 3.70 3.36 3.16 3.35 3.37 0.7% 0.6%
Visitor Spending 3.24 3.70 3.36 3.16 3.35 3.37 0.7% 0.6%
Overnight 2.88 3.30 2.99 2.79 2.96 2.98 0.8% 0.5%
Day 0.36 0.40 0.38 0.37 0.39 0.39 0.5% 1.3%
Total Direct Earnings (million) 0.73 0.82 0.70 0.69 0.76 0.79 3.4% 1.0%
Total Direct Employment 50.2 59.1 45.4 43.8 44.7 45.5 1.9% -1.4%
State & Local Gov't Rev.(million) 0.23 0.26 0.23 0.22 0.25 0.26 2.4% 1.3%
Visitor 0.17 0.19 0.17 0.16 0.18 0.19 2.2% 1.5%
Employer/Employee 0.06 0.07 0.06 0.06 0.07 0.07 3.0% 0.8%
PAGE 59 DEAN RUNYAN ASSOCIATES
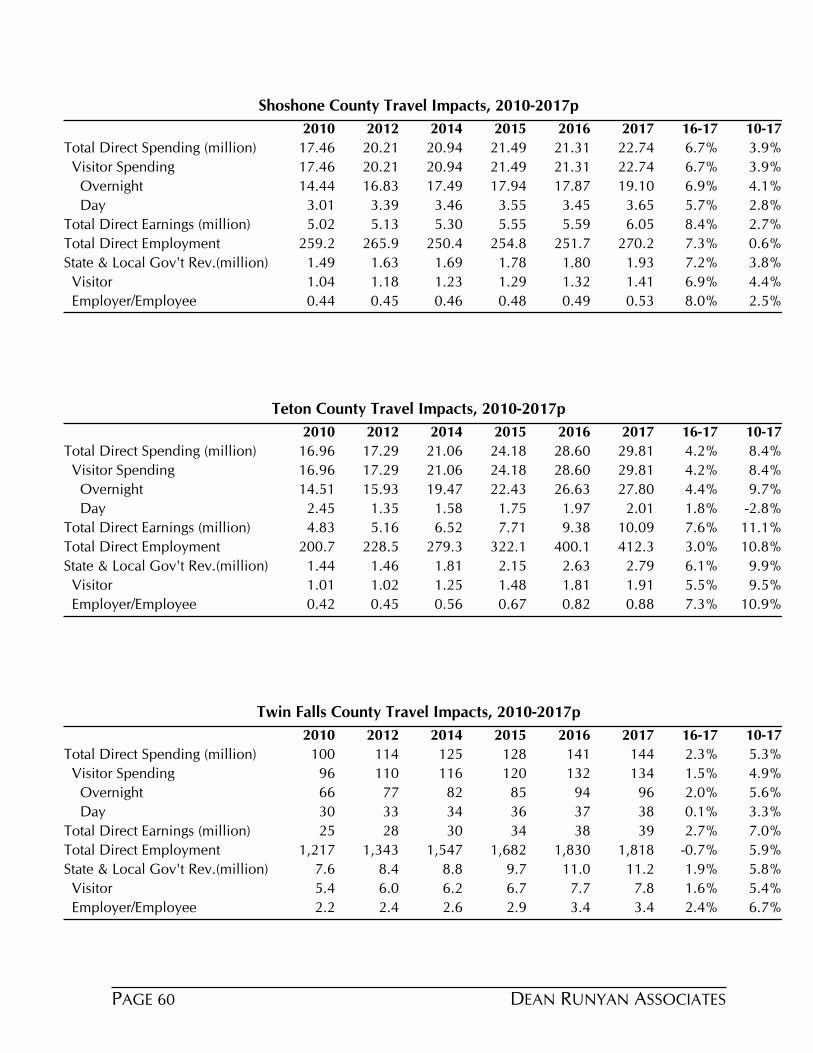
Shoshone County Travel Impacts, 2010-2017p
2010 2012 2014 2015 2016 2017 16-17 10-17
Total Direct Spending (million) 17.46 20.21 20.94 21.49 21.31 22.74 6.7% 3.9%
Visitor Spending 17.46 20.21 20.94 21.49 21.31 22.74 6.7% 3.9%
Overnight 14.44 16.83 17.49 17.94 17.87 19.10 6.9% 4.1%
Day 3.01 3.39 3.46 3.55 3.45 3.65 5.7% 2.8%
Total Direct Earnings (million) 5.02 5.13 5.30 5.55 5.59 6.05 8.4% 2.7%
Total Direct Employment 259.2 265.9 250.4 254.8 251.7 270.2 7.3% 0.6%
State & Local Gov't Rev.(million) 1.49 1.63 1.69 1.78 1.80 1.93 7.2% 3.8%
Visitor 1.04 1.18 1.23 1.29 1.32 1.41 6.9% 4.4%
Employer/Employee 0.44 0.45 0.46 0.48 0.49 0.53 8.0% 2.5%
Teton County Travel Impacts, 2010-2017p
2010 2012 2014 2015 2016 2017 16-17 10-17
Total Direct Spending (million) 16.96 17.29 21.06 24.18 28.60 29.81 4.2% 8.4%
Visitor Spending 16.96 17.29 21.06 24.18 28.60 29.81 4.2% 8.4%
Overnight 14.51 15.93 19.47 22.43 26.63 27.80 4.4% 9.7%
Day 2.45 1.35 1.58 1.75 1.97 2.01 1.8% -2.8%
Total Direct Earnings (million) 4.83 5.16 6.52 7.71 9.38 10.09 7.6% 11.1%
Total Direct Employment 200.7 228.5 279.3 322.1 400.1 412.3 3.0% 10.8%
State & Local Gov't Rev.(million) 1.44 1.46 1.81 2.15 2.63 2.79 6.1% 9.9%
Visitor 1.01 1.02 1.25 1.48 1.81 1.91 5.5% 9.5%
Employer/Employee 0.42 0.45 0.56 0.67 0.82 0.88 7.3% 10.9%
Twin Falls County Travel Impacts, 2010-2017p
2010 2012 2014 2015 2016 2017 16-17 10-17
Total Direct Spending (million) 100 114 125 128 141 144 2.3% 5.3%
Visitor Spending 96 110 116 120 132 134 1.5% 4.9%
Overnight 66 77 82 85 94 96 2.0% 5.6%
Day 30 33 34 36 37 38 0.1% 3.3%
Total Direct Earnings (million) 25 28 30 34 38 39 2.7% 7.0%
Total Direct Employment 1,217 1,343 1,547 1,682 1,830 1,818 -0.7% 5.9%
State & Local Gov't Rev.(million) 7.6 8.4 8.8 9.7 11.0 11.2 1.9% 5.8%
Visitor 5.4 6.0 6.2 6.7 7.7 7.8 1.6% 5.4%
Employer/Employee 2.2 2.4 2.6 2.9 3.4 3.4 2.4% 6.7%
DEAN RUNYAN ASSOCIATESPAGE 60

Valley County Travel Impacts, 2010-2017p
2010 2012 2014 2015 2016 2017 16-17 10-17
Total Direct Spending (million) 70 79 92 96 99 107 8.1% 6.2%
Visitor Spending 69 79 92 95 98 106 8.1% 6.2%
Overnight 67 76 89 93 95 103 8.1% 6.3%
Day 2 2 3 3 3 3 7.1% 4.8%
Total Direct Earnings (million) 20 23 27 29 30 34 11.4% 8.0%
Total Direct Employment 816 900 1,006 1,053 1,044 1,119 7.2% 4.6%
State & Local Gov't Rev.(million) 5.8 6.6 7.7 8.3 8.7 9.6 9.6% 7.3%
Visitor 4.1 4.5 5.4 5.7 6.0 6.6 8.9% 7.1%
Employer/Employee 1.8 2.0 2.4 2.6 2.7 3.0 11.1% 7.7%
Washington County Travel Impacts, 2010-2017p
2010 2012 2014 2015 2016 2017 16-17 10-17
Total Direct Spending (million) 2.69 2.95 3.19 2.94 2.85 3.36 18.0% 3.2%
Visitor Spending 2.69 2.95 3.19 2.94 2.85 3.36 18.0% 3.2%
Overnight 2.30 2.54 2.75 2.52 2.44 2.90 19.1% 3.3%
Day 0.38 0.42 0.44 0.42 0.41 0.46 11.3% 2.6%
Total Direct Earnings (million) 0.71 0.69 0.75 0.72 0.71 0.87 22.5% 2.9%
Total Direct Employment 38.0 40.6 39.4 36.4 35.5 42.8 20.6% 1.7%
State & Local Gov't Rev.(million) 0.21 0.22 0.24 0.23 0.23 0.28 20.2% 3.7%
Visitor 0.15 0.16 0.18 0.17 0.17 0.20 19.5% 4.2%
Employer/Employee 0.06 0.06 0.06 0.06 0.06 0.07 22.0% 2.6%
PAGE 61 DEAN RUNYAN ASSOCIATES

V. LEGISLATIVE DISTRICT TRAVEL IMPACTS2017
DEAN RUNYAN ASSOCIATESPAGE 62

Legislative District 001
Travel Impacts
Spending (millions)
Visitor Spending
Other Spending
Earnings (millions)
Employment (thousands)
State & Local Tax Revenue (millions)
Local Tax Revenue
State Tax Revenue
$143
$143
$0
$45
2.1
$13
$2
$11
Employment Characteristics (2017)
Travel Percent of Total District Employment
Travel-generated employment
All Payroll & Self-employment
District Percent of Statewide Employment
2.7%
4.6%
7.7%
Travel-generated tax revenue (2017p)
$100 of Visitor Spending GeneratesTravel-Generated Tax Revenuesper District Household
Local & State Total
State tax revenue
Local tax revenue
Local & State Total
State tax revenue
Local tax revenue$1.40
$7.80
$9.20
$91
$508
$599
Visitor Spending includes spending on lodging, food services, recreation, shopping and local transportation. Other Spending includes resident air travel and ground travel to other Idaho destinations, travel arrangement & reservation services.. Earnings include wages and salaries, paid benefits and self-employment income. Employment includes all full- and part-time jobs for wage and salary employees and the self-employed. The employment and earnings estimates are for place of work rather than the residence of the worker. Local tax revenue includes lodging and sales taxes imposed by cities, counties and other regional tax jurisdictions in Idaho. These taxes are levied on sales to visitors and the spending of employees attributable to travel industry earnings. Passenger facility charges attributable to visitors (a fee imposed on airline tickets) are included in districts with airports. Property tax payments attributable to travel industry businesses and employees are also included. State tax revenue includes sales, motor fuel, and business and personal income taxes imposed by the state of Idaho. These taxes are levied on sales to visitors and the spending of employees attributable to travel industry earnings.
Bonners Ferry, Sandpoint
Boundary and Bonner counties
$131
$131
$0
$41
2.0
$2
$10
$12
2017p2016
PAGE 63 DEAN RUNYAN ASSOCIATES

Legislative District 002
Travel Impacts
Spending (millions)
Visitor Spending
Other Spending
Earnings (millions)
Employment (thousands)
State & Local Tax Revenue (millions)
Local Tax Revenue
State Tax Revenue
$59
$58
$1
$17
0.7
$7
$2
$6
Employment Characteristics (2017)
Travel Percent of Total District Employment
Travel-generated employment
All Payroll & Self-employment
District Percent of Statewide Employment
2.2%
1.4%
3.0%
Travel-generated tax revenue (2017p)
$100 of Visitor Spending GeneratesTravel-Generated Tax Revenuesper District Household
Local & State Total
State tax revenue
Local tax revenue
Local & State Total
State tax revenue
Local tax revenue$2.90
$9.70
$12.70
$86
$283
$369
Visitor Spending includes spending on lodging, food services, recreation, shopping and local transportation. Other Spending includes resident air travel and ground travel to other Idaho destinations, travel arrangement & reservation services.. Earnings include wages and salaries, paid benefits and self-employment income. Employment includes all full- and part-time jobs for wage and salary employees and the self-employed. The employment and earnings estimates are for place of work rather than the residence of the worker. Local tax revenue includes lodging and sales taxes imposed by cities, counties and other regional tax jurisdictions in Idaho. These taxes are levied on sales to visitors and the spending of employees attributable to travel industry earnings. Passenger facility charges attributable to visitors (a fee imposed on airline tickets) are included in districts with airports. Property tax payments attributable to travel industry businesses and employees are also included. State tax revenue includes sales, motor fuel, and business and personal income taxes imposed by the state of Idaho. These taxes are levied on sales to visitors and the spending of employees attributable to travel industry earnings.
Dalton Gardens, Hayden
Kootenai County
$56
$55
$1
$17
0.6
$2
$5
$7
2017p2016
DEAN RUNYAN ASSOCIATESPAGE 64

Legislative District 003
Travel Impacts
Spending (millions)
Visitor Spending
Other Spending
Earnings (millions)
Employment (thousands)
State & Local Tax Revenue (millions)
Local Tax Revenue
State Tax Revenue
$170
$168
$1
$63
2.3
$14
$2
$12
Employment Characteristics (2017)
Travel Percent of Total District Employment
Travel-generated employment
All Payroll & Self-employment
District Percent of Statewide Employment
2.5%
5.0%
9.0%
Travel-generated tax revenue (2017p)
$100 of Visitor Spending GeneratesTravel-Generated Tax Revenuesper District Household
Local & State Total
State tax revenue
Local tax revenue
Local & State Total
State tax revenue
Local tax revenue$1.00
$7.00
$8.00
$87
$583
$670
Visitor Spending includes spending on lodging, food services, recreation, shopping and local transportation. Other Spending includes resident air travel and ground travel to other Idaho destinations, travel arrangement & reservation services.. Earnings include wages and salaries, paid benefits and self-employment income. Employment includes all full- and part-time jobs for wage and salary employees and the self-employed. The employment and earnings estimates are for place of work rather than the residence of the worker. Local tax revenue includes lodging and sales taxes imposed by cities, counties and other regional tax jurisdictions in Idaho. These taxes are levied on sales to visitors and the spending of employees attributable to travel industry earnings. Passenger facility charges attributable to visitors (a fee imposed on airline tickets) are included in districts with airports. Property tax payments attributable to travel industry businesses and employees are also included. State tax revenue includes sales, motor fuel, and business and personal income taxes imposed by the state of Idaho. These taxes are levied on sales to visitors and the spending of employees attributable to travel industry earnings.
Coeur d'Alene, Post Falls
Kootenai County
$165
$164
$1
$61
2.3
$2
$11
$13
2017p2016
PAGE 65 DEAN RUNYAN ASSOCIATES

Legislative District 004
Travel Impacts
Spending (millions)
Visitor Spending
Other Spending
Earnings (millions)
Employment (thousands)
State & Local Tax Revenue (millions)
Local Tax Revenue
State Tax Revenue
$339
$335
$4
$134
4.8
$23
$2
$21
Employment Characteristics (2017)
Travel Percent of Total District Employment
Travel-generated employment
All Payroll & Self-employment
District Percent of Statewide Employment
4.0%
10.6%
12.0%
Travel-generated tax revenue (2017p)
$100 of Visitor Spending GeneratesTravel-Generated Tax Revenuesper District Household
Local & State Total
State tax revenue
Local tax revenue
Local & State Total
State tax revenue
Local tax revenue$0.50
$6.30
$6.80
$87
$1,012
$1,099
Visitor Spending includes spending on lodging, food services, recreation, shopping and local transportation. Other Spending includes resident air travel and ground travel to other Idaho destinations, travel arrangement & reservation services.. Earnings include wages and salaries, paid benefits and self-employment income. Employment includes all full- and part-time jobs for wage and salary employees and the self-employed. The employment and earnings estimates are for place of work rather than the residence of the worker. Local tax revenue includes lodging and sales taxes imposed by cities, counties and other regional tax jurisdictions in Idaho. These taxes are levied on sales to visitors and the spending of employees attributable to travel industry earnings. Passenger facility charges attributable to visitors (a fee imposed on airline tickets) are included in districts with airports. Property tax payments attributable to travel industry businesses and employees are also included. State tax revenue includes sales, motor fuel, and business and personal income taxes imposed by the state of Idaho. These taxes are levied on sales to visitors and the spending of employees attributable to travel industry earnings.
Coeur d'Alene
Kootenai County
$332
$329
$3
$129
4.8
$2
$20
$22
2017p2016
DEAN RUNYAN ASSOCIATESPAGE 66

Legislative District 005
Travel Impacts
Spending (millions)
Visitor Spending
Other Spending
Earnings (millions)
Employment (thousands)
State & Local Tax Revenue (millions)
Local Tax Revenue
State Tax Revenue
$39
$38
$1
$11
0.7
$3
$0
$3
Employment Characteristics (2017)
Travel Percent of Total District Employment
Travel-generated employment
All Payroll & Self-employment
District Percent of Statewide Employment
2.7%
1.6%
2.7%
Travel-generated tax revenue (2017p)
$100 of Visitor Spending GeneratesTravel-Generated Tax Revenuesper District Household
Local & State Total
State tax revenue
Local tax revenue
Local & State Total
State tax revenue
Local tax revenue$0.70
$8.20
$8.90
$14
$168
$183
Visitor Spending includes spending on lodging, food services, recreation, shopping and local transportation. Other Spending includes resident air travel and ground travel to other Idaho destinations, travel arrangement & reservation services.. Earnings include wages and salaries, paid benefits and self-employment income. Employment includes all full- and part-time jobs for wage and salary employees and the self-employed. The employment and earnings estimates are for place of work rather than the residence of the worker. Local tax revenue includes lodging and sales taxes imposed by cities, counties and other regional tax jurisdictions in Idaho. These taxes are levied on sales to visitors and the spending of employees attributable to travel industry earnings. Passenger facility charges attributable to visitors (a fee imposed on airline tickets) are included in districts with airports. Property tax payments attributable to travel industry businesses and employees are also included. State tax revenue includes sales, motor fuel, and business and personal income taxes imposed by the state of Idaho. These taxes are levied on sales to visitors and the spending of employees attributable to travel industry earnings.
Moscow, Plummer
Benewah and Latah counties
$37
$37
$0
$11
0.7
$0
$3
$3
2017p2016
PAGE 67 DEAN RUNYAN ASSOCIATES

Legislative District 006
Travel Impacts
Spending (millions)
Visitor Spending
Other Spending
Earnings (millions)
Employment (thousands)
State & Local Tax Revenue (millions)
Local Tax Revenue
State Tax Revenue
$80
$66
$14
$23
1.0
$6
$1
$5
Employment Characteristics (2017)
Travel Percent of Total District Employment
Travel-generated employment
All Payroll & Self-employment
District Percent of Statewide Employment
2.9%
2.1%
3.3%
Travel-generated tax revenue (2017p)
$100 of Visitor Spending GeneratesTravel-Generated Tax Revenuesper District Household
Local & State Total
State tax revenue
Local tax revenue
Local & State Total
State tax revenue
Local tax revenue$1.20
$7.30
$8.60
$45
$269
$314
Visitor Spending includes spending on lodging, food services, recreation, shopping and local transportation. Other Spending includes resident air travel and ground travel to other Idaho destinations, travel arrangement & reservation services.. Earnings include wages and salaries, paid benefits and self-employment income. Employment includes all full- and part-time jobs for wage and salary employees and the self-employed. The employment and earnings estimates are for place of work rather than the residence of the worker. Local tax revenue includes lodging and sales taxes imposed by cities, counties and other regional tax jurisdictions in Idaho. These taxes are levied on sales to visitors and the spending of employees attributable to travel industry earnings. Passenger facility charges attributable to visitors (a fee imposed on airline tickets) are included in districts with airports. Property tax payments attributable to travel industry businesses and employees are also included. State tax revenue includes sales, motor fuel, and business and personal income taxes imposed by the state of Idaho. These taxes are levied on sales to visitors and the spending of employees attributable to travel industry earnings.
Lewiston
Lewis and Nez Perce counties
$75
$62
$14
$21
0.9
$1
$5
$5
2017p2016
DEAN RUNYAN ASSOCIATESPAGE 68

Legislative District 007
Travel Impacts
Spending (millions)
Visitor Spending
Other Spending
Earnings (millions)
Employment (thousands)
State & Local Tax Revenue (millions)
Local Tax Revenue
State Tax Revenue
$59
$59
$0
$17
1.0
$5
$1
$5
Employment Characteristics (2017)
Travel Percent of Total District Employment
Travel-generated employment
All Payroll & Self-employment
District Percent of Statewide Employment
2.0%
2.1%
4.9%
Travel-generated tax revenue (2017p)
$100 of Visitor Spending GeneratesTravel-Generated Tax Revenuesper District Household
Local & State Total
State tax revenue
Local tax revenue
Local & State Total
State tax revenue
Local tax revenue$1.10
$8.20
$9.20
$33
$258
$292
Visitor Spending includes spending on lodging, food services, recreation, shopping and local transportation. Other Spending includes resident air travel and ground travel to other Idaho destinations, travel arrangement & reservation services.. Earnings include wages and salaries, paid benefits and self-employment income. Employment includes all full- and part-time jobs for wage and salary employees and the self-employed. The employment and earnings estimates are for place of work rather than the residence of the worker. Local tax revenue includes lodging and sales taxes imposed by cities, counties and other regional tax jurisdictions in Idaho. These taxes are levied on sales to visitors and the spending of employees attributable to travel industry earnings. Passenger facility charges attributable to visitors (a fee imposed on airline tickets) are included in districts with airports. Property tax payments attributable to travel industry businesses and employees are also included. State tax revenue includes sales, motor fuel, and business and personal income taxes imposed by the state of Idaho. These taxes are levied on sales to visitors and the spending of employees attributable to travel industry earnings.
Kellogg, Orofino, Riggins
Bonner, Clearwater, Idaho, and Shoshone counties
$57
$57
$0
$16
1.0
$1
$5
$5
2017p2016
PAGE 69 DEAN RUNYAN ASSOCIATES

Legislative District 008
Travel Impacts
Spending (millions)
Visitor Spending
Other Spending
Earnings (millions)
Employment (thousands)
State & Local Tax Revenue (millions)
Local Tax Revenue
State Tax Revenue
$168
$166
$2
$54
2.3
$15
$2
$13
Employment Characteristics (2017)
Travel Percent of Total District Employment
Travel-generated employment
All Payroll & Self-employment
District Percent of Statewide Employment
2.6%
5.1%
9.0%
Travel-generated tax revenue (2017p)
$100 of Visitor Spending GeneratesTravel-Generated Tax Revenuesper District Household
Local & State Total
State tax revenue
Local tax revenue
Local & State Total
State tax revenue
Local tax revenue$1.30
$7.80
$9.10
$99
$610
$709
Visitor Spending includes spending on lodging, food services, recreation, shopping and local transportation. Other Spending includes resident air travel and ground travel to other Idaho destinations, travel arrangement & reservation services.. Earnings include wages and salaries, paid benefits and self-employment income. Employment includes all full- and part-time jobs for wage and salary employees and the self-employed. The employment and earnings estimates are for place of work rather than the residence of the worker. Local tax revenue includes lodging and sales taxes imposed by cities, counties and other regional tax jurisdictions in Idaho. These taxes are levied on sales to visitors and the spending of employees attributable to travel industry earnings. Passenger facility charges attributable to visitors (a fee imposed on airline tickets) are included in districts with airports. Property tax payments attributable to travel industry businesses and employees are also included. State tax revenue includes sales, motor fuel, and business and personal income taxes imposed by the state of Idaho. These taxes are levied on sales to visitors and the spending of employees attributable to travel industry earnings.
Cascade, Garden Valley, McCall
Boise, Custer, Gem, Lemhi, and Valley counties
$155
$154
$1
$48
2.2
$2
$12
$14
2017p2016
DEAN RUNYAN ASSOCIATESPAGE 70

Legislative District 009
Travel Impacts
Spending (millions)
Visitor Spending
Other Spending
Earnings (millions)
Employment (thousands)
State & Local Tax Revenue (millions)
Local Tax Revenue
State Tax Revenue
$16
$16
$0
$4
0.2
$1
$0
$1
Employment Characteristics (2017)
Travel Percent of Total District Employment
Travel-generated employment
All Payroll & Self-employment
District Percent of Statewide Employment
2.0%
0.5%
1.2%
Travel-generated tax revenue (2017p)
$100 of Visitor Spending GeneratesTravel-Generated Tax Revenuesper District Household
Local & State Total
State tax revenue
Local tax revenue
Local & State Total
State tax revenue
Local tax revenue$0.90
$8.30
$9.10
$8
$74
$82
Visitor Spending includes spending on lodging, food services, recreation, shopping and local transportation. Other Spending includes resident air travel and ground travel to other Idaho destinations, travel arrangement & reservation services.. Earnings include wages and salaries, paid benefits and self-employment income. Employment includes all full- and part-time jobs for wage and salary employees and the self-employed. The employment and earnings estimates are for place of work rather than the residence of the worker. Local tax revenue includes lodging and sales taxes imposed by cities, counties and other regional tax jurisdictions in Idaho. These taxes are levied on sales to visitors and the spending of employees attributable to travel industry earnings. Passenger facility charges attributable to visitors (a fee imposed on airline tickets) are included in districts with airports. Property tax payments attributable to travel industry businesses and employees are also included. State tax revenue includes sales, motor fuel, and business and personal income taxes imposed by the state of Idaho. These taxes are levied on sales to visitors and the spending of employees attributable to travel industry earnings.
Fruitland, Parma
Adams, Canyon, Payette, and Washington counties
$15
$15
$0
$4
0.2
$0
$1
$1
2017p2016
PAGE 71 DEAN RUNYAN ASSOCIATES

Legislative District 010
Travel Impacts
Spending (millions)
Visitor Spending
Other Spending
Earnings (millions)
Employment (thousands)
State & Local Tax Revenue (millions)
Local Tax Revenue
State Tax Revenue
$33
$33
$0
$7
0.4
$3
$0
$3
Employment Characteristics (2017)
Travel Percent of Total District Employment
Travel-generated employment
All Payroll & Self-employment
District Percent of Statewide Employment
2.3%
1.0%
1.9%
Travel-generated tax revenue (2017p)
$100 of Visitor Spending GeneratesTravel-Generated Tax Revenuesper District Household
Local & State Total
State tax revenue
Local tax revenue
Local & State Total
State tax revenue
Local tax revenue$0.60
$8.70
$9.30
$11
$162
$173
Visitor Spending includes spending on lodging, food services, recreation, shopping and local transportation. Other Spending includes resident air travel and ground travel to other Idaho destinations, travel arrangement & reservation services.. Earnings include wages and salaries, paid benefits and self-employment income. Employment includes all full- and part-time jobs for wage and salary employees and the self-employed. The employment and earnings estimates are for place of work rather than the residence of the worker. Local tax revenue includes lodging and sales taxes imposed by cities, counties and other regional tax jurisdictions in Idaho. These taxes are levied on sales to visitors and the spending of employees attributable to travel industry earnings. Passenger facility charges attributable to visitors (a fee imposed on airline tickets) are included in districts with airports. Property tax payments attributable to travel industry businesses and employees are also included. State tax revenue includes sales, motor fuel, and business and personal income taxes imposed by the state of Idaho. These taxes are levied on sales to visitors and the spending of employees attributable to travel industry earnings.
Caldwell
Canyon County
$30
$30
$0
$7
0.4
$0
$3
$3
2017p2016
DEAN RUNYAN ASSOCIATESPAGE 72

Legislative District 011
Travel Impacts
Spending (millions)
Visitor Spending
Other Spending
Earnings (millions)
Employment (thousands)
State & Local Tax Revenue (millions)
Local Tax Revenue
State Tax Revenue
$19
$19
$0
$4
0.2
$2
$0
$2
Employment Characteristics (2017)
Travel Percent of Total District Employment
Travel-generated employment
All Payroll & Self-employment
District Percent of Statewide Employment
1.3%
0.5%
1.6%
Travel-generated tax revenue (2017p)
$100 of Visitor Spending GeneratesTravel-Generated Tax Revenuesper District Household
Local & State Total
State tax revenue
Local tax revenue
Local & State Total
State tax revenue
Local tax revenue$1.10
$9.80
$10.90
$12
$110
$121
Visitor Spending includes spending on lodging, food services, recreation, shopping and local transportation. Other Spending includes resident air travel and ground travel to other Idaho destinations, travel arrangement & reservation services.. Earnings include wages and salaries, paid benefits and self-employment income. Employment includes all full- and part-time jobs for wage and salary employees and the self-employed. The employment and earnings estimates are for place of work rather than the residence of the worker. Local tax revenue includes lodging and sales taxes imposed by cities, counties and other regional tax jurisdictions in Idaho. These taxes are levied on sales to visitors and the spending of employees attributable to travel industry earnings. Passenger facility charges attributable to visitors (a fee imposed on airline tickets) are included in districts with airports. Property tax payments attributable to travel industry businesses and employees are also included. State tax revenue includes sales, motor fuel, and business and personal income taxes imposed by the state of Idaho. These taxes are levied on sales to visitors and the spending of employees attributable to travel industry earnings.
Middleton, Wilder
Canyon County
$17
$17
$0
$3
0.2
$0
$2
$2
2017p2016
PAGE 73 DEAN RUNYAN ASSOCIATES

Legislative District 012
Travel Impacts
Spending (millions)
Visitor Spending
Other Spending
Earnings (millions)
Employment (thousands)
State & Local Tax Revenue (millions)
Local Tax Revenue
State Tax Revenue
$63
$63
$0
$17
1.0
$5
$0
$5
Employment Characteristics (2017)
Travel Percent of Total District Employment
Travel-generated employment
All Payroll & Self-employment
District Percent of Statewide Employment
3.5%
2.1%
2.8%
Travel-generated tax revenue (2017p)
$100 of Visitor Spending GeneratesTravel-Generated Tax Revenuesper District Household
Local & State Total
State tax revenue
Local tax revenue
Local & State Total
State tax revenue
Local tax revenue$0.30
$8.10
$8.40
$11
$284
$295
Visitor Spending includes spending on lodging, food services, recreation, shopping and local transportation. Other Spending includes resident air travel and ground travel to other Idaho destinations, travel arrangement & reservation services.. Earnings include wages and salaries, paid benefits and self-employment income. Employment includes all full- and part-time jobs for wage and salary employees and the self-employed. The employment and earnings estimates are for place of work rather than the residence of the worker. Local tax revenue includes lodging and sales taxes imposed by cities, counties and other regional tax jurisdictions in Idaho. These taxes are levied on sales to visitors and the spending of employees attributable to travel industry earnings. Passenger facility charges attributable to visitors (a fee imposed on airline tickets) are included in districts with airports. Property tax payments attributable to travel industry businesses and employees are also included. State tax revenue includes sales, motor fuel, and business and personal income taxes imposed by the state of Idaho. These taxes are levied on sales to visitors and the spending of employees attributable to travel industry earnings.
Nampa
Canyon County
$58
$58
$0
$15
0.9
$0
$5
$5
2017p2016
DEAN RUNYAN ASSOCIATESPAGE 74

Legislative District 013
Travel Impacts
Spending (millions)
Visitor Spending
Other Spending
Earnings (millions)
Employment (thousands)
State & Local Tax Revenue (millions)
Local Tax Revenue
State Tax Revenue
$18
$18
$0
$3
0.2
$2
$0
$2
Employment Characteristics (2017)
Travel Percent of Total District Employment
Travel-generated employment
All Payroll & Self-employment
District Percent of Statewide Employment
1.9%
0.4%
1.1%
Travel-generated tax revenue (2017p)
$100 of Visitor Spending GeneratesTravel-Generated Tax Revenuesper District Household
Local & State Total
State tax revenue
Local tax revenue
Local & State Total
State tax revenue
Local tax revenue$1.00
$9.90
$10.90
$11
$105
$116
Visitor Spending includes spending on lodging, food services, recreation, shopping and local transportation. Other Spending includes resident air travel and ground travel to other Idaho destinations, travel arrangement & reservation services.. Earnings include wages and salaries, paid benefits and self-employment income. Employment includes all full- and part-time jobs for wage and salary employees and the self-employed. The employment and earnings estimates are for place of work rather than the residence of the worker. Local tax revenue includes lodging and sales taxes imposed by cities, counties and other regional tax jurisdictions in Idaho. These taxes are levied on sales to visitors and the spending of employees attributable to travel industry earnings. Passenger facility charges attributable to visitors (a fee imposed on airline tickets) are included in districts with airports. Property tax payments attributable to travel industry businesses and employees are also included. State tax revenue includes sales, motor fuel, and business and personal income taxes imposed by the state of Idaho. These taxes are levied on sales to visitors and the spending of employees attributable to travel industry earnings.
Nampa
Canyon County
$16
$16
$0
$3
0.2
$0
$2
$2
2017p2016
PAGE 75 DEAN RUNYAN ASSOCIATES

Legislative District 014
Travel Impacts
Spending (millions)
Visitor Spending
Other Spending
Earnings (millions)
Employment (thousands)
State & Local Tax Revenue (millions)
Local Tax Revenue
State Tax Revenue
$38
$34
$3
$10
0.4
$4
$1
$3
Employment Characteristics (2017)
Travel Percent of Total District Employment
Travel-generated employment
All Payroll & Self-employment
District Percent of Statewide Employment
1.7%
0.8%
2.2%
Travel-generated tax revenue (2017p)
$100 of Visitor Spending GeneratesTravel-Generated Tax Revenuesper District Household
Local & State Total
State tax revenue
Local tax revenue
Local & State Total
State tax revenue
Local tax revenue$1.90
$10.00
$12.00
$43
$221
$264
Visitor Spending includes spending on lodging, food services, recreation, shopping and local transportation. Other Spending includes resident air travel and ground travel to other Idaho destinations, travel arrangement & reservation services.. Earnings include wages and salaries, paid benefits and self-employment income. Employment includes all full- and part-time jobs for wage and salary employees and the self-employed. The employment and earnings estimates are for place of work rather than the residence of the worker. Local tax revenue includes lodging and sales taxes imposed by cities, counties and other regional tax jurisdictions in Idaho. These taxes are levied on sales to visitors and the spending of employees attributable to travel industry earnings. Passenger facility charges attributable to visitors (a fee imposed on airline tickets) are included in districts with airports. Property tax payments attributable to travel industry businesses and employees are also included. State tax revenue includes sales, motor fuel, and business and personal income taxes imposed by the state of Idaho. These taxes are levied on sales to visitors and the spending of employees attributable to travel industry earnings.
Eagle, Meridian, Star
Ada County
$34
$32
$3
$9
0.4
$1
$3
$4
2017p2016
DEAN RUNYAN ASSOCIATESPAGE 76

Legislative District 015
Travel Impacts
Spending (millions)
Visitor Spending
Other Spending
Earnings (millions)
Employment (thousands)
State & Local Tax Revenue (millions)
Local Tax Revenue
State Tax Revenue
$55
$45
$10
$14
0.5
$6
$1
$5
Employment Characteristics (2017)
Travel Percent of Total District Employment
Travel-generated employment
All Payroll & Self-employment
District Percent of Statewide Employment
3.4%
1.1%
1.4%
Travel-generated tax revenue (2017p)
$100 of Visitor Spending GeneratesTravel-Generated Tax Revenuesper District Household
Local & State Total
State tax revenue
Local tax revenue
Local & State Total
State tax revenue
Local tax revenue$2.10
$9.90
$11.90
$45
$213
$258
Visitor Spending includes spending on lodging, food services, recreation, shopping and local transportation. Other Spending includes resident air travel and ground travel to other Idaho destinations, travel arrangement & reservation services.. Earnings include wages and salaries, paid benefits and self-employment income. Employment includes all full- and part-time jobs for wage and salary employees and the self-employed. The employment and earnings estimates are for place of work rather than the residence of the worker. Local tax revenue includes lodging and sales taxes imposed by cities, counties and other regional tax jurisdictions in Idaho. These taxes are levied on sales to visitors and the spending of employees attributable to travel industry earnings. Passenger facility charges attributable to visitors (a fee imposed on airline tickets) are included in districts with airports. Property tax payments attributable to travel industry businesses and employees are also included. State tax revenue includes sales, motor fuel, and business and personal income taxes imposed by the state of Idaho. These taxes are levied on sales to visitors and the spending of employees attributable to travel industry earnings.
Boise
Ada County
$50
$42
$9
$12
0.5
$1
$4
$5
2017p2016
PAGE 77 DEAN RUNYAN ASSOCIATES

Legislative District 016
Travel Impacts
Spending (millions)
Visitor Spending
Other Spending
Earnings (millions)
Employment (thousands)
State & Local Tax Revenue (millions)
Local Tax Revenue
State Tax Revenue
$102
$92
$10
$28
1.1
$9
$1
$8
Employment Characteristics (2017)
Travel Percent of Total District Employment
Travel-generated employment
All Payroll & Self-employment
District Percent of Statewide Employment
3.9%
2.3%
2.7%
Travel-generated tax revenue (2017p)
$100 of Visitor Spending GeneratesTravel-Generated Tax Revenuesper District Household
Local & State Total
State tax revenue
Local tax revenue
Local & State Total
State tax revenue
Local tax revenue$1.00
$8.60
$9.50
$43
$383
$426
Visitor Spending includes spending on lodging, food services, recreation, shopping and local transportation. Other Spending includes resident air travel and ground travel to other Idaho destinations, travel arrangement & reservation services.. Earnings include wages and salaries, paid benefits and self-employment income. Employment includes all full- and part-time jobs for wage and salary employees and the self-employed. The employment and earnings estimates are for place of work rather than the residence of the worker. Local tax revenue includes lodging and sales taxes imposed by cities, counties and other regional tax jurisdictions in Idaho. These taxes are levied on sales to visitors and the spending of employees attributable to travel industry earnings. Passenger facility charges attributable to visitors (a fee imposed on airline tickets) are included in districts with airports. Property tax payments attributable to travel industry businesses and employees are also included. State tax revenue includes sales, motor fuel, and business and personal income taxes imposed by the state of Idaho. These taxes are levied on sales to visitors and the spending of employees attributable to travel industry earnings.
Boise, Garden City
Ada County
$94
$85
$8
$26
1.0
$1
$7
$8
2017p2016
DEAN RUNYAN ASSOCIATESPAGE 78

Legislative District 017
Travel Impacts
Spending (millions)
Visitor Spending
Other Spending
Earnings (millions)
Employment (thousands)
State & Local Tax Revenue (millions)
Local Tax Revenue
State Tax Revenue
$372
$230
$142
$67
1.8
$14
$3
$11
Employment Characteristics (2017)
Travel Percent of Total District Employment
Travel-generated employment
All Payroll & Self-employment
District Percent of Statewide Employment
4.0%
4.0%
4.6%
Travel-generated tax revenue (2017p)
$100 of Visitor Spending GeneratesTravel-Generated Tax Revenuesper District Household
Local & State Total
State tax revenue
Local tax revenue
Local & State Total
State tax revenue
Local tax revenue$1.40
$4.50
$5.90
$152
$490
$642
Visitor Spending includes spending on lodging, food services, recreation, shopping and local transportation. Other Spending includes resident air travel and ground travel to other Idaho destinations, travel arrangement & reservation services.. Earnings include wages and salaries, paid benefits and self-employment income. Employment includes all full- and part-time jobs for wage and salary employees and the self-employed. The employment and earnings estimates are for place of work rather than the residence of the worker. Local tax revenue includes lodging and sales taxes imposed by cities, counties and other regional tax jurisdictions in Idaho. These taxes are levied on sales to visitors and the spending of employees attributable to travel industry earnings. Passenger facility charges attributable to visitors (a fee imposed on airline tickets) are included in districts with airports. Property tax payments attributable to travel industry businesses and employees are also included. State tax revenue includes sales, motor fuel, and business and personal income taxes imposed by the state of Idaho. These taxes are levied on sales to visitors and the spending of employees attributable to travel industry earnings.
Boise
Ada County
$349
$214
$135
$60
1.7
$3
$10
$13
2017p2016
PAGE 79 DEAN RUNYAN ASSOCIATES

Legislative District 018
Travel Impacts
Spending (millions)
Visitor Spending
Other Spending
Earnings (millions)
Employment (thousands)
State & Local Tax Revenue (millions)
Local Tax Revenue
State Tax Revenue
$258
$224
$34
$66
2.4
$18
$1
$16
Employment Characteristics (2017)
Travel Percent of Total District Employment
Travel-generated employment
All Payroll & Self-employment
District Percent of Statewide Employment
3.2%
5.3%
7.5%
Travel-generated tax revenue (2017p)
$100 of Visitor Spending GeneratesTravel-Generated Tax Revenuesper District Household
Local & State Total
State tax revenue
Local tax revenue
Local & State Total
State tax revenue
Local tax revenue$0.60
$7.10
$7.80
$66
$720
$785
Visitor Spending includes spending on lodging, food services, recreation, shopping and local transportation. Other Spending includes resident air travel and ground travel to other Idaho destinations, travel arrangement & reservation services.. Earnings include wages and salaries, paid benefits and self-employment income. Employment includes all full- and part-time jobs for wage and salary employees and the self-employed. The employment and earnings estimates are for place of work rather than the residence of the worker. Local tax revenue includes lodging and sales taxes imposed by cities, counties and other regional tax jurisdictions in Idaho. These taxes are levied on sales to visitors and the spending of employees attributable to travel industry earnings. Passenger facility charges attributable to visitors (a fee imposed on airline tickets) are included in districts with airports. Property tax payments attributable to travel industry businesses and employees are also included. State tax revenue includes sales, motor fuel, and business and personal income taxes imposed by the state of Idaho. These taxes are levied on sales to visitors and the spending of employees attributable to travel industry earnings.
Boise
Ada County
$241
$210
$32
$61
2.3
$1
$15
$16
2017p2016
DEAN RUNYAN ASSOCIATESPAGE 80

Legislative District 019
Travel Impacts
Spending (millions)
Visitor Spending
Other Spending
Earnings (millions)
Employment (thousands)
State & Local Tax Revenue (millions)
Local Tax Revenue
State Tax Revenue
$205
$146
$60
$59
2.0
$13
$1
$12
Employment Characteristics (2017)
Travel Percent of Total District Employment
Travel-generated employment
All Payroll & Self-employment
District Percent of Statewide Employment
6.6%
4.3%
3.0%
Travel-generated tax revenue (2017p)
$100 of Visitor Spending GeneratesTravel-Generated Tax Revenuesper District Household
Local & State Total
State tax revenue
Local tax revenue
Local & State Total
State tax revenue
Local tax revenue$0.60
$8.10
$8.60
$43
$578
$621
Visitor Spending includes spending on lodging, food services, recreation, shopping and local transportation. Other Spending includes resident air travel and ground travel to other Idaho destinations, travel arrangement & reservation services.. Earnings include wages and salaries, paid benefits and self-employment income. Employment includes all full- and part-time jobs for wage and salary employees and the self-employed. The employment and earnings estimates are for place of work rather than the residence of the worker. Local tax revenue includes lodging and sales taxes imposed by cities, counties and other regional tax jurisdictions in Idaho. These taxes are levied on sales to visitors and the spending of employees attributable to travel industry earnings. Passenger facility charges attributable to visitors (a fee imposed on airline tickets) are included in districts with airports. Property tax payments attributable to travel industry businesses and employees are also included. State tax revenue includes sales, motor fuel, and business and personal income taxes imposed by the state of Idaho. These taxes are levied on sales to visitors and the spending of employees attributable to travel industry earnings.
Boise
Ada County
$185
$136
$49
$53
1.8
$1
$11
$12
2017p2016
PAGE 81 DEAN RUNYAN ASSOCIATES

Legislative District 020
Travel Impacts
Spending (millions)
Visitor Spending
Other Spending
Earnings (millions)
Employment (thousands)
State & Local Tax Revenue (millions)
Local Tax Revenue
State Tax Revenue
$53
$51
$2
$15
0.6
$4
$0
$4
Employment Characteristics (2017)
Travel Percent of Total District Employment
Travel-generated employment
All Payroll & Self-employment
District Percent of Statewide Employment
2.0%
1.3%
2.9%
Travel-generated tax revenue (2017p)
$100 of Visitor Spending GeneratesTravel-Generated Tax Revenuesper District Household
Local & State Total
State tax revenue
Local tax revenue
Local & State Total
State tax revenue
Local tax revenue$0.50
$7.90
$8.40
$45
$693
$738
Visitor Spending includes spending on lodging, food services, recreation, shopping and local transportation. Other Spending includes resident air travel and ground travel to other Idaho destinations, travel arrangement & reservation services.. Earnings include wages and salaries, paid benefits and self-employment income. Employment includes all full- and part-time jobs for wage and salary employees and the self-employed. The employment and earnings estimates are for place of work rather than the residence of the worker. Local tax revenue includes lodging and sales taxes imposed by cities, counties and other regional tax jurisdictions in Idaho. These taxes are levied on sales to visitors and the spending of employees attributable to travel industry earnings. Passenger facility charges attributable to visitors (a fee imposed on airline tickets) are included in districts with airports. Property tax payments attributable to travel industry businesses and employees are also included. State tax revenue includes sales, motor fuel, and business and personal income taxes imposed by the state of Idaho. These taxes are levied on sales to visitors and the spending of employees attributable to travel industry earnings.
Boise, Meridian
Ada County
$49
$47
$2
$14
0.6
$0
$4
$4
2017p2016
DEAN RUNYAN ASSOCIATESPAGE 82

Legislative District 021
Travel Impacts
Spending (millions)
Visitor Spending
Other Spending
Earnings (millions)
Employment (thousands)
State & Local Tax Revenue (millions)
Local Tax Revenue
State Tax Revenue
$117
$86
$31
$26
0.8
$8
$1
$7
Employment Characteristics (2017)
Travel Percent of Total District Employment
Travel-generated employment
All Payroll & Self-employment
District Percent of Statewide Employment
3.6%
1.8%
2.3%
Travel-generated tax revenue (2017p)
$100 of Visitor Spending GeneratesTravel-Generated Tax Revenuesper District Household
Local & State Total
State tax revenue
Local tax revenue
Local & State Total
State tax revenue
Local tax revenue$1.50
$7.30
$8.90
$60
$287
$347
Visitor Spending includes spending on lodging, food services, recreation, shopping and local transportation. Other Spending includes resident air travel and ground travel to other Idaho destinations, travel arrangement & reservation services.. Earnings include wages and salaries, paid benefits and self-employment income. Employment includes all full- and part-time jobs for wage and salary employees and the self-employed. The employment and earnings estimates are for place of work rather than the residence of the worker. Local tax revenue includes lodging and sales taxes imposed by cities, counties and other regional tax jurisdictions in Idaho. These taxes are levied on sales to visitors and the spending of employees attributable to travel industry earnings. Passenger facility charges attributable to visitors (a fee imposed on airline tickets) are included in districts with airports. Property tax payments attributable to travel industry businesses and employees are also included. State tax revenue includes sales, motor fuel, and business and personal income taxes imposed by the state of Idaho. These taxes are levied on sales to visitors and the spending of employees attributable to travel industry earnings.
Boise, Meridian
Ada County
$108
$80
$28
$23
0.8
$1
$6
$7
2017p2016
PAGE 83 DEAN RUNYAN ASSOCIATES

Legislative District 022
Travel Impacts
Spending (millions)
Visitor Spending
Other Spending
Earnings (millions)
Employment (thousands)
State & Local Tax Revenue (millions)
Local Tax Revenue
State Tax Revenue
$51
$48
$3
$13
0.5
$6
$1
$5
Employment Characteristics (2017)
Travel Percent of Total District Employment
Travel-generated employment
All Payroll & Self-employment
District Percent of Statewide Employment
3.2%
1.1%
1.6%
Travel-generated tax revenue (2017p)
$100 of Visitor Spending GeneratesTravel-Generated Tax Revenuesper District Household
Local & State Total
State tax revenue
Local tax revenue
Local & State Total
State tax revenue
Local tax revenue$2.00
$10.00
$12.00
$43
$216
$259
Visitor Spending includes spending on lodging, food services, recreation, shopping and local transportation. Other Spending includes resident air travel and ground travel to other Idaho destinations, travel arrangement & reservation services.. Earnings include wages and salaries, paid benefits and self-employment income. Employment includes all full- and part-time jobs for wage and salary employees and the self-employed. The employment and earnings estimates are for place of work rather than the residence of the worker. Local tax revenue includes lodging and sales taxes imposed by cities, counties and other regional tax jurisdictions in Idaho. These taxes are levied on sales to visitors and the spending of employees attributable to travel industry earnings. Passenger facility charges attributable to visitors (a fee imposed on airline tickets) are included in districts with airports. Property tax payments attributable to travel industry businesses and employees are also included. State tax revenue includes sales, motor fuel, and business and personal income taxes imposed by the state of Idaho. These taxes are levied on sales to visitors and the spending of employees attributable to travel industry earnings.
Kuna, Meridian
Ada County
$47
$44
$2
$12
0.5
$1
$4
$5
2017p2016
DEAN RUNYAN ASSOCIATESPAGE 84

Legislative District 023
Travel Impacts
Spending (millions)
Visitor Spending
Other Spending
Earnings (millions)
Employment (thousands)
State & Local Tax Revenue (millions)
Local Tax Revenue
State Tax Revenue
$36
$36
$0
$10
0.7
$3
$0
$3
Employment Characteristics (2017)
Travel Percent of Total District Employment
Travel-generated employment
All Payroll & Self-employment
District Percent of Statewide Employment
1.9%
1.5%
3.6%
Travel-generated tax revenue (2017p)
$100 of Visitor Spending GeneratesTravel-Generated Tax Revenuesper District Household
Local & State Total
State tax revenue
Local tax revenue
Local & State Total
State tax revenue
Local tax revenue$0.90
$8.60
$9.50
$20
$180
$200
Visitor Spending includes spending on lodging, food services, recreation, shopping and local transportation. Other Spending includes resident air travel and ground travel to other Idaho destinations, travel arrangement & reservation services.. Earnings include wages and salaries, paid benefits and self-employment income. Employment includes all full- and part-time jobs for wage and salary employees and the self-employed. The employment and earnings estimates are for place of work rather than the residence of the worker. Local tax revenue includes lodging and sales taxes imposed by cities, counties and other regional tax jurisdictions in Idaho. These taxes are levied on sales to visitors and the spending of employees attributable to travel industry earnings. Passenger facility charges attributable to visitors (a fee imposed on airline tickets) are included in districts with airports. Property tax payments attributable to travel industry businesses and employees are also included. State tax revenue includes sales, motor fuel, and business and personal income taxes imposed by the state of Idaho. These taxes are levied on sales to visitors and the spending of employees attributable to travel industry earnings.
Hammett
Elmore, Owyhee, and Twin Falls counties
$34
$34
$0
$9
0.7
$0
$3
$3
2017p2016
PAGE 85 DEAN RUNYAN ASSOCIATES
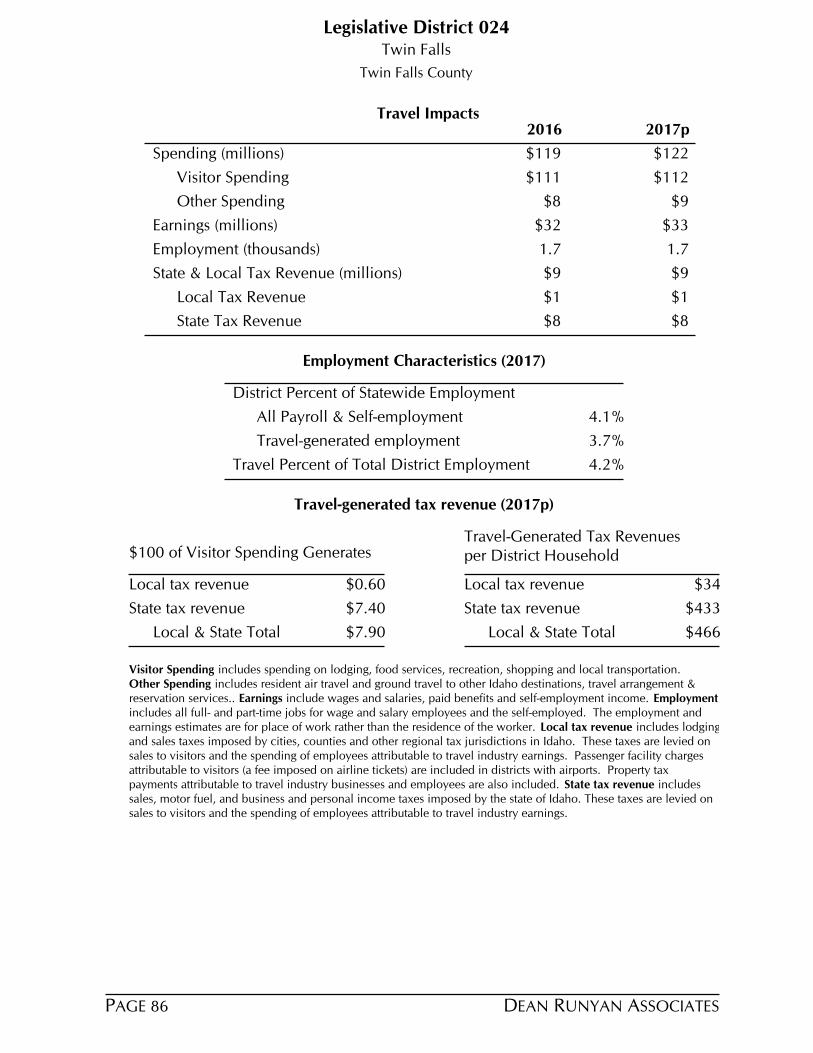
Legislative District 024
Travel Impacts
Spending (millions)
Visitor Spending
Other Spending
Earnings (millions)
Employment (thousands)
State & Local Tax Revenue (millions)
Local Tax Revenue
State Tax Revenue
$122
$112
$9
$33
1.7
$9
$1
$8
Employment Characteristics (2017)
Travel Percent of Total District Employment
Travel-generated employment
All Payroll & Self-employment
District Percent of Statewide Employment
4.1%
3.7%
4.2%
Travel-generated tax revenue (2017p)
$100 of Visitor Spending GeneratesTravel-Generated Tax Revenuesper District Household
Local & State Total
State tax revenue
Local tax revenue
Local & State Total
State tax revenue
Local tax revenue$0.60
$7.40
$7.90
$34
$433
$466
Visitor Spending includes spending on lodging, food services, recreation, shopping and local transportation. Other Spending includes resident air travel and ground travel to other Idaho destinations, travel arrangement & reservation services.. Earnings include wages and salaries, paid benefits and self-employment income. Employment includes all full- and part-time jobs for wage and salary employees and the self-employed. The employment and earnings estimates are for place of work rather than the residence of the worker. Local tax revenue includes lodging and sales taxes imposed by cities, counties and other regional tax jurisdictions in Idaho. These taxes are levied on sales to visitors and the spending of employees attributable to travel industry earnings. Passenger facility charges attributable to visitors (a fee imposed on airline tickets) are included in districts with airports. Property tax payments attributable to travel industry businesses and employees are also included. State tax revenue includes sales, motor fuel, and business and personal income taxes imposed by the state of Idaho. These taxes are levied on sales to visitors and the spending of employees attributable to travel industry earnings.
Twin Falls
Twin Falls County
$119
$111
$8
$32
1.7
$1
$8
$9
2017p2016
DEAN RUNYAN ASSOCIATESPAGE 86
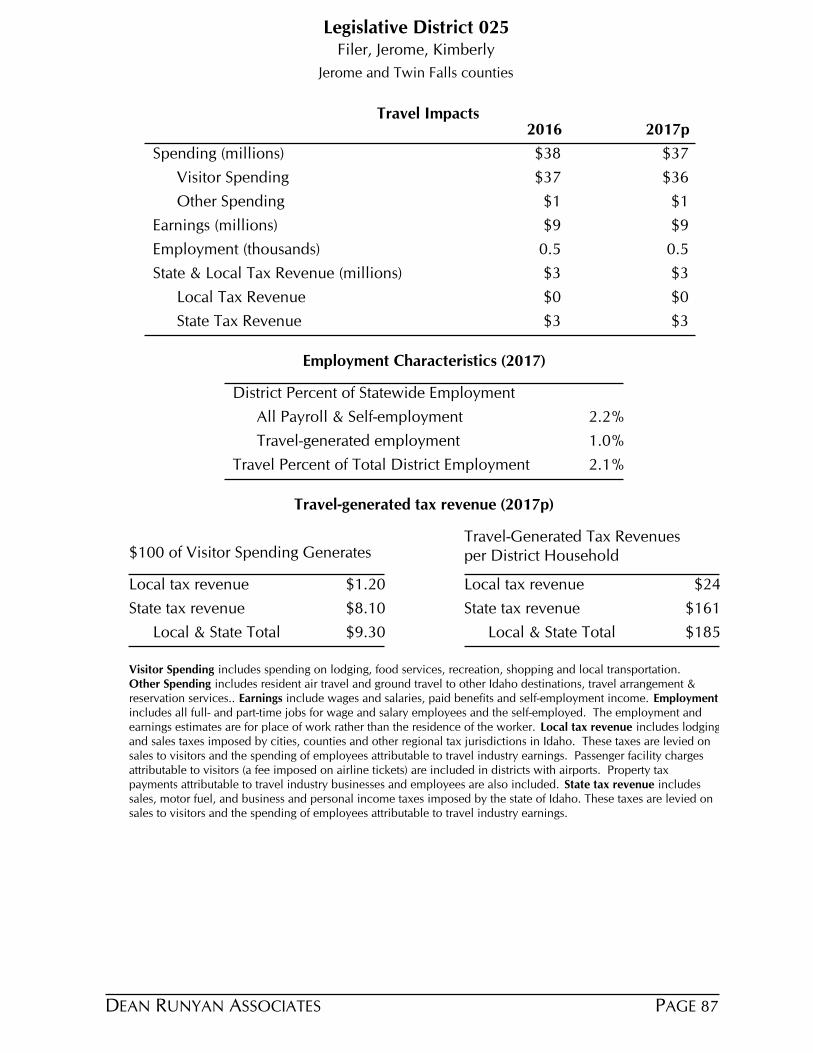
Legislative District 025
Travel Impacts
Spending (millions)
Visitor Spending
Other Spending
Earnings (millions)
Employment (thousands)
State & Local Tax Revenue (millions)
Local Tax Revenue
State Tax Revenue
$37
$36
$1
$9
0.5
$3
$0
$3
Employment Characteristics (2017)
Travel Percent of Total District Employment
Travel-generated employment
All Payroll & Self-employment
District Percent of Statewide Employment
2.2%
1.0%
2.1%
Travel-generated tax revenue (2017p)
$100 of Visitor Spending GeneratesTravel-Generated Tax Revenuesper District Household
Local & State Total
State tax revenue
Local tax revenue
Local & State Total
State tax revenue
Local tax revenue$1.20
$8.10
$9.30
$24
$161
$185
Visitor Spending includes spending on lodging, food services, recreation, shopping and local transportation. Other Spending includes resident air travel and ground travel to other Idaho destinations, travel arrangement & reservation services.. Earnings include wages and salaries, paid benefits and self-employment income. Employment includes all full- and part-time jobs for wage and salary employees and the self-employed. The employment and earnings estimates are for place of work rather than the residence of the worker. Local tax revenue includes lodging and sales taxes imposed by cities, counties and other regional tax jurisdictions in Idaho. These taxes are levied on sales to visitors and the spending of employees attributable to travel industry earnings. Passenger facility charges attributable to visitors (a fee imposed on airline tickets) are included in districts with airports. Property tax payments attributable to travel industry businesses and employees are also included. State tax revenue includes sales, motor fuel, and business and personal income taxes imposed by the state of Idaho. These taxes are levied on sales to visitors and the spending of employees attributable to travel industry earnings.
Filer, Jerome, Kimberly
Jerome and Twin Falls counties
$38
$37
$1
$9
0.5
$0
$3
$3
2017p2016
PAGE 87 DEAN RUNYAN ASSOCIATES

Legislative District 026
Travel Impacts
Spending (millions)
Visitor Spending
Other Spending
Earnings (millions)
Employment (thousands)
State & Local Tax Revenue (millions)
Local Tax Revenue
State Tax Revenue
$364
$357
$7
$169
6.4
$33
$6
$27
Employment Characteristics (2017)
Travel Percent of Total District Employment
Travel-generated employment
All Payroll & Self-employment
District Percent of Statewide Employment
3.4%
14.0%
18.8%
Travel-generated tax revenue (2017p)
$100 of Visitor Spending GeneratesTravel-Generated Tax Revenuesper District Household
Local & State Total
State tax revenue
Local tax revenue
Local & State Total
State tax revenue
Local tax revenue$1.60
$7.60
$9.20
$348
$1,600
$1,948
Visitor Spending includes spending on lodging, food services, recreation, shopping and local transportation. Other Spending includes resident air travel and ground travel to other Idaho destinations, travel arrangement & reservation services.. Earnings include wages and salaries, paid benefits and self-employment income. Employment includes all full- and part-time jobs for wage and salary employees and the self-employed. The employment and earnings estimates are for place of work rather than the residence of the worker. Local tax revenue includes lodging and sales taxes imposed by cities, counties and other regional tax jurisdictions in Idaho. These taxes are levied on sales to visitors and the spending of employees attributable to travel industry earnings. Passenger facility charges attributable to visitors (a fee imposed on airline tickets) are included in districts with airports. Property tax payments attributable to travel industry businesses and employees are also included. State tax revenue includes sales, motor fuel, and business and personal income taxes imposed by the state of Idaho. These taxes are levied on sales to visitors and the spending of employees attributable to travel industry earnings.
Ketchum, Gooding
Blaine, Camas, Gooding, and Lincoln counties
$332
$326
$6
$149
5.8
$5
$24
$30
2017p2016
DEAN RUNYAN ASSOCIATESPAGE 88

Legislative District 027
Travel Impacts
Spending (millions)
Visitor Spending
Other Spending
Earnings (millions)
Employment (thousands)
State & Local Tax Revenue (millions)
Local Tax Revenue
State Tax Revenue
$34
$33
$1
$10
0.5
$3
$0
$3
Employment Characteristics (2017)
Travel Percent of Total District Employment
Travel-generated employment
All Payroll & Self-employment
District Percent of Statewide Employment
2.6%
1.2%
2.0%
Travel-generated tax revenue (2017p)
$100 of Visitor Spending GeneratesTravel-Generated Tax Revenuesper District Household
Local & State Total
State tax revenue
Local tax revenue
Local & State Total
State tax revenue
Local tax revenue$0.80
$8.70
$9.50
$17
$187
$204
Visitor Spending includes spending on lodging, food services, recreation, shopping and local transportation. Other Spending includes resident air travel and ground travel to other Idaho destinations, travel arrangement & reservation services.. Earnings include wages and salaries, paid benefits and self-employment income. Employment includes all full- and part-time jobs for wage and salary employees and the self-employed. The employment and earnings estimates are for place of work rather than the residence of the worker. Local tax revenue includes lodging and sales taxes imposed by cities, counties and other regional tax jurisdictions in Idaho. These taxes are levied on sales to visitors and the spending of employees attributable to travel industry earnings. Passenger facility charges attributable to visitors (a fee imposed on airline tickets) are included in districts with airports. Property tax payments attributable to travel industry businesses and employees are also included. State tax revenue includes sales, motor fuel, and business and personal income taxes imposed by the state of Idaho. These taxes are levied on sales to visitors and the spending of employees attributable to travel industry earnings.
Burley
Cassia and Minidoka counties
$31
$31
$0
$9
0.5
$0
$3
$3
2017p2016
PAGE 89 DEAN RUNYAN ASSOCIATES

Legislative District 028
Travel Impacts
Spending (millions)
Visitor Spending
Other Spending
Earnings (millions)
Employment (thousands)
State & Local Tax Revenue (millions)
Local Tax Revenue
State Tax Revenue
$132
$129
$3
$37
1.9
$10
$1
$9
Employment Characteristics (2017)
Travel Percent of Total District Employment
Travel-generated employment
All Payroll & Self-employment
District Percent of Statewide Employment
2.5%
4.1%
7.4%
Travel-generated tax revenue (2017p)
$100 of Visitor Spending GeneratesTravel-Generated Tax Revenuesper District Household
Local & State Total
State tax revenue
Local tax revenue
Local & State Total
State tax revenue
Local tax revenue$0.60
$7.10
$7.70
$42
$527
$569
Visitor Spending includes spending on lodging, food services, recreation, shopping and local transportation. Other Spending includes resident air travel and ground travel to other Idaho destinations, travel arrangement & reservation services.. Earnings include wages and salaries, paid benefits and self-employment income. Employment includes all full- and part-time jobs for wage and salary employees and the self-employed. The employment and earnings estimates are for place of work rather than the residence of the worker. Local tax revenue includes lodging and sales taxes imposed by cities, counties and other regional tax jurisdictions in Idaho. These taxes are levied on sales to visitors and the spending of employees attributable to travel industry earnings. Passenger facility charges attributable to visitors (a fee imposed on airline tickets) are included in districts with airports. Property tax payments attributable to travel industry businesses and employees are also included. State tax revenue includes sales, motor fuel, and business and personal income taxes imposed by the state of Idaho. These taxes are levied on sales to visitors and the spending of employees attributable to travel industry earnings.
McCammon
Bannock and Power counties
$129
$126
$3
$36
1.9
$1
$9
$10
2017p2016
DEAN RUNYAN ASSOCIATESPAGE 90

Legislative District 029
Travel Impacts
Spending (millions)
Visitor Spending
Other Spending
Earnings (millions)
Employment (thousands)
State & Local Tax Revenue (millions)
Local Tax Revenue
State Tax Revenue
$51
$44
$7
$13
0.6
$5
$1
$4
Employment Characteristics (2017)
Travel Percent of Total District Employment
Travel-generated employment
All Payroll & Self-employment
District Percent of Statewide Employment
2.6%
1.3%
2.2%
Travel-generated tax revenue (2017p)
$100 of Visitor Spending GeneratesTravel-Generated Tax Revenuesper District Household
Local & State Total
State tax revenue
Local tax revenue
Local & State Total
State tax revenue
Local tax revenue$1.70
$8.80
$10.50
$46
$238
$284
Visitor Spending includes spending on lodging, food services, recreation, shopping and local transportation. Other Spending includes resident air travel and ground travel to other Idaho destinations, travel arrangement & reservation services.. Earnings include wages and salaries, paid benefits and self-employment income. Employment includes all full- and part-time jobs for wage and salary employees and the self-employed. The employment and earnings estimates are for place of work rather than the residence of the worker. Local tax revenue includes lodging and sales taxes imposed by cities, counties and other regional tax jurisdictions in Idaho. These taxes are levied on sales to visitors and the spending of employees attributable to travel industry earnings. Passenger facility charges attributable to visitors (a fee imposed on airline tickets) are included in districts with airports. Property tax payments attributable to travel industry businesses and employees are also included. State tax revenue includes sales, motor fuel, and business and personal income taxes imposed by the state of Idaho. These taxes are levied on sales to visitors and the spending of employees attributable to travel industry earnings.
Pocatello
Bannock County
$47
$42
$6
$12
0.6
$1
$4
$4
2017p2016
PAGE 91 DEAN RUNYAN ASSOCIATES
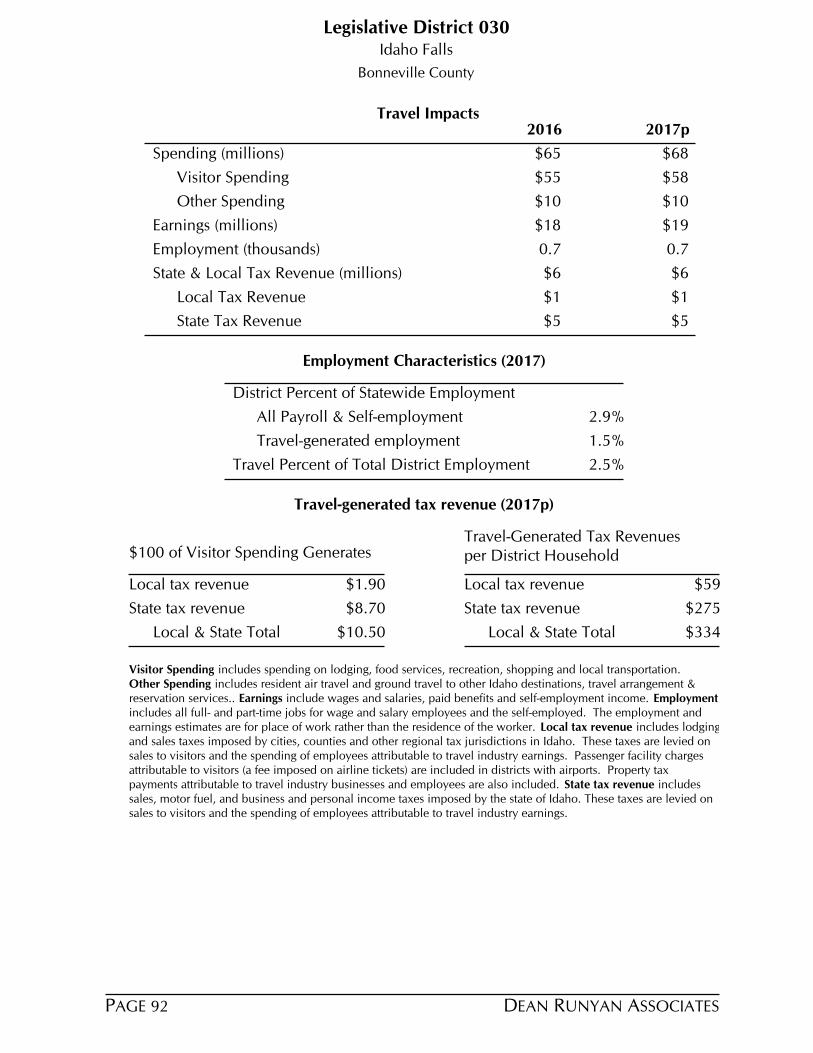
Legislative District 030
Travel Impacts
Spending (millions)
Visitor Spending
Other Spending
Earnings (millions)
Employment (thousands)
State & Local Tax Revenue (millions)
Local Tax Revenue
State Tax Revenue
$68
$58
$10
$19
0.7
$6
$1
$5
Employment Characteristics (2017)
Travel Percent of Total District Employment
Travel-generated employment
All Payroll & Self-employment
District Percent of Statewide Employment
2.9%
1.5%
2.5%
Travel-generated tax revenue (2017p)
$100 of Visitor Spending GeneratesTravel-Generated Tax Revenuesper District Household
Local & State Total
State tax revenue
Local tax revenue
Local & State Total
State tax revenue
Local tax revenue$1.90
$8.70
$10.50
$59
$275
$334
Visitor Spending includes spending on lodging, food services, recreation, shopping and local transportation. Other Spending includes resident air travel and ground travel to other Idaho destinations, travel arrangement & reservation services.. Earnings include wages and salaries, paid benefits and self-employment income. Employment includes all full- and part-time jobs for wage and salary employees and the self-employed. The employment and earnings estimates are for place of work rather than the residence of the worker. Local tax revenue includes lodging and sales taxes imposed by cities, counties and other regional tax jurisdictions in Idaho. These taxes are levied on sales to visitors and the spending of employees attributable to travel industry earnings. Passenger facility charges attributable to visitors (a fee imposed on airline tickets) are included in districts with airports. Property tax payments attributable to travel industry businesses and employees are also included. State tax revenue includes sales, motor fuel, and business and personal income taxes imposed by the state of Idaho. These taxes are levied on sales to visitors and the spending of employees attributable to travel industry earnings.
Idaho Falls
Bonneville County
$65
$55
$10
$18
0.7
$1
$5
$6
2017p2016
DEAN RUNYAN ASSOCIATESPAGE 92

Legislative District 031
Travel Impacts
Spending (millions)
Visitor Spending
Other Spending
Earnings (millions)
Employment (thousands)
State & Local Tax Revenue (millions)
Local Tax Revenue
State Tax Revenue
$37
$37
$0
$9
0.6
$3
$0
$3
Employment Characteristics (2017)
Travel Percent of Total District Employment
Travel-generated employment
All Payroll & Self-employment
District Percent of Statewide Employment
2.3%
1.3%
2.6%
Travel-generated tax revenue (2017p)
$100 of Visitor Spending GeneratesTravel-Generated Tax Revenuesper District Household
Local & State Total
State tax revenue
Local tax revenue
Local & State Total
State tax revenue
Local tax revenue$0.50
$8.20
$8.70
$12
$192
$204
Visitor Spending includes spending on lodging, food services, recreation, shopping and local transportation. Other Spending includes resident air travel and ground travel to other Idaho destinations, travel arrangement & reservation services.. Earnings include wages and salaries, paid benefits and self-employment income. Employment includes all full- and part-time jobs for wage and salary employees and the self-employed. The employment and earnings estimates are for place of work rather than the residence of the worker. Local tax revenue includes lodging and sales taxes imposed by cities, counties and other regional tax jurisdictions in Idaho. These taxes are levied on sales to visitors and the spending of employees attributable to travel industry earnings. Passenger facility charges attributable to visitors (a fee imposed on airline tickets) are included in districts with airports. Property tax payments attributable to travel industry businesses and employees are also included. State tax revenue includes sales, motor fuel, and business and personal income taxes imposed by the state of Idaho. These taxes are levied on sales to visitors and the spending of employees attributable to travel industry earnings.
Blackfoot, Shelley
Bingham County
$35
$35
$0
$9
0.6
$0
$3
$3
2017p2016
PAGE 93 DEAN RUNYAN ASSOCIATES

Legislative District 032
Travel Impacts
Spending (millions)
Visitor Spending
Other Spending
Earnings (millions)
Employment (thousands)
State & Local Tax Revenue (millions)
Local Tax Revenue
State Tax Revenue
$72
$71
$1
$21
1.1
$6
$1
$6
Employment Characteristics (2017)
Travel Percent of Total District Employment
Travel-generated employment
All Payroll & Self-employment
District Percent of Statewide Employment
2.5%
2.5%
4.4%
Travel-generated tax revenue (2017p)
$100 of Visitor Spending GeneratesTravel-Generated Tax Revenuesper District Household
Local & State Total
State tax revenue
Local tax revenue
Local & State Total
State tax revenue
Local tax revenue$0.80
$7.90
$8.70
$36
$339
$375
Visitor Spending includes spending on lodging, food services, recreation, shopping and local transportation. Other Spending includes resident air travel and ground travel to other Idaho destinations, travel arrangement & reservation services.. Earnings include wages and salaries, paid benefits and self-employment income. Employment includes all full- and part-time jobs for wage and salary employees and the self-employed. The employment and earnings estimates are for place of work rather than the residence of the worker. Local tax revenue includes lodging and sales taxes imposed by cities, counties and other regional tax jurisdictions in Idaho. These taxes are levied on sales to visitors and the spending of employees attributable to travel industry earnings. Passenger facility charges attributable to visitors (a fee imposed on airline tickets) are included in districts with airports. Property tax payments attributable to travel industry businesses and employees are also included. State tax revenue includes sales, motor fuel, and business and personal income taxes imposed by the state of Idaho. These taxes are levied on sales to visitors and the spending of employees attributable to travel industry earnings.
Soda Springs
Bear Lake, Bonneville , Caribou, Franklin, Oneida, and Teton Counties
$70
$69
$1
$20
1.1
$1
$5
$6
2017p2016
DEAN RUNYAN ASSOCIATESPAGE 94

Legislative District 033
Travel Impacts
Spending (millions)
Visitor Spending
Other Spending
Earnings (millions)
Employment (thousands)
State & Local Tax Revenue (millions)
Local Tax Revenue
State Tax Revenue
$184
$174
$10
$60
2.7
$15
$1
$14
Employment Characteristics (2017)
Travel Percent of Total District Employment
Travel-generated employment
All Payroll & Self-employment
District Percent of Statewide Employment
3.6%
5.8%
7.4%
Travel-generated tax revenue (2017p)
$100 of Visitor Spending GeneratesTravel-Generated Tax Revenuesper District Household
Local & State Total
State tax revenue
Local tax revenue
Local & State Total
State tax revenue
Local tax revenue$0.60
$7.70
$8.30
$59
$777
$836
Visitor Spending includes spending on lodging, food services, recreation, shopping and local transportation. Other Spending includes resident air travel and ground travel to other Idaho destinations, travel arrangement & reservation services.. Earnings include wages and salaries, paid benefits and self-employment income. Employment includes all full- and part-time jobs for wage and salary employees and the self-employed. The employment and earnings estimates are for place of work rather than the residence of the worker. Local tax revenue includes lodging and sales taxes imposed by cities, counties and other regional tax jurisdictions in Idaho. These taxes are levied on sales to visitors and the spending of employees attributable to travel industry earnings. Passenger facility charges attributable to visitors (a fee imposed on airline tickets) are included in districts with airports. Property tax payments attributable to travel industry businesses and employees are also included. State tax revenue includes sales, motor fuel, and business and personal income taxes imposed by the state of Idaho. These taxes are levied on sales to visitors and the spending of employees attributable to travel industry earnings.
Idaho Falls
Bannock County
$171
$161
$10
$55
2.5
$1
$12
$13
2017p2016
PAGE 95 DEAN RUNYAN ASSOCIATES

Legislative District 034
Travel Impacts
Spending (millions)
Visitor Spending
Other Spending
Earnings (millions)
Employment (thousands)
State & Local Tax Revenue (millions)
Local Tax Revenue
State Tax Revenue
$31
$28
$3
$9
0.5
$3
$0
$2
Employment Characteristics (2017)
Travel Percent of Total District Employment
Travel-generated employment
All Payroll & Self-employment
District Percent of Statewide Employment
2.5%
1.1%
1.9%
Travel-generated tax revenue (2017p)
$100 of Visitor Spending GeneratesTravel-Generated Tax Revenuesper District Household
Local & State Total
State tax revenue
Local tax revenue
Local & State Total
State tax revenue
Local tax revenue$1.20
$8.20
$9.40
$25
$167
$192
Visitor Spending includes spending on lodging, food services, recreation, shopping and local transportation. Other Spending includes resident air travel and ground travel to other Idaho destinations, travel arrangement & reservation services.. Earnings include wages and salaries, paid benefits and self-employment income. Employment includes all full- and part-time jobs for wage and salary employees and the self-employed. The employment and earnings estimates are for place of work rather than the residence of the worker. Local tax revenue includes lodging and sales taxes imposed by cities, counties and other regional tax jurisdictions in Idaho. These taxes are levied on sales to visitors and the spending of employees attributable to travel industry earnings. Passenger facility charges attributable to visitors (a fee imposed on airline tickets) are included in districts with airports. Property tax payments attributable to travel industry businesses and employees are also included. State tax revenue includes sales, motor fuel, and business and personal income taxes imposed by the state of Idaho. These taxes are levied on sales to visitors and the spending of employees attributable to travel industry earnings.
Rexburg
Bonneville and Madison County
$28
$26
$3
$8
0.5
$0
$2
$2
2017p2016
DEAN RUNYAN ASSOCIATESPAGE 96

Legislative District 035
Travel Impacts
Spending (millions)
Visitor Spending
Other Spending
Earnings (millions)
Employment (thousands)
State & Local Tax Revenue (millions)
Local Tax Revenue
State Tax Revenue
$62
$62
$0
$15
0.9
$5
$0
$5
Employment Characteristics (2017)
Travel Percent of Total District Employment
Travel-generated employment
All Payroll & Self-employment
District Percent of Statewide Employment
2.8%
1.9%
3.1%
Travel-generated tax revenue (2017p)
$100 of Visitor Spending GeneratesTravel-Generated Tax Revenuesper District Household
Local & State Total
State tax revenue
Local tax revenue
Local & State Total
State tax revenue
Local tax revenue$0.60
$7.60
$8.10
$24
$324
$348
Visitor Spending includes spending on lodging, food services, recreation, shopping and local transportation. Other Spending includes resident air travel and ground travel to other Idaho destinations, travel arrangement & reservation services.. Earnings include wages and salaries, paid benefits and self-employment income. Employment includes all full- and part-time jobs for wage and salary employees and the self-employed. The employment and earnings estimates are for place of work rather than the residence of the worker. Local tax revenue includes lodging and sales taxes imposed by cities, counties and other regional tax jurisdictions in Idaho. These taxes are levied on sales to visitors and the spending of employees attributable to travel industry earnings. Passenger facility charges attributable to visitors (a fee imposed on airline tickets) are included in districts with airports. Property tax payments attributable to travel industry businesses and employees are also included. State tax revenue includes sales, motor fuel, and business and personal income taxes imposed by the state of Idaho. These taxes are levied on sales to visitors and the spending of employees attributable to travel industry earnings.
Terreton
Butte, Clark, Fremont, and Jefferson counties
$59
$59
$0
$14
0.8
$0
$4
$5
2017p2016
PAGE 97 DEAN RUNYAN ASSOCIATES

VI. LODGING SALES2017
DEAN RUNYAN ASSOCIATESPAGE 98

Seasonal and Regional Travel Impacts
Lodging sales are used in this section to document seasonal patterns in the Idaho tourism industry. (Lodging sales are used because travel spending and related impacts are estimated only on a calendar year basis.) The pie chart shows the annual distribution of lodging sales by region. The southwestern region includes the Boise Metropolitan area, the largest in the state.
Central 9.5%
Eastern 14.4%
North Central 5.4%
Northern 18.6%
South Central 7.4%
Southeastern 6.1%
Southwestern 38.6%
Total: 100.0%
Regional Shares of Taxable Lodging Sales
Hotel/Motel, 2017
0% 10% 20% 30% 40% 50% 60% 70% 80% 90% 100%
Central
Eastern
North Central
Northern
South Central
Southeastern
Southwestern
Jan-Mar Apr-Jun Jul-Sep Oct-Dec
Taxable Lodging Sales by Region & Quarter
Hotel/Motel, 2017
The next two graphs provide quarterly breakouts for the regions and the state. Lodging sales are greatest in the third quarter for six of the seven Idaho regions. For North Central the third and fourth quarter are equally important.
0M
40M
80M
120M
160M
200M
240M
Jan-Mar Apr-Jun Jul-Sep Oct-Dec
2010 2011 2012 2013 2014 2015 2016 2017
Tax
able
Sal
es (
$)
Taxable Lodging Sales by Quater
Idaho, Hotel/Motel, 2017
The bottom chart provides a statewide quarterly breakout of lodging sales in 2010. The third quarter continues to show strong growth, and as discussed above is the most important to the entire state.The last two years show higher than normal growth in the second quarter.
Sources: Idaho Tax Commission
PAGE 99 DEAN RUNYAN ASSOCIATES
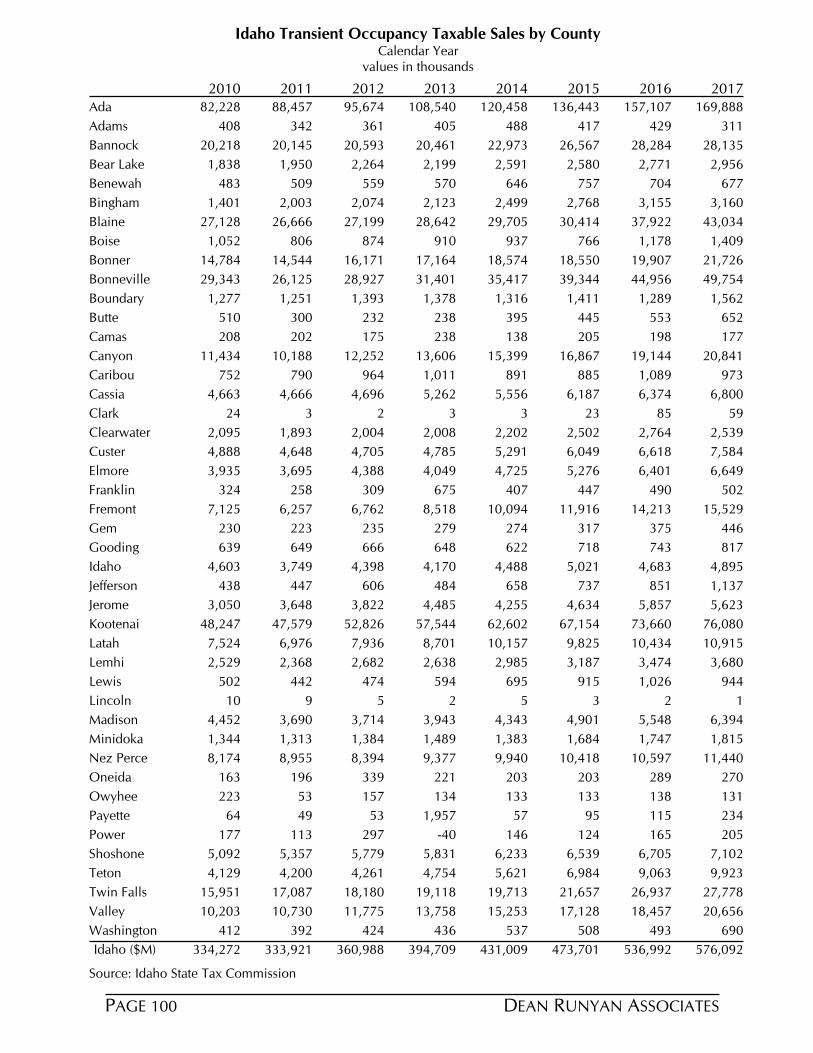
Idaho Transient Occupancy Taxable Sales by CountyCalendar Year
values in thousands
201520142013201220112010 2016 2017Ada 82,228 88,457 95,674 108,540 136,443 120,458 157,107 169,888
Adams 408 342 361 405 417 488 429 311
Bannock 20,218 20,145 20,593 20,461 26,567 22,973 28,284 28,135
Bear Lake 1,838 1,950 2,264 2,199 2,580 2,591 2,771 2,956
Benewah 483 509 559 570 757 646 704 677
Bingham 1,401 2,003 2,074 2,123 2,768 2,499 3,155 3,160
Blaine 27,128 26,666 27,199 28,642 30,414 29,705 37,922 43,034
Boise 1,052 806 874 910 766 937 1,178 1,409
Bonner 14,784 14,544 16,171 17,164 18,550 18,574 19,907 21,726
Bonneville 29,343 26,125 28,927 31,401 39,344 35,417 44,956 49,754
Boundary 1,277 1,251 1,393 1,378 1,411 1,316 1,289 1,562
Butte 510 300 232 238 445 395 553 652
Camas 208 202 175 238 205 138 198 177
Canyon 11,434 10,188 12,252 13,606 16,867 15,399 19,144 20,841
Caribou 752 790 964 1,011 885 891 1,089 973
Cassia 4,663 4,666 4,696 5,262 6,187 5,556 6,374 6,800
Clark 24 3 2 3 23 3 85 59
Clearwater 2,095 1,893 2,004 2,008 2,502 2,202 2,764 2,539
Custer 4,888 4,648 4,705 4,785 6,049 5,291 6,618 7,584
Elmore 3,935 3,695 4,388 4,049 5,276 4,725 6,401 6,649
Franklin 324 258 309 675 447 407 490 502
Fremont 7,125 6,257 6,762 8,518 11,916 10,094 14,213 15,529
Gem 230 223 235 279 317 274 375 446
Gooding 639 649 666 648 718 622 743 817
Idaho 4,603 3,749 4,398 4,170 5,021 4,488 4,683 4,895
Jefferson 438 447 606 484 737 658 851 1,137
Jerome 3,050 3,648 3,822 4,485 4,634 4,255 5,857 5,623
Kootenai 48,247 47,579 52,826 57,544 67,154 62,602 73,660 76,080
Latah 7,524 6,976 7,936 8,701 9,825 10,157 10,434 10,915
Lemhi 2,529 2,368 2,682 2,638 3,187 2,985 3,474 3,680
Lewis 502 442 474 594 915 695 1,026 944
Lincoln 10 9 5 2 3 5 2 1
Madison 4,452 3,690 3,714 3,943 4,901 4,343 5,548 6,394
Minidoka 1,344 1,313 1,384 1,489 1,684 1,383 1,747 1,815
Nez Perce 8,174 8,955 8,394 9,377 10,418 9,940 10,597 11,440
Oneida 163 196 339 221 203 203 289 270
Owyhee 223 53 157 134 133 133 138 131
Payette 64 49 53 1,957 95 57 115 234
Power 177 113 297 -40 124 146 165 205
Shoshone 5,092 5,357 5,779 5,831 6,539 6,233 6,705 7,102
Teton 4,129 4,200 4,261 4,754 6,984 5,621 9,063 9,923
Twin Falls 15,951 17,087 18,180 19,118 21,657 19,713 26,937 27,778
Valley 10,203 10,730 11,775 13,758 17,128 15,253 18,457 20,656
Washington 412 392 424 436 508 537 493 690
Source: Idaho State Tax Commission
Idaho ($M) 334,272 333,921 360,988 394,709 431,009 473,701 536,992 576,092
DEAN RUNYAN ASSOCIATESPAGE 100

APPENDICES
Appendix A 2017 Travel Impact Estimates
Appendix B Key Terms and Definitions
Appendix C Regional Travel Impact Model
Appendix D Travel Industry Accounts
Appendix E Idaho Earnings and Employment by Industry Sector
Appendix F Industry Groups
PAGE 101 DEAN RUNYAN ASSOCIATES

APPENDIX A
2017 TRAVEL IMPACT ESTIMATES
This appendix provides a brief overview of the methodology, terminology and limitations of the travel impact and visitor volume estimates.
DIRECT IMPACTS
The estimates of the direct impacts associated with traveler spending in Idaho were produced using the Regional Travel Impact Model (RTIM) developed by Dean Runyan Associates. The input data used to detail the economic impacts of the Idaho travel industry were gathered from various local, state and federal sources.
Travel impacts consist of estimates of travel spending and the employment, earnings, and state and local taxes generated by this spending. These estimates are also broken out by type of traveler accommodation and by the type of business in which the expenditures occur.
PRELIMINARY ESTIMATES
Preliminary estimates for 2017 were prepared at the state, regional and county level. These estimates take advantage of the most current available data. However, because full-year data was not available in all cases, these estimates are subject to subsequent revision as additional information relating to travel and its economic impact in 2017 becomes available.
TRANSPORTATION IMPACTS
The treatment of ground transportation expenditures depends upon the level of geography (county, region or state). County and regional level estimates of destination spending include only a portion of ground transportation expenditures because some county and regional transportation expenditures are for travel to other Idaho destinations. These expenditures are allocated to “other travel.” State level estimates include all in-state expenditures for ground transportation.
SECONDARY (INDIRECT AND INDUCED) IMPACTS
Direct impacts are reported for all counties within Idaho. Secondary employment and earnings impacts over and above direct impacts are reported at the state level only for the year 2017. These indirect and induced impacts are generated from the direct impacts produced by the RTIM, discussed above, and an input-output model of the Idaho economy prepared by the IMPLAN Group, Inc. Indirect impacts represent the purchases of goods and services from other firms by businesses that directly receive expenditures from travelers. Hotels, for example, purchase maintenance services from independent contractors. Induced impacts represent the purchase of goods and services by employees whose earnings are in part derived from travel expenditures. The sum of the direct,
DEAN RUNYAN ASSOCIATESPAGE 102

indirect and induced impacts equals the total impact of all spending by visitors in the state. The "multiplier" refers to the ratio of the total impacts to the direct impacts for employment or earnings.
GROSS DOMESTIC PRODUCTAn estimate of the Gross Domestic Product (GDP) of the Idaho travel industry based on the RTIM direct travel impacts is also provided in this report. The GDP of an industry is equal to gross output (sales or receipts) minus intermediate inputs (the goods and services purchased from other industries). GDP is always less than output or sales because GDP measures only the "value" added of an industry and does not include the cost of the inputs that are also necessary to produce a good or service. GDP is a useful conceptbecause it permits comparisons of the economic contributions of different industries.The relationship between spending and gross domestic product is illustrated inthe figure below. Examples of inputs are the food or accounting services that restaurants purchase from suppliers. "Goods resold" are the commodities that retail establishments purchase from manufacturers or wholesale trade businesses and resell with a markup. These inputs or goods are not counted as the GDP of the restaurant or retail industry because their value was created in other industries (agriculture, accounting, manufacturing).
Relationship Between Spending and Gross Domestic Product
Inputs/Goods Resold
OperatingSurplus
Indirect Taxes
Labor Incom e
Spending GDP
It is for this reason that “travel spending” - as measured from surveys of visitors- is not the best measure of the travel industry’s real economic contribution. This is because some visitor spending is actually counted as the GDP of other industries (e.g., agriculture, accounting, manufacturing). Furthermore, these other industries may or may not be located within the geographic area of interest. If the farm were located within the region of interest, then the GDP of the local farm
PAGE 103 DEAN RUNYAN ASSOCIATES

would be included as an indirect or secondary effect. If no (e.g., a manufacturing firm in
another state or country), then that portion of GDP is not counted. The preceding graph
also shows the three main components of GDP. For most industries, labor income
(essentially equivalent to earnings in this report) is the primary component of GDP. This is
true of the travel industry. A second component is the tax payments that businesses make
to government, such as sales, excise and property taxes. In the case of excise taxes,
businesses are essentially a collection agency for the government. The final component,
operating surplus, represents the income and payments (e.g., dividends, interest) to other
stakeholders of the firm. The concept of GDP also illustrates that with small geographic
units of analysis (e.g., counties), earnings, employment, and tax revenues are the best
measures of the economic value of the travel industry to the local economy. Small area
measures of GDP are less reliable and much of the operating surplus may leak out of the
local economy anyway. Indirect effects are also generally less in smaller economies.
INTERPRETATION OF IMPACT ESTIMATESUsers of this report should be aware of several issues regarding the interpretation of the impact estimates contained herein:
· The estimates contained in this report are based on the most current data available and supersede all previous estimates of travel impacts.
· The estimates in this report are expressed in current dollars unless otherwise noted.
· The employment estimates in this report are estimates of the total number of full and part-time jobs directly generated by travel spending, rather than the number of individuals employed. Both payroll and self-employment are included in these estimates. Caution should therefore be used in comparing these estimates with other employment data series.
· In general, estimates of small geographic areas (e.g., rural counties) are less reliable than estimates for regions or metropolitan counties. Trend analysis and comparisons of counties with relatively low levels of travel related economic activity should therefore be interpreted cautiously.
· The estimates of travel impacts published in this report will necessarily differ somewhat from estimates generated from different models, methodologies and data sources. Nonetheless, it should be emphasized that all credible estimates of direct travel impacts at the state level, including those of Dean Runyan Associates, are of similar magnitude.
DEAN RUNYAN ASSOCIATESPAGE 104

APPENDIX B
DEFINITION OF TERMS
Commodity: A classification of a product or service, such as lodging or food service. An establishment or industry may produce more than one commodity.
Direct Impacts: Employment, earnings and tax receipts directly generated by travel spending, as distinguished from secondary and total impacts.
Earnings: Earnings include wage and salary disbursements, other earned income or benefits, and proprietor income. Only the earnings attributable to travel expenditures are included.
Employment: Industry employment (jobs) associated with travel-generated earnings. Includes both full-time and part-time positions, and salaried or self-employed individuals. Employment is reported as an average for a time period, typically annual. (Unless otherwise noted, the employment estimates refer to establishment or industry employment at place of work, not the employment status or residence of the individual.)
Federal Taxes: Federal taxes include the motor fuel excise tax, airline ticket taxes, and personal income and payroll taxes.
Industry: A classification of business or government establishments based on their primary technological process. (See NAICS Appendix table.)
Local Taxes: Lodging taxes imposed by cities, counties and other regional tax jurisdictions in Idaho. These taxes are levied on sales to visitors and the spending of employees attributable to travel industry earnings. Passenger Facility Charges attributable to visitors (a fee imposed on airline tickets) are included in counties with airports. Property tax payments attributable to travel industry businesses and employees are also included.
Other spending: Other spending includes spending by residents on ground and air transportation for travel to other destinations, spending on travel arrangement services, and convention/ trade shows.
Private Home: Unpaid overnight accommodations of friends and relatives.
Receipts: Travel expenditures less the sales and excise taxes paid by the consumer.
State Taxes: Lodging taxes, motor fuel, and business and personal income taxes imposed by the state of Idaho. These taxes are levied on sales to visitors and the spending of employees attributable to travel industry earnings.
STVR: Acronym for Short Term Vacation Rentals. STVR includes lodging using "shared economy" services.
Total Impacts: The sum of Direct and Secondary impacts.
Travel spending: The sum of visitor and other spending related to travel.
Visitor spending: All spending on goods & services by visitors at the destination. Also referred to as destination spending.
PAGE 105 DEAN RUNYAN ASSOCIATES

APPENDIX C
Note: Most estimates of taxes are based on implicit tax rates applied to visitor spending, business receipts, and employee earnings. Lodging tax receipts reflect actual tax collections.
DEAN RUNYAN ASSOCIATESPAGE 106

APPENDIX D
TRAVEL INDUSTRY ACCOUNTS: A COMPARISON OF THE
REGIONAL TRAVEL IMPACT MODEL AND
TRAVEL & TOURISM SATELLITE ACCOUNTS
An economic account is a method for displaying inter-related information about a set of economic activities. A travel industry account is a method to report different types of related information about the purchase of goods and services by visitors. The Bureau of Economic Analysis (BEA), which now provides annual and quarterly estimates of travel and tourism at the national level, describes a Travel and Tourism Satellite Account (TTSA) as “present(ing) a rearrangement of information from the National Income and Product Accounts, from the industry accounts, and from other sources so that travel and tourism activities can be analyzed more completely than is possible in the structure of the traditional national economic accounts.”[1] Similarly, the RTIM has been developed by Dean Runyan Associates to estimate travel spending, earnings, employment, and tax receipts at the state, county, and regional levels. These initial findings can, in turn, be used as input data for deriving estimates of other economic measures, such as value-added and indirect effects.
This appendix provides an overview of the Regional Travel Impact Model (RTIM) and travel and tourism satellite accounts (TTSAs). Although there is no single or absolute form of a TTSA, the one developed by the Bureau of Economic Analysis (BEA) will be the basis of the analysis here. The definitions, framework, and estimating methods used for the U.S. BEA TTSA follow, as closely as is practicable, the guidelines for similar travel satellite accounts that were developed by the World Tourism Organization (WTO) and the Organization for Economic Co-operation and Development (OECD).
The primary focus is on the direct impacts of visitor spending. Visitors are defined as persons that stay overnight away from home, or travel more than fifty miles one- way on a non-routine trip. Only the expenditures related to specific trips are counted as visitor spending. Other travel related expenditures such as the consumption of durable goods (e.g., recreational vehicles or sporting equipment) or the purchase of vacation homes are not considered.
While such a definition of the travel industry (i.e., the trip related expenditures of visitors) is conservative, it is also in keeping with the notion of the travel industry as being an export-oriented industry for specific local communities. That is, visitors are important to regions because they inject money into the local economy. This focus on the export-oriented nature of the travel industry for local communities becomes blurred if the industry is defined so as to include non-trip related expenditures.
[1] Peter D. Kuhbach, Mark A. Planting, and Erich H. Strassner, “U.S. Travel and Tourism Satellite Accounts for 1998-2003,” Survey of Current Business 84 (September 2004): 43-59.
PAGE 107 DEAN RUNYAN ASSOCIATES

PRIMARY CONCEPTS, CATEGORIES & DATA REQUIREMENTS
There are three primary types of information that are measured and/or estimated in a travel industry account. The first is a measure of the travel industry in terms of both the characteristics of the business firms that sell travel goods and services and the characteristics of consumers that purchase travel industry goods and services. The second is a measure of the demand segments that consume travel industry goods and services. For example, the distinction between business and leisure travel is a measure of demand segments. The third is a measure of the components of economic output associated with the travel industry. The employee earnings generated by visitor spending is one such component. Travel-generated tax receipts are another. These three categories of information represent different aspects of the accounting ledger - they represent different ways of viewing or analyzing the travel industry.
The bulk of this paper will discuss these three types of information in terms of their conceptual foundations, the data requirements, and some of the more salient issues that users of this information should be aware of. There will also be some discussion of indirect and induced effects in that these effects can be reasonably estimated from the direct travel industry accounts. These secondary (versus direct) effects describe the relationship of the travel industry to other sectors of the larger economy.
The intent of this discussion will be to provide a general overview of the process of constructing travel industry accounts and the underlying similarity between the RTIM and a TTSA. More technical issues are generally placed in footnotes.
TRAVEL INDUSTRY
Defining the travel industry is probably the most critical and data intensive effort involved in developing a travel industry account. It is an exercise in matching supply (sellers of goods and services) with demand (the travelers that purchase those particular goods and services). It is complicated by the fact that no single industrial classification scheme provides a valid measure of the travel industry.[2] There are only three significant industrial classifications (Accommodations [NAICS 721], Scheduled Passenger Air Transportation [NAICS 481111] and Travel Arrangement and Reservation Services [NAICS 5615]) that primarily sell travel industry goods and services.[3] Firms in other industries (retail, recreation, transportation) provide goods and services to both travelers and other types of consumers.
Because of this, most satellite accounts, as well as the RTIM, incorporate at least some information about the expenditures of visitors in order to define the supply of visitor industry
[2]The North American Industrial Classification System (NAICS) is the current standard in the United States.[3] Even these industries are not purely travel. For example, the accommodations industry provides services to local residents (food service and meeting rooms). Passenger airlines also ship cargo on the same planes that carry passengers. Fortunately, it is usually possible to make adjustments for these non-travel components through the use of additional data.
DEAN RUNYAN ASSOCIATESPAGE 108

firms. For example, if there is an estimate of visitor-days and an estimate of how much the average visitor spends on food services per day, then an estimate of visitor spending on food services can be calculated. In most cases, this will be only a fraction of all food service sales in that residents are a larger market for most restaurants.[4] The industry sectors that are usually matched to visitor spending in this way are: accommodations (NAICS 721), food service (722), arts, entertainment and recreation (71), and retail trade (44-45). A portion of transportation business is also part of the travel industry for obvious reasons.
In the case of the transportation sector, the definition and measurement of the travel industry component is more complicated because most transportation spending by visitors involves travel to and from the destination, rather than travel at or within the destination market. This is not an issue if the geographic scope of the travel industry market includes the origin and destination of travel. National travel industry accounts thus include all domestic passenger air transportation in the travel industry. The issue is more complicated at the state or regional level, however.
Suppose, for example, that the focus of a travel industry account is the state of Idaho. How should the purchase of a round trip airline ticket by a Chicago resident traveling to Boise be treated in that only some of the economic impact of this spending will occur in Idaho? A reasonable approach would be to allocate only a portion of this spending (and related payroll, taxes, etc.) to Idaho and ignore the remainder for the purpose of creating a travel industry account for Idaho. However, if this procedure were followed for every state, the sum of the state accounts would be less than the national travel account. The state accounts would be additive if outbound air travel from each state were included. However, this is methodologically inconsistent with the construction of a national account, which does not include outbound travel as a component of domestic tourism demand. The approach used in the RTIM is to make a distinction between the visitor industry, that includes only visitor demand, and the travel industry, which includes visitor demand and that portion of outbound travel that can be attributed to the resident economy. For example, the passenger air transportation employment in Idaho can be divided between three groups of travelers: inbound, outbound, and pass-through. Only that employment attributable to inbound travel is part of the Idaho visitor industry. Employment attributable to outbound and pass- through travelers is included with the larger travel industry.[5]
[4]The proportion can vary enormously among regions and localities, however. In many popular visitor destinations, the primary market for food service will be visitors. It should also be noted that even with reliable visitor survey data, there is still the issue of how to translate spending on food service commodities to the supply of
food service by industry. As indicated in the footnote above, food service is also supplied by the accommodation industry.[5]The same issue arises with travel agencies and reservation services (NAICS 5615). Most of these services are probably related to outbound travel and are treated as such in the RTIM.
PAGE 109 DEAN RUNYAN ASSOCIATES

Bureau of Economic Analysis Tourism Industries Distribution of Travel-Generated Compensation
in United States, 2007
Accommodation & Food Services 38.1%
Traveler accommodations 21.5%
Food services and drinking places 16.6%
Transportation 23.3%
Air transportation 15.4%
Rail transportation 0.4%
Water transportation 1.2%
Interurban bus transportation 0.3%
Interurban charter bus transportation 0.2%
Urban transit systems & other tran. 1.7%
Taxi service 1.0%
Automotive equipment rental & leasing 2.0%
Automotive repair services 0.8%
Parking lots and garages 0.2%
Toll highways 0.1%
Recreation 11.2%
Scenic and sightseeing transportation 0.4%
Motion pictures and performing arts 1.1%
Spectator sports 2.3%
Participant sports 2.4%
Gambling 3.0%
All other recreation and entertainment 2.0%
Retail & Nondurable Goods Production 16.2%
Petroleum refineries 0.6%
Industries producing nondurable PCE
commodities, excluding petroleum refineries
4.4%
Wholesale trade & tran. services 4.2%
Gasoline service stations 1.3%
Retail trade services, excluding
gasoline service stations
5.8%
Travel Arrangement 7.3%
All other industries 2.2%
Total Tourism Compensation 100.0% Source: Adapted from Eric S. Griffith and Steven L. Zemanek, “U.S. Travel and Tourism Satellite Accounts for 2005-2008,” Survey of Current Business (June 2009): 37, table 6.
The following two tables display the specific industries that are included in the travel industry for the BEA’s national TTSA and the RTIM. Although not identical, the industries are equivalent with only a few exceptions.[6]
[6]The major exception is that the BEA includes the production of consumer non-durables that are sold through retail outlets. This is not a major component and would be even less so at the level of the state.
DEAN RUNYAN ASSOCIATESPAGE 110

RTIM Travel Impact Industries Matched to NAICS
Travel Impact Industry NAICS Industry (code)
Accommodation & Food Services
Arts, Entertainment & Recreation
Retail
Ground Transportation
Air Transportation
Administrative/Support Services
Accommodation (721)
Food Services and Drinking Places (722)
Performing Arts, Spectator Sports (711)
Museums (712)
Amusement, Gambling (713)
Scenic and Sightseeing Transportation (487)
Food & Beverage Stores (445)
Gasoline Stations (447)
Clothing and Clothing Accessories Stores (448)
Sporting Goods, Hobby, Book, and Music Stores (451)
General Merchandise Stores (452)
Miscellaneous Store Retailers (453)
Interurban and rural bus transportation (4852)
Taxi and Limousine Service (4853)
Charter Bus Industry (4855)
Passenger Car Rental (532111)
Parking Lots and Garages (812930)
Scheduled Air Passenger Transportation (481111)
Support Activities for Air Transportation (4881)
Travel Arrangement and Reservation Services (5615)
Convention and Trade Show Organizers (56192)
Source: Dean Runyan Associates
PAGE 111 DEAN RUNYAN ASSOCIATES

DEMAND SEGMENTS
The distinction between inbound and outbound travel has already been discussed in the previous section and in terms of the concepts of the visitor industry and the travel industry. Three other types of demand segments that are related exclusively to the visitor industry will be discussed here. The first two demand categories are reported by the BEA in their national TTSA. They are: leisure versus business travel, and resident versus non-resident travel. The third demand category is typically reported in the RTIM: type of traveler accommodation. These three demand categories will be discussed in turn.
The distinction between leisure versus business travel is useful for several reasons. Economists like to distinguish between personal consumption expenditures on the one hand and business expenditures on the other. Indeed, this distinction is central for the National Income and Product Accounts (NIPAs). Those in the travel industry are more likely to be interested in this distinction because leisure travelers represent a more “marketable” segment because their travel choices are less determined by economic and business factors. Furthermore, business and leisure travelers tend to have different spending profiles. The availability of this information in either a state or regional TTSA or RTIM is essentially dependent on the availability of survey data (as it is at the national level). It should be noted, however, that such estimates are considerably less reliable for smaller geographic areas because of the limitations of survey data. Even at the state level, year-to-year changes in the composition of this demand segment should be interpreted in conjunction with other data.
The distinction between resident versus non-resident travel is fundamental to a national TTSA because it mirrors the distinction between the domestic economy and international transactions. Non-resident travel in the United States is considered an export in the official international transaction accounts.[7] The distinction is obviously also important because it is based on different political, legal, and currency regimes - factors that in themselves influence travel behavior. At the level of the state or region, the distinction between resident and nonresident travel is less important, although it is often reported.[8] There are at least two reasons why this distinction is less useful at state and regional levels.
First, there is considerably less of an economic rationale for distinguishing resident and non-resident travel at the level of the state, or any other political jurisdiction within the United States, than there is at the national level. States do not maintain interstate trade balance sheets that chart the flow of goods and services across state boundaries. From an economic point of view, the administration of the tax system is the primary, if only, reason for this distinction. In the case of travel and tourism, the evaluation of the tax impacts of resident versus nonresident travel might also be important.[9]
[7]Conversely, the spending of U.S. visitors in other countries is treated as an import in the international transaction accounts.[8]The issues discussed with regard to the reliability of survey data for leisure versus business travel also applies to this category[9]Nonresident visitors who pay taxes in their destination state represent an unambiguous gain for the state. This effect is less clear for resident travelers within the state.
DEAN RUNYAN ASSOCIATESPAGE 112

Second, travel is behaviorally defined by length of distance from home (usually at least 50 miles one-way), trip purpose (non-routine), and/or the use of an overnight accommodation away from home. Rarely is domestic travel defined by virtue of crossing a geographic boundary.[10] The operators of tourist attractions in local communities are generally less interested in the origin of visitors than in the revenue that they generate for their businesses. In terms of the economic impacts at the local level, the distinction between in-state residents, out-of-state residents and international visitors may not be relevant other than for the purpose of marketing. However, other geographic characteristics of the visitor (e.g., distance traveled, the specific area of origin) are generally more useful measures of the visitor market than whether the visitor is a resident or nonresident.Finally, the distinction among different types of traveler accommodations is generally reported in the RTIM. Typically, these categories are:
· Visitors who stay in hotels, motels, B&Bs., and similar lodging facilities· Visitors who stay at campsites· Visitors who stay in the private homes of friends or relatives· Visitors who stay in vacation or second homes
· Visitors who do not stay in overnight accommodations on their trip away from home (day visitors).
These distinctions can be useful because estimates of economic impacts are often used for different purposes. The total of all accommodation types, of course, is an estimate of the total magnitude of the visitor industry. Visitors who stay in commercial lodging such as hotels and motels are most likely to have the greatest economic impact on a person-day basis. These visitors are also more likely to be influenced by marketing efforts. In urban areas, a large proportion will represent business travel. In other words, the type of accommodation category can be used in conjunction with other types of data to analyze the market characteristics of visitors.
[10]In essence, state level travel impact estimates really represent an aggregation of smaller geographic units, such as counties or regions. Populous states with large landmasses (e.g., California or Texas) will have a higher proportion of resident travel than small states (e.g., Rhode Island or Delaware).
PAGE 113 DEAN RUNYAN ASSOCIATES

COMPONENTS OF INDUSTRY OUTPUT
Because both the RTIM and the TTSA are empirically linked to NAICS industry accounts, it is possible to provide estimates of different components of economic output. The major economic components most often estimated are.[11]
· Travel spending (Gross Output)· Value-added (Gross Product)· Earnings (labor income)· Indirect business taxes (sales, excise, property taxes & fees).
The relationship of these components is shown below. As indicated, the value- added of a particular industry (the bar on the right) is equal to gross output (travel spending) minus the intermediate inputs used by travel industry businesses to produce the good or service. Restaurants, for example, prepare and serve the food products that are purchased from suppliers. Airlines purchase or lease airplanes from other firms. These intermediate inputs are not counted as part of the value- added of the travel industry. They are counted as value-added in other industries (e.g., agriculture, aerospace manufacturing).
Components of Industry Output
Inputs/Goods Resold
OperatingSurplus
Indirect Taxes
Labor Income
Output(Spending) Value-Added
The distinction between gross output and value-added is probably even more important at the state or regional level. This is because the intermediate inputs that are purchased from other industries are even more likely to be purchased from businesses located in different regions or states. For example, the economic impact of air passenger travel in the state of
[11]There are some small differences between the BEA TTSA and the RTIM in what these components include. The BEA allocates proprietor income to Operating Surplus, the RTIM allocates it to Labor Income. The RTIM does not have an estimate of property taxes in indirect taxes. Overall, property taxes on businesses are a relatively small proportion of indirect taxes.
DEAN RUNYAN ASSOCIATESPAGE 114
Hawaii should not include the purchase of airplanes manufactured in other parts of the world. Travel industry value-added is a more meaningful measure of the true economic impact of visitor spending in Hawaii because a portion of the economic impact of visitor spending in the state will actually occur elsewhere.[12] Value-added can also be viewed in terms of the distribution or payout of industry receipts, exclusive of those paid to other firms for intermediate inputs. Some of the receipts are distributed to labor as wages, benefits, and proprietor income. Some receipts are paid to government as indirect taxes. These taxes are called “indirect” because most of them are actually paid by consumers in the form of sales or excise taxes.[13] The remainder leaves gross operating surplus. Out of gross operating surplus various payments are made in the form of dividends, interest, and other payments, or retained by the firm. The sum of these three broad categories of payments is equal to travel industry value-added. To summarize:
Value-added = Spending less intermediate goods & services, or Value-added = Labor Income plus indirect business taxes plus gross operating surplus.
The RTIM is similar to the TTSA in that it also provides estimates of these components of economic output. Travel spending, earnings, and tax impacts are generally provided at the state or regional level. Value-added is generally reported at the state-level only (sometimes referred to as Travel Industry Gross State Product). At the level of the state, travel industry value-added or GSP is an important measure -- more economically meaningful than travel spending.[14] For smaller geographic areas, however, the rationale for reporting value-added is less clear. First, there are real data limitations and data costs in deriving these estimates. Second, the most important components of value added for the travel industry are earnings and tax receipts. Because the travel industry is relatively labor intensive and because a large proportion of travel industry goods and services are subject to excise and sales taxes, these two components of value-added (labor income and indirect taxes) are relatively high for the travel industry. The local effects of gross operating surplus are generally less important and certainly much more difficult to assess than are earnings and tax impacts. The relevance of earnings and tax receipts is also in keeping the export-oriented emphasis of the travel industry: earnings and tax receipts are more likely to stay in the local economy than is operating surplus.
[12]It should also be noted the value of the intermediate inputs used by travel industry firms will not necessarily disappear if the travel industry stops buying them. Aerospace firms will shift their production to other users (e.g., military). Agriculture will seek new markets for their products.[13]Other taxes included here are property taxes, business franchise taxes, and other fees. Income taxes are not included, because they are paid out of operating surplus.[14]It is also possible to compare different industries with respect to their value-added. It is more difficult and less useful to compare industries on the basis of sales.
PAGE 115 DEAN RUNYAN ASSOCIATES

INDIRECT, INDUCED AND SECONDARY EFFECTS
To this point, the discussion of travel industry accounts has referred only to the direct output components. That is, the ripple effects of the re-spending of travel industry receipts throughout the larger economy have not been analyzed. The structure of both the TTSA and the RTIM permit such analysis.
· Indirect effects refer to the intermediate inputs used to produce the final product or service, providing that those inputs are themselves produced within the designated geographic area.
· Induced effects refer to the purchase of goods and services by employees that are attributable to direct and indirect impacts. These induced impacts are derived from economic data that describe the purchasing patterns of households. For example, employees of all the designated export-oriented industries will spend their income on food, household durables, health care, and so on.
· The sum of indirect and induced impacts is sometimes referred to as the secondary effect. These secondary impacts may be as great or greater than the direct impact alone.
· The ratio of the total effects (direct plus either indirect, induced, or secondary) to the direct effects is the multiplier.
The BEA reports the indirect components of economic output. This is equivalent to domestic travel spending less the goods and services imported from abroad to meet domestic demand. For travel, these imports would include souvenirs manufactured in China and petroleum extracted in Saudi Arabia. The indirect output multiplier for 2002 was 1.76. The ratio of domestic travel spending to travel industry value-added was 1.88. The difference reflects the intermediate inputs for travel imported from abroad.
At the state level, these indirect output multipliers are typically lower because relatively more of the intermediate inputs are purchased from outside of the state. At the county or metropolitan level, the multipliers are generally even lower for the same reason. Furthermore, the estimates are usually less reliable because of the data limitations of the regional input-output model used to estimate the indirect effects.
The BEA does not report induced effects - the effect of household spending of the direct and indirect labor income. Typically, these induced effects will be larger than the indirect effects at the state or regional level, in part because they are based on both the direct and indirect components.15 As with indirect effects, the induced effects will also tend to be lower for smaller economic areas and the reliability of the estimates will be less.
[15]The induced effects can be estimated with the Implan model maintained by the Minnesota Implan Group.
DEAN RUNYAN ASSOCIATESPAGE 116

Secondary effects should be interpreted cautiously. These effects describe the relationship of economic transactions at a point in time. These relationships will not necessarily remain constant with a change in direct economic output. This is because all economic resources have alternative uses. Because of this, it is often difficult to determine the effect of an increase or decrease in visitor spending on the larger economic system over time.
THE REGIONAL TRAVEL IMPACT MODEL AND TRAVEL & TOURISM SATELLITE ACCOUNTS
COMPARED
This appendix has provided an overview of Dean Runyan Associates RTIM and the Bureau of Economic Analysis’ domestic TTSA. These travel industry accounts are similar in terms of how they define the travel industry and the measures of the industry that are reported. The differences stem largely from their different levels of analysis - the BEA provides estimates at the national level only, while the RTIM’s are typically constructed on a state or regional level. Because of this geographic focus, the RTIM provides a distinction between the visitor industry and the travel industry. The RTIM also provides measures of all of the components of economic output and secondary effects at the state or large region level. At smaller units of analysis, however, the emphasis is on earnings and tax receipts generated by travel spending as these are the most reliable and meaningful measures of the economic impact of travel at the local level.
PAGE 117 DEAN RUNYAN ASSOCIATES

APPENDIX E
Earnings Percent Employment Percent
Industry Sector ($Billion) of Total (Thousand) of Total
Primarily Export-Oriented 7.8 17.5% 128 13.1%
Agriculture, Forestry, Fishing and related 2.5 5.7% 52 5.3%
Mining 0.4 1.0% 5 0.6%
Manufacturing 4.9 10.9% 70 7.2%
**Travel 1.0 2.3% 44 4.5%
Primarily Non Export-Oriented 22.0 49.4% 503 51.4%
Construction 3.3 7.3% 61 6.3%
Utilities 0.4 0.8% 3 0.3%
Wholesale trade 2.1 4.7% 34 3.5%
Retail trade 3.9 8.7% 111 11.3%
Real estate and rental and leasing 0.8 1.9% 50 5.1%
Management of companies and enterprises 0.5 1.2% 6 0.7%
Administrative and waste services 2.0 4.5% 56 5.8%
Other services, except public administration 1.5 3.3% 49 5.0%
Government and government enterprises 7.6 17.0% 131 13.4%
Mixed 14.8 33.1% 347 35.5%
Transportation and warehousing 1.4 3.2% 29 3.0%
Information 0.6 1.4% 12 1.2%
Finance and insurance 1.9 4.3% 40 4.1%
Professional and technical services 3.1 7.1% 58 6.0%
Educational services 0.5 1.0% 18 1.8%
Health care and social assistance 5.5 12.3% 103 10.5%
Leisure and Hospitality 1.7 3.8% 87 8.9%
Idaho Total** 44.6 100.0% 977 100.0%
Idaho Earnings and Employment by Industry Sector, 2016
**Travel is not included in the sub and grand totals because it is also represented in other sectors (primarily leisure
and hospitality, transporation, and retail trade).
DEAN RUNYAN ASSOCIATESPAGE 118

APPENDIX F
Industry G roups
Accommodation & Food Services Food services and drinking places
Hotels and m otels, including casino hotels
O ther accom m odations
Arts, Entertainment & Recreation Am usem ent parks, arcades, and gam bling industries
Bowling centers
Fitness and recreational sports centers
Independent artists, writers, and perform ers
M useum s, historical sites, zoos, and parks
O ther am usem ent and recreation industries
Perform ing arts com panies
Prom oters of perform ing arts and sports and agents for public figures
Spectator sports com panies
Construction Construction of new nonresidential com m ercial and health care structures
Construction of new nonresidential m anufacturing structures
Construction of new residential perm anent site single- and m ulti-fam ily structures
Construction of other new nonresidential structures
Construction of other new residential structures
M aintenance and repair construction of nonresidential structures
M aintenance and repair construction of residential structures
Education and Health Services Child day care services
Com m unity food, housing, and other relief services, including rehabilitation services
Hom e health care services
Individual and fam ily services
M edical and diagnostic labs and outpatient and other am bulatory care services
Nursing and residential care facilities
O ffices of physicians, dentists, and other health practitioners
O ther private educational services
Private elem entary and secondary schools
Private hospitals
Private junior colleges, colleges, universities, and professional schools
Financial Activities Com m ercial and industrial m achinery and equipment rental and leasing
Funds, trusts, and other financial vehicles
General and consum er goods rental except video tapes and discs
Im puted rental activity for owner-occupied dwellings
Insurance agencies, brokerages
Insurance carriers
Lessors of nonfinancial intangible assets
M onetary authorities and depository credit interm ediation activities
Nondepository credit interm ediation and related activities
Real estate establishm ents
Securities, com m odity contracts, investm ents, and related activities
Video tape and disc rental
PAGE 119 DEAN RUNYAN ASSOCIATES

Information Book publishers
Cable and other subscription programming
Data processing, hosting, ISP, web search portals and related services
Directory, mailing list, and other publishers
Internet publishing and broadcasting
Motion picture and video industries
Newspaper publishers
Other information services
Periodical publishers
Radio and television broadcasting
Software publishers
Sound recording industries
Telecommunications
Manufacturing & Utilities
(280 industries)
Natural Resources and Mining All other crop farming
Animal production, except cattle and poultry and eggs
Cattle ranching and farming
Commercial fishing
Commercial hunting and trapping
Commercial logging
Cotton farming
Dairy cattle and milk production
Drilling oil and gas wells
Extraction of oil and natural gas
Forestry, forest products, and timber tract production
Fruit farming
Grain farming
Greenhouse, nursery, and floriculture production
Mining and quarrying other nonmetallic minerals
Mining and quarrying sand, gravel, clay, and ceramic and refractory minerals
Mining and quarrying stone
Mining coal
Mining copper, nickel, lead, and zinc
Mining gold, silver, and other metal ore
Mining iron ore
Oilseed farming
Poultry and egg production
Sugarcane and sugar beet farming
Support activities for agriculture and forestry
Support activities for oil and gas operations
Support activities for other mining
Tobacco farming
Tree nut farming
Vegetable and melon farming
DEAN RUNYAN ASSOCIATESPAGE 120

Other Services Automotive repair and maintenance, except car washes
Car washes
Civic, social, professional, and similar organizations
Commercial and industrial machinery and equipment repair and maintenance
Death care services
Dry-cleaning and laundry services
Electronic and precision equipment repair and maintenance
Grantmaking, giving, and social advocacy organizations
Other personal services
Personal and household goods repair and maintenance
Personal care services
Private household operations
Religious organizations
Professional and Business Services Accounting, tax preparation, bookkeeping, and payroll services
Advertising and related services
All other miscellaneous professional, scientific, and technical services
Architectural, engineering, and related services
Business support services
Computer systems design services
Custom computer programming services
Employment services
Environmental and other technical consulting services
Facilities support services
Investigation and security services
Legal services
Management of companies and enterprises
Management, scientific, and technical consulting services
Office administrative services
Other computer related services, including facilities management
Other support services
Photographic services
Scientific research and development services
Services to buildings and dwellings
Specialized design services
Travel arrangement and reservation services
Veterinary services
Waste management and remediation services
Public Administration Federal electric utilities
Other Federal Government enterprises
Other state and local government enterprises
State and local government electric utilities
State and local government passenger transit
US Postal Service
PAGE 121 DEAN RUNYAN ASSOCIATES

Trade Retail Nonstores - Direct and electronic sales
Retail Stores - Building material and garden supply
Retail Stores - Clothing and clothing accessories
Retail Stores - Electronics and appliances
Retail Stores - Food and beverage
Retail Stores - Furniture and home furnishings
Retail Stores - Gasoline stations
Retail Stores - General merchandise
Retail Stores - Health and personal care
Retail Stores - Miscellaneous
Retail Stores - Motor vehicle and parts
Retail Stores - Sporting goods, hobby, book and music
Wholesale trade businesses
Transport Automotive equipment rental and leasing
Couriers and messengers
Scenic and sightseeing transportation and support activities for transportation
Transit and ground passenger transportation
Transport by air
Transport by pipeline
Transport by rail
Transport by truck
Transport by water
Warehousing and storage
DEAN RUNYAN ASSOCIATESPAGE 122