idames pilot study dietary intake domenico palli molecular and nutritional epidemiology unit cancer...
TRANSCRIPT

Idames pilot studyDietary intake
Domenico PalliMolecular and Nutritional Epidemiology Unit
Cancer Research and Prevention Institute (ISPO) Florence Italy

Preliminary considerations on 24HDR
In general, the decision on how many days should be
covered by 24HDR to obtain a satisfactory estimate of
the consumption /intake of specific foods/ nutrients
depends on several factors, including the statistical
characteristics of the specific variable(s) of interest,
including among the others:
Mean consumption/ intake
Between-day variability

Data analysis
Description of the study population (participants
in local cohort studies, including 4 EPIC centers)
Distribution of macronutrients, energy and food
groups according to 24h dietary recalls (24HDR)
Reliability measures (1st vs 2nd 24HDR)
The study is still ongoing, here we present
very preliminary results!

Idames 24HDR - Feasibility
400 Invited subjects400 Invited subjects
IDAMES CentreTotal response
rate
Total participation rate - EFPQ
First 24-H D Recall
Second 24-H D Recall
Third 24-H D Recall
N % N % N % N % N %
Estonia 77 96.3% 70 87.5% 69 98.6% 63 90.0% 29 41.4%
Germany 74 92.5% 55 68.8% 55 100.0% 50 90.9% 48 87.3%
Italy 66 82.5% 48 60.0% 43 89.6% 31 64.6% 3 6.3%
Norway 60 75.0% 30 37.5% 24 80.0% 11 36.7% 1 3.3%
Spain 72 90.0% 59 73.8% 19 32.2% 0 0.0% 0 0.0%
Overall 349 87.3% 262 65.5% 210 80.2% 155 59.2% 81 30.9%

Males 24H D Recall
Country First Second Third OverallEstonia 37 33 14 84Germany 26 24 22 72Italy 25 16 1 42Spain 9 0 0 9Overall 97 73 37 207
24HDR Recalls by Gender
Females 24H D Recall
Country First Second Third OverallEstonia 32 30 15 77Germany 29 26 26 81Italy 18 15 2 35Norway 24 11 1 36Spain 10 0 0 10Overall 113 82 44 239

Study population characteristicsFemales (n=113)
Age (yrs) Height (cm) Weight (kg) BMI (Kg/m2)
Country N Mean SD Mean SD Mean SD Mean SD
Estonia 32 33.7 13.2 167.8 5.7 71.3 16.6 25.4 6.1
Germany 29 64.1 6.8 163.2 7.3 71.7 16.2 26.9 5.5
Italy 18 66 5.6 152.2 37.1 65.2 13.3 25.3 5.2
Norway 24 55.8 4.0 167.9 8.3 70.2 12.6 25.1 5.8
Spain 10 60.8 6.1 159.7 6.9 62.2 6 24.4 2
Overall 113 53.8 15.6 163.4 16.7 69.4 14.6 25.6 5.5

Study population characteristicsMales (n = 97)
Age (yrs) Height (cm) Weight (kg) BMI (Kg/m2)
Country N Mean SD Mean SD Mean SD Mean SD
Estonia 37 34.6 12.4 182.3 6.8 86.0 11.9 25.9 4.0
Germany 26 65.5 6.7 177.4 8.0 85.0 12.2 27.0 3.5
Italy 25 62.0 11.5 174.6 5.7 80.3 9.3 26.4 2.9
Spain 9 62.8 5.0 171.9 7.6 80.1 8.9 27.1 2.8
Overall 97 52.9 17.4 177.9 7.8 83.7 11.3 27.0 2.3

Days of the week distribution
1st 24HDR (N = 210)
2nd 24HDR (N = 155)
3rd 24HDR (N = 81)

0
1000
2000
3000
4000
Estonia Germany Italy Norway Spain
kcal
/day
Energy
Macronutrients and energy – First 24HDR Females (n = 113)
0
100
200
300
400
500
Estonia Germany Italy Norway Spain
g/da
y
Carbohydrate intake
0
50
100
150
Estonia Germany Italy Norway Spain
g/d
ay
Protein intake
0
50
100
150
Estonia Germany Italy Norway Spain
g/d
ay
Fat intake
0
20
40
60
Estonia Germany Italy Norway Spaing
/day
Alcohol intake

0
1000
2000
3000
4000
Estonia Germany Italy Spain
kcal
/day
Energy
Macronutrients and energy – First 24HDR Males (n = 97)
0
100
200
300
400
500
Estonia Germany Italy Spain
g/d
ay
Carbohydrate intake
0
50
100
150
Estonia Germany Italy Spain
g/d
ay
Protein intake
0
50
100
150
Estonia Germany Italy Spain
g/d
ay
Fat intake
0
20
40
60
Estonia Germany Italy Spain
g/d
ay
Alcohol intake
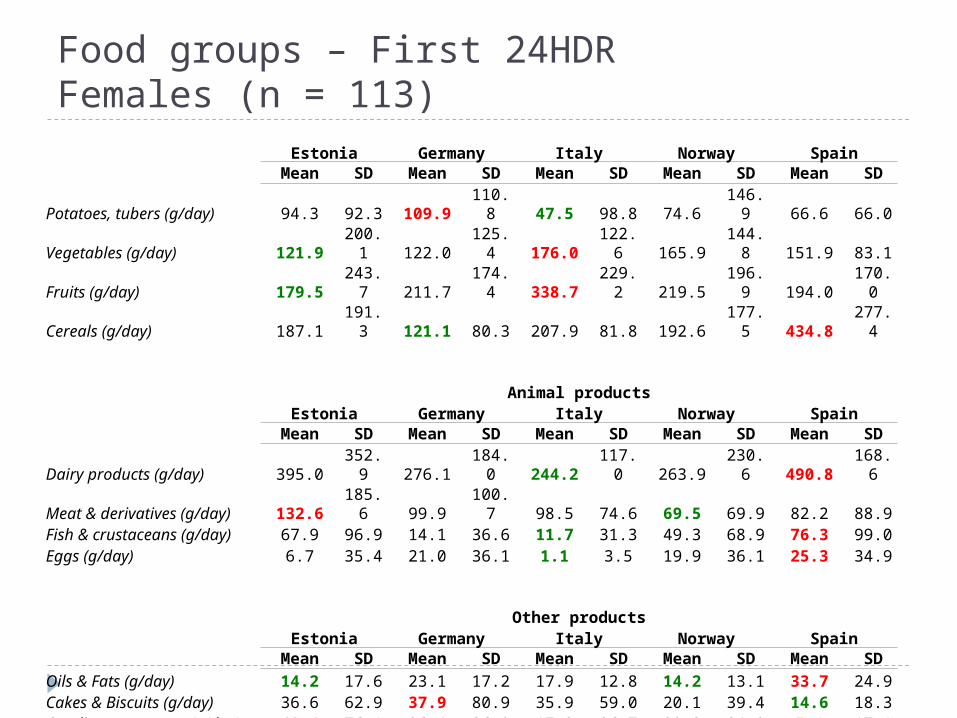
Food groups – First 24HDR Females (n = 113)
Estonia Germany Italy Norway SpainMean SD Mean SD Mean SD Mean SD Mean SD
Potatoes, tubers (g/day) 94.3 92.3 109.9 110.8 47.5 98.8 74.6 146.9 66.6 66.0Vegetables (g/day) 121.9 200.1 122.0 125.4 176.0 122.6 165.9 144.8 151.9 83.1Fruits (g/day) 179.5 243.7 211.7 174.4 338.7 229.2 219.5 196.9 194.0 170.0Cereals (g/day) 187.1 191.3 121.1 80.3 207.9 81.8 192.6 177.5 434.8 277.4
Animal productsEstonia Germany Italy Norway Spain
Mean SD Mean SD Mean SD Mean SD Mean SD
Dairy products (g/day) 395.0 352.9 276.1 184.0 244.2 117.0 263.9 230.6 490.8 168.6Meat & derivatives (g/day) 132.6 185.6 99.9 100.7 98.5 74.6 69.5 69.9 82.2 88.9Fish & crustaceans (g/day) 67.9 96.9 14.1 36.6 11.7 31.3 49.3 68.9 76.3 99.0Eggs (g/day) 6.7 35.4 21.0 36.1 1.1 3.5 19.9 36.1 25.3 34.9
Other productsEstonia Germany Italy Norway Spain
Mean SD Mean SD Mean SD Mean SD Mean SD
Oils & Fats (g/day) 14.2 17.6 23.1 17.2 17.9 12.8 14.2 13.1 33.7 24.9Cakes & Biscuits (g/day) 36.6 62.9 37.9 80.9 35.9 59.0 20.1 39.4 14.6 18.3Condiments, sauces (g/day) 62.6 76.1 26.4 36.0 17.2 26.7 20.3 24.8 5.4 17.1

Food groups – First 24HDR Males (n = 97)
Vegetal productsEstonia Germany Italy Spain
Mean SD Mean SD Mean SD Mean SD
Potatoes, tubers (g/day) 179.0 188.0 147.9 129.1 53.8 127.3 78.4 46.8Vegetables (g/day) 82.1 95.4 144.4 105.9 214.6 148.5 236.9 152.3Fruits (g/day) 72.6 122.1 222.3 225.3 338.7 220.9 293.3 332.5Cereals (g/day) 182.3 124.7 202.3 129.4 343.7 184.7 330.6 271.9
Animal productsEstonia Germany Italy Spain
Mean SD Mean SD Mean SD Mean SD
Dairy products (g/day) 521.0 460.3 280.2 252.9 172.5 135.1 484.8 225.3Meat & derivatives (g/day) 173.6 134.5 149.2 119.2 124.8 113.6 224.2 170.2Fish & crustaceans (g/day) 44.8 94.3 25.4 68.2 22.6 47.3 93.3 94.2Eggs (g/day) 13.9 39.6 18.5 42.7 13.3 43.8 31.8 58.3
Other productsEstonia Germany Italy Spain
Mean SD Mean SD Mean SD Mean SD
Oils & Fats (g/day) 16.3 21.2 40.6 26.5 31.8 19.3 43.2 28.9Cakes & Biscuits (g/day) 116.3 182.8 62.3 97.8 40.7 55.2 24.0 43.9Condiments, sauces (g/day) 62.4 82.7 23.3 32.9 30.8 41.5 0.0 0.0

Energy intake
0
1000
2000
3000
4000
Estonia Germany Norw ay Italy
Idames centre
kcal
/day
Comparison between First (I) and Second (II) 24HDR Macronutrients – Females (n = 81)
Carbohydrate intake
0
100
200
300
400
500
Estonia Germany Norw ay Italy
Idames centre
g/da
y
Protein intake
0
50
100
150
200
Estonia Germany Norw ay Italy
Idames centre
g/da
y
Fat intake
0
50
100
150
200
Estonia Germany Norw ay Italy
Idames centre
g/da
y
Alcohol intake
0
20
40
60
80
Estonia Germany Norw ay Italy
Idames centre
g/da
y

Energy intake
0
1000
2000
3000
4000
Estonia Germany Italy
Idames centre
kcal
/day
Comparison between First (I) and Second (II) 24HDR Macronutrients – Males (n = 72)
Carbohydrate intake
0
100
200
300
400
500
Estonia Germany Italy
Idames centre
g/da
y
Protein intake
0
50
100
150
200
Estonia Germany Italy
Idames centre
g/d
ay
Fat intake
0
50
100
150
200
Estonia Germany Italy
Idames centre
g/d
ay
0
20
40
60
80
Estonia Germany Italyg
/da
y
Idames centre
Alcohol intake

Differences between First (I) and Second (II) 24HDR Food groups daily consumption– Females (n = 81)
Estonia Germany Italy Norway
Mean 95% CI Mean 95% CI Mean 95% CI Mean 95% CI
Cereals (g) -5.7 (-82.0; 70.6) 4.6 (-32.8; 42.0) 8.1 (-43.7; 59.8) 125.7 (-50.0; 301.4)
Vegetables (g) -16.6 (-84.9; 51.7) -42.1 (-94.9; 10.6) -12.8 (-96.3; 70.7) 41.4 (-40.8; 123.7)
Fruits (g) 9.0 (-82.7; 100.7) -24.0 (-121.9; 73.8) 32.6 (-83.4; 148.7) 29.2 (-54.6; 113.1)
Dairy products (g) 5.7 (-134.1; 145.6) 86.7 (14.7; 158.7) 62.3 (-13.4; 138.0) -4.8 (-248.7; 239.2)
Meat & derivatives (g) 27.5 (-60.3; 115.2) 5.3 (-39.9; 50.4) -3.3 (-111.8; 105.1) -29.4 (-77.2; 18.4)
Fish & crustaceans (g) 43.2 (-1.2; 88.3) -10.7 (-33.9; 12.6) -17.2 (-50.8; 16.4) 2.5 (-34.3; 39.3)

Differences between First (I) and Second (II) 24HDR Food groups daily consumption– Males (n = 72)
Estonia Germany Italy
Mean 95% CI Mean 95% CI Mean 95% CI
Cereals (g) -64.7 (-134.0; 4.7) 21.7 (-34.9; 78.3) 16.4 (-123.2; 156.0)
Vegetables (g) -64.1 (-135.9; 7.7) 13.6 (-46.2; 73.4) 81.6 (19.9; 143.4)
Fruits (g) 6.3 (-41.2; 53.8) -13.1 (-74.5; 48.2) 104.7 (-39.3; 248.8)
Dairy products (g) 50.8 (-92.1; 193.6) -60.5 (-176.3; 55.2) -29.3 (-108.1; 49.4)
Meat & derivatives (g) -121 (-204.5; -37.8) 7.1 (-53.8; 68.0) -120.9 (-250.8; 9.0)
Fish & crustaceans (g) 29.6 (-6.5; 65.7) -18.7 (-49.2; 11.9) 8.2 (-41.1; 57.4)

Reliability measures (1° 24 HDR vs 2° 24HDR)
* Adjusted for country and weekend (y/n)
Males (N = 72) Females (N = 81)Intraclass correlation Intraclass correlation
Crude Adjusted* Crude Adjusted*Protein 0.30 0.29 0.29 0.27Carbohydrates 0.42 0.41 0.44 0.42Fats 0.35 0.31 0.21 0.23Alcohol 0.34 0.23 0.33 0.30% E from Carbohydrates 0.29 0.25 0.20 0.19% E from Fats 0.23 0.15 0.15 0.15% E from Proteins 0.09 0.06 0.18 0.17% E from Alcohol 0.37 0.23 0.34 0.30Energy 0.36 0.35 0.38 0.39Potatoes, tubers 0.29 0.18 0.08 0.01Fruits 0.54 0.35 0.44 0.37Cereals 0.25 0.12 0.22 0.16Dairy products 0.44 0.43 0.38 0.35Meat & derivatives 0.13 0.08 0.07 0.05Oils & Fats 0.48 0.29 0.52 0.47Cakes & Biscuits 0.38 0.24 0.39 0.14

Thank you!Thank you!