ideas that work: changing the odds for our nation’s children and youth aspen ideas festival 2009...
TRANSCRIPT

IDEAS THAT WORK: Changing the Odds for Our Nation’s Children
and Youth
Aspen Ideas Festival 2009
Panelists: Karen J. Pittman, President & CEO, the Forum for Youth Investment Shane J. Lopez, Senior Scientist in Residence, GALLUP Justin Bibb, Associate Partner, Director of Community Strategies, GALLUP
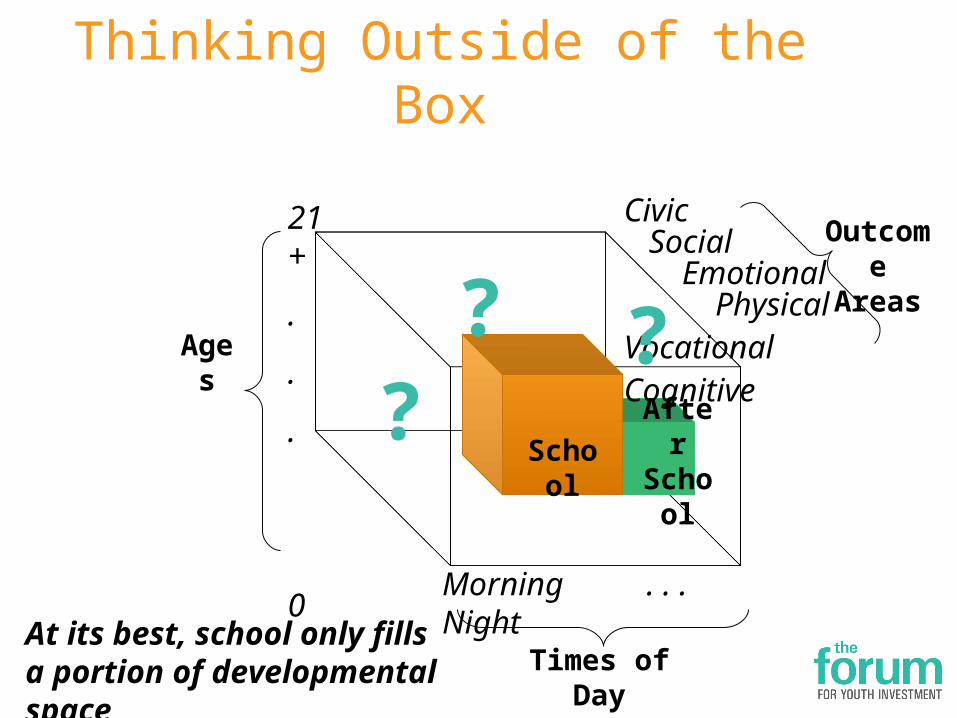
AfterSchool
Ages
Times of Day
Civic Social Emotional Physical Vocational Cognitive
OutcomeAreas
??
?
Thinking Outside of the Box
Morning . . . Night
21+
.
.
.
0
School
At its best, school only fills a portion of developmental space

Child care After-school Civic/Social/Work Social & Strategic Placement Providers Programs Opportunities Supports & Coaching
LEARNING & ENGAGEMENT SUPPORTS
Insulating the Education Pipeline
BASIC SERVICES transportation, health, mental health, housing, financial
K – 12 SystemEarly Childhood
Post Secondary
Work & Career
P-20 EDUCATION PIPELINE
Message #1Too few students are ready for
college, work or life. More high school diplomas are not the only
answer.

Graduating Seniors Job ReadinessP
erce
nt 4
s an
d 5s
Gallup Student Poll Item
5Copyright © 2009 Gallup, Inc. All rights reserved.

Graduating Seniors EntrepreneurshipP
erce
nt 4
s an
d 5s
Gallup Student Poll Item
6Copyright © 2009 Gallup, Inc. All rights reserved.

New Employer Survey Finds Skills in Short Supply
Employers ranked 20 skill areas in order of importance. The top skills fell into five categories:
• 7 in 10 employers saw these skills as critical for entry-level high school graduates
• Employers reported that 4 in 10 high school graduates were deficient in these areas
Professionalism/Work Ethic Teamwork/Collaboration Oral Communications
Ethics/Social Responsibility Reading Comprehension

Message #2
Too few students are getting the supports they need.

What Research Tells Us
SAFE PLACES
CARING ADULTS
OPPORTUNITIES TO HELP OTHERS
EFFECTIVE EDUCATION
HEALTHY START
America’s Promise Five Promises
• Basic Services (implied)
The National Research Council List
• Physical and Psychological Safety• Appropriate Structure• Supportive Relationships• Opportunities to Belong• Positive Social Norms• Support for Efficacy and Mattering• Opportunities for Skill-Building• Integration of Family, School and
Community Efforts

One Third of 6-17 Year Olds Lack the Supports They Need
50%37%
13%
6 – 11 Years Old
45%30%
25%
12 – 17 Years Old
• According to the America’s Promise Alliance National Promises Survey, only 31% of 6-17 year olds have at least 4 of the 5 promises. 21% have 1 or none.
• The likelihood of having sufficient supports decreases with age
37% of 6-11 year olds have at least 4 promises;
13% have 1 or none.
Only 30% of 12-17 year olds have at least 4;
25% have 1 or none.

Message #3
We can change these odds if we change the way we do business

43% are doing well in two life areas and okay in one
- Productivity: Attend college, work steadily
- Health: Good health, positive health habits, healthy relationships
- Connectedness: Volunteer, politically active, active in religious institutions, active in community
22% are doing poorly in two life areas and not well in any
- Productivity: High school diploma or less plus unemployed or on welfare
- Health: Poor health, bad health habits, unsupportive relationships
- Connectedness: Commit illegal activity once a month
2 in 10 4 in 104 in 10
35% are doing okay – doing poorly in no more than one life area and doing well in at most one – and doing okay in the rest
Researchers Gambone, Connell & Klem (2002) estimate that only 4 in 10 young people are doing well in their early 20s.

from 4 in 10doing well
to 7 in 10 doing well
Providing These Supports CAN Change the Odds
Gambone/Connell’s research suggests that if all young people got the supports they needed in early adolescence, the picture could change…

Powerful Solutions for Passionate Leaders
Bigger GoalsBolder StrategiesBroader Partnerships

Message #4
Better, Broader Data Needed:Beyond academics
Beyond school attendanceBeyond access
Data that helps us link student outcomes to student experiences,
exposures and states of being

Gallup Student Poll Finding:
Only 1 in 4 students is hopeful, thriving and engaged in school.

Gallup Student Poll MeasuresHope predicts college GPA and retention over and above HS
GPA and ACT/SAT I can find lots of ways around any problem
Engagement distinguishes between high performing & low performing schools
At this school, I have the opportunity to do what I do best every day.
Well-Being drives academic and vocational success | Cantril Self-Anchoring Striving Scale
& Did you smile or laugh a lot yesterday?
17Copyright © 2009 Gallup, Inc. All rights reserved.
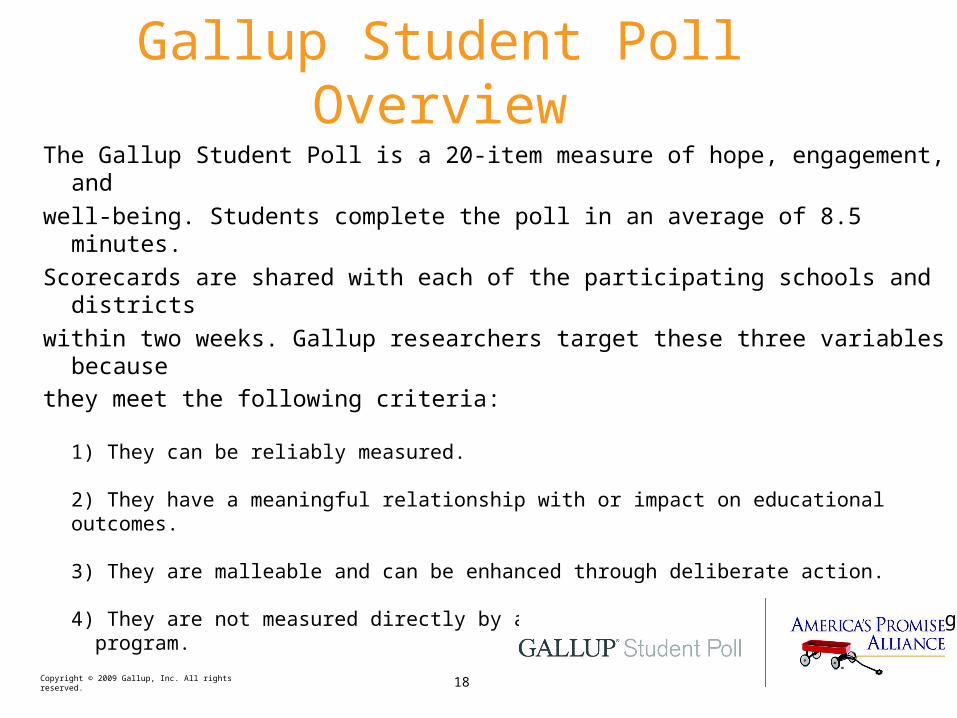
Gallup Student Poll OverviewThe Gallup Student Poll is a 20-item measure of hope, engagement, and well-being. Students complete the poll in an average of 8.5 minutes.Scorecards are shared with each of the participating schools and districtswithin two weeks. Gallup researchers target these three variables becausethey meet the following criteria:
1) They can be reliably measured.
2) They have a meaningful relationship with or impact on educational outcomes.
3) They are malleable and can be enhanced through deliberate action.
4) They are not measured directly by another large-scale survey or testing program.
18Copyright © 2009 Gallup, Inc. All rights reserved.
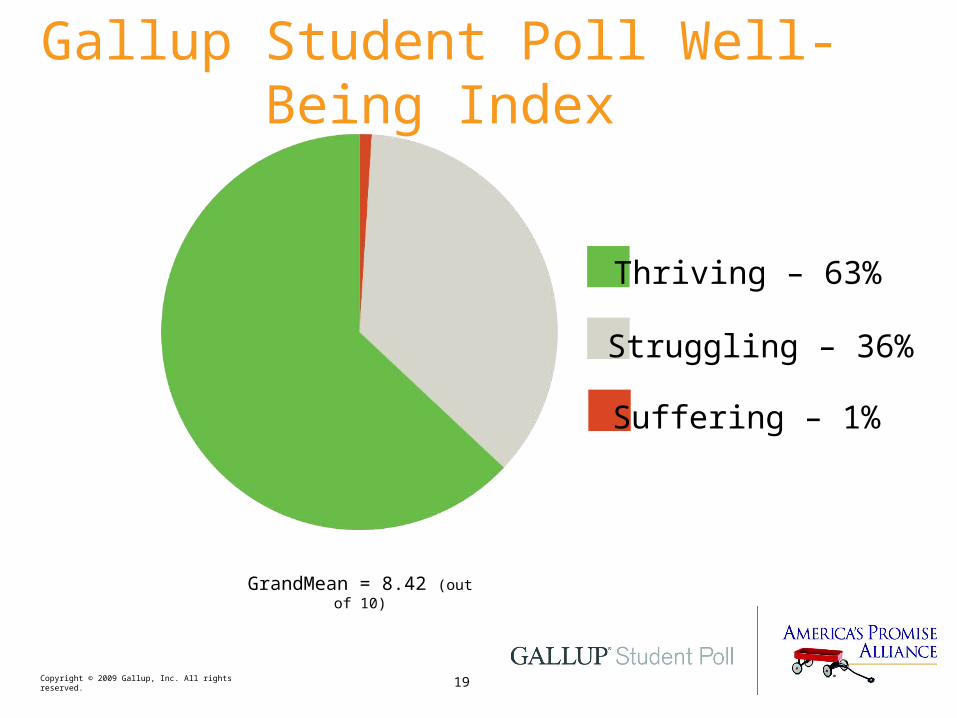
Gallup Student Poll Well-Being Index
Thriving – 63%
Suffering – 1%
Struggling – 36%
GrandMean = 8.42 (out of 10)
Copyright © 2009 Gallup, Inc. All rights reserved. 19

Gallup Student Poll Hope Index
Hopeful – 50%
Discouraged – 17%
Stuck – 33%
GrandMean = 4.38 (out of 5)
Copyright © 2009 Gallup, Inc. All rights reserved. 20
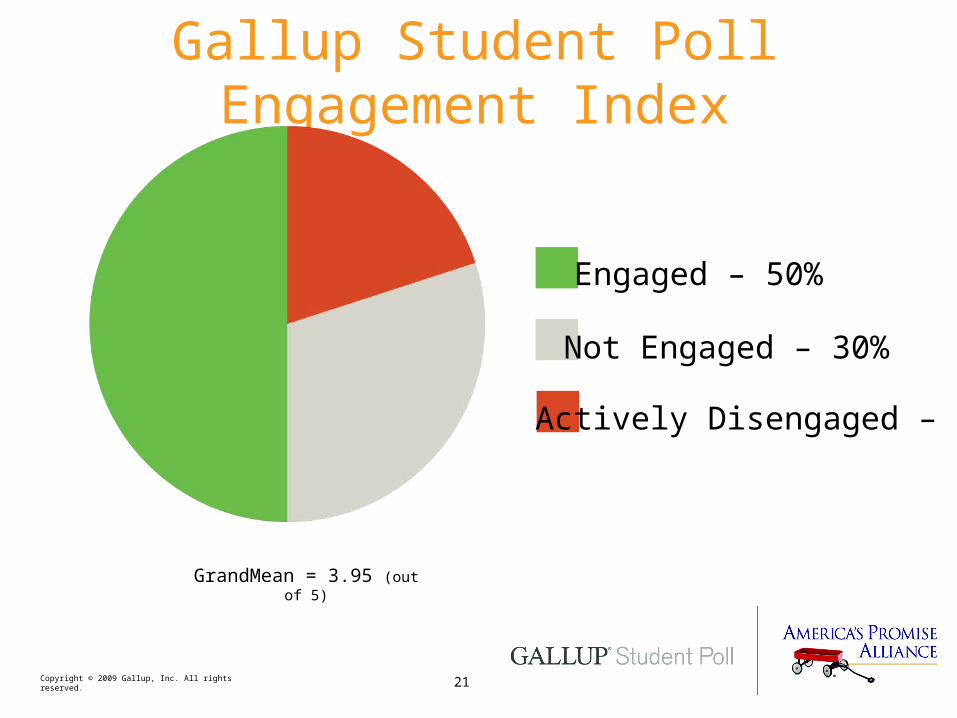
Gallup Student Poll Engagement Index
Engaged – 50%
Actively Disengaged – 20%
Not Engaged – 30%
GrandMean = 3.95 (out of 5)
Copyright © 2009 Gallup, Inc. All rights reserved. 21

Message #5
School, business and community leaders can use these types of data to spark
change.
Mea
n Sc
ore
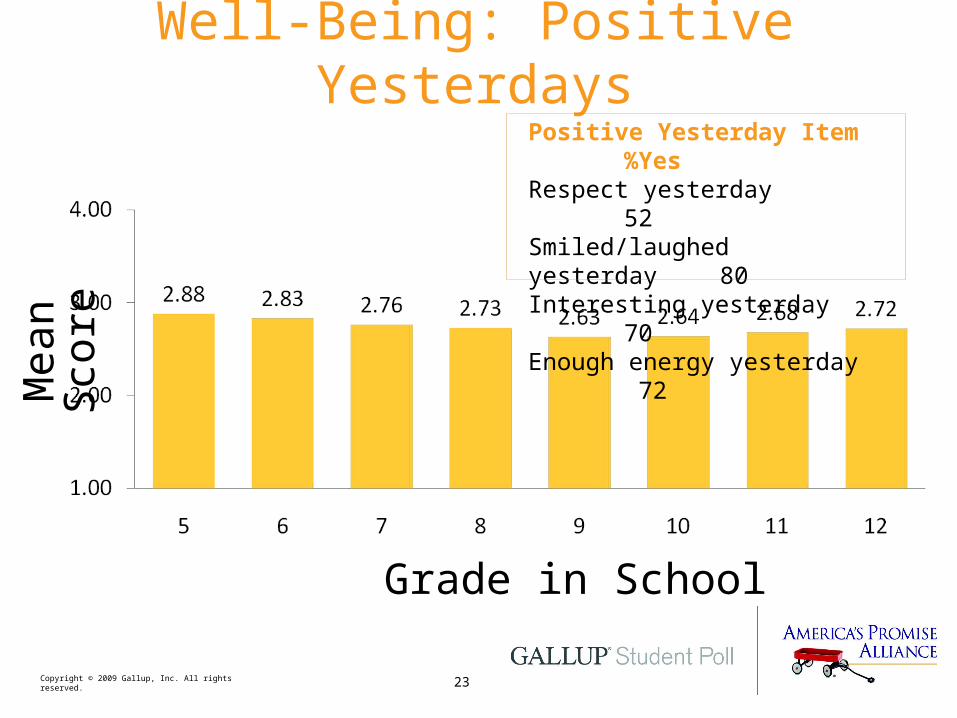
Well-Being: Positive Yesterdays
Grade in School
Positive Yesterday Item %YesRespect yesterday 52 Smiled/laughed yesterday 80Interesting yesterday 70 Enough energy yesterday 72
23Copyright © 2009 Gallup, Inc. All rights reserved.

Perc
ent E
ngag
edPercent Engaged Respondents
Grade in School
24Copyright © 2009 Gallup, Inc. All rights reserved.
Dropouts not included

Ready by 21 Partnership
Powerful Tools for Passionate Leaders

Gallup Student Poll Participation by State
26Copyright © 2009 Gallup, Inc. All rights reserved.
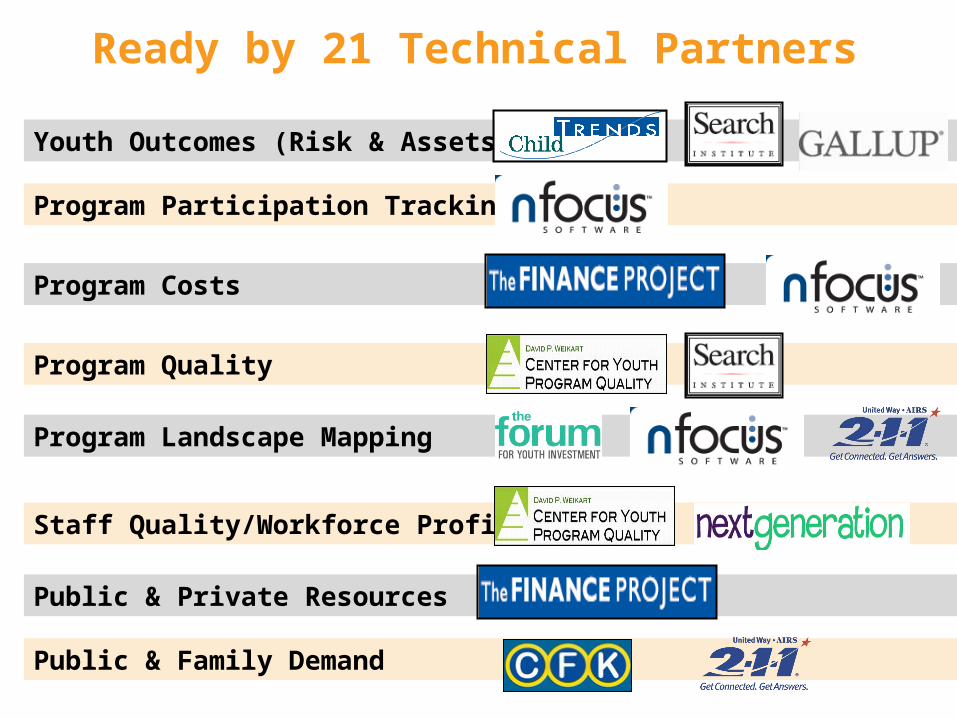
Ready by 21 Technical Partners
Youth Outcomes (Risk & Assets)
Program Participation Tracking
Program Costs
Program Quality
Program Landscape Mapping
Staff Quality/Workforce Profiles
Public & Private Resources
Public & Family Demand

National Companies
School Administrators
national multi-sector partners
Legislators
Community Catalysts
National non-profit youth development organizations
Children’s Cabinets, Youth Councils, child & youth constituents
Community Coalitions
Ready by 21 National Partners

Utilizing Community Organizations to Increase Student Success
Total Jefferson County Public Schools Youth Population
KidTrax Students tracked in OST
Program Benefits & Capabilities
• Increased Efficiency• Improved Data/Accuracy• Time saving for staff• Access to historical data• Improved collaboration
Results from Data Sharing Collaboration
• Increased school attendance• Reduction in Suspension behaviors• 9% reading improvement• Improved PAS Scores• Reduction in Tardy Behaviors• Increased family participation• Accurate attendance/participation numbers for OST programs
nFocus Software 2009 Copyright all rights reserved
KidTrax software solutions are developed by nFocus Software

Help leaders improve what they do, how they do it and rethink why they do it…
Enabling increases in the availability and quality of family, school and community supports needed to help children and youth…
Leading to positive outcomes and raising the probability that young people are ready for college, work and life by 21
What’s needed?
30
CHILDREN& YOUTH
FAMILY COMMUNITY& SCHOOLLEADERS
Accountability Supports Outcomes
© The Forum for Youth Investment. Ready by 21 and the Ready by 21 Logo are registered trademarks of the Forum for Youth Investment.
Change the oddsfor youth
Change the waywe do business
Change the landscapeof communities

Readyby21.orgGallup.orgForumfyi.org