identification of peptides - freie universität · identification of peptides (2) we will speak...
TRANSCRIPT

Identification of PeptidesReferences:
• Perkins et al.: Probability-based protein identification by searching sequencedatabases using mass spectrometry data, Electrophoresis, 1999, 20, 3551-3567
• MASCOT web page at www.matrixscience.com.
• R.G.Sadygov et al. Large Scale database searching using tandem mass spec-tra: Looking up the answer in the back of the book, Nature Methods,2004,1,3,pp195-202
• Bafna, Edwards: SCOPE, a probabilistic model for scoring tandem mass spec-tra against a peptide database, Bioinformatics, 2001, 17, 1, 13-21
10000

Identification of Peptides (2)
We will speak about two ways to identify (determine the sequence) of peptides usingmass spectrometry:
1. Peptide mass fingerprinting (PMF) in MS spectra
2. Peptide identification using MS/MS spectra (also called MS2)
In PMF the proteins are digested using an restriction enzyme like Trypsin. Thedigestion is so specific that it is often possible to identify the protein from the list ofMS feature masses alone. But this is clearly not feasible for complex mixtures.
In MS/MS a peptide is further fragmented using for example CID (collision induceddissociation). If we are lucky, the peptide breaks once after each amino acid, so wecan determine its sequence from the list of masses in the MS/MS spectrum.
10001

Identification of Peptides (3)
Although the data derived from PMF and MS/MS experiments has slightly differentcharacteristics, the general approach for using it is similar.
The experimental data are compared with calculated peptide mass or fragmention mass values, obtained by applying appropriate cleavage rules in the sequencedatabase. Corresponding mass values (and sometimes intensities) are counted orscored in a way that allows the peptide which matches the data best to be identified.
10002
Identification of Peptides (4)
Algorithmically there are two interesting problems:
1. How do we score the data against the theoretical spectrum and how significantis the score?
2. How do we quickly generate theoretical candidate spectra from large protein ortranscript databases?
We will give two different answers to the first question. First we describe theMOWSE score, used in the popular MASCOT package (www.matrixscience.com).
Furthermore, we will give a general description of MS/MS based identification andintroduce the SCOPE algorithm, developed at Celera Genomics (see reference 3).
10003

Peptide Mass Fingerprinting
The input is here a list of masses of the tryptic peptides. For example for humanalbumin the list of masses contains 49 masses:
2917.322 2593.242 2433.263 2404.170 2203.001 2045.095 1915.773
1853.910 1742.894 1623.787 1600.731 1511.842 1386.620 1384.535
1381.533 1342.634 1320.490 1311.741 1257.523 1191.574 1149.615
1024.455 1018.477 2917.322 2593.242 2433.263 2404.170 2203.001
2045.095 1915.773 1853.910 1742.894 1623.787 1600.731 1511.842
1386.620 1384.535 1381.533 1342.634 1320.490 1311.741 1257.523
1191.574 1149.615 1024.455 1018.477 2917.322 2593.242 2433.263
2404.170 2203.001 2045.095 1915.773 1853.910 1742.894 1623.787
1600.731 1511.842 1386.620 1384.535 1381.533 1342.634 1320.490
1311.741 1257.523 1191.574 1149.615 1024.455 1018.477 1017.536
1013.598 1013.424 1000.603 984.488 960.562 951.441 940.448
etc....
10004

Peptide Mass Fingerprinting (2)
Of course proteolysis is not always complete. Steric hindrance, the local contextof the cleavage site, or simply insufficient enzyme concentration might lead to oneor more miscleavages, that means two peptides that should be digested are stilltogether.
For example, if we allow for two miscleavages in the albumin example, the mass listcontains 204 masses.
How would MASCOT score the peaks list? It first computes a MOWSE score andthen the probability p that this MOWSE score was achieved by chance. Then theprobability p is converted into the MASCOT score as −10 log p. So the lower theprobability, the higher the MASCOT score.
10005

Peptide Mass Fingerprinting (3)
MOWSE compares the calculated peptide masses for each entry in the sequencedatabase with the set of experimental data. Each calculated value which falls withina given mass tolerance of an experimental value counts as a match.
Rather than just counting the number of matching peptides, MOWSE uses em-pirically determined factors to assign a statistical weight to each individual peptidematch. The matrix of weighting factors is calculated during the database build stage,as follows:
10006

Peptide Mass Fingerprinting (4)
A frequency factor matrix , F , is created, in which each row represents an intervalof 100 Da in peptide mass, and each column an interval of 10 kDa in intact proteinmass. As each sequence entry is processed, the appropriate matrix elements fi ,jare incremented so as to accumulate statistics on the size distribution of peptidemasses as a function of protein mass. The elements of F are then normalized bydividing the elements of each 10 kDa column by the largest value in that column togive the MOWSE factor matrix (i : peptide, j : protein)
M = (mi ,j) =
fi ,jmaxi fi ,j
10007

Peptide Mass Fingerprinting (5)
After scanning the experimental mass values against a calculated peptide massdatabase, the score for each database entry is calculated according to:
score =50000
Mprot∏
(i ,j)of match
mi ,j,
where Mprot is the molecular weight of the entry and the product term is calculatedfrom the MOWSE factor elements for each of the n matches between the exper-imental data and peptide masses calculated from the entry. Finally this score isturned into a probability as mentioned before, and its significance is computed.
Idea: Matches of peptide masses that occur more frequently for a protein of sizeMprot receive a higher weight.
10008

Scores in the green, shaded region are not significant (at a level of p = 5%).

Peptide Mass Fingerprinting (6)
As mentioned before, the measured stick spectrum is compared against the theo-retical spectrum derived from the sequence database.
Unfortunately is is usually not sufficient (both in PMF and MS/MS) only to con-sider the theoretical digest, even when considering miscleavages. What is generallyworse is that the amino acids can occur in modified form.
10009

Peptide Mass Fingerprinting (7)
There are the natural posttranslational modifications, such as phosphorylation andglycosylation. There are the accidental modifications which are artefacts of samplehandling, such as oxidation. Finally, there are the modifications deliberately intro-duced during sample work-up, such as cysteine derivatisation.
Hence, it is usually not known beforehand which modifications occur. MASCOTmodels two modifications, fixed and variable modifications.
10010

Peptide Mass Fingerprinting (8)
Fixed modifications come at no cost, since the molecular weight of an amino acidis just replaced by its modified weight.
Variable modifications are those which may or may not be present. MASCOT testsall possible arrangements of variable modifications to find the best match. For ex-ample, if Oxidation (M) is selected, and a peptide contains 3 methionines, Mascotwill test for a match with the experimental data for that peptide containing 0, 1, 2, or3 oxidised methionine residues. This greatly increases the complexity of a search,resulting in longer search times and reduced specificity, so variable modificationsshould be used sparingly. (There are hundreds of modifications known. A databaseof such modifications is Delta Mass).
10011

Peptide Mass Fingerprinting (9)
Finally, noise peaks coming from imperfect data processing and chemical noise(contaminants), make the identification difficult. The most common contaminantsare keratin (hair, skin, dandruff).
10012

MASCOT search form
Screenshot taken from http://www.matrixscience.com/
10013
Peptide identification from MS/MS spectra
Peptide Mass Fingerprinting (PMF) is a straightforward procedure. But it is clearlyunfeasible for complex mixtures. The workhorse for peptide sequencing is MS/MSbased identification.
MASCOT can also handle MS/MS spectra and contains an algorithm to identifypeptides from these spectra. But this algorithm is commercial and its details are notpublished.
We will therefore outline another algorithm, called Sequest , which is based on anacademic algorithm and present a scoring function of MS/MS identification, calledSCOPE.
10014

Tandem Mass Spectrometry
Recall again the structure of a peptide chain, consisting of different amino acids jointby peptide bonds. Amino-acids are distinguished from each other by the secondarystructure of the side chain R.
In tandem mass spectrometry (MS/MS) ionized peptides are fragmented bycollision-induced dissociation (CID). Fragments retaining the ionizing charge afterCID have their mass-to-charge ratio measured. Since peptides typically break apeptide-bond when they fragment by CID, the resulting spectrum contains informa-tion about the constituent amino-acids of the peptide.
10015

Ion types
The fragmentation of the peptide in CID is a stochastic process governed by thephysiochemical properties of the peptide and the energy of collision. The chargedfragment can be inferred by the position of the broken bond and the side retainingthe charge. In the figure below, the N-terminal a1, b1, c1 fragments, and the C-terminal xn−1, yn−1, and zn−1 fragments are shown.
(a)
(c)
(b)
y
z
b
c
x
a
C−terminus
N−terminus
C
R
CO2
2 C
R
COOHNH
C CO
R
NH C CO
R
NH C
R
COOH
NH C CO
R
NH C CO
R
NH C
R
COOH
2
H+
H+
NH
NH
1
n−1
n−1
1
1
n−1
10016

Ion types (2)
While a, b, x and y represent the commonly occurring fragments, a high energycollision often results in other fragments, including internal fragments formed bybreakage at two points, and fragments formed by breaks in side-chains.
source: www.matrixscience.com
The above pictures show the a, b, c, x , y , z ions as well as an internal ion.
10017

Ion types (3)
In high energy collision side chain cleavages can occur which helps distinguishingisomers like Leucin and Isoleucin. Another help can be the presence of immoniumions that represent a single amino acid (minus the loss of CO and the addition ofH).
In any case, the mass difference between ions of the same type is the same andcharacteristic for amino acid.
10018

MS/MS spectrum
Hence, if we measure the MS/MS spectrum of the peptide fragments and if we canidentify the correct ions, we can read off the respective amino acids.
Below is a cartoon MS/MS spectrum for the peptide IYEVEGMR. The b-ion ladderis shown in red and the y-ion ladder in blue. Distances between peaks can be usedto infer partial sequences of the peptide.
10019

MS/MS spectrum (2)
A MS/MS spectrum is usually already pre-processed by the software of the MSinstrument. We therefore deal only with peak data and not raw data.
We can read off the peptide sequence from the peak mass distances in the MS/MSspectrum. So we are done?
10020

MS/MS spectrum (3)
Not quite. Other possible fragments, the presence of multiply charged ions, theabsence of some ions in a series, and finally noise and measurement error pose areal challenge. So we have to resort to a different approach.
Quiz: If we know the molecular weight of the peptide generating the MS/MS spec-trum, we can dramatically reduce our search space. How could we estimate thisparent ion mass from the MS/MS spectrum?
10021

Overview of MS/MS-based identification Process
10022
Modules of MS/MS algorithms
Most algorithms for analyzing MS/MS data address the following three modules:
Interpretation: The input is an MS/MS spectrum, the output is interpreted-MS/MS-data. Interpreted-MS/MS-data may include parent peptide mass, partial orcomplete sequence tags, and combinations of sequence tags and molecularmasses.
Filtering: The input is interpreted-MS/MS-data and a peptide sequence database.The output is a list of candidate-peptides that might have generated the MS/MSspectrum.
Scoring: The input is a list of candidate-peptides and the MS/MS spectrum. Theoutput is a ranking of the candidate-peptides along with a score and possibly ap-value (probability that the score was achieved by random chance).
10023

A general MS/MS scoring schema
As an example, the first versions of the popular Sequest algorithm computed apreliminary score Sp :
Sp =
∑k
Ik
m(1 + β)(1 + ρ)/L
where the first term is the sum of the intensities of all matched peaks, m is thenumber of matches, β is a reward for each consecutive match of an ion series, ρ isa reward for the presence of an immonium ion and L is the number of all theoreticalions of an amino acid sequence.
Only spectra with a Sp score passing a threshold a further examined.
Quiz: What is the disadvantage of this score? (Think of mutations or posttransla-tional modifications...)
10024

A general MS/MS scoring schema
Spectra with a high Sp receive a second score, called XCorr . This is basically amodified version of the cross-correlation of the experimental MS/MS spectrum (E)and the theoretical spectrum (T):
Corrτ (E , T ) =N−1∑i=0
xiyi+τ
The autocorrelation is a measure of similarity and is computed for a range of shiftsτ .
10025

A general MS/MS scoring schema (2)
The XCorr score is dependent on peptide length and spectral quality. Newer ver-sions try to correct for these dependencies by dividing by the auto-correlation of theexperimental spectrum or similar measures.
Another important quantity reported by Sequest is the normalized difference ofXCorr values, δCn between the best scoring sequence and each of the other se-quences.
10026

SCOPE: Scoring of Tandem Mass Spectra
Sequest was developed at the University of Washington in Seattle, US. The algo-rithm was bought by Thermo Finnigan and Sequest is now widely used in the massspectrometry community.
It works well, but is known to produce many false-positive hits. For that reason,many scientists try to improve parts of this algorithm and to develop more sophisti-cated methods to compare MS/MS spectra.
We will introduce SCOPE , a scoring function for MS/MS spectra which was de-veloped by Vineet Bafna and Nathan Edwards at Celera Genomics (see reference3).
10027

SCOPE: Scoring of Tandem Mass Spectra
SCOPE is an scoring function (not a full algorithm) with several nice features. Wewill present its key concepts.
1. It models explicitly the fragmentation depending on the peptide and experimen-tal setting,
2. models explicitly the measurement error
3. and models noise peaks.
10028
SCOPE (2)
The SCOPE algorithm models the process of MS/MS spectrum generation by atwo-step stochastic process.
1. The first step involves generation of fragments from a peptide, according to aprobability distribution estimated from many training samples.
2. The second step involves the generation of a spectrum from the fragmentsaccording to the distribution of the instrument measurement error.
10029

Definitions
We need to introduce some terminology.
MS/MS Spectrum: A MS/MS spectrum S ∈ Rk+ is a vector of positive real numbers
specifying the k observed mass-charge ratios of the spectral peaks.
Peptide: A peptide p ∈ An is a sequence of n amino-acid residues over the alpha-bet of amino-acid symbols, A = {A, C, ..., Y}.
Fragment Space: An enumeration F (p) of all fragment mass-charge ratios that apeptide p might produce. Each element of F (p), then, is a fragment-chargestate pair. Thus,
F (p) = {(a1, i), (b1, i), (y1, i), ... ,
(an, i), (bn, i), (yn, i), i = 1, 2, 3, ...}
Denote the mass-charge ratio of a fragment f ∈ F (p) by (m/z)(f ).
10030

Definitions (2)
Fragmentation Space: The fragmentation space φ(p) of a peptide p is the set ofall fragmentation patterns of p. That is,
φ(p) = {F : F ⊆ F (p)}
Noise: We consider any peak of S for which F (p) provides no explanation to be anoise peak.
10031

Two step process
Measurement: Each fragment with a particular mass-charge ratio generates amass-charge ratio observation close to, but not precisely at its true mass-charge ratio. The observation of many fragments with the same mass-chargeratio leads to the formation of a distinctive peak close to the true mass-chargeratio of these fragments.
The observed peak can then by represented by a single real number, an es-timate of the true mass-charge ratio of the fragments that generated it. Thedeviation of this mass-charge ratio of a peak from its true value is modeledaccording to a probability distribution, typically the normal distribution.
10032

Scoring spectra
Let ψ(S | p) denote the probability density function for the random vector S rep-resenting the MS/MS spectrum, given peptide p. Typically, we are searching adatabase for the peptide p∗ that satisfies
p∗ = arg maxpψ(S | p)
10033

Scoring spectra
A formal description of the two-step model of fragmentation followed by measure-ment is given by:
ψ(S | p) =∑
F⊆F (p)ψ(S | F , p) Pr(F | p)
The quantity Pr(F | p) represents the probability of a particular fragmentation pat-tern of a peptide. It is in the computation of Pr(F | p) that the complex process offragmentation can be modeled.
10034

Fragmentation probability estimation
The SCOPE algorithm does not explicitly implement an automatic algorithm to esti-mate the probabilities Pr (F | p) but relies on the judgment of the user.
For example, experienced operators know that the presence of acidic amino-acidsin a peptide makes the neutral water loss ion type cleavages much more likely.
In general those probabilities could also be learned from sample spectra of knownpeptides given a specific experimental setup.
“... we have chosen probabilities in consultation with experienced mass spectrome-ter operators.” (V. Bafna and N. Edwards, inventors of SCOPE)
10035

Computing ψ(S | F , p)
The probability density ψ(S | F , p) describes the probability of observing a collectionof spectral peaks, given a particular fragmentation pattern of a peptide p.
Unfortunately, it is not at all obvious which fragment(s) are responsible for whichpeak(s), and which peaks should be considered noise. In order to computeψ(S | F , p), we need to either sum over all the possible explanations of each peak(which is not feasible) or use our understanding of the mass spectrometer to limitthe number of terms.
10036

Computing ψ(S | F , p) (2)
We assume the following:
1. Each unique mass-charge ratio in the fragment space generates at most onespectral peak.
2. Each spectral peak is the observed mass-charge ratio of at most one of the(unique) mass-charge ratios in the fragment space.
3. The assignment of spectral peaks to fragments must be non-crossing. For allfragments f1, f2 and spectral peaks S1, S2, if (m/z)(f1) < (m/z)(f2) and S1 <
S2, then peak S1 must have been generated by fragment f1 and peak S2 musthave been generated by fragment f2.
10037

Computing ψ(S | F , p) (3)
In addition, we augment the fragment spaceF (p) with noise fragments, one for eachspectral peak. Each noise fragment has the same mass-charge ratio as its spectralpeak. We denote this augmented fragment space F ′(p) and the correspondingfragmentation space φ′(p).
Due to the addition of noise fragments all spectral peaks must either be assignedto a unique fragment from our original fragment space F (p) or to a noise fragment.Therefore we can make the following observation:
Only fragmentation patterns F ⊆ F ′(p) with |F | = k have non-zero probability.
10038
Computing ψ(S | F , p) (4)
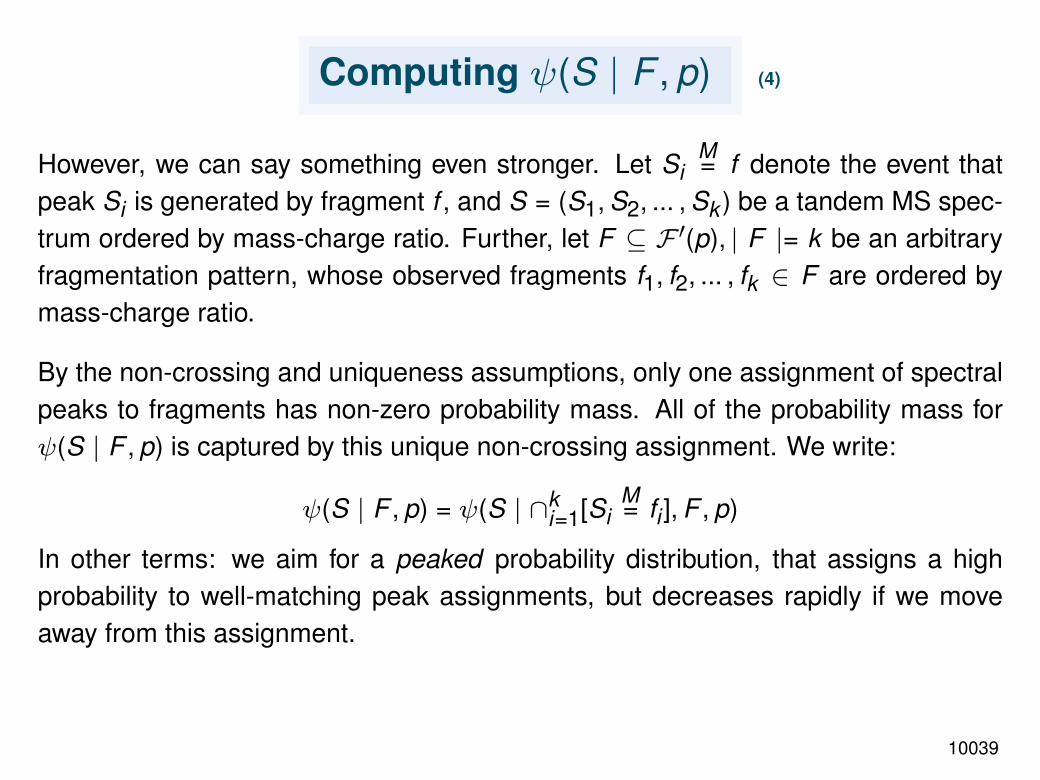
However, we can say something even stronger. Let SiM= f denote the event that
peak Si is generated by fragment f , and S = (S1, S2, ... , Sk ) be a tandem MS spec-trum ordered by mass-charge ratio. Further, let F ⊆ F ′(p), | F |= k be an arbitraryfragmentation pattern, whose observed fragments f1, f2, ... , fk ∈ F are ordered bymass-charge ratio.
By the non-crossing and uniqueness assumptions, only one assignment of spectralpeaks to fragments has non-zero probability mass. All of the probability mass forψ(S | F , p) is captured by this unique non-crossing assignment. We write:
ψ(S | F , p) = ψ(S | ∩ki=1[Si
M= fi ], F , p)
In other terms: we aim for a peaked probability distribution, that assigns a highprobability to well-matching peak assignments, but decreases rapidly if we moveaway from this assignment.
10039

Computing ψ(S | F , p) (5)
In isolation, the distribution of one measured mass-charge ratio about its true valueis independent of any other measured mass-charge ratio about its true value. Wemodel the distribution of the measured mass-charge ratios as normal distributionscentered at the fragment mass-charge ratio and the distribution of the measuredmass-charge ratio of noise fragments by an impulse function at the mass-chargeratio of its spectral peak.
10040

Computing ψ(S | F , p) (6)
We expand ψ(S | ∩ki=1[Si
M= fi ], F , p) into its components in order to compute it.
ψ(S | ∩ki=1[Si
M= fi ], F , p)
= ψ(S1 | ∩ki=1[Si
M= fi ], F , p)×
Πkj=2ψ(Sj | S1, ... , Sj−1,∩k
i=1[SiM= fi ], F , p)
= ψ(S1 | [S1M= f1], F , p)×
Πkj=2ψ(Sj | Sj−1, [Sj
M= fj ], F , p).
In the last term Sj is only dependent on the previous Si for i < j .
10041
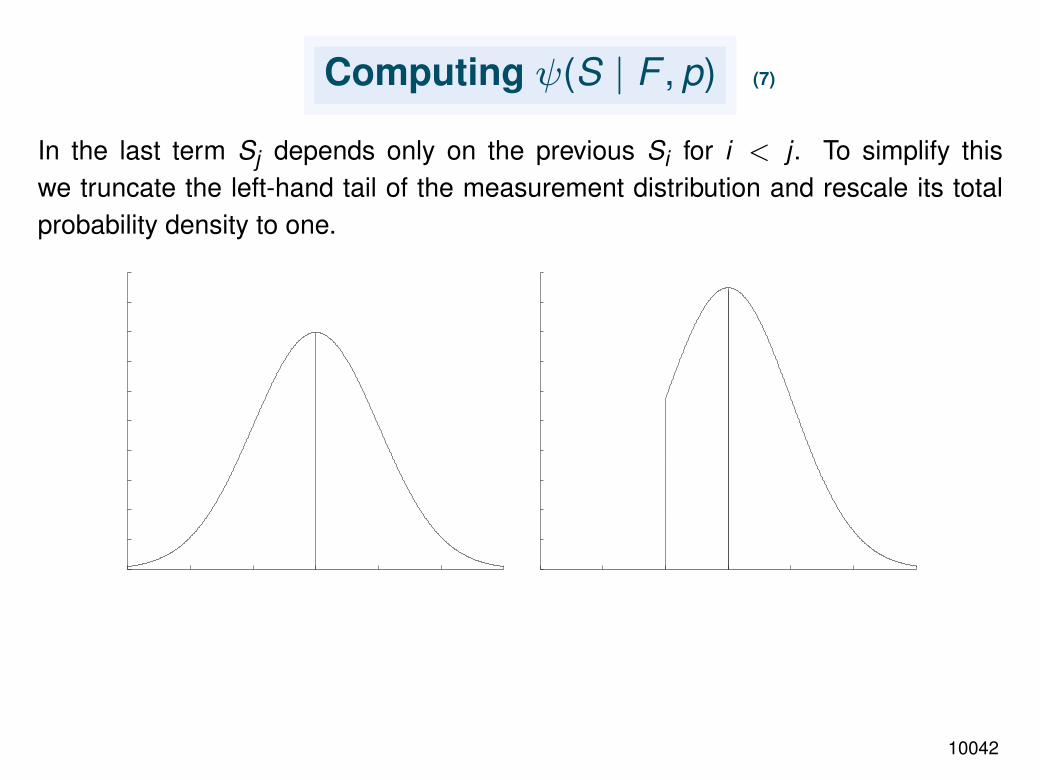
Computing ψ(S | F , p) (7)
In the last term Sj depends only on the previous Si for i < j . To simplify thiswe truncate the left-hand tail of the measurement distribution and rescale its totalprobability density to one.
10042
Computing ψ(S | F , p) (8)
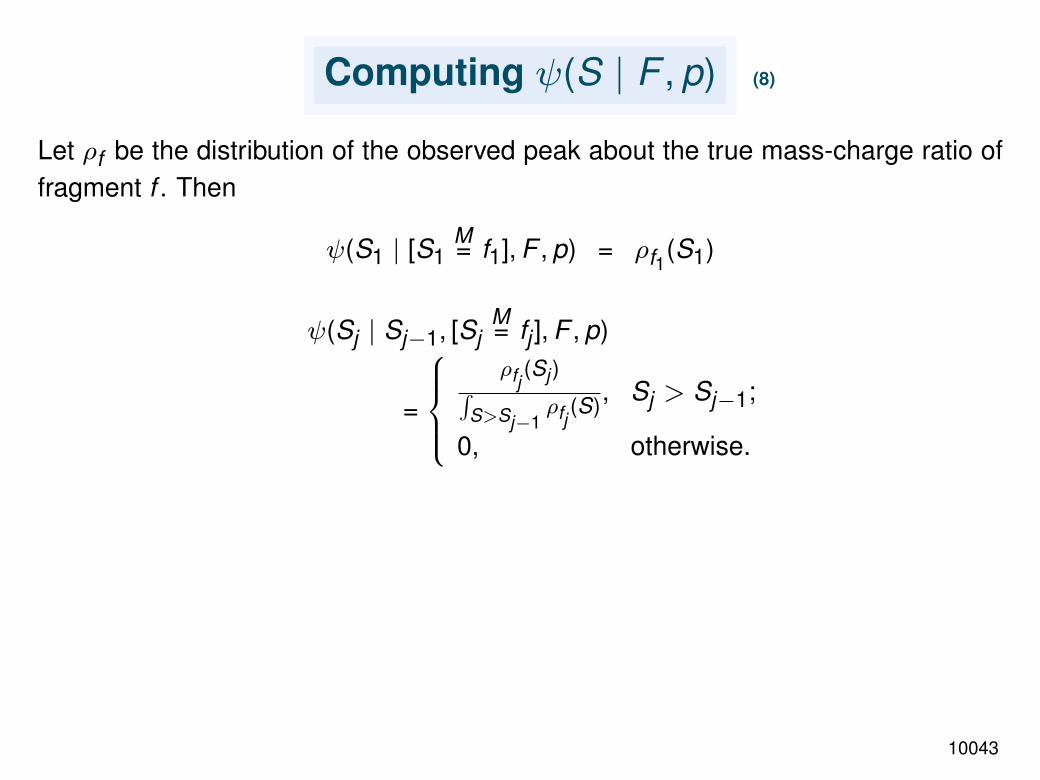
Let ρf be the distribution of the observed peak about the true mass-charge ratio offragment f . Then
ψ(S1 | [S1M= f1], F , p) = ρf1(S1)
ψ(Sj | Sj−1, [SjM= fj ], F , p)
=
ρfj
(Sj )∫S>Sj−1
ρfj(S), Sj > Sj−1;
0, otherwise.
10043

Computing ψ(S | p)
We now show how this choice of ψ allows an efficient algorithm for computing ψ(S |p).
We want to avoid the computation of an exponential number of terms in the ex-pression ψ(S | p) =
∑F⊆F (p)ψ(S | F , p) Pr(F | p). To do this we need another
assumption, namely that the probability of observing f must be independent of theobservation of other fragments. This is not always true but allows us to computeψ(S | p) efficiently by dynamic programming.
Given the spectrum S = (S1, ... , Sk ) and the fragments F ′(p) = {f1, ... , fm} orderedby mass-charge ratio, we define F ′j (p) = {f1, ... , fj} to be the first j fragments ofF ′(p).
10044

Computing ψ(S | p) (2)
The dynamic programming recurrence function Φ(i , j) represents the probabilitymass associated with the event that the first i peaks were generated by i fragmentsfrom the first j fragments of F ′(p). Clearly, Φ(k , m) = ψ(S | p) is the value we areinterested in. The following recurrence holds:
Φ(i , j) =
1, if i = 0,
0, if i > j ,
Φ(i − 1, j − 1)
× ψ(Si | Si−1, SiM= fj)
× Pr(fj | p)+ Φ(i , j − 1) Pr(fj | p), otherwise.
10045

Computing ψ(S | p) (3)
The above recursion corresponds to a special sequence alignment problem. Wealign the spectrum with all possible fragments in the augmented fragment space.
The first term in the sum is for the case that the j-th fragment is assigned to aspectral peak. The probability of that is the probability of assigning the first i − 1spectral peaks to i − 1 fragments among the first j − 1 fragments [Φ(i − 1, j − 1)]
times the probability that Si is assigned fj [ψ(Si | Si−1, SiM= fj)] times the probability
of fj given p [Pr(fj | p)].
The second term in the sum describes the probability that fj is not assigned to anypeak in S. This might be large if we do not expect a fragment to occur!
10046
Computing ψ(S | p) (4)
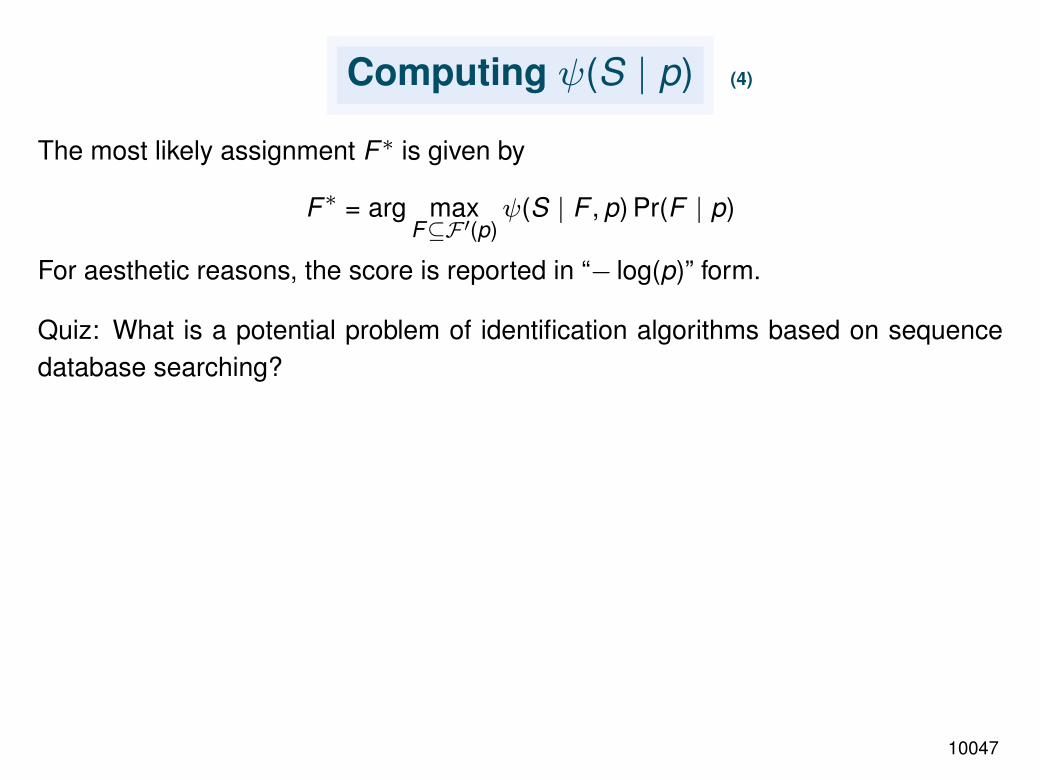
The most likely assignment F∗ is given by
F∗ = arg maxF⊆F ′(p)
ψ(S | F , p) Pr(F | p)
For aesthetic reasons, the score is reported in “− log(p)” form.
Quiz: What is a potential problem of identification algorithms based on sequencedatabase searching?
10047

SCOPE: conclusions (5)
SCOPE has some interesting features (e.g. model of fragmentation process andmeasurement error), but it is mainly a theoretical concept and has not directly beenused.
However, there are some algorithms such as InSpect or OLAV, which implementmodified versions.
Even with sophisticated scoring functions such as SCOPE, most algorithms areknown to produce large numbers of false positives and are unable to identify moredifficult spectra (with e.g. low mass resolution, mutated peptides, post-translationalmodifications).
10048
Summary
We covered:
• Peptide identification using Peptide Mass Fingerprinting (PMF) and TandemMass Spectrometry (MS/MS)
• A popular algorithm for PMF (MOWSE) and a scoring function for MS/MS(SCOPE).
• We did not cover: other MS/MS algorithms (X!Tandem, OMSSA), hybrid ap-proaches (InSpect) and de-novo sequencing using MS/MS (PepNovo, Lutefisk).
• Many more questions: How to get from peptide sequence to protein sequence?How to estimate error rates for identifications? etc.
10049