identification of best performing dairy farms in the
TRANSCRIPT

Identification of best performing dairy farms in the Netherlands
Co Daatselaar (Wageningen Economic Research)
Jan den Hartogh (Van Hall Larenstein, University of applied sciences)
Alfons Beldman (Wageningen Economic Research)
Molly Chen (Van Hall Larenstein, University of applied sciences)
December 2018

1. Introduction ‘Identifying competitive dairy farms in the Netherlands’ is the name of the cooperation between lector
Molly Chen (Van Hall Larenstein (VHL), University of applied sciences) and Wageningen Economic
Research. One of the goals of this cooperation was to identify the best performing dairy farms (for
different farm types) for the Netherlands and to identify the related best management practices. Several
studies conclude that differences in results between dairy farms are large (Agrimatie (2018), Dolman et
al. (2014)). The Dutch FADN database of specialised dairy farms was used for this research.
2. Steps in the research: 1. Provision of a database for the research.
2. Data processing and investigation on outliers
3. Defining methodology to assess best performing farms.
a. Choice of indicators
b. Methodology to rank
4. Defining systems/farm types to be analysed.
5. Identifying best performing farms within each farm type.
6. Identifying best practices behind best performing farms (by interviews).
A database for the years 2011-2016 was placed in a protected environment (Microlab).
Data processing and investigation on outliers Indicators were calculated from the data in the database: the calculations were recorded in code by
means of the statistical package SPSS (version 25) (called ‘syntax’ within SPSS).
The data have to be checked on outliers. There are several ways to determine extreme values.
Histograms and boxplots are useful graphical tools whereas statistics like skewness, kurtosis, mean,
standard deviation and 5 highest/5 lowest values also provide insight to conclude if a value is extreme or
not. But, unless all these helpful information, it is the researcher who finally decides which cases have to
be removed from a dataset because of one or more extreme values.
Considering the dataset for this research we viewed the so called longlist indicators (see below) for the
2,204 available cases over the years 2011-2016. With graphs and statistics as mentioned above we
removed cases which came under one or more of the following conditions:
- Percentage replacement of dairy cows in a single year > 200;
- Percentage calf mortality > 50;
- Grazing hours of dairy cows per year > 6,000;
- MJ energy produced on the farm > 15,000,000;
- Nitrogen surplus in kg per ha > 500;
- Nitrogen surplus in kg per ha < -200;
- Kg milk production per dairy cow per year < 3500;
- Share of income from farm activities outside dairy > 40%;
- Percentage of produced milk delivered to a dairy processor < 50.
Implementation of these conditions reduced the number of cases to 2,131. Some of these remaining
2,131 cases had missing values on some of the shortlist indicators (see the shortlist in a next section):
these missing values got a value by the use of the Multiple imputation-procedure in the SPSS-package.
It can be discussed if missing values should be imputed. The missing value could differ a lot from the
real, but missing, value. However leaving out cases with missing values decreases the number of cases,
resulting in less powerful tests and outcomes. Moreover leaving out cases with missing values can induce
biases if those cases are not missing completely at random. If values are missing at random (MAR) or
completely at random (MCAR) then multiple imputation is recommended to generate values for the
missing ones (Donders et al, 2006; Baraldi and Enders, 2009; Sainani, 2015; Papageorgiou et al, 2018).
Missing values in this study have a special meaning: besides the regular position in statistics (like means
or tests) they also will play a role in the individual scoring of the farms at stake. An imputed value can
change the total score of a farm and hence the ranking of that farm but leaving out that farm with one or

more imputed values, at its turn, changes the ranking of other farms. All things considered we have
decided to apply multiple imputation for missing values.
Methodology to assess best performing farms Choice of indicators Point of departure for the choice of indicators was the triple P-approach, so looking for indicators for
People, Planet and Profit. Based on literature (Van Calker, 2008; Meul et al, 2008; Lebacq et al, 2014)
and own experience in several projects a so-called longlist of sustainability indicators on People, Planet
and Profit was drawn up. The longlist could contain indicators which were not available in the Dutch
FADN: the available ones are marked bold in the lists below. Basically the indicators were expressed in
values per year. Within the People indicators there was a distinguish between ‘external’ (more directly
related to society, more involvement of society) and ‘internal’ (mostly dealing with the farm and the farm
workers themselves). The longlist consisted of the following indicators (with in italics some motivation for
using the indicator in the shortlist or not):
Indicators People external
- Number of shelter and feeding places per cow: data not available in Dutch FADN
- Stable awarded as sustainable according to the MDV (‘Maatlat Duurzame Veehouderij’) aspects: data
not available in Dutch FADN;
- Application measurement/policy (e.g. vaccination) to prevent cattle diseases: data not available in
Dutch FADN;
- Somatic cell count (SCC): this indicator gives a signal about udder health but it cannot be
considered as a characteristic for the overall animal health;
- Antibiotics ADD (ADD = Average Daily Dose of antibiotics per animal): no or low use of antibiotics
is often a sign of good animal health, improves milk quality and increases food safety (less
antibiotics in food decreases risks on resistance of bacteria against antibiotics);
- Declared free for common diseases like salmonellosis, Bovine virus diarrhoea and Para tuberculosis:
data not available in Dutch FADN;
- Longevity (expressed as the average age at which cows are culled): data not available in Dutch
FADN;
- Replacement rate dairy cows: by the absence of the indicator longevity, the replacement rate is
an alternative to display animal care. A low rate is considered sustainable because it indicates that
the farmer takes good care of the cattle. For the public opinion it is important that dairy cows live
longer and have a healthy life;
- Percentage calf mortality: society cares about young animals, more than about full-grown ones so
low or no calf mortality is highly desired;
- Hours grazing by cows per year: citizens consider grazing as natural behaviour of cows and value
it as an aspect of animal welfare. The public opinion on dairy farming is improved when cows are
grazing;
- Costs for pesticides: calculated per hectare or per kg milk. Generally use of pesticides is rather
low in dairy farming compared to arable farming which results in lower importance of this indicator;
- Use of fertilisers: calculated per hectare or per kg milk. Generally people only distinguish between
use or no use of chemical fertilisers, the latter being quite synonymous to organic farming or not;
- Subsidy for nature conservation: a high score increases the score for People. This indicator can
express biodiversity but it only displays the compensation for nature conservation, not the results.
Therefore it was decided to follow the current methodology of the (Dutch) Sustainable Dairy Chain
(DZK) (Doornewaard et al, 2017);
- Score for biodiversity (according to DZK): according to DZK this is currently the best available
methodology to measure biodiversity. Biodiversity is a complex characteristic to measure and DZK is
working on new methods to improve the measurement of biodiversity;
- Number of days hosting information to non-farmers: data not available in Dutch FADN;
- Score for fitting the farm in the environment (score to be defined): data not available in Dutch
FADN;
Indicators People internal
- Number of households: traditional dairy farming mostly had one entrepreneur with one family
depending on the farm income, so in this theory more households mean more families depending on

the farm income. Nowadays things are more complex with family members working outside the farm
or one household with more entrepreneurs. This makes this indicator fuzzier;
- Successor: In the literature (Lebacq et al, 2014) this indicator is often used to display the future
perspective of the farm (succession expresses continuity perspective). But for entrepreneur(s) at an
age below about 50 years it is often unknown if there will be a successor; sometimes they just took
over the farm from their ancestors recently.
- Net worth farm in euros: this could be seen as the retirement fund for the entrepreneur. However
the (larger part of) net worth often remains in the farm rather than being used by the leaving
entrepreneur.
- Quality work environments: data not available in Dutch FADN;
- Lost time because of incidents: data not available in Dutch FADN;
- Number of hours grazing young cattle: data not available in Dutch FADN;
- Skin damage young cattle: data not available in Dutch FADN;
- Welfare quality lameness: data not available in Dutch FADN;
- Percentage cows finally pregnant by insemination: data not available in Dutch FADN;
- Flexibility in labour, number of people prepared and willing to help the farmer: data not available in
Dutch FADN;
- Use of Automatic Milking System (AMS): use of AMS could mean less physical labour and
provide more flexibility in the daily routines;
- Hours labour per unpaid Annual Work Unit (AWU); This characteristic is considered to be
important for sustainability because it expresses the work pressure of farm labour and the often
occurring physical load. A low time per unpaid annual work unit means less pressure and often more
flexibility and more private time.
Indicators Planet
- Kg CO2-equivalents per kg milk: greenhouse gas emissions are considered as a main cause of
climate change which has a high impact on the quality of life at the planet. Some stakeholders are
even pressing for reduction of the dairy industry because of its share in the global warming process.
- Primary energy use in MJ per kg milk (according to DZK): the primary energy consists of
energy, directly or indirectly originating from fossil fuels. It also contains an approximation of the
energy in the fuel used by contractors. Energy produced on the farm and sold is not subtracted: such
a subtraction would veil fossil fuel depletion;
- MJ fuel used per kg milk: this indicator displays only a part of the energy consumption (fuel).
Moreover farms with much use of contractors will have a lower consumption which makes use of
this indicator difficult;
- MJ energy sold: this indicator only displays the produced energy and does not include energy use
on the farm;
- Kg methane emission per cow: methane is the most important greenhouse gas in the dairy
industry but it is already covered by the kg CO2 equivalents per kg milk. It is mainly a further
specification within greenhouse gas emissions;
- Kg ammonia emission from barn and storage per Livestock Unit (LU): ammonia is harmful
for the environment as it causes acidification. Emission from barn and storage is expressed per
animal to avoid effects of stocking rate;
- Kg ammonia emission from grazing and manure application per ha: emission from grazing
and manure application is expressed per ha: the linkage with stocking rate is small or even not
present;
- Nitrogen excretion in g per kg milk: this indicator highly correlates with the phosphorus
excretion in g per kg milk: the latter indicator is preferred because nitrogen is already, although
partly, mentioned by ammonia emission;
- Phosphorus excretion in g per kg milk: phosphorus stocks in the world are limited so for
sustainable dairy farming now and in the future it is important to use phosphorus efficiently;
- Nitrogen efficiency cattle (output milk and meat as a percentage of input feed): In
literature (Meul et al, 2008; Lebacq et al, 2014) this indicator is named but this indicator is not
complete enough, nitrogen efficiency of cattle cannot be directly linked to sustainability because
there are more factors like the origin of nitrogen in the feed production. This indicator shows a
strong correlation with the nitrogen surplus in kg per ha;
- Phosphorus efficiency cattle: this indicator shows a strong correlation with Phosphorus excretion
in g per kg milk;.

- Nitrogen efficiency soil (yield in harvested crop as a percentage of applied fertiliser): this
indicator shows a strong correlation with Nitrogen surplus in kg per ha;
- Phosphorus efficiency soil: this indicator shows a strong correlation with Phosphorus excretion in
g per kg milk;
- Nitrogen surplus in kg per ha (excluding N-fixation by leguminosae, extra mineralisation
on peat soils, deposition and N-volatilisation): nitrogen is considered more damaging to the
environment than phosphorus in relation to eutrophication;
- Percentage home grown feed in cows’ ration: data not available in FADN;
- Percentage soil organic matter: this indicator has a large variation. Only low percentages organic
matter tell something about poor soil management. The high percentages soil organic matter are
mainly found on peat soils;
- Special efforts for biodiversity: number of ha grassland or fallow land with extensive management:
data not available in FADN;
- Number of ha with bird and/or nature management related use: data not available in FADN;
- Premium per 100 kg milk, received from dairy processor thanks to sustainability: data not available
in FADN;
- Animal diversity (number of dairy cow breeds): data not available in FADN;
- Water use per cow: water use is not a major issue in the Netherlands because of the large
accessibility to water. In a global context this will often be a short list indicator. Drinking and
cleaning water from own well is not available in the FADN whereas irrigation water and tap water are
registered;
- Water footprint; data not available in FADN;
- Waste of meat: number of (dead) livestock units rejected for meat consumption: data not available
in FADN.
Indicators Profit
- Price calves, sold for breeding: data not available in FADN;
- Feed costs per 100 kg milk: generally feed costs are the most important costs in dairy farming.
However for the cost calculation of home grown feed many assumptions have to be made, for
instance on costs for machinery and labour;
- Costs for dairy cattle health per 100 kg milk: this indicator only covers a smaller part of the
total cost;
- Costs for manure processing per 100 kg milk: these costs are only a smaller part of the total
cost structure in Dutch dairy farming and have a skew distribution;
- Costs for purchased roughage per cow: this indicator is strongly related to the stock density on
the farm which causes a skew distribution;
- Costs purchased feed excluding roughage per 100 kg milk: this characteristic displays the cost
structure of the feed cost (excluding roughage) and does not correlate with stock density;
- Variable costs per 100 kg milk or per cow: this indicator shows the variable part of the costs but
correlates with the stock density;
- Critical milk price (assesses liquidity): this is a useful tool to measure liquidity. However it only
considers paid costs plus depreciation and not receipts. A farm can have high costs and still achieve
a good result because of high receipts;
- Margin milk price minus critical milk price: this indicator both includes receipts and costs. Only
unpaid costs for labour and interest are left out but these costs depend more on assumptions than
other costs;
- Cost price of milk (assesses costs): although this number gives more insight in the total costs on
the dairy farm, it is not used in the shortlist because of less knowledge among farmers about this
indicator;
- Net farm income per hour: this indicator strongly correlates with the indicator margin milk price
minus critical milk price;
- Net farm income per AWU: also this indicator has a high correlation with the indicator margin milk
price minus critical milk price;
- Net farm income per farm: this characteristic correlates with the size of the farm;
- Profitability per ha: this indicator correlates strongly with Margin milk price minus critical milk
price. The intensive farms (more cows/milk per hectare) will have more extreme results;
- Return on investment: also this indicator correlates strongly with Margin milk price minus critical
milk price. There is also some dependency on the method the assets are valued;

- Long term debts per kg milk: this characteristic displays well how the farm is financed without
effects of the valuation method of assets;
- Solvency: this indicator has a strong correlation with long term debts per kg milk and highly
depends on the valuation method of the assets;
- Modernity (bookkeeping value as percentage of replacement value): this indicator directly
displays whether there will be urgency for considerable investments in the short run or not;
- Kg milk per hour labour: this indicator displays the efficiency of labour input at the dairy farm in
relation to milk production. However effects like the use of AMS and the amount of work, done by
contractors, affect this indicator;
- Financially resilient (to be defined): data not available in FADN;
- Diversification in revenues: share of farmer’s revenues that does not only depend on the dairy
activities on the farm. This displays something about the dispersion of risk;
- Ratio rental land versus owned land: this indicator focusses more on resilience than on good
performance;
- Percentage first class milk delivered: data not available in FADN.
The above longlist of indicators was individually scored by Molly Chen (lector VHL), Co Daatselaar
(WEcR), Alfons Beldman (WEcR) and Jan den Hartogh (trainee VHL)
The instructions for scoring were as follows:
- Give the best indicator within each of the three P’s score 1, second best score 2 etc. If you think the
indicator has no priority, then give no score
- Score the indicators which are relevant in your opinion; for communication purposes a shorter list is
better than a long list.
The results of the score were discussed and resulted in a shortlist, not taking into account the availability
of the indicators.
People
- Antibiotics ADD (ADD = Average Daily Dose)
- Longevity
- Hours grazing by cows per year
- Subsidy nature conservation: a high score increases the score for People
- Hours labour per unpaid Annual Work Unit (AWU)
- Job satisfaction
Indicators Planet
- Kg CO2-equivalents per kg milk
- Primary energy use in MJ per kg milk
- Kg ammonia emission per Livestock Unit (LU)
- Phosphorus excretion in g per kg milk
- Number of ha with bird and/or nature management related use
Indicators Profit
- Feed costs per 100 kg milk
- Margin milk price minus critical milk price
- Return on investment
- Long term debts per kg milk
- Modernity (bookkeeping value as percentage of replacement value)
However, as already said, only the indicators shown in bold are available in the provided database so the
researchers did the ranking again (kind of second rating) for only the available indicators. Moreover they
reviewed the indicators on mutual correlations (if two or more variables had too high (absolute) mutual
correlations, one was chosen and the other(s) was/were removed from the shortlist). That resulted in the
following shortlist:
People

- Antibiotics ADD (ADD = Average Daily Dose)
- Hours grazing by cows per year
- Percentage replacement dairy cows
- Percentage calf mortality
- Score for biodiversity (according to DZK)
- Hours labour per unpaid Annual Work Unit (AWU)
Indicators Planet
- Kg CO2-equivalents per kg milk
- Primary energy use in MJ per kg milk (according DZK)
- Kg ammonia emission from barn and storage per Livestock Unit (LU) (50%) + Kg
ammonia emission from grazing and manure application per ha (50%)
- Phosphorus excretion in g per kg milk
- Nitrogen surplus in kg per ha (excluding N-fixation by leguminosae, extra mineralisation
on peat soils, deposition and N-volatilisation)
Indicators Profit
- Margin milk price minus critical milk price
- Costs purchased feed excluding roughage per 100 kg milk
- Long term debts per kg milk
- Modernity (bookkeeping value as percentage of replacement value)
Methodology to rank Preceding to the ranking of cases missing values for shortlist indicators were replaced by imputed values.
Imputed values were calculated with the use of correlating variables that had no missing values. An
example is ‘Antibiotics ADD’: correlating variables are milk production per cow and costs for animal
health per kg milk.
The remaining cases in the dataset were scored on their ranking for each of the indicators in the
shortlist. For an indicator like ‘Modernity’ the calculation is as follows:
(Value farm – minimum value in the group) / (maximum value in the group - minimum value in
the group)
where minimum value in the group must be within average value in the group – 3 times the
standard deviation of the values in the group (otherwise minimum value in the group = average
value in the group – 3 times the standard deviation of the values in the group)
and where maximum value in the group must be within average value in the group + 3 times the
standard deviation of the values in the group (otherwise maximum value in the group = average
value in the group + 3 times the standard deviation of the values in the group)
For an indicator like ‘Antibiotics ADD’ the formula is as follows:
(Value farm – maximum value in the group) / (minimum value in the group - maximum value in
the group)
with the same restrictions on the minimum and maximum values.
So every case got a score between 0 and 1 on the indicators. This method of score calculation is
preferred above use of standardised values. The used method always gives the same range (from 0 to 1)
for the score whereas this range can vary when using standardised values.
Summing up these individual rankings gave a total score to determine the best performing farms. The
procedure was as follows:
- Each group of indicators (People, Planet, Profit) counts for one third;
- Within a group of indicators, each indicator gets the same weight;

Because 6 People indicators, 5 Planet indicators and 4 Profit indicators were chosen, each People
indicator counted for one eighteenth, each Planet indicator for one fifteenth and each Profit indicator for
one twelfth. The two indicators on ammonia emission, being among the Planet indicators, each counted
for one thirtieth. This is shown in figure 2.1.
Figure 2.1 Share (or weight) of the 16 shortlist indicators in the total score
Systems/farm types to be analysed It can happen that best performance correlates with a farm system or a farm type. An example is the big
difference in milk price between organic and non-organic milk in the years 2015 and 2016 which causes
very good scores for organic farms on the Margin milk price minus critical milk price: that, in turn,
influences the scores on Profit and subsequently on total sustainability. The following systems or farm
types were distinguished, partly based on a former research for the Sustainable Dairy Chain (DZK) (basis
was the Dutch Agricultural Census of the year 2015):
- Organic dairy farms;
- Other dairy farms with less than 70 dairy cows;
- Other dairy farms with 70 till 125 dairy cows and between 1 and 2 dairy cows per hectare forage
crops (including grassland);
- Other dairy farms with more than 125 dairy cows and more than 2 dairy cows per hectare forage
crops (including grassland).
These four groups covered about 75% of the dairy farms and about 70% of the national milk production.
Identification of the best performing farms within each farm type In the ranking procedure it is possible that a farm compensates a very unfavourable score on one
indicator with many favourable scores on other indicators and, in this way, becomes one of the best
performing farms. We consider this possibility (‘heavy compensation’) as undesirable. Therefore we used
minimum and/or maximum values on some indicators. If a farm is outside those values for one or more
indicators, then it will remain in the dataset but it cannot become a best performing farm. An example is
the number of working hours per person per year: if a farm scores above, for example, 3600 on this
indicator then it will not be part of the group best performing farms because in the long run it is not
considered healthy and sustainable to work so many hours per person per year.

Farms were considered as not best performing if they exceeded one or more of the following minimum
and/or maximum values on indicators:
- Percentage replacement dairy cows > 40; 4 cases
- Percentage calf mortality > 25; 14 cases
- From the year 2012 onwards: Antibiotics ADD > 6; 3 cases
- Hours labour per unpaid Annual Work Unit (AWU) > 3600; 0 cases
- Modernity < 20; 9 cases (basically 44 cases but 35 cases achieved a Margin milk price minus critical
milk price in the highest quartile for this indicator. With a good margin enough money will be
available for fast upcoming investments)
- Margin milk price minus critical milk price is in the lowest quartile for this indicator; 33 cases
In total 63 cases would not be considered as best performing anymore but in 7 cases it concerned two
exceedings per farm. So over the 2,131 cases 56 of the best performing cases (at first sight) were
classified as no longer best performing and replaced by 56 according next best performers.
Per year per group the best performing farms were determined so in total 6 years times 4 groups/year =
24 best performing groups. To ensure minimal 10 farms per group the following shares were determined
as best performing:
- Organic dairy farms: one third (33%) with the highest total score;
- Other dairy farms with less than 70 dairy cows: one quarter (25%) with the highest total score;
- Other dairy farms with 70 till 125 dairy cows and between 1 and 2 dairy cows per hectare forage
crops (including grassland): one quarter (25%) with the highest total score;
- Other dairy farms with more than 125 dairy cows and more than 2 dairy cows per hectare forage
crops (including grassland): one quarter (25%) with the highest total score.
T-tests were applied to determine if the best performing farms performed significantly better or worse on
individual indicators compared to the other farms in the same group.
3. Results The results of the best performing farms within a group and of the other farms are expressed in
percentages according to the following formulas. For an indicator like ‘Modernity’ the calculation is as
follows:
100 * (Average best performing farms in the group – average of the group) / (90%-percentile of
the group - 10%-percentile of the group)
100 * (Average other farms in the group – average of the group) / (90%-percentile of the group
- 10%-percentile of the group)
For an indicator like ‘Antibiotics ADD’ the calculation is as follows:
-100 * (Average best performing farms in the group – average of the group) / (90%-percentile
of the group - 10%-percentile of the group)
-100 * (Average other farms in the group – average of the group) / (90%-percentile of the
group - 10%-percentile of the group)
Organic dairy farms First we present results of the organic dairy farms. These farms operate under different conditions
compared to the conventional farms. Some effects are higher costs and higher milk prices; the latter
especially being the case in 2015 and 2016 when the difference in milk price between organic and
conventional went up till 15 eurocent per kg milk. More than enough reasons to consider the organic
dairy farms as a separate group. Although the number of organic dairy farms is small compared to the
conventional dairy farms (2-3% of all dairy farms), big differences in performance also occur among
these farms.

Figure 3.1 shows results concerning farm structure and farm management of organic dairy farms.
Figure 3.1 Differences in farm structure and farm management between the 33% best performing organic dairy farms and the other 67% of the organic dairy farms over the year 2016 *) significant difference at P < 0.05, from T-test
There are no significant differences concerning farm structure and farm management between the best
performing organic dairy farms and the other organic dairy farms except for the number of unpaid AWU.
Figure 3.2 Differences in some indicators between the 33% best performing organic dairy farms and the other 67% of the organic dairy farms over the year 2016 *) significant difference at P < 0.05, from T-test

Looking at figure 3.2 it can be seen that the best performing organic dairy farms perform better on most
indicators. But in many cases the differences are not significant except for the nitrogen surplus in kg per
ha, the costs of purchased feed (excluding roughage) per 100 kg milk and the margin per kg milk (cash
flow based: milk price minus critical milk price). So the best performing organic dairy farms achieve
better economic results while they also tend to have more favourable results on the Planet- and People-
indicators.
Other dairy farms with till 70 dairy cows The next group to be considered are the smaller conventional dairy farms. The same two types of figures
are presented below. Figure 3.3 contains the results on farm structure and farm management.
Figure 3.3 Differences in farm structure and farm management between the 25% best performing conventional small (till 70 dairy cows) dairy farms and the other 75% of the conventional small dairy farms over the year 2016 *) significant difference at P < 0.05, from T-test
Overall the picture is mixed: the other conventional small dairy farms tend to be somewhat bigger than
the best performing but kg milk per cow is higher on the best performing conventional small dairy farms.
None of the differences is significant so no real differences exist between the two groups in figure 3.3.
Looking at figure 3.4 it can be seen that the best performing conventional small dairy farms perform
better on most indicators. For about one third of the indicators the differences between the best
performing farms and the other ones are significant, mainly in the case of Profit-indicators. So the best
performing organic dairy farms achieve better economic results while they also tend to have more
favourable results on the Planet- and People-indicators.

Figure 3.4 Differences in some indicators between the 25% best performing conventional small
dairy farms and the other 75% of the conventional small dairy farms over the year 2016 *) significant difference at P < 0.05, from T-test
Other dairy farms with 70 till 125 dairy cows and between 1 and 2 dairy cows per
hectare forage crops (including grassland) Below we present results of the third group: conventional dairy farms with 70 till 125 dairy cows and
between 1 and 2 dairy cows per hectare forage crops (including grassland). This group is in the middle
concerning farm size and can meet, to a large extent, the conditions of ‘being tied to land’ which is an
important issue today. Some best performing farmers have been requested to be interviewed about how
they realise their good results; also some well performing organic farmers have been interviewed.
Figure 3.5 shows results concerning farm structure and farm management. Although there are some
differences in farm structure and farm management between the best performing farms and the other
farms, only the number of dairy cows significantly differs. So the objective to decrease effects of farm
structure as much as possible by creating groups on farm structure was achieved.

Figure 3.5 Differences in farm structure and farm management between the 25% best performing farms and the other 75% of the farms within the group conventional dairy farms with 70 till 125 dairy cows and between 1 and 2 dairy cows per hectare forage crops (including grassland) over the year 2016
*) significant difference at P < 0.05, from T-test
Figure 3.6 Differences in some indicators between the 25% best performing farms and the other 75% of the farms within the group conventional dairy farms with 70 till 125 dairy cows and between 1 and 2 dairy cows per hectare forage crops (including grassland) over the year 2016 *) significant difference at P < 0.05, from T-test
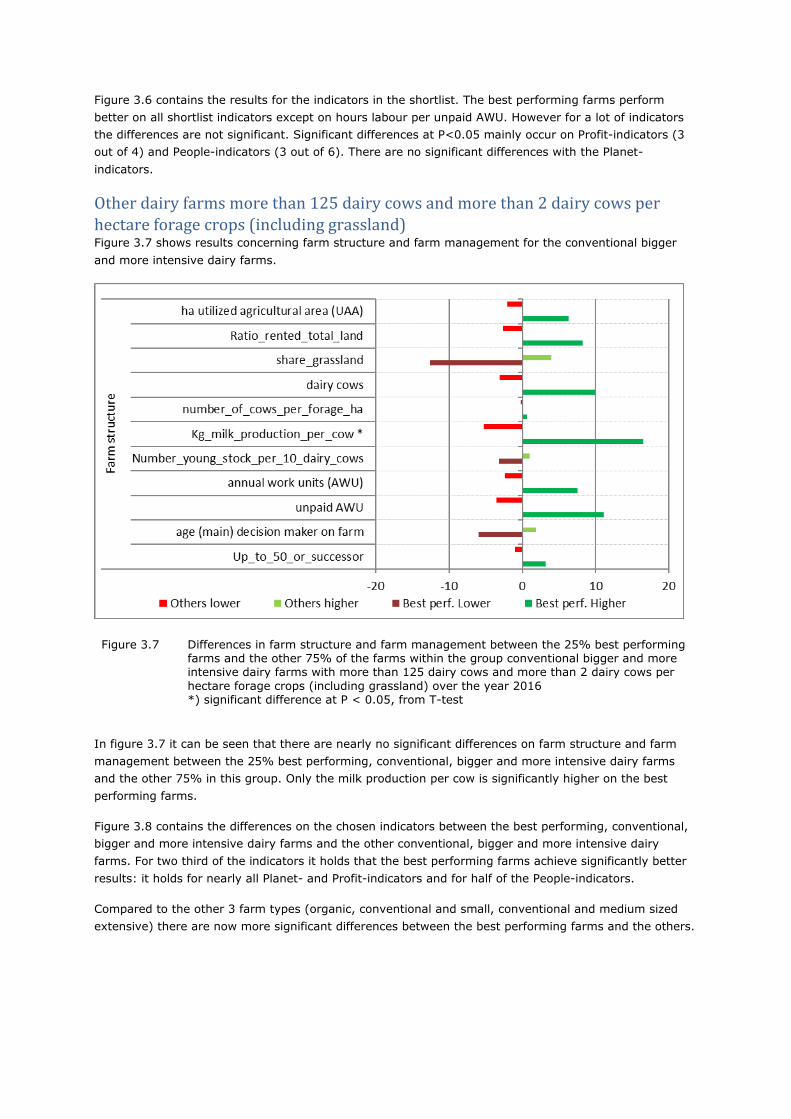
Figure 3.6 contains the results for the indicators in the shortlist. The best performing farms perform
better on all shortlist indicators except on hours labour per unpaid AWU. However for a lot of indicators
the differences are not significant. Significant differences at P<0.05 mainly occur on Profit-indicators (3
out of 4) and People-indicators (3 out of 6). There are no significant differences with the Planet-
indicators.
Other dairy farms more than 125 dairy cows and more than 2 dairy cows per
hectare forage crops (including grassland) Figure 3.7 shows results concerning farm structure and farm management for the conventional bigger
and more intensive dairy farms.
Figure 3.7 Differences in farm structure and farm management between the 25% best performing farms and the other 75% of the farms within the group conventional bigger and more intensive dairy farms with more than 125 dairy cows and more than 2 dairy cows per
hectare forage crops (including grassland) over the year 2016 *) significant difference at P < 0.05, from T-test
In figure 3.7 it can be seen that there are nearly no significant differences on farm structure and farm
management between the 25% best performing, conventional, bigger and more intensive dairy farms
and the other 75% in this group. Only the milk production per cow is significantly higher on the best
performing farms.
Figure 3.8 contains the differences on the chosen indicators between the best performing, conventional,
bigger and more intensive dairy farms and the other conventional, bigger and more intensive dairy
farms. For two third of the indicators it holds that the best performing farms achieve significantly better
results: it holds for nearly all Planet- and Profit-indicators and for half of the People-indicators.
Compared to the other 3 farm types (organic, conventional and small, conventional and medium sized
extensive) there are now more significant differences between the best performing farms and the others.

Figure 3.8 Differences in some indicators between the 25% best performing farms and the other
75% of the farms within the group conventional bigger and more intensive dairy farms with more than 125 dairy cows and more than 2 dairy cows per hectare forage crops (including grassland) over the year 2016 *) significant difference at P < 0.05, from T-test
The question can arise whether dairy farms, that performed well in 2016, also performed well in other
years or not. Figure 3.9 shows that the first is the case: farms that performed well in 2016 also
performed well in most of the years 2011-2016.
Figure 3.9 Average performance of dairy farms in the years 2011-2016 with classification of the farms according to their performance in 2016
4. Conclusions From the results it can be concluded that:

- The best performing farms did not differ from others on structure and farm management (size,
intensity, kg milk per cow, etc.);
- The best performing farms had better results on nearly all shortlist indicators;
o On 40% of those indicators the difference was significant, mainly on Profit-indicators;
o Total scores on People, Planet and Profit all were significant better for the best performing
farms;
- Best performers in one year (here 2016) also performed well in other years: they were not chance
hits.
5. Follow up The results show that the best performing Dutch dairy farms achieve better results on many indicators.
However, the results do not tell how the entrepreneurs on these farms realised these better results. To
find out how these entrepreneurs run their farms, more in depth information about attitudes, knowledge
levels and insights is necessary. In an advanced research it is tried to collect this information by in depth
interviews with some of the best performing entrepreneurs.
Literature Agrimatie:
https://www.agrimatie.nl/ThemaResultaat.aspx?subpubID=2232&themaID=2278&indicatorID=2028
visited on 03-01-2019
Baraldi, A.N.; Enders, C.K. An introduction to modern missing data analyses. Journal of School
Psychology 48 (2010) 5–37
Dolman, M.A.; Sonneveld, M.P.W.; Mollenhorst, H.; Boer, I.J.M. de. Benchmarking the economic,
environmental and societal performance of Dutch dairy farms aiming at internal recycling of nutrients.
Journal of Cleaner Production 73 (2014). - ISSN 0959-6526 - p. 245 - 252.
Donders, A.R.T.; Heijden, G.J.M.G. van der; Stijnen, T.; Moons, K.G.M. Review: A gentle introduction to
imputation of missing values. Journal of Clinical Epidemiology 59 (2006) 1087-1091
Doornewaard G.J.; Reijs, J.W.; Beldman, A.C.G.; Jager, J.H.; Hoogeveen, M.W. (2017)
Sectorrapportage Duurzame Zuivelketen; Prestaties 2016 in perspectief. Wageningen, Wageningen
Economic Research, Rapport 2017-087. 200 blz.; 24 fig.; 11 tab.; 103 ref.
Lebacq, T.; Baret, P.V.; Stilmant, D. Sustainability indicators for livestock farming. A review. Agron.
Sustain. Dev. (2013) 33:311–327
Meul, M.; Passel, S. van; Nevens, F.; Dessein, J.; Rogge, E.; Mulier, A.; Hauwermeiren, A. van. MOTIFS:
a monitoring tool for integrated farm sustainability. Agronomy for Sustainable Development, Springer
Verlag/EDP Sciences/INRA, 2008, 28 (2), pp.321-332
Papageorgiou, G.; Grant, S.W.; Takkenberg, J.J.M.; Mokhlesa, M.M. Statistical primer: how to deal with
missing data in scientific research? Interactive CardioVascular and Thoracic Surgery 27 (2018) 153–158
Sainani, K.L. Dealing With Missing Data. PM R 7 (2015) 990-994
Van Calker, K.J. (2005) Sustainability of Dutch dairy farming systems: A modelling approach. PhD
Thesis, Wageningen University, The Netherlands, 208 pp.