identification of blood-activating components from
TRANSCRIPT
RSC Advances
PAPER
Ope
n A
cces
s A
rtic
le. P
ublis
hed
on 1
0 M
arch
202
0. D
ownl
oade
d on
1/2
2/20
22 1
1:31
:12
AM
. T
his
artic
le is
lice
nsed
und
er a
Cre
ativ
e C
omm
ons
Attr
ibut
ion
3.0
Unp
orte
d L
icen
ce.
View Article OnlineView Journal | View Issue
Identification of
aSchool of Pharmaceutical Sciences, Jilin U
130021, Jilin, China. E-mail: [email protected]
cn; Tel: +86-431-85619803bResearch Center of Natural Drug, Jilin UnivcThe First Hospital of Jilin University, Chan
Cite this: RSC Adv., 2020, 10, 9587
Received 18th November 2019Accepted 18th February 2020
DOI: 10.1039/c9ra09623j
rsc.li/rsc-advances
This journal is © The Royal Society o
blood-activating componentsfrom Xueshuan Xinmaining Tablet based on thespectrum–effect relationship and networkpharmacology analysis
Jing Tan,a Junli Liu,a Han Wang,a Ying Zhang,ac Hongqiang Lin,a Zhongyao Wang,a
Hanrui Si,a Yutong Zhang,a Jinping Liu, *ab Pingya Li*ab and Kai Sun*a
With the aim of identifying the active components of Xueshuan Xinmaining Tablet (XXT) and discussing the
potential mechanism involved, the relationship between HPLC fingerprints and its blood-activating effect
were established by multivariate statistical analysis, including gray relational analysis (GRA) and partial
least squares regression analysis (PLSR). Network pharmacology was used to predict the potential
mechanism based on the identified active components. GRA and PLSR analysis showed close correlation
between the HPLC fingerprints and blood-activating activity, and peaks P1, P3, P11, P15, P22, P34, P36,
P38 and P39 might be potential anti-blood stasis components of XXT. The pharmacological verification
showed that salvianic acid A (P1), rutin (P3), ginsenoside Rg1 (P11) and Rb1 (P22), cinobufagin (P36), and
tanshinone I (P38) and IIA (P39) had significant blood-activating effects. Based on these seven active
compounds, network pharmacology analysis indicated that the anti-blood stasis effect of XXT might be
closely related to TNF, PI3K-Akt and NF-kB signaling pathways. The spectrum–effect relationship of XXT
was successfully established in this study. The blood-activating components and the anti-blood stasis
mechanism were revealed and predicted. These findings could also be beneficial for an exploration of
the active components of TCM.
1 Introduction
Xueshuan Xinmaining Tablet (XXT), a Chinese traditionalcompound medicine composed of ten herbs, possesses theactivities of promoting blood circulation and removing bloodstasis.1 It is recorded in the Chinese Pharmacopoeia (2015edition) and has been clinically applied for the treatment ofcerebral thrombosis and coronary heart disease for at leasteen years.2,3 In our previous studies, we have reported thatXXT could treat blood stasis through regulating related genesand proteins or endogenousmetabolite pathways.1,4,5 Themulti-target mechanism is closely related to the variation in thechemical components contained. We have reported thecomprehensive component screening of XXT based on UPLC/Q-TOF-MS. The results showed that XXT was rich in chemicalconstituents of different structural types.6 Additionally, thecontents of salvianolic acid B, rutin, ferulic acid, and ginseno-side Re and Rg1 were determined in the national standard of
niversity, Fujin Road 1266, Changchun
.cn; [email protected]; [email protected].
ersity, Changchun 130021, China
gchun 130021, Jilin, China
f Chemistry 2020
XXT. However, whether these ingredients are the blood-activating substances is not quite certain.
Fingerprints are widely recognized as a quality control methodworldwide.7,8 The World Health Organization (WHO, 2007) hasapproved the use of ngerprints to evaluate the quality of naturaldrugs or traditional Chinese medicine (TCM). Fingerprints, withthe advantages of convenience and a large amount of information,could systematicallymark the chemical composition of TCM.9 TheUPLC-PDA ngerprint of XXT, marked with 28 common peaks in280 nm, has been established to assess the quality consistency ofXXT.10 However, the ngerprints only focused on the chemicalcharacteristics, but gave little information about the components'therapeutic effects. The components in XXT related to the anti-blood stasis effect have not been identied.
The spectrum–effect relationship was established by linkingthe peaks in the ngerprints of TCM with specic bioactivity toscreen the active components in TCM.11 Multivariate statisticalmethods, including partial least squares regression analysis(PLSR) and gray relational analysis (GRA), have been commonlyapplied to analyze the regression coefficients, variable impor-tance in projection (VIP) contribution, and their correlation.12–14
As a result, the active compounds closely related to a speciceffect could be effectively screened for further pharmacologicalactivity evaluation in vitro or in vivo.
RSC Adv., 2020, 10, 9587–9600 | 9587
RSC Advances Paper
Ope
n A
cces
s A
rtic
le. P
ublis
hed
on 1
0 M
arch
202
0. D
ownl
oade
d on
1/2
2/20
22 1
1:31
:12
AM
. T
his
artic
le is
lice
nsed
und
er a
Cre
ativ
e C
omm
ons
Attr
ibut
ion
3.0
Unp
orte
d L
icen
ce.
View Article Online
With the development of bioinformatics, network pharma-cology, as a more comprehensive approach for integratingcompound–target–pathway interactions from a molecular toa systematic level, is evolving as a Frontier research eld in drugdiscovery and development. The boom in network pharma-cology has prompted more researchers to elucidate the possiblemechanisms of natural products in recent years.15,16
In this study, the blood-activating components in XXT werepredicted by analysis of the spectrum–effect relationship for thechemical characteristic peaks and the anti-blood stasis effect. Inview of the uniqueness of the manufacturer, and the goodsimilarity and stability of chemical components in the XXTngerprint,10 ten different polar solvent extracts of XXT wereused to establish HPLC ngerprints. Then, a pharmacologicaltest in vitro was performed to verify the predicted results.Finally, the possible targets and signaling pathways of theblood-activating components were predicted by network phar-macology. This study identied the anti-blood stasis compo-nents in XXT, which could be benecial for the quality controlof XXT and the exploration of blood-activating components.
2 Experiments2.1 Instruments, materials, and animals
2.1.1 Instruments. Agilent ZORBAX SB C18 column (4.6 mm� 250 mm, 5 mm; Agilent Technologies, MA, USA); Waters 1525HPLC, Waters 2998 Diode Array Detector (American Waters);FA1104N One–tenth Electronic Analysis Balance (ShanghaiJinghua Technology Instrument Co., Ltd.); R201D ConstantTemperature Water Bath and Rotary Evaporator (ShanghaiYukang Science and Education Equipment Ltd.); KQ3200VUltrasonic Cleaner (150 W, 40 kHz, Kunshan UltrasonicInstrument Co., Ltd.). SC40 (LG-PABER-I) semi-automaticcoagulation factor analyzer Taizhou Steellex (BiotechnologyCo. Ltd. China); KES-900B blood rheometer (Wuxi KangershengElectronic Instrument Co. Ltd. in China); LBY-N6 cone–plateblood viscometer (Precil Co., Ltd. Beijing, China) and XN2000hematology analyzer (Sysmex Corporation, Kobe, Japan).
2.1.2 Materials. XXT (Jilin Huakang Pharmaceutical Co.,Ltd. Jilin, China); heparin sodium (YM Biological TechnologyCo., Ltd. Shanghai, China); epinephrine (Tianjin Pharmaceuti-cals Group Co., Ltd. Tianjin, China); chloral hydrate (BiosharpCo., Ltd. Shenyang, China); acetonitrile suitable for HPLC(Fisher Chemical Company, Shanghai, China); deionized waterpuried using a Milli-Q water purication system (Millipore,Billerica, MA, USA); Sysmex coagulant analyzer (Sysmex Corpo-ration, Japan); phosphoric acid (Beijing Chemical Works, Bei-jing, China). Standards of tanshinone IIA, ginsenoside Rg2, -Rd,-Rf, -Rh2, -Rb2, -Rb3, -Rg1, -Re, -Rb1, rutin, quercetin, cinobufa-gin and resibufogenin (National Institutes for Food and DrugControl, Beijing, China); hyodeoxycholic acid, cholic acid, sal-vianic acid A, salvianolic acid B and tanshinone I (Sichuan WeiKeqi Biotechnology Co., Ltd., Sichuan, China); ginsenoside Rh1,-Rc, -Rg3 and -F2 were prepared by the laboratory.
2.1.3 Animals. Wistar rats (male, 200 � 20 g) werepurchased from the Animal Laboratory Center of the BasicMedical College of Jilin University (Changchun, China)
9588 | RSC Adv., 2020, 10, 9587–9600
(Certicate No. SCXK-(Ji) 2018-0003) and used for experimentsaer a week of adaptive feeding. The rats were divided randomlyinto 13 groups and assigned to PC polycarbonate mouse cages(53.5 cm � 39.0 cm � 20.0 cm) (n ¼ 10 for each group per cage),then allowed standard diets and water ad libitum. The rats werekept in a controlled environment (temperature: 20 � 2 �C;relative humidity: 50 � 10%) with a 12 h dark/light cycle. Allanimal procedures were performed in accordance with theGuidelines for Care and Use of Laboratory Animals of JilinUniversity and approved by the Animal Ethics Committee ofJilin University. The approval number was 201904108.
2.2 HPLC ngerprints
2.2.1 HPLC conditions. Column temperature, 40 �C;detection wavelength, 203 nm; injection volume, 10 mL; owrate, 1.0 mL min�1; mobile phase acetonitrile (A)–0.1% phos-phoric acid aqueous solution (B) with the following gradientelution: 0–10 min, 5% A; 10–20 min, 5% / 10% A; 20–35 min,10% / 15% A; 35–55 min, 15% / 20% A; 55–75 min, 20% /
28% A; 75–115 min, 28% / 35% A; 115–140 min, 35% / 40%A; 140–190 min, 40% / 60% A.
2.2.2 Preparation of solutions2.2.2.1 Reference standard solutions. Certain amounts of
salvianolic acid B, salvianic acid A, rutin, quercetin, ginsenosideRg1, -Re, -Rf, -Rb1, -Rg3, -Rh1, -Rc, -Rg2, -F1, -Rb2, -Rb3, -Rd, -F2,cholic acid, cinobufagin, resibufogenin, tanshinone I and tan-shinone IIA were dissolved in methanol to obtain the mixedreference standards solutions (the concentration of each refer-ence standard was 0.1 mg mL�1).
2.2.2.2 Sample solutions. The pulverized XXT sample wassieved (Chinese National Standard Sieve No. 3, R40/3 series) toobtain a homogeneous powder. Then each ne powder wasaccurately weighed (50 g). Each powder was extracted respec-tively with different polarity solvents {S1: n-butanol; S2: meth-anol; S3: methanol–dichloro (1 : 1); S4: 70% methanol; S5:ethanol–acetone (1 : 1); S6: ethyl acetate; S7: ethanol–ethylacetate (1 : 1); S8: ethanol; S9: methanol–acetone (1 : 1); S10: 50%acetone} in an ultrasonic bath at 40 �C three times (1 h eachtime). Aer being ltered, the extraction solutions werecombined, concentrated, and evaporated to dryness. Thedesiccated extracts were then respectively dissolved inmethanolto obtain the solutions (each was 20 mg mL�1), mixed well, andltered (0.45 mm).
2.2.3 Validation of method. The optimized method wasvalidated by evaluating the precision, repeatability and stability.Precision was evaluated by successively analyzing the six testsolutions from the S4 sample. Six replicates of the S4 samplewere successively assessed to evaluate the repeatability. Thestability was determined by analysis at different time intervals(0, 2, 4, 8, 16, and 24 h) in a day. Furthermore, the precision,repeatability and stability were expressed as the relative stan-dard deviation (RSD) of each peak area (PA) of each sample.
2.2.4 Evaluation of HPLC ngerprints2.2.4.1 SA. Each sample solution (S1–S10) and the reference
standard solutions were injected into the HPLC. Chromato-grams showing the retention time (tR) and the peak area (PA)
This journal is © The Royal Society of Chemistry 2020
Paper RSC Advances
Ope
n A
cces
s A
rtic
le. P
ublis
hed
on 1
0 M
arch
202
0. D
ownl
oade
d on
1/2
2/20
22 1
1:31
:12
AM
. T
his
artic
le is
lice
nsed
und
er a
Cre
ativ
e C
omm
ons
Attr
ibut
ion
3.0
Unp
orte
d L
icen
ce.
View Article Online
were obtained. According to the Similarity Evaluation Systemfor Chromatographic Fingerprint of TCM (version 2012A; Bei-jing, China), the ngerprints were automatically matched andestablished.17 Chromatograms of S1–S10 samples, including PAand tR, were put into the Analytical Instrument Association (AIA)form (*.cdf). Subsequently, a reference ngerprint was auto-matically generated by comparing S1–S10 samples based on themedian method, and the similarity (SA) between the chro-matogram of the reference ngerprint and each sample chro-matogram was calculated with the soware.
2.2.4.2 HCA. Hierarchical cluster analysis (HCA), a multi-variate statistical analysis technique to measure dissimilarity orsimilarity, is commonly used to sort samples into clusters.18 Thecommon PAs of the samples were used as features, and the HCAof the S1–S10 samples was established from the squaredEuclidean distance (metric) and the between-groups linkagemethod (the amalgamation rule) with SPSS statistics soware(SPSS 19.0, SPSS Inc., Chicago, IL, USA).19
2.3 Blood-activating experiments
2.3.1 Sample preparation. XXT extract samples wereprepared according to the method described in Section 2.2.2.Signicantly, the desiccated extracts were suspended indistilled water instead of being dissolved in methanol. Theconcentrations of XXT extracts were calculated from the amountof XXT, and the nal concentrations were equivalent to 70.0 mgmL�1 of XXT. A Buchang Naoxintong Capsule (BCN) was alsosuspended in distilled water to produce a solution containing70.0 mg per mL BCN. So 10 kinds of XXT extract and BCN testsolutions were prepared according to a dosage of 0.7 g kg�1.1
2.3.2 Grouping, modeling, and administration. Aer oneweek of adaptive feeding, 130 male Wistar rats were randomlydivided into 13 groups (10 rats per group): (i) normal (N) group,(ii) model (M) group, (iii) BCN positive control group, and (iv–xiii) the XXT extract (S1–S10) groups. Both i and ii groups wereadministered with distilled water. All groups were gastro-intestinally administered at 10 mL kg�1 once a day for 8 days.On day 1 to day 6, half an hour aer each administration, the ii–xiii groups were all placed in ice water (0–1 �C) for 5 min. On day7, 30 minutes aer intragastric administration, the ii–xiiigroups were injected subcutaneously with 0.1% adrenaline(1 mg kg�1) twice to establish an acute blood stasis model.20 Therst dose was 1 mg kg�1, and the second dose was reduced to0.8 mg kg�1 at an interval of 4 hours. Two hours aer the rstdose of adrenaline, the rats in the ii–xiii groups were alsoimmersed in an ice bath for 5 min.
2.3.3 Determination of hemorheology and coagulationindicators. In order to assess the model in rats and the effect ofXXT extracts, the hemorheology indexes (whole blood viscosity:WBV; plasma viscosity: PV) and coagulation indicators(thrombin time: TT; prothrombin time: PT; activated partialthromboplastin time: APTT; brinogen: FIB) wereevaluated.21–23
On the night of day 7, all the rats were fasted for 12 h, butwater was allowed. On day 8, 30 min aer administration, therats were anesthetized by an intraperitoneal injection of 10%
This journal is © The Royal Society of Chemistry 2020
chloral hydrate (3 mL kg�1). Blood was drawn from theabdominal aorta and was kept in tubes containing heparinsodium (20 U mL�1). Some of the whole blood was used tomeasure the whole blood viscosity (WBV). The WBV was deter-mined (at shear rates of 10, 60, and 120/s) at 37 �C. Plasma, usedto determine PV, TT, PT, APTT, and FIB, was obtained from theremaining whole blood by centrifugation at 3000 rpm for10 min. PV was measured at a shear rate of 120/s. TT, PT, APTT,and FIB were determined with an SC 40 (LG-PABER-I) coagula-tion analyzer with commercial kits, in accordance with themanufacturers' instructions. The calibration curves of PT (x)and solidication time (y), FIB (x) and solidication time (y)were established. TT was tested by incubating 100 mL of plasmaat 37 �C for 3 min, followed by the addition of 100 mL ofthrombin agent. PT was examined by incubating 50 mL ofplasma for 3 min at 37 �C, followed by the addition of 100 mL ofthromboplastin agent. APTT was evaluated by incubating 50 mLof plasma with 50 mL pf APTT-activating agents for 3 min at37 �C, followed by the addition of 50 mL of CaCl2. FIB wasassessed by incubating 10 mL of plasma with 90 mL of imidazolebuffer at 37 �C for 3min, followed by the addition of 50 mL of FIBagent. All hemorheological indexes and coagulation functionindexes were determined within 3 h aer blood collection.
2.3.4 Data analysis. All quantitative data were presented asmean � standard derivation (SD) calculated with GraphPadPrism 6.0 soware (GraphPad Soware, CA). Multiple compar-isons were analyzed by one-way analyses of variance (ANOVA). AStudent's t-test was carried out by comparing two groups. A p-value < 0.05 was considered statistically signicant.
2.4 Spectrum–effect relationship analysis
2.4.1 GRA. Gray relational analysis (GRA), expressing thestrengths of relationships between factors, has been widelyapplied for TCM studies of spectrum–effect relationships.24,25
Compared with other statistical methods, the gray correlationanalysis, with lower requirements on sample data, possessesthe advantages of requiring a small sample size and amount ofcomputation, and has been applied widely. The principle ofGRA is to utilize the degree of similarity between two series ofcurve geometries to determine a correlation based on assessingthe inuence of factors on the index.26,27 Its basic method is touse the pharmacodynamic index of traditional Chinese medi-cine as the reference sequence and the characteristic peak areashared by the ngerprints as the comparison sequence.According to the gray correlation between each factor of thecomparison sequence and the reference sequence, the “contri-bution” of each common characteristic peak to the efficacy isdetermined.28,29 The higher the gray relational grade is, thegreater the correlation. In this study, GRA was performed usingDPS 7.05 soware (Data Processing system, China).
2.4.2 PLSR. Partial least squares regression analysis (PLSR),a multivariate statistical regression model,30 could effectivelysolve the multicollinearity between a set of dependent variables(y) from a large set of independent variables (x).31 In this study,the x matrix was composed of PA, and the y vector was con-structed with APTT and the levels of WBV (10/s). The PLSR
RSC Adv., 2020, 10, 9587–9600 | 9589
RSC Advances Paper
Ope
n A
cces
s A
rtic
le. P
ublis
hed
on 1
0 M
arch
202
0. D
ownl
oade
d on
1/2
2/20
22 1
1:31
:12
AM
. T
his
artic
le is
lice
nsed
und
er a
Cre
ativ
e C
omm
ons
Attr
ibut
ion
3.0
Unp
orte
d L
icen
ce.
View Article Online
model was established with SIMCA-P soware (SIMCA-P13.0,Umetrics, Umea, Sweden).32 The relative inuence of the inde-pendent variables on the dependent variables was reected bythe regression coefficient.
2.5 Pharmacological test
The predicted components related to the blood-activatingactivity of XXT were identied with reference standards. Theanticoagulant activity of the predicted components of differentconcentrations (10, 20, and 40 mM) on normal rat plasma wasdetermined by the method described in Section 2.3.3.33,34 Thebioactive components were nally screened out with this in vitrotest.
2.6 Network pharmacology
Network pharmacology, an application of systems biology, isapplied to predict the complex mechanism of action of TCMformulas.14,35 It could be used to construct an entire drug–targetinteraction network and to predict the core targets and path-ways involved. It is more efficient to clarify how multiplecomponents interact with core targets by intersecting with thedisease target database. In this study, the aforementionedscreened active components were used as “candidatecompounds” for network pharmacological analysis. The inter-action network between active components and a blood stasisrelated target was then presented, and the potential involvedpathways were also predicted.
2.6.1 Construction of networks2.6.1.1 The compound–target network. To collect the targets
of the active components, some databases, such as TCMSP(http://lsp.nwsuaf.edu.cn/tcmsp.php), SymMap (http://www.symmap.org), TCM-MeSH (http://mesh.tcm.microbioinformatics.org/), ETCM (http://www.nrc.ac.cn:9090/ETCM/), and BATMAN–TCM (http://bionet.ncpsb.org/batman-tcm), were used. The active compo-nent–target interaction map was then generated with Cytoscape3.6.0 soware (http://www.cytoscape.org/).
2.6.1.2 The target–target network. Blood stasis-associatedtarget proteins were collected by using “blood stasis”, “coagula-tion of blood”, “blood clotting”, “blood viscosity”, “bloodrheology”, “blood thickening”, “thrombus”, “thrombosis”,“thrombophilia”, “thromboembolism”, “venous thrombosis”,“cerebral thrombosis”, and “thromboses” as the keywords fora search in the OMIM database (http://omim.org/), DisGeNETdatabase (http://www.disgenet.org/), and the PharmGKB database(http://geneticassociationdb.nih.gov/). By intersecting with thetargets of screened compounds, the core targets were then ob-tained. The protein–protein interaction (PPI) network was con-structed with the STRING database (String, https://string-db.org/).
2.6.2 GO function enrichment and KEGG pathway enrich-ment analysis
2.6.2.1 GO. We enriched the overexpressed GO (geneontology) terms of the obtained target networks. The genesymbol IDs of the core targets were transformed to geneensemble IDs by using the Ensembl database (https://asia.ensembl.org/). Gene ensemble ID les were then
9590 | RSC Adv., 2020, 10, 9587–9600
uploaded to the OmicShare database (https://www.omicshare.com/) for GO enrichment analysis.
2.6.2.2 KEGG. The target-enriched disease pathways wereobtained by Kyoto Encyclopedia of Genes and Genomes (KEGG)pathway enrichment analysis of core targets using the DAVIDdatabase (https://david.ncifcrf.gov/). The OmicShare database(http://omicshare.com/) was used to visualize the result.
3 Results3.1 Results of HPLC ngerprints
3.1.1 Method validation. The tR and PA of common peakswere both calculated to assess the precision, repeatability, andstability. The results demonstrated that the relative standarddeviation (RSD) of the precision (tR: 0.26–1.54%; PA: 0.32–1.85%), repeatability (tR: 0.25–1.36%; PA: 0.12–1.76%), andsample stability (tR: 0.07–1.27%; PA: 0.18–1.42%) were all lowerthan 3%. All results illustrated that the established HPLCanalysis method was valid and suitable for sample analysis.
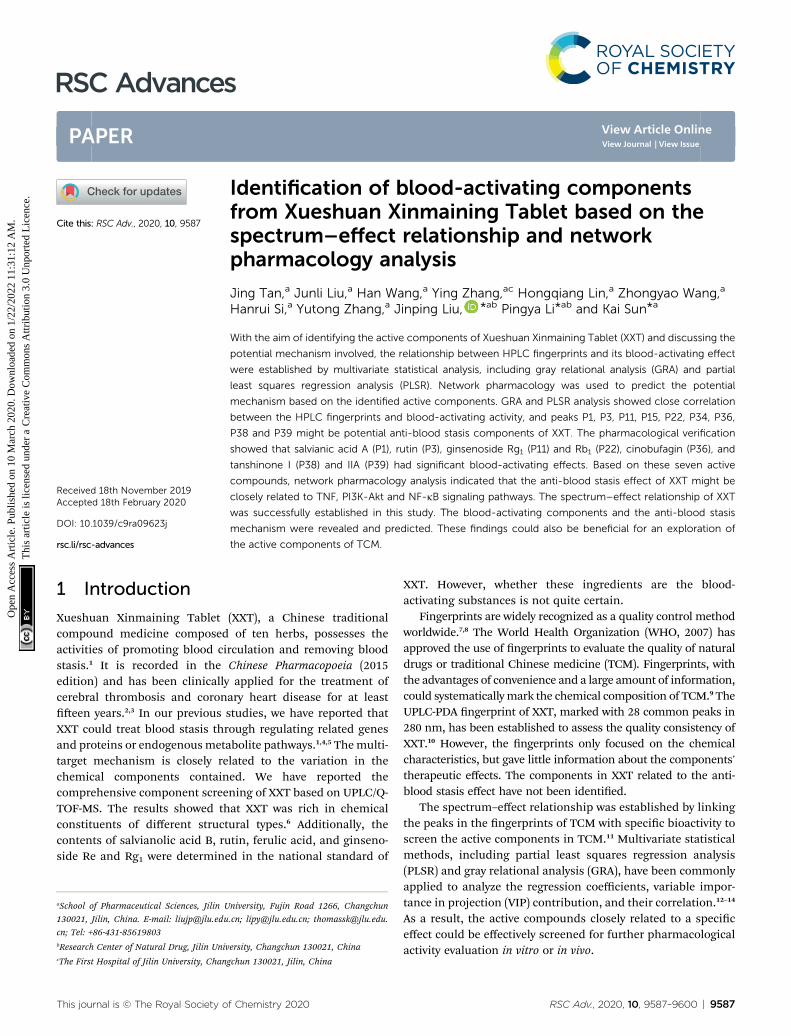
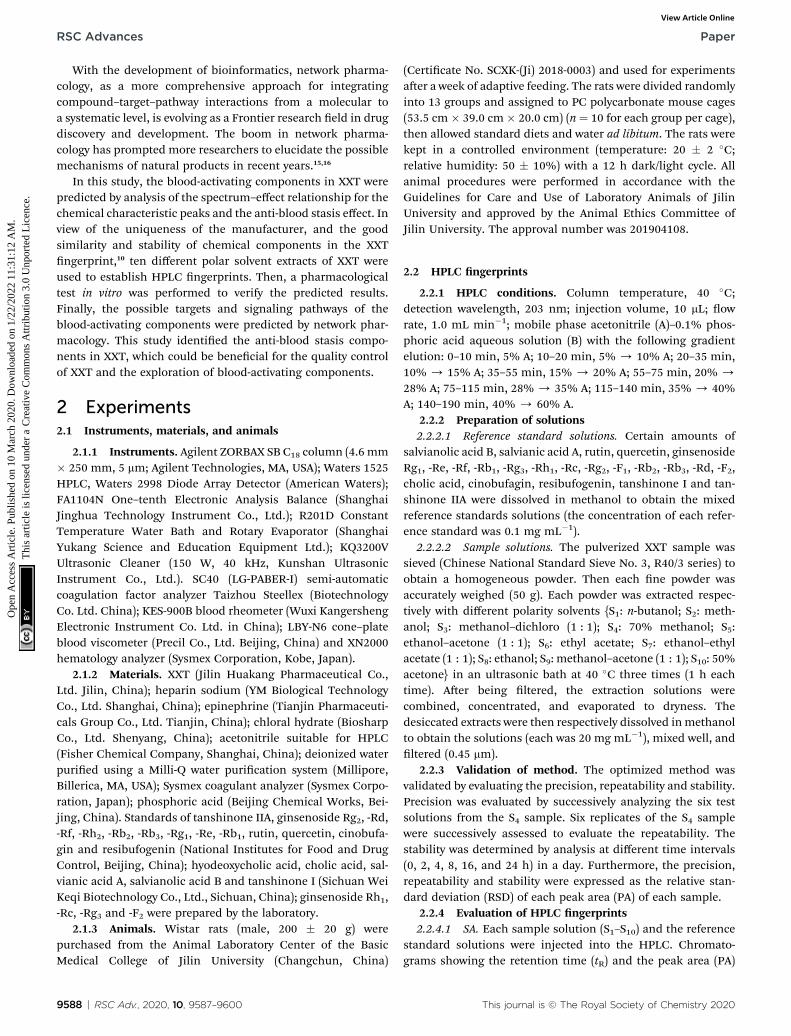
3.1.2 Results of HPLC ngerprints.HPLC ngerprints of 10batches of S1–S10 samples are shown in Fig. 1. The automaticallygenerated reference ngerprint (R) is shown in Fig. 2.
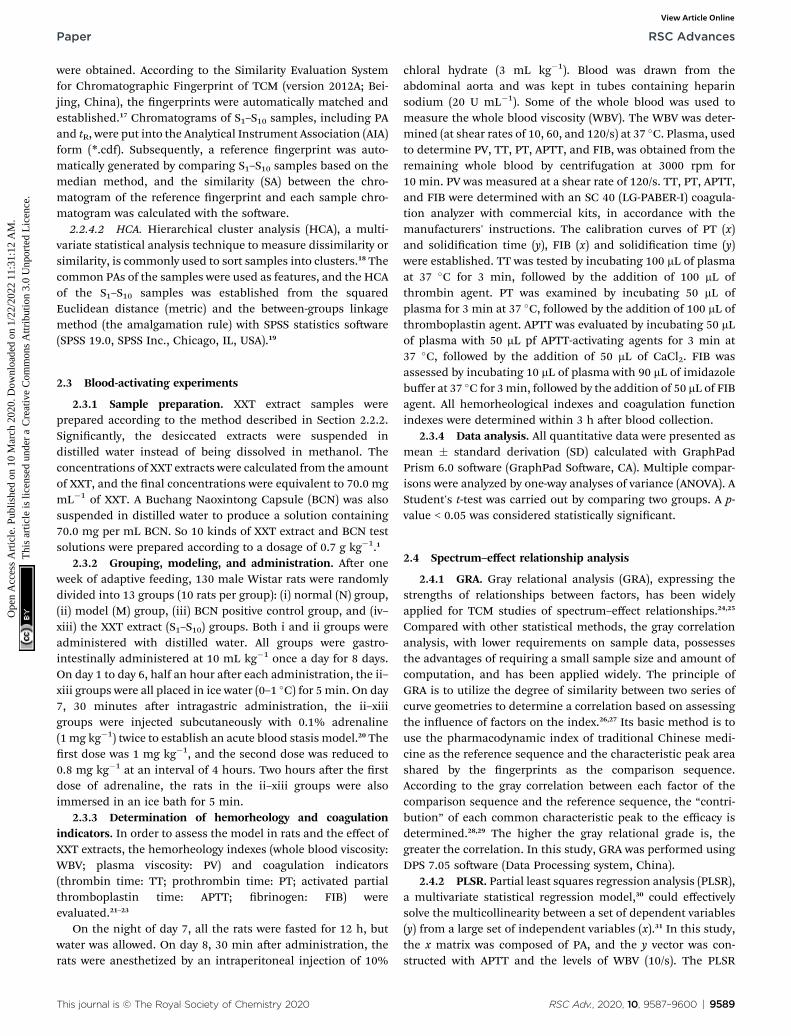
A total of 41 peaks with good segregation and PA greater than1 000 000 were selected as the “common peaks” from consec-utive peaks. Rutin (Peak 3), identied by comparison withreference standards with tR at 44.4 min, was selected as thereference peak to calculate the relative tR and relative PA of theother 40 common peaks. In accordance with the mixed refer-ence standard HPLC spectrum shown in Fig. 3, 23 characteristicpeaks, P1, P3, P4, P11, P12, P14, P18, P20, P22, P24, P25, P26,P27, P29, P32, P33, P15, P34, P35, P36, P37, P38, and P39, wereidentied as salvianic acid A, rutin, quercetin, ginsenoside Rg1,-Re, -Rf, -Rh1, -Rg2, -Rb1, -Rc, -Rb2, -Rb3, -Rd, -Rg3, -F2, -Rh2,salvianolic acid B, cholic acid, hyodeoxycholic acid, cinobufa-gin, resibufogenin, tanshinone I, and tanshinone IIA, respec-tively. The variance coefficients for almost all common peakswere greater than 35%. This is due to the diversity in thecontents of constituents contained in different samplesextracted with different polar solvents.
3.1.2.1 SA. The similarity values between the entire chro-matogram of the S1–S10 samples and the reference ngerprintwere assessed, and their correlation coefficients were 0.948,0.904, 0.986, 0.917, 0.974, 0.815, 0.986, 0.955, 0.987, and 0.963,respectively.
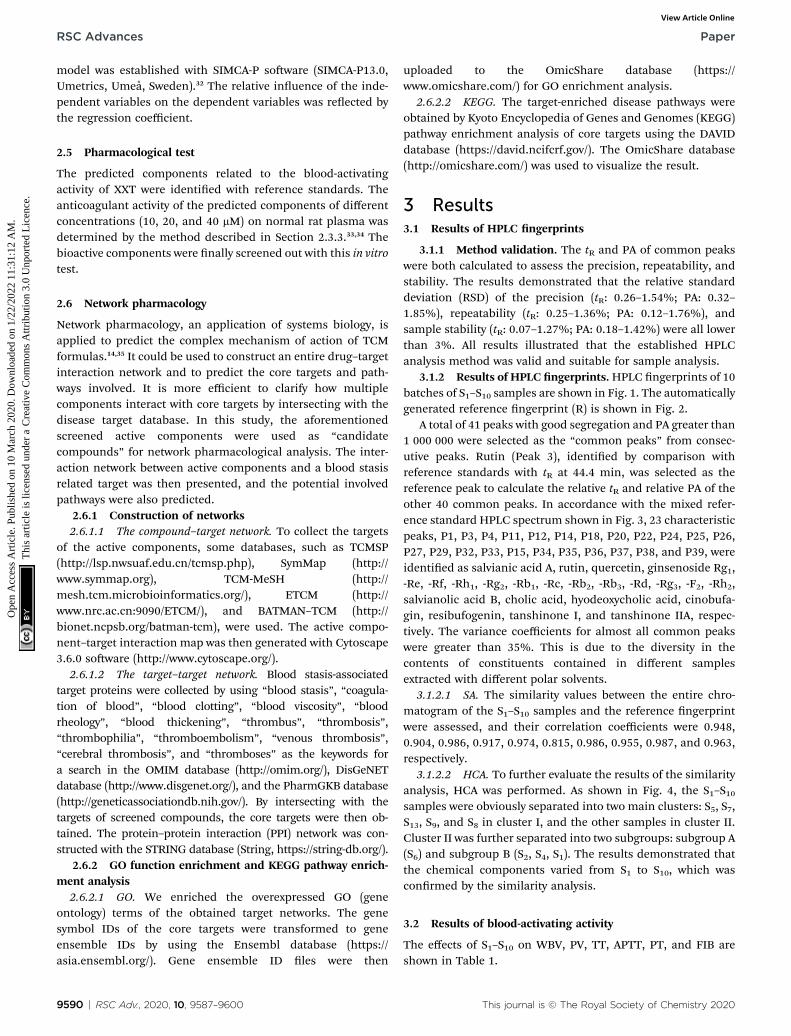
3.1.2.2 HCA. To further evaluate the results of the similarityanalysis, HCA was performed. As shown in Fig. 4, the S1–S10samples were obviously separated into two main clusters: S5, S7,S13, S9, and S8 in cluster I, and the other samples in cluster II.Cluster II was further separated into two subgroups: subgroup A(S6) and subgroup B (S2, S4, S1). The results demonstrated thatthe chemical components varied from S1 to S10, which wasconrmed by the similarity analysis.
3.2 Results of blood-activating activity
The effects of S1–S10 on WBV, PV, TT, APTT, PT, and FIB areshown in Table 1.
This journal is © The Royal Society of Chemistry 2020
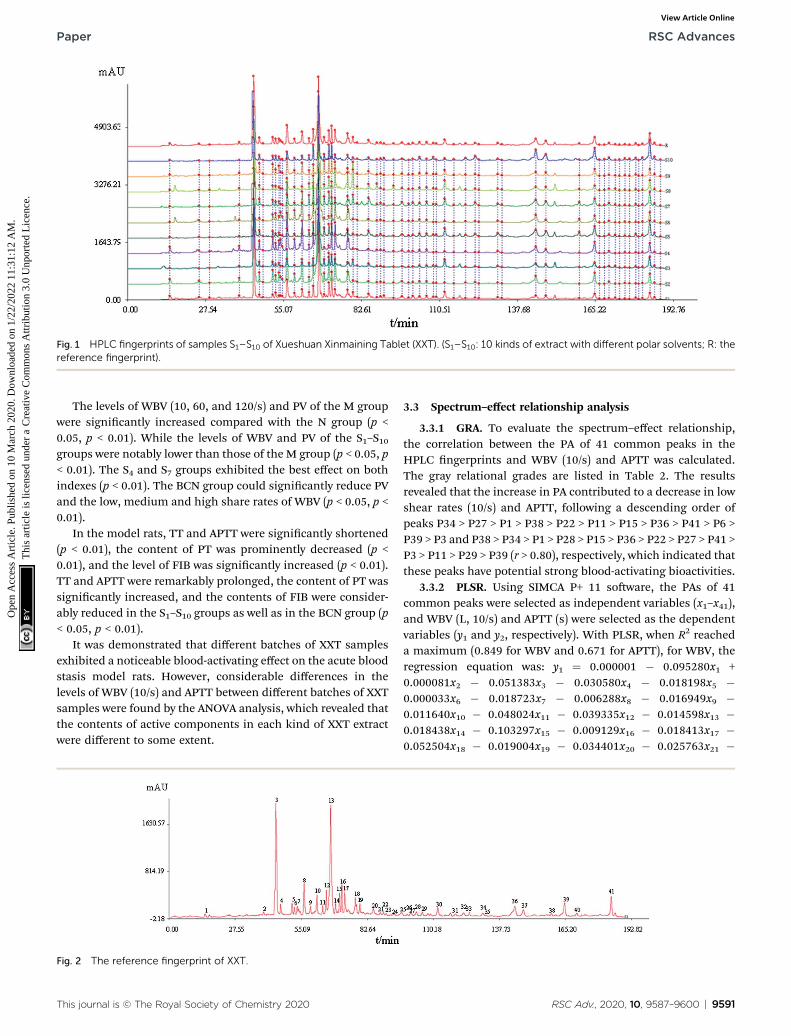
Fig. 1 HPLC fingerprints of samples S1–S10 of Xueshuan Xinmaining Tablet (XXT). (S1–S10: 10 kinds of extract with different polar solvents; R: thereference fingerprint).
Paper RSC Advances
Ope
n A
cces
s A
rtic
le. P
ublis
hed
on 1
0 M
arch
202
0. D
ownl
oade
d on
1/2
2/20
22 1
1:31
:12
AM
. T
his
artic
le is
lice
nsed
und
er a
Cre
ativ
e C
omm
ons
Attr
ibut
ion
3.0
Unp
orte
d L
icen
ce.
View Article Online
The levels of WBV (10, 60, and 120/s) and PV of the M groupwere signicantly increased compared with the N group (p <0.05, p < 0.01). While the levels of WBV and PV of the S1–S10groups were notably lower than those of the M group (p < 0.05, p< 0.01). The S4 and S7 groups exhibited the best effect on bothindexes (p < 0.01). The BCN group could signicantly reduce PVand the low, medium and high share rates of WBV (p < 0.05, p <0.01).
In the model rats, TT and APTT were signicantly shortened(p < 0.01), the content of PT was prominently decreased (p <0.01), and the level of FIB was signicantly increased (p < 0.01).TT and APTT were remarkably prolonged, the content of PT wassignicantly increased, and the contents of FIB were consider-ably reduced in the S1–S10 groups as well as in the BCN group (p< 0.05, p < 0.01).
It was demonstrated that different batches of XXT samplesexhibited a noticeable blood-activating effect on the acute bloodstasis model rats. However, considerable differences in thelevels of WBV (10/s) and APTT between different batches of XXTsamples were found by the ANOVA analysis, which revealed thatthe contents of active components in each kind of XXT extractwere different to some extent.
Fig. 2 The reference fingerprint of XXT.
This journal is © The Royal Society of Chemistry 2020
3.3 Spectrum–effect relationship analysis
3.3.1 GRA. To evaluate the spectrum–effect relationship,the correlation between the PA of 41 common peaks in theHPLC ngerprints and WBV (10/s) and APTT was calculated.The gray relational grades are listed in Table 2. The resultsrevealed that the increase in PA contributed to a decrease in lowshear rates (10/s) and APTT, following a descending order ofpeaks P34 > P27 > P1 > P38 > P22 > P11 > P15 > P36 > P41 > P6 >P39 > P3 and P38 > P34 > P1 > P28 > P15 > P36 > P22 > P27 > P41 >P3 > P11 > P29 > P39 (r > 0.80), respectively, which indicated thatthese peaks have potential strong blood-activating bioactivities.
3.3.2 PLSR. Using SIMCA P+ 11 soware, the PAs of 41common peaks were selected as independent variables (x1–x41),and WBV (L, 10/s) and APTT (s) were selected as the dependentvariables (y1 and y2, respectively). With PLSR, when R2 reacheda maximum (0.849 for WBV and 0.671 for APTT), for WBV, theregression equation was: y1 ¼ 0.000001 � 0.095280x1 +0.000081x2 � 0.051383x3 � 0.030580x4 � 0.018198x5 �0.000033x6 � 0.018723x7 � 0.006288x8 � 0.016949x9 �0.011640x10 � 0.048024x11 � 0.039335x12 � 0.014598x13 �0.018438x14 � 0.103297x15 � 0.009129x16 � 0.018413x17 �0.052504x18 � 0.019004x19 � 0.034401x20 � 0.025763x21 �
RSC Adv., 2020, 10, 9587–9600 | 9591

Fig. 3 The HPLC spectrum of a mixed standard reference. 1: salvianic aid A; 3: rutin; 4: quercetin; 11, 12, 14, 18, 20, 22, 24, 25, 26, 27, 29, 32, 33:ginsenoside Rg1, -Re, -Rf, -Rh1, -Rg2, -Rb1, -Rc, -Rb2, -Rb3, -Rd, -Rg3, -F2, -Rh2; 15: salvianolic acid B; 34: cholic acid; 35: hyodeoxycholic acid;36: cinobufagin; 37: resibufogenin; 38: tanshinone I; 39: tanshinone IIA.
Fig. 4 Hierarchical clustering analysis of XXT samples.
RSC Advances Paper
Ope
n A
cces
s A
rtic
le. P
ublis
hed
on 1
0 M
arch
202
0. D
ownl
oade
d on
1/2
2/20
22 1
1:31
:12
AM
. T
his
artic
le is
lice
nsed
und
er a
Cre
ativ
e C
omm
ons
Attr
ibut
ion
3.0
Unp
orte
d L
icen
ce.
View Article Online
0.062268x22 � 0.003126x23 � 0.034273x24 � 0.049758x25 �0.079793x26 � 0.032436x27 � 0.065212x28 � 0.057417x29 �0.007182x30 � 0.034690x31 � 0.024183x32 � 0.037980x33 �0.065510x34 � 0.031718x35 � 0.064903x36 � 0.031920x37 �0.104891x38 � 0.046858x39 � 0.064089x40 � 0.041304x41. For
Table 1 The whole blood viscosity (WBV), plasma viscosity (PV), prothrom(APTT), and fibrinogen (FIB) results from rats (n ¼ 10)a
Group
WBV (mPa s; expressed at high, medium andlow shear rates)
PV (mPa s; 1210/s 60/s 120/s
N 6.9 � 0.9 5.6 � 0.4 4.8 � 0.4 1.27 � 0.08M 8.0 � 0.5## 6.1 � 0.4# 5.6 � 0.4# 1.8 � 0.3##
BCN 7.0 � 0.4** 5.4 � 0.5** 5.0 � 0.4* 1.4 � 0.2**S1 7.6 � 0.4 5.6 � 0.4* 5.2 � 0.4* 1.51 � 0.07*S2 7.3 � 0.8* 5.6 � 0.5* 5.2 � 0.5* 1.4 � 0.4*S3 7.2 � 0.5** 5.7 � 0.4 4.9 � 0.5** 1.4 � 0.5*S4 6.8 � 0.4** 5.4 � 0.4** 4.9 � 0.4** 1.3 � 0.3**S5 6.9 � 0.4** 5.5 � 0.5* 5.0 � 0.4** 1.4 � 0.4*S6 7.3 � 0.6** 5.7 � 0.3 5.2 � 0.2* 1.5 � 0.3*S7 6.9 � 0.5** 5.4 � 0.5** 5.0 � 0.5** 1.3 � 0.3**S8 7.1 � 0.3** 5.7 � 0.3* 5.2 � 0.3* 1.4 � 0.3**S9 7.3 � 0.6** 5.7 � 0.6 5.2 � 0.5 1.4 � 0.1**S10 7.3 � 0.5** 5.7 � 0.7 5.1 � 0.5* 1.4 � 0.3*
a Note: the data represent �x � s; compared with the M group, *p < 0.05; *
9592 | RSC Adv., 2020, 10, 9587–9600
APTT, the regression equation was: y1¼ 0.850803 + 0.007908x1 +0.000934x2 + 0.017923x3 + 0.006561x4 + 0.002443x5 �0.001710x6 + 0.003456x7 � 0.000827x8 + 0.000460x9 �0.000257x10 + 0.005686x11 + 0.001614x12 � 0.001372x13 +0.007149x14 + 0.008494x15 � 0.001897x16 + 0.001457x17 +0.004286x18 + 0.002549x19 + 0.002423x20 + 0.001829x21 +0.002505x22 � 0.000784x23 + 0.002143x24 + 0.005473x25 +0.005219x26 + 0.001997x27 + 0.006438x28 + 0.005219x29 +0.000965x30 + 0.002131x31 + 0.001857x32 + 0.003832x33 +0.005116x34 + 0.003100x35 + 0.006076x36 + 0.003142x37 +0.010447x38 + 0.004462x39 + 0.007674x40 + 0.003075x41.
The normalized regression coefficient maps of blood-activation were drawn with the regression equation coeffi-cients (Fig. 5). Except for chromatographic peaks P2 and P6, theother 39 peaks were all negatively related to WBV, indicatingthat as the levels of compounds represented by these peaksincreased, the WBV decreased. Except for peaks P6, P8, P10,P13, P16, and P23, all other peaks were positively related toAPTT. In addition, the signicance of the x-variables for the
bin time (PT), thrombin time (TT), activated partial thromboplastin time
0/s) PT (INR) TT (s) APTT (s) FIB (g L�1)
27 � 2 41 � 3 22 � 2 1.7 � 0.824.1 � 0.7## 35 � 1## 18.3 � 1.0## 3.7 � 0.5##
26.2 � 0.7** 40 � 1** 20 � 2** 2.4 � 0.8*23.8 � 0.8 36.2 � 0.2 18.6 � 0.3 2.2 � 0.8**24.8 � 0.7* 38 � 1** 20.1 � 0.6** 2.1 � 0.8**25.1 � 0.8* 38 � 1** 20 � 2** 2.9 � 0.8*26.7 � 0.7** 41 � 1** 21 � 1** 2.0 � 0.8**26.3 � 0.7** 40 � 1** 20 � 2* 2.0 � 0.8**24.9 � 0.7* 38 � 1** 18.8 � 0.6* 2.1 � 0.8**26.2 � 0.6** 40 � 1** 21.0 � 0.6** 2.0 � 0.8**25.3 � 0.8** 39 � 1** 21 � 2** 2.1 � 0.8**25.0 � 0.7* 38 � 1** 21 � 1** 2.1 � 0.8**24.9 � 0.7* 38 � 1** 20 � 2** 2.1 � 0.8**
*p < 0.01. Compared with the N group, #p < 0.05; ##p < 0.01.
This journal is © The Royal Society of Chemistry 2020
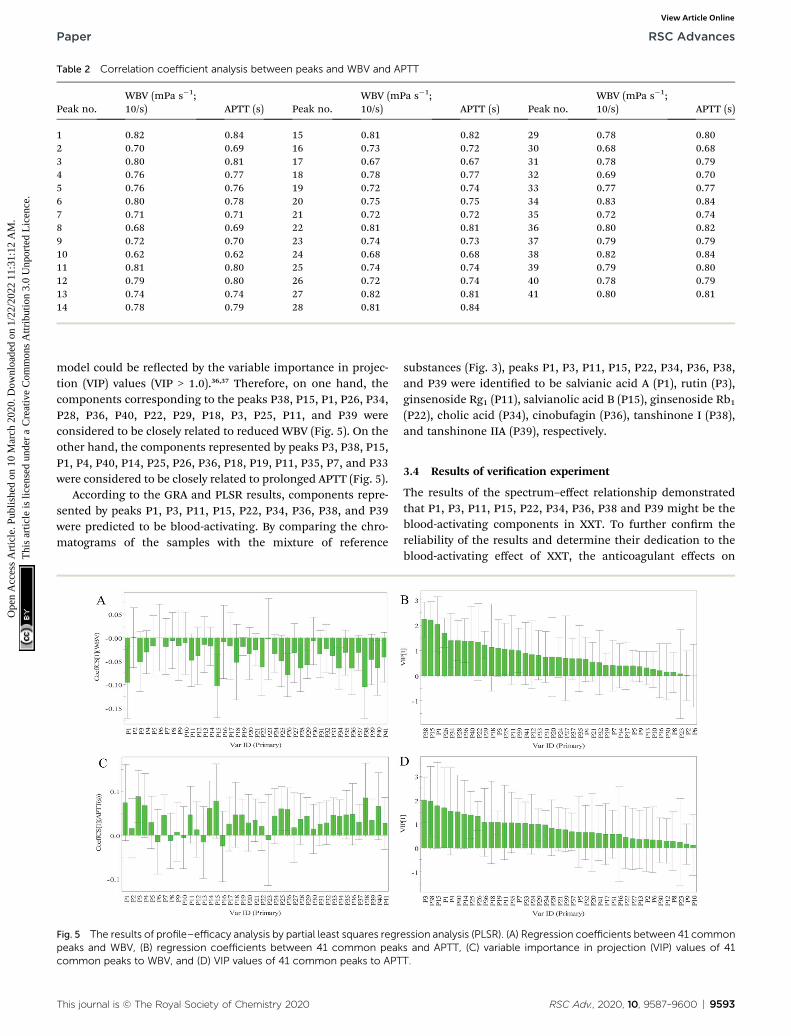
Table 2 Correlation coefficient analysis between peaks and WBV and APTT
Peak no.WBV (mPa s�1;10/s) APTT (s) Peak no.
WBV (mPa s�1;10/s) APTT (s) Peak no.
WBV (mPa s�1;10/s) APTT (s)
1 0.82 0.84 15 0.81 0.82 29 0.78 0.802 0.70 0.69 16 0.73 0.72 30 0.68 0.683 0.80 0.81 17 0.67 0.67 31 0.78 0.794 0.76 0.77 18 0.78 0.77 32 0.69 0.705 0.76 0.76 19 0.72 0.74 33 0.77 0.776 0.80 0.78 20 0.75 0.75 34 0.83 0.847 0.71 0.71 21 0.72 0.72 35 0.72 0.748 0.68 0.69 22 0.81 0.81 36 0.80 0.829 0.72 0.70 23 0.74 0.73 37 0.79 0.7910 0.62 0.62 24 0.68 0.68 38 0.82 0.8411 0.81 0.80 25 0.74 0.74 39 0.79 0.8012 0.79 0.80 26 0.72 0.74 40 0.78 0.7913 0.74 0.74 27 0.82 0.81 41 0.80 0.8114 0.78 0.79 28 0.81 0.84
Paper RSC Advances
Ope
n A
cces
s A
rtic
le. P
ublis
hed
on 1
0 M
arch
202
0. D
ownl
oade
d on
1/2
2/20
22 1
1:31
:12
AM
. T
his
artic
le is
lice
nsed
und
er a
Cre
ativ
e C
omm
ons
Attr
ibut
ion
3.0
Unp
orte
d L
icen
ce.
View Article Online
model could be reected by the variable importance in projec-tion (VIP) values (VIP > 1.0).36,37 Therefore, on one hand, thecomponents corresponding to the peaks P38, P15, P1, P26, P34,P28, P36, P40, P22, P29, P18, P3, P25, P11, and P39 wereconsidered to be closely related to reduced WBV (Fig. 5). On theother hand, the components represented by peaks P3, P38, P15,P1, P4, P40, P14, P25, P26, P36, P18, P19, P11, P35, P7, and P33were considered to be closely related to prolonged APTT (Fig. 5).
According to the GRA and PLSR results, components repre-sented by peaks P1, P3, P11, P15, P22, P34, P36, P38, and P39were predicted to be blood-activating. By comparing the chro-matograms of the samples with the mixture of reference
Fig. 5 The results of profile–efficacy analysis by partial least squares regrpeaks and WBV, (B) regression coefficients between 41 common peakcommon peaks to WBV, and (D) VIP values of 41 common peaks to APT
This journal is © The Royal Society of Chemistry 2020
substances (Fig. 3), peaks P1, P3, P11, P15, P22, P34, P36, P38,and P39 were identied to be salvianic acid A (P1), rutin (P3),ginsenoside Rg1 (P11), salvianolic acid B (P15), ginsenoside Rb1(P22), cholic acid (P34), cinobufagin (P36), tanshinone I (P38),and tanshinone IIA (P39), respectively.
3.4 Results of verication experiment
The results of the spectrum–effect relationship demonstratedthat P1, P3, P11, P15, P22, P34, P36, P38 and P39 might be theblood-activating components in XXT. To further conrm thereliability of the results and determine their dedication to theblood-activating effect of XXT, the anticoagulant effects on
ession analysis (PLSR). (A) Regression coefficients between 41 commons and APTT, (C) variable importance in projection (VIP) values of 41T.
RSC Adv., 2020, 10, 9587–9600 | 9593
RSC Advances Paper
Ope
n A
cces
s A
rtic
le. P
ublis
hed
on 1
0 M
arch
202
0. D
ownl
oade
d on
1/2
2/20
22 1
1:31
:12
AM
. T
his
artic
le is
lice
nsed
und
er a
Cre
ativ
e C
omm
ons
Attr
ibut
ion
3.0
Unp
orte
d L
icen
ce.
View Article Online
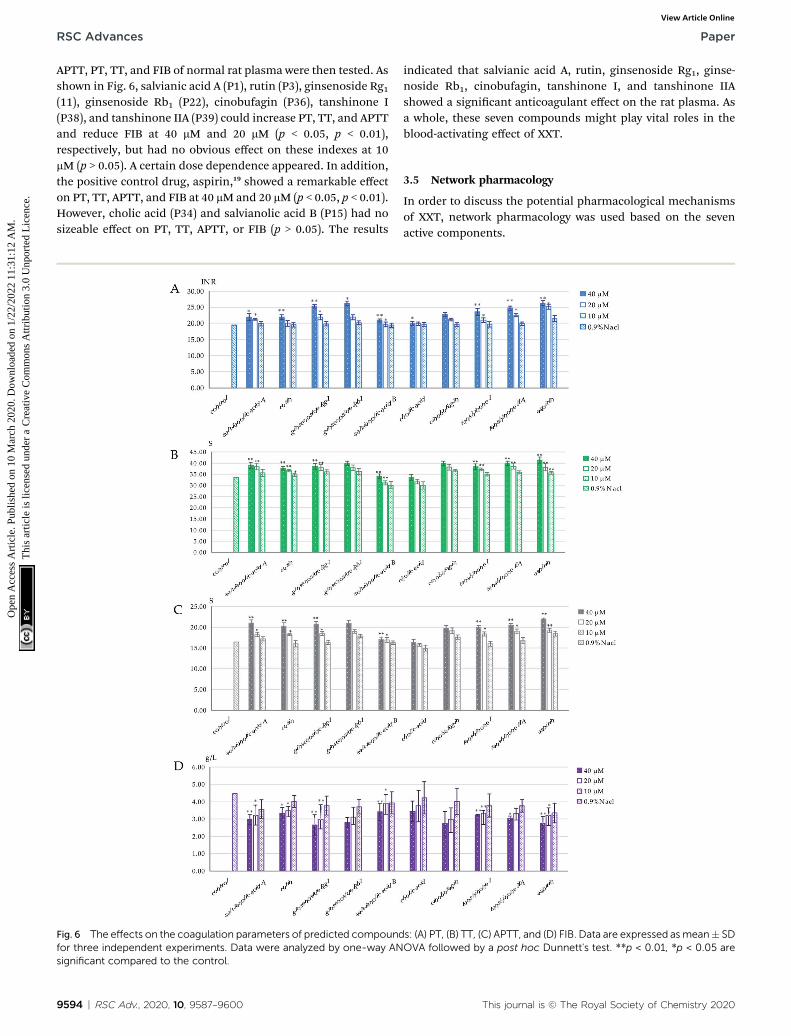
APTT, PT, TT, and FIB of normal rat plasma were then tested. Asshown in Fig. 6, salvianic acid A (P1), rutin (P3), ginsenoside Rg1(11), ginsenoside Rb1 (P22), cinobufagin (P36), tanshinone I(P38), and tanshinone IIA (P39) could increase PT, TT, and APTTand reduce FIB at 40 mM and 20 mM (p < 0.05, p < 0.01),respectively, but had no obvious effect on these indexes at 10mM (p > 0.05). A certain dose dependence appeared. In addition,the positive control drug, aspirin,19 showed a remarkable effecton PT, TT, APTT, and FIB at 40 mM and 20 mM (p < 0.05, p < 0.01).However, cholic acid (P34) and salvianolic acid B (P15) had nosizeable effect on PT, TT, APTT, or FIB (p > 0.05). The results
Fig. 6 The effects on the coagulation parameters of predicted compoundfor three independent experiments. Data were analyzed by one-way ANsignificant compared to the control.
9594 | RSC Adv., 2020, 10, 9587–9600
indicated that salvianic acid A, rutin, ginsenoside Rg1, ginse-noside Rb1, cinobufagin, tanshinone I, and tanshinone IIAshowed a signicant anticoagulant effect on the rat plasma. Asa whole, these seven compounds might play vital roles in theblood-activating effect of XXT.
3.5 Network pharmacology
In order to discuss the potential pharmacological mechanismsof XXT, network pharmacology was used based on the sevenactive components.
s: (A) PT, (B) TT, (C) APTT, and (D) FIB. Data are expressed asmean� SDOVA followed by a post hoc Dunnett's test. **p < 0.01, *p < 0.05 are
This journal is © The Royal Society of Chemistry 2020

Fig. 8 The Venn diagram of active ingredient targets (A) and bloodstasis-associated targets (B).
Paper RSC Advances
Ope
n A
cces
s A
rtic
le. P
ublis
hed
on 1
0 M
arch
202
0. D
ownl
oade
d on
1/2
2/20
22 1
1:31
:12
AM
. T
his
artic
le is
lice
nsed
und
er a
Cre
ativ
e C
omm
ons
Attr
ibut
ion
3.0
Unp
orte
d L
icen
ce.
View Article Online
3.5.1 Results of construction of networks3.5.1.1 The compound–target network. To understand the
complex interactions between the seven active compounds andtheir corresponding targets at a system level, we constructeda network (Fig. 7) based on the active compounds of XXT andtheir potential targets. This network contained 97 nodes and111 edges in total. In the network, each node size was propor-tional to its degree number. The blue parallelograms representthe seven active components, while the circled dots are thetargets. Each link represents the interaction between thecompound and the target. The targets of tanshinone IIA aregreater than 40. The targets of the other four compounds are allgreater than 10. The degree values of a node display the numberof routes connected to the node. The degree was ranked astanshinone IIA, salvianic acid A, rutin, tanshinone I, ginseno-side Rb1, ginsenoside Rg1 and cinobufagin. These targets arecomposed of eight cytokines, y-two enzymes, eleven G-protein-coupled receptors (GPCRs), two integrins, one ionchannel, three kinases, six nuclear receptors, and seven trans-porters. This highlights the critical roles of enzymes, kinase,and transporter.
3.5.1.2 The target–target network. The blood stasis-associated target proteins were obtained by searching data-bases. A Venn diagram of 48 core targets was then obtained byblood stasis-associated target intersecting with the abovetargets of active compounds (Fig. 8). The target–target networkwas constructed (Fig. 9) from the STRING database by upload-ing 48 core targets. In the target–target network, each noderepresents a protein target. Two proteins are linked if they aretargeted by the shared component. In the 48 targets, 46 have atleast one link to other targets: that is, they share compoundswith other targets. A large highly interconnected network, with46 nodes and 214 edges, was formed by most targets. The topthree targets according to degree were TNF, AKT1, and VEGFA.Combined with the betweenness centrality score, AKT1 wasselected as a potential key target protein for the treatment ofblood stasis.
3.5.2 GO enrichment and KEGG path enrichment analysis.The gene symbol IDs of the 48 core targets were transformed
Fig. 7 The active compound–target network.
This journal is © The Royal Society of Chemistry 2020
into 53 gene ensemble IDs with the Ensembl database. The 53genes were then uploaded to the OmicShare database for Goenrichment analysis. The GO function could be separated intothree categories: biological process, molecular function andcellular component. The top three enrichments in the biologicalprocess were cellular processes, responses to stimuli, and bio-logical regulation; the top three in the molecular function werebinding, molecular function regulation, and catalytic activity;and the top three in the cellular components were cell part, cell,and organelle (Fig. 10).
The 48 core targets were uploaded to the DAVID database toobtain 14 pathways related to blood stasis (p < 0.05), which werethen uploaded to the OmicShare database. A bubble map of theKEGG enrichment pathways of the core targets was obtained(Fig. 11). KEGG analysis demonstrated that multiple pathwayswere remarkably involved in the mechanism of XXT, includingcAMP, TNF, HIF-1, NF-kB, PI3K-Akt, sphingolipid, MAPK, VEGF,platelet activation, apoptosis, arachidonic acid, hematopoieticcell lineage, and NOD-like receptor signaling pathway.
Information on pathways and corresponding targets isshown in Table 3. An active compound–target–pathway networkmap was constructed (Fig. 12).
Fig. 9 The target–target network from the STRING database.
RSC Adv., 2020, 10, 9587–9600 | 9595
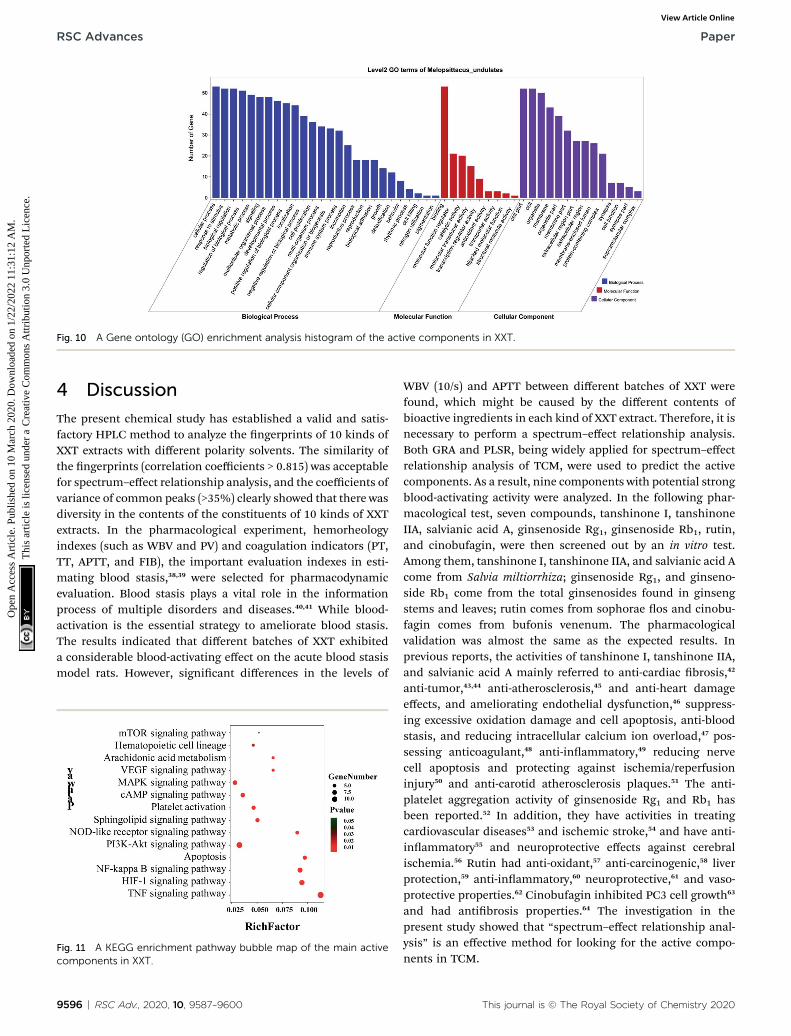
Fig. 10 A Gene ontology (GO) enrichment analysis histogram of the active components in XXT.
RSC Advances Paper
Ope
n A
cces
s A
rtic
le. P
ublis
hed
on 1
0 M
arch
202
0. D
ownl
oade
d on
1/2
2/20
22 1
1:31
:12
AM
. T
his
artic
le is
lice
nsed
und
er a
Cre
ativ
e C
omm
ons
Attr
ibut
ion
3.0
Unp
orte
d L
icen
ce.
View Article Online
4 Discussion
The present chemical study has established a valid and satis-factory HPLC method to analyze the ngerprints of 10 kinds ofXXT extracts with different polarity solvents. The similarity ofthe ngerprints (correlation coefficients > 0.815) was acceptablefor spectrum–effect relationship analysis, and the coefficients ofvariance of common peaks (>35%) clearly showed that there wasdiversity in the contents of the constituents of 10 kinds of XXTextracts. In the pharmacological experiment, hemorheologyindexes (such as WBV and PV) and coagulation indicators (PT,TT, APTT, and FIB), the important evaluation indexes in esti-mating blood stasis,38,39 were selected for pharmacodynamicevaluation. Blood stasis plays a vital role in the informationprocess of multiple disorders and diseases.40,41 While blood-activation is the essential strategy to ameliorate blood stasis.The results indicated that different batches of XXT exhibiteda considerable blood-activating effect on the acute blood stasismodel rats. However, signicant differences in the levels of
Fig. 11 A KEGG enrichment pathway bubble map of the main activecomponents in XXT.
9596 | RSC Adv., 2020, 10, 9587–9600
WBV (10/s) and APTT between different batches of XXT werefound, which might be caused by the different contents ofbioactive ingredients in each kind of XXT extract. Therefore, it isnecessary to perform a spectrum–effect relationship analysis.Both GRA and PLSR, being widely applied for spectrum–effectrelationship analysis of TCM, were used to predict the activecomponents. As a result, nine components with potential strongblood-activating activity were analyzed. In the following phar-macological test, seven compounds, tanshinone I, tanshinoneIIA, salvianic acid A, ginsenoside Rg1, ginsenoside Rb1, rutin,and cinobufagin, were then screened out by an in vitro test.Among them, tanshinone I, tanshinone IIA, and salvianic acid Acome from Salvia miltiorrhiza; ginsenoside Rg1, and ginseno-side Rb1 come from the total ginsenosides found in ginsengstems and leaves; rutin comes from sophorae os and cinobu-fagin comes from bufonis venenum. The pharmacologicalvalidation was almost the same as the expected results. Inprevious reports, the activities of tanshinone I, tanshinone IIA,and salvianic acid A mainly referred to anti-cardiac brosis,42
anti-tumor,43,44 anti-atherosclerosis,45 and anti-heart damageeffects, and ameliorating endothelial dysfunction,46 suppress-ing excessive oxidation damage and cell apoptosis, anti-bloodstasis, and reducing intracellular calcium ion overload,47 pos-sessing anticoagulant,48 anti-inammatory,49 reducing nervecell apoptosis and protecting against ischemia/reperfusioninjury50 and anti-carotid atherosclerosis plaques.51 The anti-platelet aggregation activity of ginsenoside Rg1 and Rb1 hasbeen reported.52 In addition, they have activities in treatingcardiovascular diseases53 and ischemic stroke,54 and have anti-inammatory55 and neuroprotective effects against cerebralischemia.56 Rutin had anti-oxidant,57 anti-carcinogenic,58 liverprotection,59 anti-inammatory,60 neuroprotective,61 and vaso-protective properties.62 Cinobufagin inhibited PC3 cell growth63
and had antibrosis properties.64 The investigation in thepresent study showed that “spectrum–effect relationship anal-ysis” is an effective method for looking for the active compo-nents in TCM.
This journal is © The Royal Society of Chemistry 2020
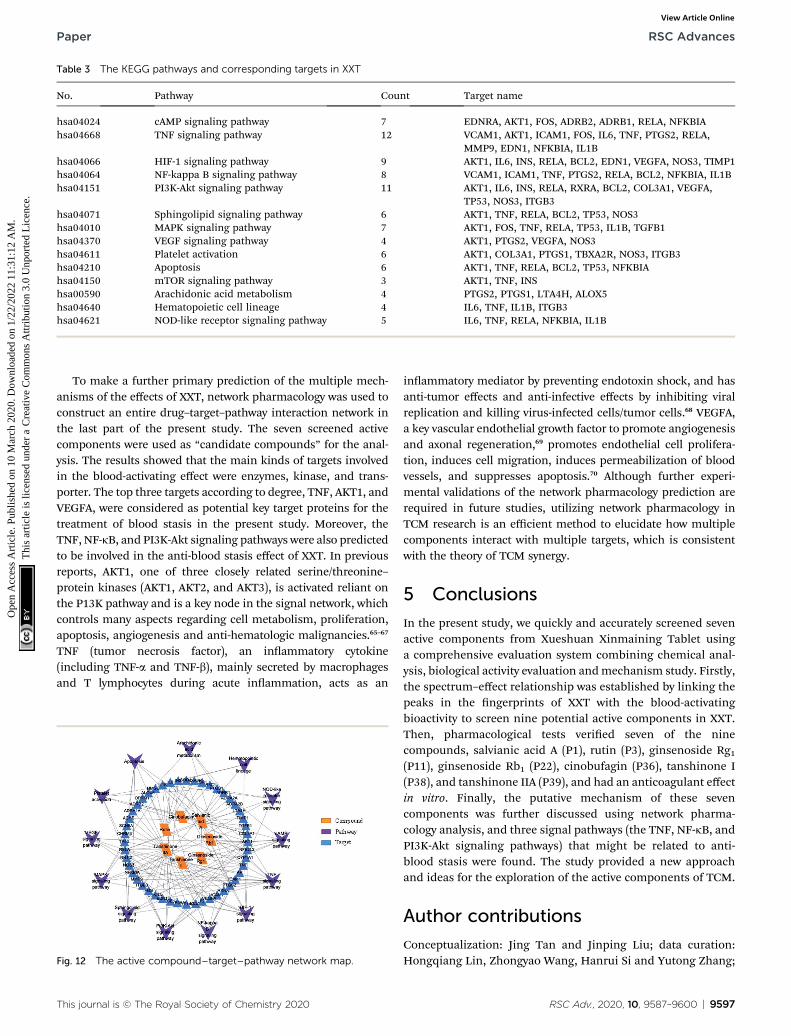
Table 3 The KEGG pathways and corresponding targets in XXT
No. Pathway Count Target name
hsa04024 cAMP signaling pathway 7 EDNRA, AKT1, FOS, ADRB2, ADRB1, RELA, NFKBIAhsa04668 TNF signaling pathway 12 VCAM1, AKT1, ICAM1, FOS, IL6, TNF, PTGS2, RELA,
MMP9, EDN1, NFKBIA, IL1Bhsa04066 HIF-1 signaling pathway 9 AKT1, IL6, INS, RELA, BCL2, EDN1, VEGFA, NOS3, TIMP1hsa04064 NF-kappa B signaling pathway 8 VCAM1, ICAM1, TNF, PTGS2, RELA, BCL2, NFKBIA, IL1Bhsa04151 PI3K-Akt signaling pathway 11 AKT1, IL6, INS, RELA, RXRA, BCL2, COL3A1, VEGFA,
TP53, NOS3, ITGB3hsa04071 Sphingolipid signaling pathway 6 AKT1, TNF, RELA, BCL2, TP53, NOS3hsa04010 MAPK signaling pathway 7 AKT1, FOS, TNF, RELA, TP53, IL1B, TGFB1hsa04370 VEGF signaling pathway 4 AKT1, PTGS2, VEGFA, NOS3hsa04611 Platelet activation 6 AKT1, COL3A1, PTGS1, TBXA2R, NOS3, ITGB3hsa04210 Apoptosis 6 AKT1, TNF, RELA, BCL2, TP53, NFKBIAhsa04150 mTOR signaling pathway 3 AKT1, TNF, INShsa00590 Arachidonic acid metabolism 4 PTGS2, PTGS1, LTA4H, ALOX5hsa04640 Hematopoietic cell lineage 4 IL6, TNF, IL1B, ITGB3hsa04621 NOD-like receptor signaling pathway 5 IL6, TNF, RELA, NFKBIA, IL1B
Paper RSC Advances
Ope
n A
cces
s A
rtic
le. P
ublis
hed
on 1
0 M
arch
202
0. D
ownl
oade
d on
1/2
2/20
22 1
1:31
:12
AM
. T
his
artic
le is
lice
nsed
und
er a
Cre
ativ
e C
omm
ons
Attr
ibut
ion
3.0
Unp
orte
d L
icen
ce.
View Article Online
To make a further primary prediction of the multiple mech-anisms of the effects of XXT, network pharmacology was used toconstruct an entire drug–target–pathway interaction network inthe last part of the present study. The seven screened activecomponents were used as “candidate compounds” for the anal-ysis. The results showed that the main kinds of targets involvedin the blood-activating effect were enzymes, kinase, and trans-porter. The top three targets according to degree, TNF, AKT1, andVEGFA, were considered as potential key target proteins for thetreatment of blood stasis in the present study. Moreover, theTNF, NF-kB, and PI3K-Akt signaling pathways were also predictedto be involved in the anti-blood stasis effect of XXT. In previousreports, AKT1, one of three closely related serine/threonine–protein kinases (AKT1, AKT2, and AKT3), is activated reliant onthe P13K pathway and is a key node in the signal network, whichcontrols many aspects regarding cell metabolism, proliferation,apoptosis, angiogenesis and anti-hematologic malignancies.65–67
TNF (tumor necrosis factor), an inammatory cytokine(including TNF-a and TNF-b), mainly secreted by macrophagesand T lymphocytes during acute inammation, acts as an
Fig. 12 The active compound–target–pathway network map.
This journal is © The Royal Society of Chemistry 2020
inammatory mediator by preventing endotoxin shock, and hasanti-tumor effects and anti-infective effects by inhibiting viralreplication and killing virus-infected cells/tumor cells.68 VEGFA,a key vascular endothelial growth factor to promote angiogenesisand axonal regeneration,69 promotes endothelial cell prolifera-tion, induces cell migration, induces permeabilization of bloodvessels, and suppresses apoptosis.70 Although further experi-mental validations of the network pharmacology prediction arerequired in future studies, utilizing network pharmacology inTCM research is an efficient method to elucidate how multiplecomponents interact with multiple targets, which is consistentwith the theory of TCM synergy.
5 Conclusions
In the present study, we quickly and accurately screened sevenactive components from Xueshuan Xinmaining Tablet usinga comprehensive evaluation system combining chemical anal-ysis, biological activity evaluation andmechanism study. Firstly,the spectrum–effect relationship was established by linking thepeaks in the ngerprints of XXT with the blood-activatingbioactivity to screen nine potential active components in XXT.Then, pharmacological tests veried seven of the ninecompounds, salvianic acid A (P1), rutin (P3), ginsenoside Rg1(P11), ginsenoside Rb1 (P22), cinobufagin (P36), tanshinone I(P38), and tanshinone IIA (P39), and had an anticoagulant effectin vitro. Finally, the putative mechanism of these sevencomponents was further discussed using network pharma-cology analysis, and three signal pathways (the TNF, NF-kB, andPI3K-Akt signaling pathways) that might be related to anti-blood stasis were found. The study provided a new approachand ideas for the exploration of the active components of TCM.
Author contributions
Conceptualization: Jing Tan and Jinping Liu; data curation:Hongqiang Lin, Zhongyao Wang, Hanrui Si and Yutong Zhang;
RSC Adv., 2020, 10, 9587–9600 | 9597

RSC Advances Paper
Ope
n A
cces
s A
rtic
le. P
ublis
hed
on 1
0 M
arch
202
0. D
ownl
oade
d on
1/2
2/20
22 1
1:31
:12
AM
. T
his
artic
le is
lice
nsed
und
er a
Cre
ativ
e C
omm
ons
Attr
ibut
ion
3.0
Unp
orte
d L
icen
ce.
View Article Online
formal analysis: Han Wang; funding acquisition: Pingya Li;investigation: Han Wang and Ying Zhang; methodology: HanWang; project administration: Junli Liu; resources: Ying Zhang;soware: Hongqiang Lin; supervision: Junli Liu and JinpingLiu; validation: Kai Sun; visualization: Hanrui Si and YutongZhang; writing–original dra: Jing Tan; writing–review & edit-ing: Jinping Liu and Kai Sun.
Conflicts of interest
The authors declare that there are no conicts of interest.
Acknowledgements
This research was nancially supported by the BiomedicineSpecial Foundation for Government–University CooperationProject of Jilin Province [No. SXGJSF2017-1-1-(02)], and CollegeStudents Innovation and Entrepreneurship Training Project ofJilin University [No. 201910183947]. We thank Fang Wang andother workers at the Research Center of Natural Drug andDepartment of Pathogen Biology, College of Basic MedicalSciences in Jilin University for help with pharmacologic veri-cation and multivariate statistical analysis.
References
1 X. T. Zhang, C. Zhang, J. Y. Sai, F. Li, J. P. Liu and P. Y. Li,Xueshuan Xinmaining Tablet Treats Blood Stasis throughRegulating the Expression of F13a1, Car1, and Tbxa2r,Evid.-Based Complementary Altern. Med., 2015, 1–8.
2 X. Zhao, D. Sui, X. Yu, S. C. Qu and H. L. Xu, Protective effectand mechanism of Xueshuan Xinmaining tablets on acutemyocardial infarction, Chin. J. Integr. Med., 2008, 6, 177–179.
3 J. Liu, S. Qu, X. Yu, H. Xu and D. S, Te protective effect of ofXueshuan Xinmaining tablets on experimental cerebralischemia in rats, Chin. J. Integr. Med., 2011, 9, 333–334.
4 L. X. Xiong, J. S. Xie, C. X. Song, J. P. Liu, J. T. Zheng,C. G. Liu, X. T. Zhang, P. Y. Li and F. Wang, The Activationof Nrf2 and Its Downstream Regulated Genes Mediates theAntioxidative Activities of Xueshuan Xinmaining Tablet inHuman Umbilical Vein Endothelial Cells, Evid.-BasedComplementary Altern. Med., 2015, (22), 1–7.
5 J. Tan, C. Z. Wang, H. L. Zhu, B. S. Zhou, L. X. Xiong,F. Wang, J. P. Liu and P. Y. Li, ComprehensiveMetabolomics Analysis of Xueshuan Xinmaining Tablet inBlood Stasis Model Rats Using UPLC–Q/TOF–MS,Molecules, 2018, 23(7), 1650–1665.
6 J. Tan, H. Q. Lin, Y. H. Liu, H. Wang, Q. H. Dong, F. L. Wu,C. G. Liu, P. Y. Li and J. P. Liu, Components analysis ofXueshuan Xinmaining tablets based on UPLC–Q–TOF MS,J. Chin. Mass Spectrom. Soc., 2019, 40(03), 244–252.
7 J. X. Cui, J. F. Cui, W. X. Hong and H. B. Gao, Research onconstruction of standard TCM ngerprints based on multi–parameter distance clustering theories, Gaojishu Tongxun,2014, 24(1), 99–103.
8 H. M. Tang, Y. M. Luo, Y. Yan, Q. L. Liang, X. S. Meng andG. A. Luo, Research Method of Traditional Chinese
9598 | RSC Adv., 2020, 10, 9587–9600
Medicine Fingerprint Based on Diode–array Detector,Chem. J. Chin. Univ., 2009, 30(2), 279–282.
9 X. H. Fan, Z. L. Ye and Y. Y. Cheng, A computational methodbased on information fusion for evaluating the similarity ofmultiple chromatographic ngerprints of TCM, Chem. J.Chin. Univ., 2006, 27(1), 26–29.
10 H. J. Hu, L. F. Lin, Y. L. Liu, J. Z. Zhu, C. G. Liu and Q. F. Gong,Study on UPLC–PDA Fingerprint of Xueshuan XinmainingTablets, Chin. Tradit. Herb. Drugs, 2017, 48(20), 4268–4274.
11 J. Qi and B. y. Yu, A New Mode of Quality Evaluation ofTraditional Chinese Medicine–“Special EfficiencyIntegrated Fingerprint Spectrum” Research progress, Chin.J. Nat. Med., 2010, 8(3), 171–176.
12 L. Wang, Z. Jiang, P. Xiao, J. Sun, Z. Bi and E. Liu,Identication of anti–inammatory components inSinomenii Caulis based on spectrum–effect relationshipand chemometric methods, J. Pharm. Biomed. Anal., 2019,167, 38–48.
13 S. F. Liu, Y. J. Yang and J. Forrest, Introduction to GreySystems modeling soware, Grey Data Analysis, 2016, pp.285–299.
14 F. Hu, Y. L. Yang, X. H. Liu, R. J. Zhu, C. Li and S. L. Feng,The spectrum of the efficacy of Buzhong Yiqi PillsRelationship study, China Pharm., 2014, 25(3), 195–198.
15 H. Y. Fang, H. W. Zeng, L. M. Lin, X. Chen, X. N. Shen, P. Fu,C. Lv, Q. Liu, R. H. Liu, W. D. Zhang, et al., A network–basedmethod for mechanistic investigation of Shexiang BaoxinPill's treatment of cardiovascular diseases, Sci. Res., 2017,7, 43632–43642.
16 J. Zhao, P. Y. Yang, F. Li, L. Tao, H. Ding, Y. C. Rui, Z. W. Cao,W. D. Zhang, et al., Therapeutic Effects of Astragaloside IVon Myocardial Injuries: Multi–Target Identication andNetwork Analysis, PLoS One, 2012, 7(9), 44938–44948.
17 M. Q. Liu, Y. J. Wu, S. S. Huang, H. G. Liu and J. Feng,Spectrum–effect relationship between HPLC ngerprintsand hypolipidemic effect of Curcuma aromatica, Biomed.Chromatogr., 2018, 32(7), 1–7.
18 Y. Han, J. Wen, T. Zhou and G. Fan, Chemical ngerprintingof Gardenia jasminoides Ellis by HPLC–DAD–ESI–MScombined with chemometrics methods, Food Chem., 2015,188, 648–657.
19 B. Zhuang, Z. M. Bi, Z. Y. Wang, L. Duan, C. J. S. Lai andE. H. Liu, Chemical proling and quantitation of bioactivecompounds in Platycladi Cacumen by UPLC-Q-TOF-MS/MSand UPLC–DAD, J. Pharm. Biomed. Anal., 2018, 154, 207–215.
20 S. Su, J. Duan, W. Cui, E. Shang, P. Liu, G. Bai, S. Guo,D. W. Qian and Y. P. Tian, Network–based biomarkers forcold coagulation blood stasis syndrome and thetherapeutic effects of shaofu zhuyu decoction in rats, J.Evidence-Based Complementary Altern. Med., 2013, 2013, 1–15.
21 X. Dang, J. J. Miao, A. Q. Chen, P. Li, J. R. Liang, R. M. Xie andY. Zhao, The antithrombotic effect of RSNK in blood–stasismodel rats, J. Ethnopharmacol., 2015, 173, 266–272.
22 N. Li, W. Mao, M. Yan, X. Liu, Z. Xia, S. Y. Wang, B. Xiao,C. L. Chen, L. F. Zhang and S. J. Cao, Structuralcharacterization and anticoagulant activity of a sulfated
This journal is © The Royal Society of Chemistry 2020
Paper RSC Advances
Ope
n A
cces
s A
rtic
le. P
ublis
hed
on 1
0 M
arch
202
0. D
ownl
oade
d on
1/2
2/20
22 1
1:31
:12
AM
. T
his
artic
le is
lice
nsed
und
er a
Cre
ativ
e C
omm
ons
Attr
ibut
ion
3.0
Unp
orte
d L
icen
ce.
View Article Online
polysaccharide from the green alga Codium divaricatum,Carbohydr. Polym., 2015, 121, 175–182.
23 L. Tang, Y. Chen, Z. Jiang, Z. B. Jiang, S. P. Zhong,F. C. Zheng and G. G. Shi, Purication, partialcharacterization and bioactivity of sulfated polysaccharidesfrom Grateloupia livida, Int. J. Biol. Macromol., 2017, 94(PtA), 642–652.
24 S. Gao, H. Chen and X. Zhou, Study on the spectrum–effectrelationship of the xanthine oxidase inhibitory activity ofLigustrum lucidum, J. Sep. Sci., 2019, 42, 3281–3292.
25 W. Li, X. Sun, B. Liu, L. H. Zhang, Z. Q. Fan and Y. B. Ji,Screening and identication of hepatotoxic component inEvodia rutaecarpa based on spectrum–effect relationshipand UPLC-Q-TOFMS, Biomed. Chromatogr., 2016, 30(12),1975–1983.
26 L. B. Abhang and M. Hameedullah, Determination ofoptimum parameters for multi-performance characteristicsin turning by using gray relational analysis, Int. J. Adv. Des.Manuf. Technol., 2012, 63(1), 13–24.
27 T. T. Zhu, L. Wu, X. L. Wang, L. Wu, X. L. Wang, Q. G. Zhou,X. Liu and B. C. Cai, Investigation on relationships betweenchemical spectrum and bioeffect of prepared rhubarbdecoction in rats by UPLC-ESI-Q-TOF-MS method coupledwith gray correlation analysis, J. Funct. Foods, 2017, 31,104–112.
28 T. Kuo, A review of some modied grey relational analysismodels, J. Grey Syst., 2017, 29(3), 70–77.
29 W. T. Zhu, L. Z. Duan, J. P. Zhang, Y. Y. Shi and Y. J. Qiao,Constructing a competitiveness evaluation system of listedChinese medicine enterprises based on grey correlation, J.Grey Syst., 2015, 27, 40–51.
30 M. D. MA, X. J. MA, Y. Z. XIE and T. Ma, Analysis therelationship between ecological footprint (EF) of ningxiaand inuencing factors: Partial Least-Squares Regression(PLS), J. Ecol., 2014, 34(03), 682–689.
31 X. Chang, M. Yu, C. Zhou, H. M. Jia and Z. M. Zou,Spectrum–effect relationship of Chaihu–Shu–Gan–San forantidepressant effect based on partial least squaresregression analysis, Eur. J. Integr. Med., 2014, 6(6), 742–743.
32 F. A. Molfetta, A. T. Bruni, F. P. Rosselli and A. B. F. da Silva,A partial least squares and principal component regressionstudy of quinone compounds with trypanocidal activity,Struct. Chem., 2007, 18(1), 49–57.
33 M. Wang, M. Chen, Y. Ding, Z. H. Zhu, Y. K. Zhang, P. F. Wei,J. W. Wang, Y. Qiao, L. Li and Y. W. Li, Pretreatment with b-Boswellic Acid Improves Blood Stasis Induced EndothelialDysfunction: Role of eNOS Activation, Sci. Rep., 2015, 5,15357–15367.
34 Y. L. Wang, Q. Zhang, S. J. Yin, L. Cai, Y. X. Yang, W. J. Liu,Y. J. Hu, H. Chen and F. Q. Yang, Screening of blood–activating active components from Danshen–Honghuaherbal pair by spectrum–effect relationship analysis,Phytomedicine, 2018, 54, 149–158.
35 C. Wu, L. Lu, S. Liang, C. Chen and S. M. Wang, Applicationof drug–target prediction technology in networkpharmacology of traditional Chinese medicine, China J.Chin. Mater. Med., 2016, 41(3), 377–382.
This journal is © The Royal Society of Chemistry 2020
36 W. J. Li, Y. Zhang, S. J. Shi, G. Yang, Z. H. Liu, J. M. Wang andW. Y. Kang, Spectrum–effect relationship of antioxidant andtyrosinase activity with Malus pumila owers by UPLC–MS/MS and component knock–out method, Food Chem.Toxicol., 2019, 133, 110754–110772.
37 Q. Fan, R. J. Yang, F. X. Yang, P. F. Xia and L. Zhao,Spectrum–effect relationship between HPLC ngerpintsand antioxidant activity of Angelica sinensis, Biomed.Chromatogr., 2019, 34(2), DOI: 10.1002/bmc.4707.
38 H. Xu and K. J. Chen, Practical diagnostic criterion of bloodstasis syndrome, Chin. J. Integr. Med., 2017, 23(4), 243–244.
39 J. Wang, X. J. Xiong and B. Feng, Aspirin resistance andpromoting blood circulation and removing blood stasis:Current situation and prospectives, Evid.-BasedComplementary Altern. Med., 2014, 2014, 1–11.
40 F. L. Liao and J. Cao, Biomechanopharmacology inevaluation of herbs of Activating blood circulation toremove blood stasis, Chin. J. Biomed. Eng., 2005, 14(2), 47–54.
41 Y. Lu, Y. L. Hu, X. F. Kong and D. Y. Wang, Selection ofcomponent drug in activating blood ow and removingblood stasis of Chinese herbal medicinal formula for dairycow mastitis by hemorheological method, J.Ethnopharmacol., 2008, 116(2), 313–317.
42 B. Jiang, D. Li, Y. Deng, F. Teng, J. Chen, S. Xue, X. Kong,C. Luo, X. Shen, H. Jiang, et al., Salvianolic acid A, a novelmatrix metalloproteinase–9 inhibitor, prevents cardiacremodeling in spontaneously hypertensive rats, PLoS One,2013, 8(3), e59621.
43 I. T. Nizamutdinova, G. W. Lee, J. S. Lee, M. K. Cho,K. H. Son, S. J. Jeon, S. S. Kang, Y. S. Kim, J. H. Lee,H. G. Seo, et al., Tanshinone I suppresses growth andinvasion of human breast cancer cells, MDA–MB–231,through regulation of adhesion molecules, Carcinogenesis,2008, 29(10), 1885–1892.
44 B. X. Ren, Y. Ji, J. C. Tang, D. P. Sun, X. Hui, D. Q. Yang andX. L. Zhu, Effect of Tanshinone IIA intrathecal injections onpain and spinal inammation in mice with bone tumors,GMR, Genet. Mol. Res., 2015, 14(1), 2133–2138.
45 Y. Xuan, Y. Gao, H. Huang, X. Wang, Y. Cai and Q. X. Luan,Tanshinone IIA Attenuates Atherosclerosis inApolipoprotein E Knockout Mice Infected withPorphyromonas gingivalis, Inammation, 2017, 40(5), 1631–1642.
46 G. Lei, P. M. Siu, S. W. Chan and C. W. K. Lai, CardiovascularProtective Effects of Salvianic Acid A on Mice with ElevatedHomocysteine Level, Oxid. Med. Cell. Longevity, 2017, 1–10.
47 Y. Li, H. F. Wan, W. F. Wan, J. H. Yang, C. Li, L. L. Dai,L. J. Ge, H. F. Zhou, H. T. Wan and Y. He, Protectiveeffects of effective ingredients of Danshen(Radix SalviaeMiltiorrhizae) and Honghua(Flos Carthami) compatibilityaer rat hippocampal neurons induced by hypoxia injury,J. Tradit. Chin. Med., 2018, 38(5), 29–41.
48 L. C. Wu, X. Lin and H. Sun, Tanshinone IIA protects rabbitsagainst LPS–induced disseminated intravascularcoagulation (DIC), Acta Pharmacol. Sin., 2012, 33, 1254–1259.
49 G. W. Fan, X. M. Gao, H. Wang, Y. Zhu, J. Zhang, L. M. Hu,Y. F. Su, L. Y. Kang and B. L. Zhang, The anti-inammatory
RSC Adv., 2020, 10, 9587–9600 | 9599

RSC Advances Paper
Ope
n A
cces
s A
rtic
le. P
ublis
hed
on 1
0 M
arch
202
0. D
ownl
oade
d on
1/2
2/20
22 1
1:31
:12
AM
. T
his
artic
le is
lice
nsed
und
er a
Cre
ativ
e C
omm
ons
Attr
ibut
ion
3.0
Unp
orte
d L
icen
ce.
View Article Online
activities of Tanshinone IIA, an active component of TCM,are mediated by estrogen receptor activation andinhibition of iNOS, J. Steroid Biochem. Mol. Biol., 2009, 113,275–280.
50 L. Zhang, W. Gan and G. An, Inuence of Tanshinone IIA onheat shock protein 70, Bcl–2 and Bax expression in rats withspinal ischemia/reperfusion injury, Neural Regener. Res.,2012, 7(36), 2882–2888.
51 J. Jin, L. Liu and Z. H. Li, Effects of Tanshinone on CarotidAtherosclerosis Plaques and Serum hs–CRP Level inPatients with Blood–stasis Syndrome, Acta Chin. Med.Pharmacol., 2012, 40(3), 69–71.
52 Q. Zhou, L. Jiang, C. Xu, D. Luo, C. Zeng, P. Liu, M. Yue,Y. Liu, X. Hu and H. Hu, Ginsenoside Rg1 inhibits plateletactivation and arterial thrombosis, Thromb. Res., 2014,133(1), 57–65.
53 Y. Sun, Y. Liu and K. Chen, Roles and mechanisms ofginsenoside in cardiovascular diseases: progress andperspectives, Sci. China: Life Sci., 2016, 59(3), 292–298.
54 C. L. Xie, W. W. Wang, X. D. Xue, S. F. Zhang, J. Gan andZ. G. Liu, A systematic review and meta-analysis ofGinsenoside–Rg1 (G–Rg1) in experimental ischemic stroke,Sci. Rep., 2015, 5, 7790–7798.
55 W. Cheng, D. Wu, Q. Zuo, Z. Wang and W. Fan, GinsenosideRb1 prevents interleukin–1 beta induced inammation andapoptosis in human articular chondrocytes, Int. Orthop.,2013, 37(10), 2065–2070.
56 X. S. Zeng, X. S. Zhou, F. C. Luo, J. J. Jia, L. Qi, Z. X. Yang,W. Zhang and J. Bai, Comparative analysis of theneuroprotective effects of ginsenosides Rg1 and Rb1extracted from, Panax notoginseng, against cerebralischemia, Can. J. Physiol. Pharmacol., 2014, 92(2), 102–108.
57 B. Zhao, W. J. Zhang, Y. X. Xiong, Y. Zhang, L. Jia and X. Xu,Rutin protects human periodontal ligament stem cells fromTNF-a induced damage to osteogenic differentiationthrough suppressing mTOR signaling pathway ininammatory environment, Arch. Oral Biol., 2020, 109,104584–104591.
58 J. Yang, J. Guo and J. Yuan, In vitro antioxidant properties ofrutin, LWT–Food Sci. Technol., 2008, 41(6), 1060–1066.
59 F. E. Deschner, Quercetin and rutin as inhibitors ofazoxymethanol–induced colonic neoplasia, Carcinogenesis,1991, 12(7), 1193–1196.
60 K. H. Janbaz, S. A. Saeed and A. H. Gilani, Protective effect ofrutin on paracetamol– and CCl4–induced hepatotoxicity inrodents, Fitoterapia, 2002, 73(7–8), 557–563.
9600 | RSC Adv., 2020, 10, 9587–9600
61 H. Javed, M. M. Khan, A. Ahmad, K. Vaibhav, M. E. Ahmad,A. Khan, M. Ashafaq, F. Islam, M. S. Siddiqui, M. M. Sai,et al., Rutin prevents cognitive impairments byameliorating oxidative stress and neuroinammation in ratmodel of sporadic dementia of Alzheimer type,Neuroscience, 2012, 17, 340–352.
62 F. Mellou, H. Loutrari, H. Stamatis, C. Roussos andF. N. Kolisis, Enzymatic esterication of avonoids withunsaturated fatty acids: effect of the novel esters onvascular endothelial growth factor release from K562 cells,Process Biochem., 2006, 41, 2029–3204.
63 T. L. Niu, L. Y. Zhao, X. Y. Lin, Y. K. Cai, S. H. Chen,M. K. Wang, L. Zhou, H. Y. Ding, X. H. Yu and G. Z. Qin,Cinobufagin, a bufadienolide from traditional Chinesemedicine Bufo bufo gargarizans CANTOR, inhibits PC3 cellgrowth in vitro and in vivo, J. Trad. Chin. Med. Sci., 2019,6(2), 175–183.
64 X. H. Li, B. Zhun, S. S. Liu, S. Gao, Y. Cui, K. Huang,M. Huang, J. Mao, L. Li, J. Gao, et al., AntibroticMechanism of Cinobufagin in Bleomycin–InducedPulmonary Fibrosis in Mice, Front. Pharmacol., 2019, 10, 1–14.
65 B. R. Davies, H. Greenwood, P. Dudley, C. Craer, D. H. Yu,J. Zhang, J. Li, B. Gao, Q. Ji, J. Maynard, et al., PreclinicalPharmacology of AZD5363, an Inhibitor of AKT:Pharmacodynamics, Antitumor Activity, and Correlation ofMonotherapy Activity with Genetic Background, Mol.Cancer Ther., 2012, 11(4), 873–887.
66 D. A. Altomare and J. R. Testa, Perturbations of the AKTsignaling pathway in human cancer, Oncogene, 2005, 24,7455–7464.
67 A. Bellacosa, C. C. Kumar, C. A. Di and J. R. Testa, Activationof AKT kinases in cancer: implications for therapeutictargeting, Adv. Cancer Res., 2005, 94, 29–86.
68 H. T. Idriss and J. H. Naismith, TNFa and the TNF receptorsuperfamily: Structure–function relationship(s), Microsc.Res. Tech., 2000, 50(3), 184–195.
69 N. A. Stefanova, K. Y. Maksimova, E. A. Rudnitskaya,N. A. Muraleva and N. G. Kolosova, Association ofcerebrovascular dysfunction with the development ofAlzheimer's disease–like pathology in OXYS rats, BMCGenomics, 2018, 19(S3), 75.
70 B. Jiang, Y. Zhang, C. She, J. Zhao, K. Zhou, Z. Zuo, X. Zhou,P. Wang and Q. Dong, Xray irradiation has positive effectsfor the recovery of peripheral nerve injury maybe throughthe vascular smooth muscle contraction signaling pathway,Environ. Toxicol. Pharmacol., 2017, 54, 177–183.
This journal is © The Royal Society of Chemistry 2020