identification of damaged wheat kernels … · time-frequency indices from the training data by...
TRANSCRIPT

Transactions of the ASABE
Vol. 51(4): 1461-1469 2008 American Society of Agricultural and Biological Engineers ISSN 0001−2351 1461
IDENTIFICATION OF DAMAGED WHEAT KERNELS AND CRACKED-SHELL HAZELNUTS WITH
IMPACT ACOUSTICS TIME-FREQUENCY PATTERNS
N. F. Ince, I. Onaran, T. Pearson, A. H. Tewfik, A. E. Cetin, H. Kalkan, Y. Yardimci
ABSTRACT. A new adaptive time-frequency (t-f) analysis and classification procedure is applied to impact acoustic signalsfor detecting hazelnuts with cracked shells and three types of damaged wheat kernels. Kernels were dropped onto a steel plate,and the resulting impact acoustic signals were recorded with a PC-based data acquisition system. These signals weresegmented with a flexible local discriminant bases (F-LDB) procedure in the time-frequency plane to extract discriminativepatterns between damaged and undamaged food kernels. The F-LDB procedure requires no prior knowledge of the relevanttime or frequency indices of the impact acoustics signals for classification. The method automatically finds all crucialtime-frequency indices from the training data by combining local cosine packet analysis and a frequency axis clusteringapproach, which supports individual time and frequency band adaptation. Discriminant features are extracted from theadaptively segmented acoustic signal, sorted according to a Fisher class separability criterion, post-processed by principalcomponent analysis, and fed to a linear discriminant classifier. Experimental results establish the superior performance ofthe proposed approach when compared to prior techniques reported in the literature or used in the field. The new approachseparated damaged wheat kernels (IDK, pupal, and scab) from undamaged wheat kernels with 96%, 82%, and 94% accuracy,respectively. It also separated cracked-shell hazelnuts from those with undamaged shells with 97.1% accuracy. Theadaptation capability of the algorithm to the time-frequency patterns of signals makes it a universal method for food kernelinspection that can resist the impact acoustic variability between different kernel and damage types.
Keywords. Adaptive time-frequency analysis, Food kernel inspection, Impact acoustics, Kernel classification.
ood kernel damage caused by insects, fungi, andmold is a major source of quality degradation. Forinstance, Fusarium graminearum, a fungus found inwheat, creates “scab” damage and may lead to
toxins known to cause cancer (Christensen and Meronuck,1986). Internal insect infestation degrades the quality andvalue of wheat and is one of the most difficult kernel defectsto detect. This type of kernel damage occurs when an adultfemale insect chews a small hole in the kernel, deposits anegg, and then seals the egg with a mixture of mucus. The eggplug is the same color as the wheat surface, so it is nearly
Submitted for review in May 2007 as manuscript number IET 7006;approved for publication by the Information & Electrical TechnologiesDivision of ASABE in August 2008. Presented at the 2007 ASABE AnnualMeeting as Paper No. 074152.
The authors are Nuri F. Ince, Post-Doctoral Associate, Department ofElectrical and Computer Engineering, University of Minnesota,Minneapolis, Minnesota; Ibrahim Onaran, Research Assistant andDoctoral Student, Department of Electrical and Electronics Engineering,Bilkent University, Ankara, Turkey; Tom C. Pearson, ASABE MemberEngineer, Agricultural Engineer, USDA Agricultural Research Service,Manhattan, Kansas; Ahmed H. Tewfik, Professor, Department of Electricaland Computer Engineering, University of Minnesota, Minneapolis,Minnesota; A. Enis Cetin, Professor, Department of Electrical andElectronics Engineering, Bilkent University, Ankara, Turkey; HabilKalkan, Research Assistant, Doctoral Student, and Yasemin Yardimci,Professor, Informatics Institute, Middle East Technical University, Ankara,Turkey. Corresponding author: Nuri F. Ince, Department of Electrical andComputer Engineering, 4-147C EE/CSCI Building, 200 Union St. SE,University of Minnesota, Minneapolis, MN 55455; phone: 612-625-5006;fax: 612-625-4583; e-mail: [email protected].
impossible to detect by visual inspection. When the egghatches, the insect larvae feeds on the kernel endosperm andthen exits the kernel by chewing an exit tunnel and formingwhat is called an “insect-damaged kernel” (IDK). Insectinfestations cause grain loss by consumption, nutritionallosses, and degradation in the end-use quality of flour(Pederson, 1992). Separation of damaged from undamagedwheat kernels is crucial for quality and proper grading ofwheat loads. Therefore, the percentage of insect-damagedkernels in the production/market is controlled by the USDAand industry standards. For example, in the U.S., U.S. No. 1to U.S. No. 5 grades only allow up to 31 damaged wheatsamples per 100 g. Damaged samples exceeding this numberare graded as U.S. Sample grade (USDA, 2008).
A similar problem occurs in hazelnut production.Environmental conditions and processing procedures maydecrease nut quality by causing cracks on the shell. Damageto the shell of the nut kernel increases the likelihood of fungiinfecting the kernels, since the mold spores have unabatedaccess to the kernel. Fungal infestation can cause aflatoxinformation, which is a type of mycotoxin that is linked tovarious health problems including liver cancer (Dichter,1984). Therefore, it is crucial to detect hazelnuts withdamaged shells and separate them from undamaged nuts.
In this study, two important food inspection problems areaddressed using a novel adaptive time frequencysegmentation technique:
� Detection of damaged wheat kernels.� Detection of hazelnuts with cracked shell.
F
1462 TRANSACTIONS OF THE ASABE
IMPACT ACOUSTICS FOR FOOD INSPECTIONBecause the proportion of damaged kernels is small
compared to the total number of undamaged wheat kernels,a low false positive error rate (identification of an undamagedkernel as damaged) is crucial for an economically feasibledetection system. Several methods have been studied totackle the problem of detecting insect-damaged wheatkernels, including x-ray imaging (Karunakkaran et al.,2003), NIR spectroscopy (Maghirang et al., 2003; Dowell etal., 1998), and carbon dioxide measurements (Bruce et al,.1982). However, these methods are slow, expensive, and donot provide the required accuracy in classification. Hence,these types of wheat kernel inspection methods have notfound widespread application in industry.
In hazelnut production, farmers separate the emptyhazelnuts from fully developed ones before selling the nuts.A mechanical device using an air fan is utilized for thispurpose. The air fan removes immature or empty hazelnutswith lower weight, and the remaining hazelnuts are acceptedas fully developed. This system is unable to remove the nutswith cracked shells because hazelnuts with cracked shellshave weights and densities that are very similar to hazelnutswith undamaged shells.
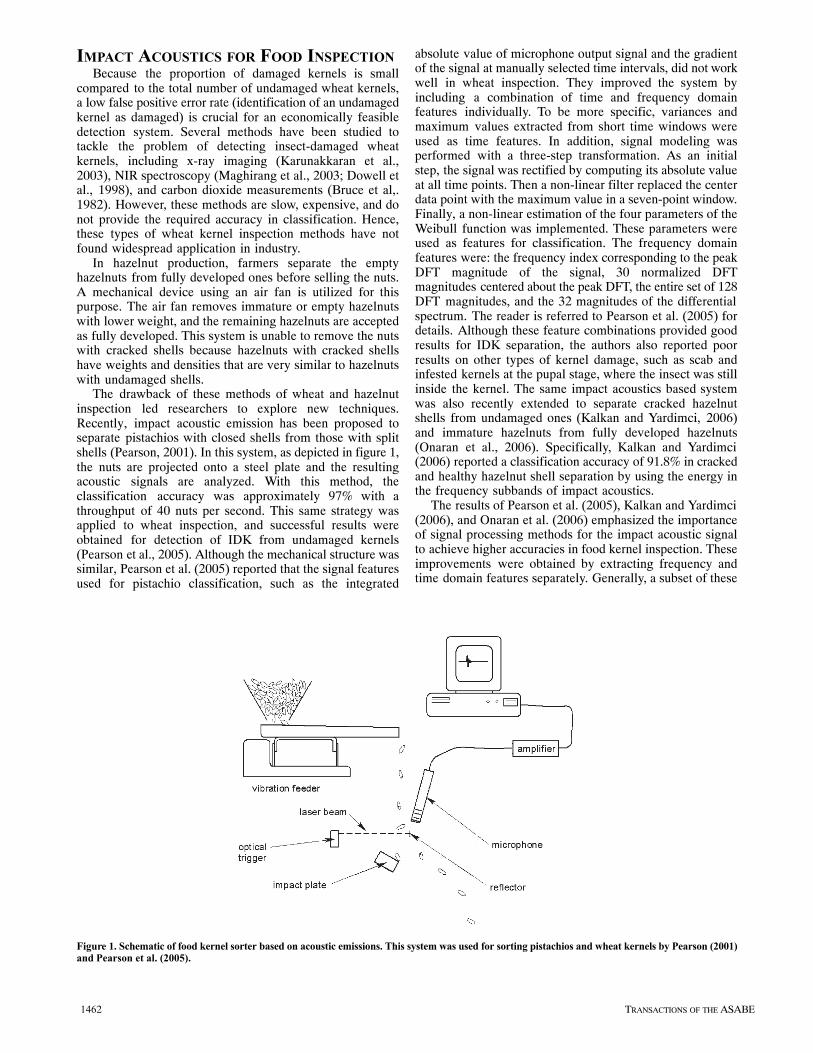
The drawback of these methods of wheat and hazelnutinspection led researchers to explore new techniques.Recently, impact acoustic emission has been proposed toseparate pistachios with closed shells from those with splitshells (Pearson, 2001). In this system, as depicted in figure 1,the nuts are projected onto a steel plate and the resultingacoustic signals are analyzed. With this method, theclassification accuracy was approximately 97% with athroughput of 40 nuts per second. This same strategy wasapplied to wheat inspection, and successful results wereobtained for detection of IDK from undamaged kernels(Pearson et al., 2005). Although the mechanical structure wassimilar, Pearson et al. (2005) reported that the signal featuresused for pistachio classification, such as the integrated
absolute value of microphone output signal and the gradientof the signal at manually selected time intervals, did not workwell in wheat inspection. They improved the system byincluding a combination of time and frequency domainfeatures individually. To be more specific, variances andmaximum values extracted from short time windows wereused as time features. In addition, signal modeling wasperformed with a three-step transformation. As an initialstep, the signal was rectified by computing its absolute valueat all time points. Then a non-linear filter replaced the centerdata point with the maximum value in a seven-point window.Finally, a non-linear estimation of the four parameters of theWeibull function was implemented. These parameters wereused as features for classification. The frequency domainfeatures were: the frequency index corresponding to the peakDFT magnitude of the signal, 30 normalized DFTmagnitudes centered about the peak DFT, the entire set of 128DFT magnitudes, and the 32 magnitudes of the differentialspectrum. The reader is referred to Pearson et al. (2005) fordetails. Although these feature combinations provided goodresults for IDK separation, the authors also reported poorresults on other types of kernel damage, such as scab andinfested kernels at the pupal stage, where the insect was stillinside the kernel. The same impact acoustics based systemwas also recently extended to separate cracked hazelnutshells from undamaged ones (Kalkan and Yardimci, 2006)and immature hazelnuts from fully developed hazelnuts(Onaran et al., 2006). Specifically, Kalkan and Yardimci(2006) reported a classification accuracy of 91.8% in crackedand healthy hazelnut shell separation by using the energy inthe frequency subbands of impact acoustics.
The results of Pearson et al. (2005), Kalkan and Yardimci(2006), and Onaran et al. (2006) emphasized the importanceof signal processing methods for the impact acoustic signalto achieve higher accuracies in food kernel inspection. Theseimprovements were obtained by extracting frequency andtime domain features separately. Generally, a subset of these
Figure 1. Schematic of food kernel sorter based on acoustic emissions. This system was used for sorting pistachios and wheat kernels by Pearson (2001)and Pearson et al. (2005).

1463Vol. 51(4): 1461-1469
features was selected using traditional stepwise discriminantanalysis for classification. In the presence of variability ofacoustic waveforms due to different kernel damages, it iscumbersome to extract relevant features and adapt them tochanging conditions.
The objective of this study was to investigate a detectionmethod for cracked hazelnuts and wheat kernel damagebased on an adaptive time-frequency (t-f) analysis of theimpact acoustic signals emitted by wheat kernels or hazelnutshells when dropped from a fixed height onto a steel plate.The proposed approach requires no prior knowledge of therelevant time or frequency indices of the impact acousticssignals. It implements an arbitrary time and frequency tilingwith a flexible local discriminant bases algorithm (Ince et al.,2006) to find the most relevant indices automatically. Thisalgorithm is obtained by combining local cosine packet(LCP) analysis (Mallat, 1999; Wickerhauser, 1994) with afrequency axis clustering approach that supports individualtime and frequency band adaptation. The time and frequencysegmentation steps produce too many features. Furthermore,these features are generally correlated. Therefore, theadaptively extracted t-f features are processed by principalcomponent analysis to reduce the number of features andcombine correlated features. Finally, the PCA post-processedfeature set was classified with linear discriminant analysis.
MATERIAL AND METHODSA schematic diagram describing the overall signal
processing and classification system is shown in figure 2. Asindicated previously, the time-frequency features extractedfrom impact acoustic signals are used for the identification ofdamaged wheat kernels and hazelnuts with cracked shells.The time-frequency features are computed by windowing theacoustic signal in adapted time segments and then applyinga spectral analysis to estimate the frequency spectrum. Aftercomputing the features, they are sorted with Fisher’sdiscriminative criterion to select the most parsimonious onesand post-processed by PCA. Finally, linear discriminantanalysis is used to identify damaged food kernel acoustics.The next sections provide a detailed description of the dataacquisition system used to record the impact acoustics andperform the signal processing steps.
IMPACT ACOUSTICS DATA ACQUISITIONThe same experimental setup of Pearson et al. (2005) was
used to record the impact acoustics. A schematic of theexperimental apparatus for singling wheat kernels andhazelnuts, which consisted of dropping the nuts/kernels ontothe impact plate and then collecting the acoustic signals fromthe impact, is shown in figure 1. A vibration feeder (F-TO-C,
FMC-Syntron, Homer City, Pa.) was used to transform thewheat kernels into a single-file stream, which consisted of avibrating bulk hopper and a V-shaped steel trough. The wheatkernels were impacted onto a polished stainless steel platewith dimensions of approximately 75 × 50 × 100 mm. Thedrop distance from the feeder to the impact plate was400 mm, and the plate was inclined at 30° above thehorizontal. This angle was determined by trial and error inorder to prevent bounces. Flatter angles of incline produceda stronger signal, but the kernels tended to bounce twicebefore falling off of the plate. This was not conducive tohigh-speed sorting.
A microphone (4939 L with 2669 L pre-amp, Bruel andKjaer North America, Norcross, Ga.), sensitive tofrequencies up to 100 kHz, was used to capture audible andultrasonic acoustic emissions from the impact of the wheatkernels with the steel plate. The end of the microphone wasplaced 25 mm from the point where kernels impacted theplate. The microphone output was further amplified (2690NEXAS, Bruel and Kjaer North America, Norcross, Ga.) at1 V/Pa to ensure that the system had the required dynamicrange to capture the acoustic emissions. Microphone signalswere digitized using a sound card (Waveterminal 192X, EgoSys, Seoul, South Korea) at a sampling frequency of 192 kHzwith 16-bit resolution. This sound card does not have the20 kHz low-pass filter that most consumer sound cards use.The data acquisition was triggered using an optical sensor(QS30LLPC, Banner Engineering Corp., Minneapolis,Minn.). In the wheat kernel experiment, 600 undamaged(UD), 600 IDK, 600 pupal, and 400 scab kernels were used.
To evaluate the performance of the proposed algorithm indiscrimination of cracked shell hazelnuts from undamagedones, the dataset of Kalkan and Yardimci (2006) was used. Asetup similar to that used for the wheat experiment wasconstructed to record the hazelnut impact acoustic signalswith undamaged and cracked shells. A stainless steel platewith dimensions of 75 × 150 × 20 mm was used as the impactplate. The impact plate was fixed to the ground at a 120°angle to prevent nuts from making multiple impacts. Amicrophone (AT9100, Audio-Technica U.S., Inc., Stow,Ohio), sensitive to frequencies up to 20 kHz, was placed50 mm from the impact plate. The impact acoustic signal wassampled at 44.1 kHz with a standard sound card attached tothe computer. ‘Levant’ type hazelnuts, which were collectedfrom an orchard in Akcakoca, Turkey, in August 2003, wereused in this study. The weights of the hazelnuts weremeasured, and those less than 0.9 g were taken as empty orundeveloped nuts. Hazelnuts with weights over 0.9 g wereaccepted as fully developed. This value was foundempirically by inspecting the weight of several empty,underdeveloped, and fully developed hazelnuts. Thehazelnut shells were visually inspected and were further
Figure 2. Block diagram of the proposed signal processing and classification system.

1464 TRANSACTIONS OF THE ASABE
(a) Undamaged
(b) IDK
(c) Scab
(d) Pupal
Figure 3. Sample waveforms of wheat kernel impact acoustics for the types studied in this article (N = 10): (a) undamaged kernels, (b) insect-damagedkernels (IDK) with exit holes, (c) fungi damage (scab), and (d) kernels with hidden damage at the pupal stage where the insect is still in the kernel.
classified into nuts with regular shell and nuts with crackedshell. For each undamaged and cracked class, 180 signalswere recorded. Representative impact acoustic signals ofwheat and hazelnut kernels recorded with these systems arepresented in figures 3 and 4, respectively.
SIGNAL PROCESSING
Transient features in a signal may carry significantinformation for classification. Such features are sometimesomitted due to their low energy or improper analysis thatignores temporal information. As shown in figures 3 and 4,the impact acoustic signals also contain transient waveformsthat may carry information for discrimination. In order to
extract such localized information, time-frequency methodsare widely used (Mallat, 1999; Vetterli, 2001). Atime-frequency analysis explores the time-varyingcharacteristic of a signal by windowing it in consecutive timesegments, generally overlapping, and then applying aspectral analysis to estimate energy distribution of the signalin the frequency domain. The width of the time windowdetermines the resolution of the spectral analysis. Whilelonger windows provide higher spectral resolution, theyprovide poor time localization, vice versa. Therefore, it isdesirable to adjust the time windows to adapt to thetime-varying characteristic of the signal. In this study, theflexible local discriminant bases (F-LDB) algorithm of Ince
(a) Undamaged
(b) Cracked
Figure 4. Typical (a) undamaged and (b) cracked shell hazelnut acoustics records.

1465Vol. 51(4): 1461-1469
et al. (2006) was used to adaptively segment thetime-frequency plane and extract relevant features from theimpact acoustic signal for classification. The adaptivetime-frequency plane feature extraction procedures and pre-and post-processing steps are discussed below.
Adaptive Time-Frequency SegmentationThe F-LDB algorithm expands the signal into
orthonormal bases using cosine packets, a localtrigonometric transform, in consecutive time segments, andfinds those segments with a merge/divide strategy, where thedistance between the spectra of different classes is maximum.This iterative procedure adjusts the width of time windows toincrease the distance between signals. Once the signals aresegmented along the time axis, they are represented by localcosine transform. In the next step, the merge/divide strategyis repeated along the frequency axis to group consequentdiscriminative frequency indices. Here, consecutivefrequency indices were merged only if their union had largerdiscrimination power than that of the individual indicestreated separately. The procedure described above isbasically a clustering approach by cost function maximization and produces adaptive frequency segmentation suitablefor discrimination in each time segment. The reader isreferred to Ince et al. (2006) for detailed description of thealgorithm.
Although the acoustic recordings were triggered withoptical sensors, temporal variability exists in the observedsignals due to different travel time of the food kernels fromthe feeder to the impact plate. Since the cosine packettransform is not shift invariant, this temporal variability maycause variance in the extracted features for classification. Forinstance, small shifts of the signal in the time axis causeabrupt changes in local cosine packet coefficients. In order todeal with this problem, the ”spin cycle” procedure of Ince etal. (2006) and Saito et al. (2002) was applied to the trainingand test data, as indicated in figure 2, prior to the time andfrequency segmentation step. The spin cycle proceduregenerates several copies of a signal by shifting it to the leftand right for a number of given samples. In this study, aone-sample spin cycle procedure was implemented, and as aresult three copies of each record were created: the originalsignal, and one-sample left and right shifted copies of it. Thisexpands the dataset with several instances of each record tosimulate the temporal variability in the time axis. Each ofthese records is processed separately by the time-frequencyanalysis method for feature extraction and used in the finalclassification. By using this procedure, the overall algorithmbecomes more robust against the temporal variability in therecorded signals. The reader is referred to Saito et al. (2002)and Ince et al. (2006) for further details.
There are various choices for distance measures to be usedin constructing the time segmentation. This study used theEuclidean distance between the cumulative probabilitydistributions of each expansion coefficient under class 1 andclass 2, respectively, estimated via a histogram.
Dimension Reduction and ClassificationOnce the t-f segmentation was completed, the Fisher class
separability criterion was used for sorting the features:
( )22
21
221F�+�
�−�= (1)
where μ and σ are the mean and standard deviation,respectively, of the feature they correspond to. This step isreferred to as class separability criterion based sorting (CS).This enabled us to filter out features that have smalldiscrimination power and use those with higherdiscrimination information for the final decision.
Although the CS step eliminates most of the irrelevantfeatures, there is still need to compact the top rank of thefeature set to remove the correlations between features andreduce the dimensionality. As a last step, principalcomponent analysis (PCA) was implemented on the topdiscriminant feature set returned from the CS step. ThePCA-processed top feature set was input to a lineardiscriminant analysis (LDA) function.
Since the one-sample spin cycle procedure was used in thepre-processing stage, there were three multiple instances ofa particular signal, i.e., shifted to the left and right by onesample along with the original recording with no shifts. In theclassification stage, these multiple instances of the signalwere classified separately, and a majority voter scheme wasimplemented for the final decision. For example, when animpact signal was recorded, it was first shifted by one sampleto the left and one sample to the right. Then, for each of theseinstances, the features were calculated for the learned t-fsegments and fed to the classifier. Finally, a majority voterpost-processed the classification outputs for all shifts. Themajority voter simply counted the classification outputs(votes) for each shift for a particular signal and assigned thesignal to the class with the maximum number of votes.
As indicated in the previous sections, the F-LDBprocedure creates t-f segmentation for two-class problems.Since there are four classes (UD vs. IDK, pupal, and scab) inthe wheat kernel inspection problem, the following strategywas used:
� All damaged wheat kernel types are classified versusUD in a single step.
� Each damaged wheat kernel type is classified versusUD in a pairwise manner.
The impact acoustic signals corresponding to wheatkernels (UD, IDK, scab, and pupal) were 1024 samples long,while those corresponding to cracked and healthy hazelnutshells were 960 samples long. The minimum window sizeused for the time axis segmentation with the F-LDBprocedure was selected to be 16 samples for wheat and32 samples for hazelnuts. After a visual inspection, it wasobserved that the impact acoustics patterns for wheat recordshave very short living transients compared to hazelnutrecords (figs. 3 and 4). Therefore, shorter windows wereselected in the analysis of wheat signals. The smoothoverlapping part of the windows was set to half of theminimum window size. A one-sample spin cycle procedurewas used before processing the signals. After completing thetime-frequency segmentation with F-LDB, the features wereconverted to log scale, normalized, and sorted by the Fcriterion. The top 128 features were processed by PCA andsorted according to the corresponding eigenvalues indescending order. A 2×2-fold cross-validation wasimplemented to estimate the classification error. First, thedataset was randomly distributed. Half of the record set wasused in the training stage to find most the discriminant t-ffeatures, PCA and LDA weights. The remaining set was usedto test the performance of the learned parameters. This

1466 TRANSACTIONS OF THE ASABE
experiment was repeated twice. In order to compare theefficiency of the proposed algorithm, the features used byPearson et al. (2005) were also extracted and referred to as thereference approach (RA). These features were extracted fromthe short time variances of signal segments, maximum signalamplitudes, spectral peak locations, and the parameters of aWeibull function approximation of the envelope of theimpact signal parameters. The same features were used in thewheat and hazelnut experiments for comparison purposes.
In order to asses the efficiency of extraction time-frequency features with adaptive tilings in the classificationof impact acoustic signals, experiments with fixedtime-frequency tilings were conducted. In particular, thetime-frequency features were computed by segmenting thesignals into fixed-width time windows (W) with 32 or64 sample lengths and then calculating 4 or 8 subband (SB)features in each time window with equal bandwidth. Theextracted feature set was post-processed with PCA and fed toLDA for final decision, as in the previous experiments.
RESULTS AND DISCUSSIONWHEAT CLASSIFICATION
Table 1 shows the classification results when undamaged(UD) wheat kernels were classified against all IDK, scab, andpupal damaged kernels with a one-against-all strategy. Inparticular, single time-frequency plane segmentation and asingle LDA classifier were constructed to discriminatebetween undamaged and all damaged wheat kernels. Thealgorithm yielded high accuracy for IDK (95.9%) and scabtypes (91.2%). However, it resulted in poor classificationaccuracy (61%) for pupal damaged kernels. Based on theseresults, time-frequency segmentations and classifiers weredesigned to discriminate between undamaged kernels vs.IDK, undamaged kernels vs. scab, and undamaged kernelsvs. pupal. In this scheme, the final classification can be donein a cascaded classification strategy. In particular, a newobserved acoustic signal can be tested for IDK damage, thenscab damage, and finally for pupal damage.
As indicated previously, paired discrimination isrecognized as a one-against-other classification strategy(Hastie et al., 2001; Alpaydin, 2004). The results of usingsuch a technique are presented in table 2. The pairwiseapproach provided improvements in classification of pupaldamaged kernels. In particular, using the paired classificationstrategy, the classification accuracy rate for pupal damagedkernel improved from 62% to 81%. Note that theclassification accuracies of undamaged and scab types areslightly higher in the paired classification strategy. Also notethat time-frequency plane feature extraction and theclassification algorithm outperformed the referenceapproach (RA), especially for the scab and pupal damagedkernels. The paired classifier using adaptively segmentedtime-frequency plane features significantly outperformed theRA in all UD vs. IDK, UD vs. scab, and UD vs. pupaldiscriminations (p = 2.3 × 10⁻⁷, p = 2.7 × 10⁻⁸, p = 8.5× 10⁻⁷,t-test, respectively).
The results discussed above suggest that the pupal classhas features distinct from the IDK and scab classes. Tounderstand why the F-LDB approach yields better resultsthan the RA approach with the paired classification
Table 1. Classification accuracies obtained with F-LDB in separatingundamaged kernels (UD) from damaged kernels in a single step.
UD IDK Scab Pupal
F-LDB 90% 95.9% 91.2% 61%
Table 2. Classification accuracies obtained with F-LDB and referenceapproach (RA) in separating undamaged kernels (UD) fromdamaged kernels. The results belong to paired classifications.
UD vs. IDK UD vs. Scab UD vs. Pupal
F-LDB 96% to 95.7% 93.9% to 96.9% 84% to 81.2%RA 92% to 82.3% 68.4% to 66.3% 69.8% to 66.5%
technique, the scab and pupal damaged data were studied inmore detail. Consider the time-frequency locations/featuresselected by the F-LDB method shown in figure 5 for UD vs.scab and UD vs. pupal kernel classification. Interestingly, themoment of impact where maximum signal amplitude wasobserved and several time-frequency locations on the tail ofthe signal were selected by the algorithm. These post-impactfeatures appeared to be the most discriminative features andresulted in a lower error rate. It is possible that the featureson the tail of the signal might be related to the vibration of themetal plate or turbulence in the air. Note that differenttime-frequency segmentations were constructed in theimpact and post-impact regions. The time windows werequite short in the early impact region, while wider windowsand narrow frequency indices were selected in thepost-impact region. Furthermore, the time-frequency mapspartly explain the degradation in performance in theone-against-all classification strategy. As seen in figures 5aand 5b, the time-frequency locations selected for pupal andscab damaged kernels are different. A rapid transition fromlower to higher bands in scab features was observed.Contrary to pupal kernel discrimination, mostly higher bandswere utilized by the algorithm. The capability of thealgorithm to adjust the time-frequency segmentations for agiven damage type can be critical for obtaining good results.Also note that, for both scab and pupal kernel classification,post-processing with PCA resulted in lower error rates, asindicated in figures 5c and 5d. Recall that the CS orderedfeatures are post-processed with PCA for dimensionreduction and decorrelation of the top rank. This final signalprocessing step slightly improved the final classificationaccuracy.
These results indicate that using the one-against-otherstrategy provides higher recognition accuracies for damagedwheat kernels. To preserve the high classification accuracyfor all types, a cascaded discrimination strategy, as indicatedin figure 6a, could therefore be used in practice. The cascadedclassification engine integrates three paired classifiers(UD vs. IDK, UD vs. scab, and UD vs. pupal). Specifically,when a new impact acoustic signal is observed, the systemfirst tests for IDK damage. If the system decides that no IDKdamage is present, it tests for scab damage. If no scab damageis detected, it finally checks for pupal damage. In the currentsystem, the least accurate classifier is the one that detectspupal damaged kernels. A receiver operating characteristic(ROC) curve for the UD vs. pupal damaged classifier isplotted in figure 6b. The current operating point is shownwith a solid arrow. In order to improve the true positive rateto 95%, a high false positive rate (dashed arrow) must betolerated as well.

1467Vol. 51(4): 1461-1469
(a)
(b)
Number of Features
0 40 60 80 10020
Cla
ssif
icat
ion
Err
or
(%)
40
35
30
25
20
15
10
5
0
(c)
120
PCACS
Number of Features
0 40 60 80 10020
Cla
ssif
icat
ion
Err
or
(%) 40
35
30
25
20
15
(d)
120
PCACS
50
45
Figure 5. The t-f features selected for (a) UD vs. scab and (b) UD vs. pupal classification. The darker features have more discrimination power. Bothgraphs are visualized with the same scale to emphasize the difference in the discrimination power of extracted features. The bottom row shows theclassification error versus the number of features that were sorted by a class separability criteria (CS = F) and PCA. The error curves belong to (c) UDvs. scab and (d) UD vs. pupal. Note the lower error rates for PCA with a smaller number of features.
HAZELNUT CLASSIFICATION
The proposed system achieved 97.1% classificationaccuracy in separating the undamaged hazelnut shells fromcracked shells. In particular, the undamaged and crackedshell hazelnuts were recognized with 99.2% and 95%accuracies, respectively. A classification accuracy of 91.8%was reported by Kalkan and Yardimci (2006) on this samedataset by manually selecting the most discriminative
subbands and using their energies for classification. Theseresults suggest that adaptively segmented time-frequencyplane features significantly outperformed the results ofKalkan and Yardimci (2006) (p = 0.0061, t-test). Thediscriminant time-frequency features selected by thealgorithm are shown in figure 7a. This figure indicates thatthe most discriminant features are located in high-frequencybands following impact. Kalkan and Yardimci (2006) also
IDK−UDClassifier
95.7%
96.9%
81.2% 84%
96%
93.9%
Time−Frequency Features ofImpact Acoustic Signal
(a)
Scab−UDClassifier
Pupal−UDClassifier
(b)
False Positive Rate
Tru
e P
osi
tive
Rat
e
Figure 6. (a) Cascaded classification strategy and (b) ROC curve of UD vs. pupal classifier output. The solid curve was obtained with the spin cycleprocedure, and the dashed curve was obtained without the spin cycle. Note that improving the classification accuracy above 90% involves higher falsepositive rates. Note also that the spin cycle preprocessed classifier has higher accuracy.

1468 TRANSACTIONS OF THE ASABE
(a)
Time (ms)
Fre
qu
ency
(kH
z)
Number of Features
0 40 60 80 10020
Cla
ssif
icat
ion
Err
or
(%)
108
6
4
2
0
(b)
120
PCACS
14
12
18
16
20
Figure 7. (a)The t-f features selected for separation of cracked hazelnuts from undamaged nuts. The darker features have more discrimination power.Note that the higher frequency band is primarily selected by the algorithm. (b) The classification error curve obtained with and without PCApost-processing. Note that PCA provides lower error rates with a minimal number of features.
reported higher bands as crucial frequency indices aftermanually inspecting several subbands with wavelettransform. The algorithm proposed in this article learnedthese indices automatically from the data.
As in the wheat classification results, the PCA post-processing step improved the classification accuracies. Infigure 7b, the classification error curves versus the number offeatures for PCA and CS are given. Here, the use of PCAimproved the classification accuracy from 96% to 97.1%with a small number of features. This shows the importanceof post-processing the t-f features sorted by the F criterion,which does not account for the correlation or interactionbetween extracted features.
EXPERIMENT WITH FIXED RESOLUTION FEATURES
Table 3 shows the classification results for wheat andhazelnuts computed using time-frequency features withfixed resolution. Note that the classification accuraciesobtained with fixed resolution were quite poor for wheatkernel classification. For hazelnut classification, the fixedresolution results were slightly lower than adaptive arbitrarytilings. In general, an improvement in classificationaccuracies was observed when shorter time windows wereutilized in wheat kernel classification. Interestingly, it hasbeen observed that the undamaged kernels were betterdiscriminated when longer windows were used in UD vs.scab kernel discrimination. When shorter windows(32 samples) were used with eight subbands, the undamagedkernel recognition accuracy dropped to 82.4% from 87.6%.In contrast, the scab kernel recognition accuracy wasimproved from 75.5% to 79.1%. Similar results wereobserved for pupal kernel classification. When the number of
subbands increased from 4 to 8 with 32 sample long timewindows, the undamaged kernel recognition accuracydropped from 76.4% to 74.7%. In contrast, the pupal kernelrecognition accuracy slightly increased.
For the hazelnuts, the classification accuracies obtainedwith arbitrary and fixed time-frequency tilings were similar.The arbitrary tilings provided slightly better results (97.1%)than fixed tilings (96.5%). Note that the adaptivetime-frequency plane tilings for hazelnuts were not ascomplex as for wheat kernels (figs. 6 and 7). Therefore,nearly the same discriminant information can be capturedwith fixed tilings. Note also that larger windows providedbetter results, and the number of subbands did not have mucheffect on the recognition accuracy.
The results obtained indicate that different kernels can bediscriminated with distinct time-frequency segmentations.Furthermore, when the segmentations are adapted to theproblem, the classification accuracies dramatically increase.
COMPUTATIONAL COMPLEXITY
The t-f segmentation steps are completed off-line. Afterlearning the most discriminative segments in an off-linemanner, it is only necessary to process the impact acousticsdata at the selected time-frequency locations in real time. Theprocessing includes calculating the expansion coefficients inthe learned time segments, merging the coefficients in thefrequency domain, projecting the resulting features onto theprincipal components, and feeding the results into LDA.
The spin cycle procedure, which is used to eliminate thelack of translation invariance of local cosine packets, addsadditional complexity to the proposed system, since it entailsestimating the expansion coefficients for several shifts of the
Table 3. Classification accuracies obtained with fixed resolution time-frequency patterns for wheat kernels and hazelnuts(W = length of time windows in number of samples, and SB = number of subbands computed in each time windows).
Wheat Hazelnut
UD - IDK UD - Scab UD - Pupal UD - Cracked
W = 64, SB = 4 87.2% - 83.0% 73.4% - 67.5% 71.2% - 72.6% 98.7% - 93.1%W = 64, SB = 8 88.2% - 87.1% 87.6% - 75.5% 74.4% - 73.8% 98.9% - 93.6%W = 32, SB = 4 90.9% - 86.5% 76.9% - 73.5%. 76.4% - 74.0% 97.8% - 93.1%W = 32, SB = 8 89.5% - 89.5% 82.4% - 79.1% 74.7% - 74.5% 98.9% - 92.3%
1469Vol. 51(4): 1461-1469
recorded data. For real-time applications, the average ofexpansion coefficients for consecutive shifts might be usedinstead. Another solution could be using transformations thatsatisfy the translation invariance condition. Although thesystem can classify wheat samples with higher accuracies,the need to recalculate features in the paired hierarchicalclassification strategy can be a drawback. This may boost thecomputations required by the system, resulting in lowerprocessing speeds. In order to evaluate the processing speedof the proposed approach, the speed of the algorithm wastested on a desktop PC equipped with 1.8 GHz processor and512 MB of memory. Processing of a single wheat sample tookapproximately 0.027 s. This corresponds to a processingspeed of nearly 37 samples per second on the top node of theclassification system. Since at least three steps are requiredfor UD wheat kernel recognition, they cannot be processedwith a speed of more than 12 kernels per second. Theprocessing speed for hazelnuts was 77 kernels per second.Since the classification was implemented in a single step andminimal error was achieved with small number of features,the processing speed was quite fast for cracked hazelnutseparation.
CONCLUSIONIn this article, an adaptive time-frequency plane feature
extraction and classification technique to discriminatebetween damaged and undamaged food kernels by analyzingrelated impact acoustics signals was investigated. Inparticular, the study focused on the problems of detectingdamaged wheat kernels and hazelnuts with cracked shells.The procedure requires no prior knowledge of the relevanttime-frequency indices of the impact acoustics signals forclassification. The method automatically learns all crucialtime-frequency indices from the training data byimplementing individual time and frequency bandadaptation. Discriminant features were extracted from theadaptively segmented acoustic signal, sorted according to aFisher class separability criterion, post-processed byprincipal component analysis, and fed to linear discriminantclassifier for final decision. The approach achievedclassification accuracies in paired separation of undamagedwheat kernels from insect-damaged kernels with exit holes,kernels with hidden damage at the pupal stage, and scabdamaged kernels of 96%, 82%, and 94%, respectively. Forthe cracked shell vs. undamaged hazelnut separation, theoverall accuracy was 97.1%. The results indicate thatadaptive time-frequency features extracted from impactacoustic signals provide improved accuracies in damagedfood kernel inspection when compared to baseline methods,which used features from the time or frequency domain withfixed resolution. The adaptation capability of the algorithmto both the time and frequency content of signals makes it auniversal method for food kernel inspection that can resist theimpact acoustic variability between different kernels anddamage types, even though in certain cases it may have arelatively high computational complexity.
ACKNOWLEDGMENTThis work was supported by the scientific and
technological research council of Turkey (TUBITAK) underthe grant 106E057.
REFERENCESAlpaydin E. 2004. Introduction to Machine Learning. Cambridge,
Mass.: MIT Press.Bruce, W. A., W. M. Street, R. C. Semper, and D. Fulk. 1982.
Detection of hidden insect infestations in wheat by infraredcarbon dioxide gas analysis. ARS Bulletin AAT S-26.Washington, D.C.: USDA-ARS.
Christensen, C. M., and R. A. Meronuck. 1986. QualityMaintenance in Stored Grains and Seeds. Minneapolis, Minn.:University of Minnesota Press.
Dichter, C. R. 1984. Risk estimates of liver cancer due to aflatoxinexposure from peanuts and peanut products. Food Chemistryand Toxicology. 22(6): 431-437.
Dowell, F. E., J. E. Throne, and J. E. Baker. 1998. Automatednondestructive detection of internal insect infestation of wheatkernels by using near-infrared reflectance spectroscopy. J. Econ.Entomol. 91(4): 899-904.
Hastie, T., R. Tibshirani, and J. Friedman. 2001. The Elements ofStatistical Learning. New York, N.Y.: Springer.
Ince, N. F., S. Arica, and A. H. Tewfik. 2006. Classification ofsingle trial motor imagery EEG recordings by using subjectadapted non-dyadic arbitrary time-frequency tilings. J. NeuralEng. 3(3): 235-244.
Kalkan, H., and Y. Yardimci. 2006. Classification of hazelnuts byimpact acoustics. In Proc. IEEE Machine Learning for SignalProcessing Congress. Piscataway, N.J.: IEEE.
Karunakkaran, C., D. S. Jayas, and N. D. G. White. 2003. Softx-ray inspection of wheat kernels infested by Sitophilusoryzae.Trans. ASAE 46(3): 739-745.
Maghirang, E. B., F. E. Dowell, J. E. Baker, and J. E. Throne. 2003.Automated detection of single wheat kernels containing live ordead insects using near-infrared reflectance spectroscopy. Trans.ASAE 46(4): 1277-1282.
Mallat, S. 1999. A Wavelet Tour of Signal Processing. 2nd ed. SanDiego, Cal.: Academic Press.
Onaran, I., T. C. Pearson, Y. Yardimci, and A. E. Cetin. 2006.Detection of underdeveloped hazelnuts from fully developednuts by impact acoustics. Trans. ASABE 49(6): 1971-1976.
Pearson, T. C. 2001. Detection of pistachio nuts with closed shellsusing impact acoustics. Applied Eng. in Agric. 17(2): 249-253.
Pearson T., A. E. Cetin, A. H. Tewfik, and R. P. Haff. 2005.Feasibility of impact-acoustic emissions for detection ofdamaged wheat kernels. Digital Signal Proc. 17(3): 617-633.
Pederson, J. 1992. Insects: Identification, damage, and detection. InStorage of Cereal Grains and Their Products. D. B. Sauer, ed.St. Paul, Minn.: American Association of Cereal Chemists.
Saito, N., R. R. Coifman, F. B. Geshwind, and F. Warner. 2002.Discriminant feature extraction using empirical probabilitydensity and a local basis library. Pattern Recog. 35(12):1842-1852.
USDA. 2008. Official U.S. standards for grain. Washington, D.C.:USDA-GIPSA. Available at:www.gipsa.usda.gov/GIPSA/webapp?area=home&subject=grpi&topic=sq-ous.
Vetterli, M. 2001. Wavelets, approximation, and compression. IEEESignal Proc. Magazine (Sept.): 59-73.
Wickerhauser, M. V. 1994. Adapted Wavelet Analysis from Theoryto Software. Wellesley, Mass.: A.K. Peters.

10 TRANSACTIONS OF THE ASABE