identification of extreme load cases for a surface drill ...348981/fulltext01.pdf · the...
TRANSCRIPT

UPTEC F10 050
Examensarbete 30 hp2 September 2010
Identification of extreme load cases for a surface drill rig by means of MBS simulations
Anders Anbo


Teknisk- naturvetenskaplig fakultet UTH-enheten Besöksadress: Ångströmlaboratoriet Lägerhyddsvägen 1 Hus 4, Plan 0 Postadress: Box 536 751 21 Uppsala Telefon: 018 – 471 30 03 Telefax: 018 – 471 30 00 Hemsida: http://www.teknat.uu.se/student
Abstract
Identification of extreme load cases for a surface drillrig by means of MBS simulations
Anders Anbo
This master thesis is Atlas Copco Craelius’ first step in incorporating numericalmethods in load case analysis during the development process. Atlas Copco needs toconstantly evolve and refine their methods in the design process to remain as thenumber one manufacturer of mining and construction equipment. Poor knowledge ofloads results either in structural failures or in oversized structures, both very costlyfor Atlas Copco.The main goal of this thesis is to examine the potential in MBS software by using it toidentify extreme load cases in one of Atlas Copco Craelius’ surface drill rigs, Mustang5. The MBS-software ADAMS View is used to build a model of the Mustang 5 drill rigand evaluate simulation results. The rig model is subject to motions which representreal case scenarios. The feed positioning possibilities are examined thoroughly since itwas expected that the positioning has impact on the load levels. 25 different feedpositioning are simulated.The main conclusion is that the load levels are highly dependent on the feedpositioning. For example, the load levels in the boom raising cylinder can increaseseven times, if the rig is operated with the most unfavorable positioning compared tothe recommended. It could also be concluded that not only one positioning isextreme in terms of loads; it depends on which part of the boom system is beingobserved. Thus, several positioning cases have to be taken into consideration in orderto optimize the design of parts in the boom system.
ISSN: 1401-5757, UPTEC F10 050Examinator: Tomas NybergÄmnesgranskare: Martin Kronbichler, Per LötstedtHandledare: Jonas Theodorsson


Sida 1 (46)
Utfärdare (namn, telefon) Dokumentnummer Utgåva Datum
Anders Anbo 0831-100831-TR-01 1 100831
0831-100526-01 Identification of extreme load cases for a surface drill rig by means of MBS-simulations
Bla
nket
t ID
(IS
O):
BL-
0065
-6.0
Technical Report Requsted by
Stefan Elmqvist, Atlas Copco Craelius Receiver
Manfred Åstrand, Mattias Ring Atlas Copco Craelius Approved by (name, phone) Date
Bo Larsson 031-725 10 17 100831 Reviewed by (name, phone) Date
Jonas Theodorsson 08-5625 1419 100831
Identification of extreme load cases for a surface drill rig by means of MBS simulations
Summary
This master thesis is Atlas Cocpo Craelius’ first step in incorporating numerical methods in load case analysis during the development process. Atlas Copco needs to constantly evolve and refine their methods in the design process to remain as the number one manufacturer of mining and construction equipment. Poor knowledge of loads, results either in structural failures or in oversized structures, both very costly for Atlas Copco. One structural failure costs conservatively 140 000 SEK, which motivates why the risk in development projects should be reduced. The main goal of this thesis is to examine the potential in MBS software by using it to identify extreme load cases in one of Atlas Copco Craelius’ surface drill rigs, Mustang 5. The MBS-software ADAMS View is used to build a model of the Mustang 5 drill rig and evaluate simulation results. The rig model is subject to motions which represent real case scenarios. The feed positioning possibilities are examined thoroughly since it was expected that the positioning has impact on the load levels. To pinpoint the extreme ones, 25 different feed positioning are simulated. The main conclusion is that the load levels are highly dependent on the feed positioning. For example, the load levels in the boom raising cylinder can increase seven times, if the rig is operated with the most unfavorable positioning compared to the recommended. It could also be concluded that not only one positioning is extreme in terms of loads; it depends on which part of the boom system is being observed. Thus, several positioning cases have to be taken into consideration in order to optimize the design of parts in the boom system. This has been summarized in Table 2 in page 21.

Sida 2 (46)
Utfärdare (namn, telefon) Dokumentnummer Utgåva Datum
Anders Anbo 0831-100831-TR-01 1 100831
0831-100526-01 Identification of extreme load cases for a surface drill rig by means of MBS-simulations
Bla
nket
t ID
(IS
O):
BL-
0065
-6.0
Content
Identification of extreme load cases for a surface drill rig by means of MBS simulations 1 1 Introduction ............................................................................................................... 3
1.1 Atlas Copco ....................................................................................................... 3 1.2 Background ....................................................................................................... 3 1.3 The surface drill rig – Mustang 5 ....................................................................... 4 1.4 Purpose ............................................................................................................. 5 1.5 Procedure .......................................................................................................... 6 1.6 Disposition ......................................................................................................... 6
2 Modeling ................................................................................................................... 8 2.1 ADAMS-model................................................................................................... 8 2.2 Hydraulic cylinders ............................................................................................ 9
2.2.1 Modeling hydraulic cylinder stiffness .......................................................... 10 2.3 Geometry ........................................................................................................ 14 2.4 Coordinate system .......................................................................................... 14 2.5 Input data ........................................................................................................ 14
2.5.1 Drilling ........................................................................................................ 15 2.5.2 Tramming ................................................................................................... 15
2.6 Positioning of the feed ..................................................................................... 17 2.6.1 Drilling ........................................................................................................ 17 2.6.2 Tramming ................................................................................................... 19
3 Results .................................................................................................................... 21 3.1 Drilling ............................................................................................................. 21 3.2 Tramming ........................................................................................................ 24
4 Discussion ............................................................................................................... 30 4.1 Modeling .......................................................................................................... 30 4.2 Input data ........................................................................................................ 31 4.3 Drilling ............................................................................................................. 32 4.4 Tramming ........................................................................................................ 33 4.5 Further studies ................................................................................................ 34
4.5.1 Modeling .................................................................................................... 34 4.5.2 Input data ................................................................................................... 35 4.5.3 Positioning of the feed ............................................................................... 36 4.5.4 Model evaluation ........................................................................................ 36
5 Conclusions ............................................................................................................ 38 5.1 Future studies and improvements ................................................................... 38
6 Recommendations .................................................................................................. 39 7 References .............................................................................................................. 40 8 Contacts .................................................................................................................. 40 Appendix A1 – Maximal forces during all simulation cases ........................................... 41 Appendix A2 – Detailed rigid body data ......................................................................... 42 Appendix A3 – Hydraulic cylinder data .......................................................................... 43 Appendix A4 – Pressure threshold measurement ......................................................... 45

Sida 3 (46)
Utfärdare (namn, telefon) Dokumentnummer Utgåva Datum
Anders Anbo 0831-100831-TR-01 1 100831
0831-100526-01 Identification of extreme load cases for a surface drill rig by means of MBS-simulations
Bla
nket
t ID
(IS
O):
BL-
0065
-6.0
1 Introduction
1.1 Atlas Copco The company has its origin in AB Atlas, founded in 1873 by the engineer Eduard Fränckel and the financier André Oscar Wallenberg. The company was at that time mainly manufacturing railway equipment. After some successful years they were forced to restructure the company and they started to manufacture other products like compressors and rock drills. 1954 the Belgian pneumatic company Arpic Engineering NV was acquired and the company’s name was changed to the name it still has today, Atlas Copco. As one of the most successful companies in Sweden, Atlas Copco is today known worldwide for products like compressors, generators and industrial tools. They have 33 000 employees, production sites in 20 countries with revenues of 64 billion SEK (2009). An important business area is construction and mining where Atlas Copco can offer a complete range of products [1].
1.2 Background This master thesis is a result of a collaboration between Atlas Copco Craelius and the technical consultant company Xdin. Xdin provides computational expertise and has recently been involved with Atlas Copco Craelius’s investigation of a structural failure. Atlas Copco has experienced problems with material fatigue and boom failure on the Mustang 9 drill rig. The failure has occurred before the expected lifespan was exceeded. Investigations have shown that the reason for failures probably is because the rig has not been used according to the recommendations. The two strategic positions are then to either try to ban the customers from improper use or to investigate the possibility to redesign the structure to make it withstand these maneuvers which would give Atlas Copco a competitive advantage. A step towards the ability to optimize designs is to possess the tools to identify loads in a satisfactory manner. Loads are historically either sketchy calculated using the laws of motion or obtained by experiments. Experiments are however very costly and time consuming and the laws of motion yield, for relatively simple systems, equations which are hard or impossible to solve explicitly in an analytical way. The solution is numerical methods. They have for a long time been used in a wide range of industries and they have had an endless increase of importance as a tool for analysis within engineering. As the performance of computers increases, more complex problems can be solved with high accuracy in order of seconds. Today numerical methods are seen as a necessary complement to the classical couple theory and experiment. The load levels which constrain the structure’s strength are challenging to predict due to a number of circumstances. Firstly, there is no well-defined worst load case. This implies that it has to be estimated based on the contributing factors. Loads which arise when motion is involved are called dynamic loads and can become considerably higher than static loads. For instance, the large variety of environments, in which drill rigs are operating, influences the dynamic loads both while moving the rig, where the surface terrain plays a crucial role, and while drilling. For example, the load levels become lower when the ground consists of sturdy rock compared to very soft soil, since the rig can be fairly fixed to the ground and support is obtained easier, resulting in less rig motion. In the end, the operator has probably the greatest impact on a machine’s resulting load spectrum. Some operators try to operate the rig as gentle as possible while others do not consider that rough handling affects the rig’s lifespan. Experience within Atlas Copco says that rigs, where the operator does not sit on the rig during operation as in the

Sida 4 (46)
Utfärdare (namn, telefon) Dokumentnummer Utgåva Datum
Anders Anbo 0831-100831-TR-01 1 100831
0831-100526-01 Identification of extreme load cases for a surface drill rig by means of MBS-simulations
Bla
nket
t ID
(IS
O):
BL-
0065
-6.0
Mustang case, are generally operated tougher than others. The reason for this is that the operator lacks the acceleration level feedback. Operators tend to slow down if the operation becomes too uncomfortable.
1.3 The surface drill rig – Mustang 5 Mustang 5 is a multi-purpose surface drill rig which is part of a series in which Mustang 4, 9 and 13 are also included, see Figure 1. The number indicates the maximum lifting force. The Mustang 5 rig is able to achieve a lifting force of 49 kN. It supports most drilling methods on the market: auger, core and rotary percussive drilling such as down the hole (DTH) and top-hammer methods. They are all available in a myriad of versions and setups to meet all customer’s different needs and demands. A rig can be frame-mounted or crawler based and the feed can be mounted with varying degrees of freedom; from the simplest variant, with fixed vertical feed which is solely designed for vertical drilling, to more advanced boom system solutions. The crawler gives the rig the ability to travel a short distance, even on difficult terrain. The rig version examined within this project is crawler based and equipped with a boom system with five hydraulic cylinders which gives the rig the ability to position the feed in practically any direction. This is also the most common Mustang 5 variant. The development and the technical responsibility of the Mustang series are located at Atlas Copco Craelius in Märsta where also Mustang 4 and 5 are manufactured. Mustang 9 and 13 are manufactured in Italy. Atlas Copco manufactures its own rotational units and top-hammers but not the typically large dimensioned units normally used with the Mustang rigs.
Figure 1 – The oscillated crawler based Mustang 5, in this version equipped with a blue Krupp top-hammer. This is basically the setup of the rig examined within this thesis, except the 90 degrees swing bracket (which tilts the feed 90 degrees) and the top-hammer. The rotational unit – RH 130 – was instead used.

Sida 5 (46)
Utfärdare (namn, telefon) Dokumentnummer Utgåva Datum
Anders Anbo 0831-100831-TR-01 1 100831
0831-100526-01 Identification of extreme load cases for a surface drill rig by means of MBS-simulations
Bla
nket
t ID
(IS
O):
BL-
0065
-6.0
The usage of the drill rig is usually divided into four categories, namely the following.
• Tramming – the term used when driving a crawler based rig. • Positioning – refers to the operation between tramming stop and drilling, i.e. adjusting
the rig feed to its correct position and direction for drilling. • Drilling – self explanatory. • Other – refers to situations where the first three categories are not applicable.
1.4 Purpose The purpose of the thesis is to investigate the possibility to use a Multi Body System (MBS)-software in Atlas Copco Craelius’ product development. MBS is a field within computational engineering where the mechanics of a system of, usually, rigid bodies is analyzed. It is also included in the thesis to build a model of the Mustang 5 rig with an MBS-software and simulate the rigid body dynamics of the rig. In particular, the extreme loads in the boom system during various rig operation situations and feed positioning is to be identified. It is expected that the positioning of the feed has a significant impact on the resulting dynamical loads in the boom system. How and the magnitudes of the impact is however unknown. According to measurements performed at Atlas Copco in Örebro, the lifespan of a similar surface drill rigs was reduced approximately 70 %, and in some cases even more, when the feed was vertically positioned during tramming [10]. In some rare cases they could even observe load peaks that exceeded the yield strength of the material. This gives reason to suspect that tramming with the feed in an unfavourable position would imply the same problematic load levels in the Mustang series as well. Evaluation of a load measurement on a somewhat similar type of surface drill rig in the report “Utvärdering av lastmätning av bomsystem på ”terrängrigg” ROC D” [2], at Atlas Copco in Örebro has shown that tramming and positioning of the feed has generated the highest load levels (the boom system on the ROC D7 is of a different type compared to the Mustang’s). In excess of these two scenarios, in the Mustang case, drilling is also expected to generate high loads. It has emerged, during the investigation of the structural failure, material which shows behaviour during drilling implying high loads in the boom system. Another, and in the end most important, incentive to improve the development procedure is financial savings. Ineffective methods necessitate more process iterations and prototypes to evaluate. Approximations and coarse assumptions will linger throughout the product development and an inaccuracy during an early design step is magnified by uncertainties in subsequent design phases. The gain of introducing numerical methods in the product development is the early adoption of better solutions, resulting in fewer changes in later phases of the development which reduces costs. Load related problems as fatigue and other structural failures are seldom addressed during the development phase but are instead emerging during customer use. To get feedback and in the end manage such problems can therefore be time consuming and very costly. For example the cost of a structural failure can be approximated. To start with are the direct costs, personal salary, flight tickets and accommodation during inspection of the failure, followed by the cost for repairing the damage including salary and material costs. The total cost of these expenditures is, conservative, approximately 140 000 SEK [11]. Then there are costs which are harder to determine, like lost customer’s trust and loyalty, company reputation, time delay in other projects and even the embarrassment of not fulfilling the earnests towards the customer. The worst case scenario is if someone is injured during the structural failure. Cash

Sida 6 (46)
Utfärdare (namn, telefon) Dokumentnummer Utgåva Datum
Anders Anbo 0831-100831-TR-01 1 100831
0831-100526-01 Identification of extreme load cases for a surface drill rig by means of MBS-simulations
Bla
nket
t ID
(IS
O):
BL-
0065
-6.0
value of these losses are however impossible to determine. Since the visible costs of only one structural failure would be a feasible budget for a load survey with numerical methods it is evident that Atlas Copco would reach break even if only one single structural failure is avoided. This urges for implementation of load simulations as a method during product development. An earlier master thesis – “Surface drill rig simulation” [3] – has been performed by J. Theander and P. Holmström at Atlas Copco in Örebro where the objective was to build an ADAMS-model of the surface drill rig L8 and by comparing model results with measurements evaluate the model. Their main conclusion was that the model could not be verified due to insufficient measurement data. The measurement data was collected within an earlier project and all their proposed methods for evaluating the model demonstrated the lack of crucial information. New measurements were needed to fulfil the objectives.
1.5 Procedure The MBS-software ADAMS View was used for the dynamic analysis, including creation of the rig model, simulation and evaluation of the results. It is manufactured by MSC software and those with specific interest of ADAMS is encouraged to read the MBS pre-study – ADAMS Simulation [4] – performed by M. Norling at Atlas Copco Rocktec or directed to the MSC software’s official homepage [5]. The model was built with the CAD-geometry of the Mustang 5 rig as a template. The essential parts of the rig driving the dynamics are included and modeled as rigid bodies which are interconnected with joints that represent correct kinematical constraints. Load levels during two different scenarios were investigated, namely drilling and tramming. Corresponding input data representing the two scenarios was defined and it was important to strive to use extreme but still likely motion events, since extreme motions yield extreme loads which constrain the rig’s structure strength. The drilling case was designed by re-creating a filmed rig behavior, operated by the same customer where the structural failures had occurred. The tramming scenario was created based on the approximated motion of the rig while tramming over an obstacle or a bump. Since the feed can be positioned in practically any direction it is impossible to analyze every case. The number of analyzed cases had therefore to be limited while interesting cases from a load point of view could not be omitted. Two feed positioning matrices were constructed, one for drilling and one for tramming. Since the global boom system behavior during the dynamic scenarios is of interest the simulation results shall be presented and evaluated in a lucid and accessible way. The measure possibilities in ADAMS are endless and do not limit analysis in any way. Relevant information are forces and length deviations in the hydraulic cylinders, forces and moments in all joints, velocities and accelerations of the included parts etc. It would not be feasible to analyze every quantity. The most practical quantity to describe the overall system characteristics is considered to be the forces in the hydraulic cylinders. Plots from the extreme case scenario for each cylinder are presented.
1.6 Disposition The thesis is divided in six chapters as follows.
1. Introduction – This chapter introduces the reader to the subject and reasons for investigation. It provides the prerequisites required and the main objectives of this thesis are also presented.

Sida 7 (46)
Utfärdare (namn, telefon) Dokumentnummer Utgåva Datum
Anders Anbo 0831-100831-TR-01 1 100831
0831-100526-01 Identification of extreme load cases for a surface drill rig by means of MBS-simulations
Bla
nket
t ID
(IS
O):
BL-
0065
-6.0
2. Modeling – The modeling of the dynamic system with ADAMS is demonstrated and a model of hydraulic cylinder behavior is derived. The model input data and feed positioning matrices are defined.
3. Results – In chapter 3 is the main results of this work presented. 4. Discussion – Chapter 4 gives an in depth discussion of the obtained results and includes
suggestions of further studies. 5. Conclusions – The most important conclusions for Atlas Copco are presented in this
chapter. 6. Recommendations – In the last chapter are recommendations based on the acquired
conclusions presented.

Sida 8 (46)
Utfärdare (namn, telefon) Dokumentnummer Utgåva Datum
Anders Anbo 0831-100831-TR-01 1 100831
0831-100526-01 Identification of extreme load cases for a surface drill rig by means of MBS-simulations
Bla
nket
t ID
(IS
O):
BL-
0065
-6.0
2 Modeling This chapter explains both the ADAMS-modeling and modeling of scenario input data.
2.1 ADAMS-model The rig is divided into three main parts; carrier, feed and boom system, which can be seen in Figure 2 and Table 1. The carrier is modeled as a rigid body which the feed, in practice, also is. The feed part includes the rotational unit and the rod holder, which is created as a block and then merged with the feed part. The rotational unit is connected with the feed via a translational joint. It allows for simulations where the rotational unit moves along the feed which is the case during drilling. It is however held fixed with respect to the feed, during all simulations within this project. Most model functionality is located in the boom system, see Figure 2, linking the carrier to the feed. Six rigid bodies, which are interconnected with revolute joints, are kept in position with the hydraulic cylinders. The detailed description of the hydraulic cylinder model is found in chapter 2.2. All joints in the model are ideal, i.e. they are frictionless and there is strictly no clearance. For detailed data of parts see appendix A2 and A3.
Figure 2 – Identification letter or names of included Mustang 5 parts in the ADAMS-model. For details see Table 1 Table 1 – List of names on parts modeled in the ADAMS-model. They can be seen in Figure 2 Id letter Name Modeled as Carrier Rigid body Feed Two rigid bodies; feed and rotational unit Boom system A – K A Bed carrier Rigid body

Sida 9 (46)
Utfärdare (namn, telefon) Dokumentnummer Utgåva Datum
Anders Anbo 0831-100831-TR-01 1 100831
0831-100526-01 Identification of extreme load cases for a surface drill rig by means of MBS-simulations
Bla
nket
t ID
(IS
O):
BL-
0065
-6.0
B Turntable Rigid body C Upper rod joint Rigid body D Boom Rigid body E Support Rigid body F Lower rod joint Rigid body G Boom raising cylinder Two rigid bodies; rod and cylinder H Tilt cylinder Two rigid bodies; rod and cylinder I Upper swivel cylinder Two rigid bodies; rod and cylinder J Lower swivel cylinder Two rigid bodies; rod and cylinder K Feed extension cylinder Two rigid bodies; rod and cylinder
2.2 Hydraulic cylinders As many of the other parts of Atlas Copcos products, hydraulic cylinders are manufactured by a subcontractor. In the Mustang 5 case the subcontractor of cylinders is Parker. All cylinders are so called double-acting which imply that they can exert motion and forces in both directions. All hydraulic cylinders on the rig, except the feed extension cylinder, have a rotational effect on the connected parts. They can produce forces equivalent to several tons. For example the boom raising cylinder can generate a force of 440 kN with maximum operational oil pressure of 220 bar. The cylinder chambers are closed when the hydraulic cylinder is in position and can endure even higher pressure levels. The cylinders can without a doubt withstand external forces which are twice the magnitude of the maximum generated force [12].
Figure 3 – Schematic illustration of a hydraulic cylinder. It consists of a cylinder (blue) and a rod which is connected with a piston (grey) separating the cylinder into two chambers. Both chambers are in this case
pressurized since it is double-acting. The hydraulic cylinder, seen in Figure 3, has the cylinder outer radius a, inner radius b and rod radius c. The left chamber has length l1, pressure p1 and cross section area A1. The right chamber has the corresponding values l2, p2 and A2. The resulting force F due to the pressure on both sides of the piston is
2211222
12 )( pApApcbpbF −=−−= ππ (1)
The change of force can be formulated as
2211 pApAF Δ−Δ=Δ (2) Since the hydraulic cylinders are supposed to be exposed to longitudinal forces only and no shear or bending forces they are interconnected in a specific way. The rod and cylinder parts are linked

Sida 10 (46)
Utfärdare (namn, telefon) Dokumentnummer Utgåva Datum
Anders Anbo 0831-100831-TR-01 1 100831
0831-100526-01 Identification of extreme load cases for a surface drill rig by means of MBS-simulations
Bla
nket
t ID
(IS
O):
BL-
0065
-6.0
with a translational joint. The cylinder end is mounted with a hooke joint and the rod end with a spherical joint. It results in one degree of freedom per hydraulic cylinder, the length of the hydraulic cylinder, as desired. The lower swivel cylinder is a special case due to the attachment to the rod joints. To achieve the correct degrees of freedom the cylinder part was mounted to the lower rod joint with a revolute joint and the rod part was mounted in the same way. Its cylinder and rod parts were interconnected with a cylindrical joint. The hydraulic cylinder stiffness is computed by adding a length deviation dependent force between all five cylinder and rod pairs. The force magnitude is derived in chapter 2.2.1.
2.2.1 Modeling hydraulic cylinder stiffness If a hydraulic cylinder is subjected to an external force in the direction along the cylinder, the total cylinder length changes compared to an unloaded cylinder. It exhibits features of flexibility, i.e. one of the chamber volumes decreases and the other volume increases when the piston moves. The flexibility can be derived from two different deformations, namely the compressibility of hydraulic oil and the elasticity of the material of which the cylinder is built. The hydraulic hoses do not contribute to the stiffness since there are valves that close when the cylinder is in position [12]. Thus the oil volume of interest is the one within the cylinder. Hydraulic oil is in most situations approximated as incompressible but it is more suitable in this context with a more precise oil behavior. The (isothermal) compressibility κ of a fluid is according to “Physics Handbook for Science and Engineering” [6] defined as
pV
V ΔΔ
−= 11κ (3)
where the compressibility κ is a fluid parameter which describes the rate of relative volume change V/V1Δ of the fluid at a given pressure difference pΔ . An alternative formulation of equation (3) is
βpVV Δ
−=Δ1 (4)
where κ has been substituted by β/1 . β is called the bulk modulus which is the reciprocal fluid compressibility parameter. The negative sign is because the oil volume decreases, 01 <Δ V , when the pressure increases, 0>Δp . The deformation of the cylinder material due to elasticity can be derived by applying pressure vessel theory. The vessel is in this case one of the hydraulic cylinders chambers. The cap end chamber has approximately the geometry of an ideal cylinder with length l and radius b and thus constitutes the volume
lbV 2π= (5) which changes according to the differentiation of the volume
lbbblV Δ+Δ=Δ 22 2 ππ (6)
The change in radius bΔ and length lΔ at a given pressure difference pΔ can be derived analytically and are according to “Roark’s formulas for stress and strain” [7] equal to

Sida 11 (46)
Utfärdare (namn, telefon) Dokumentnummer Utgåva Datum
Anders Anbo 0831-100831-TR-01 1 100831
0831-100526-01 Identification of extreme load cases for a surface drill rig by means of MBS-simulations
Bla
nket
t ID
(IS
O):
BL-
0065
-6.0
⎟⎟⎠
⎞⎜⎜⎝
⎛−
−++Δ=Δ 22
22 )21()1(baba
Epbb υυ (7)
⎟⎟⎠
⎞⎜⎜⎝
⎛−−Δ
=Δ 22
2 )21(ba
bEpll υ (8)
where E represents the cylinder material’s elasticity module, υ the material’s Poisson’s ratio and a the outer cylinder radius. If equation (7) and (8) are combined with equation (6) the following expression is obtained
( ))
)21(3)1(2
)21()21()1(2
22
22
22
22
22
222
2
baE(bapV
bab
Elpb
baba
EplbV
−−++
Δ=
=⎟⎟⎠
⎞⎜⎜⎝
⎛−−Δ
+⎟⎟⎠
⎞⎜⎜⎝
⎛−
−++Δ=Δ
υυ
υπυυπ
(9)
The pressure difference pΔ occurs due to external forces pressing the oil via the piston. The piston motion occupies the volumes V1Δ and V2Δ . The sum of (4) and (9) results in the total chamber and oil volume change,
⎟⎟⎠
⎞⎜⎜⎝
⎛−
−+++Δ=Δ+Δ=Δ
))21(3)1(2
22
22
21 baE(ba1VpVVV υυ
β (10)
On the other hand, the change in volume VΔ is coupled with the motion of the piston. The change of volume with respect to the piston is only dependent of length deviation and the radius is constant (compare with (5) and (6)). Equation (10) can be divided by the radial area of the piston which results in
⎟⎟⎠
⎞⎜⎜⎝
⎛−
−+++Δ=Δ
))21(3)1(2
22
22
baE(ba1pllp
υυβ
(11)
where l is the length of the chamber prior to the pressure change and lpΔ represents the movement of the piston. Taking both chambers into account and substituting 1pΔ and 2pΔ in equation (2) by use of equation (11), the following expression is obtained
⎟⎟⎠
⎞⎜⎜⎝
⎛−
−+++
⎟⎟⎠
⎞⎜⎜⎝
⎛ Δ−
Δ=Δ
))21(3)1(2
1
22
222
22
1
11
baE(ba1l
lA
ll
AF pp
υυβ
(12)
Since 21 ll pp Δ−=Δ they can be substituted with xΔ in equation (12) which results in

Sida 12 (46)
Utfärdare (namn, telefon) Dokumentnummer Utgåva Datum
Anders Anbo 0831-100831-TR-01 1 100831
0831-100526-01 Identification of extreme load cases for a surface drill rig by means of MBS-simulations
Bla
nket
t ID
(IS
O):
BL-
0065
-6.0
⎟⎟⎠
⎞⎜⎜⎝
⎛−
−+++
⎟⎟⎠
⎞⎜⎜⎝
⎛+Δ=Δ
))21(3)1(2
1
22
222
2
1
1
baE(ba1l
AlA
xFυυ
β
(13)
By introducing the spring constant k and Hooke’s law, xFk ΔΔ= / , equation (13) can be transformed into
⎟⎟⎠
⎞⎜⎜⎝
⎛−
−+++
⎟⎟⎠
⎞⎜⎜⎝
⎛+=
ΔΔ
=
))21(3)1(2
1
22
222
2
1
1
baE(ba1l
AlA
xFk
υυβ
(14)
An important remark to equation (14) is that it is not valid for unlimited negative pressure differences. The pressure in a chamber can only decrease until a near zero pressure is obtained, since negative pressures do not exist. When a chamber pressure has dropped to a certain pressure threshold tpΔ the pressure is approximately constant zero even if the chamber length continues to increase. This chamber does not therefore contribute to stiffness with length deviations beyond the threshold. The threshold is the same as ground pressure, where ground pressure is the chamber pressure in an unloaded cylinder. (14) is, in other words, a correct stiffness model as long as the pressure drop does not exceed tpΔ . Since it is expected to obtain pressure drops of such magnitudes the stiffness model has to be expanded. When the hydraulic cylinder is subjected to a sufficiently large pulling force the 11 / lA -term in equation (14) vanishes. The corresponding spring constant expression takes the form
⎟⎟⎠
⎞⎜⎜⎝
⎛−
−+++
=
))21(3)1(2
1
22
222
21
baE(ba1l
Akυυ
β
(15)
which is valid when tpp Δ<Δ 1 . During a sufficiently large pushing outer force the 22 / lA -term vanishes. A plot of this threshold phenomenon can be seen in Figure 4.

Sida 13 (46)
Utfärdare (namn, telefon) Dokumentnummer Utgåva Datum
Anders Anbo 0831-100831-TR-01 1 100831
0831-100526-01 Identification of extreme load cases for a surface drill rig by means of MBS-simulations
Bla
nket
t ID
(IS
O):
BL-
0065
-6.0
Figure 4 – Reaction force versus length deviation in boom raising cylinder during a pushing outer force F. Force
curves from three different cylinder lengths are presented. The curve shape is evidently changing with cylinder length. The represented cylinder lengths are: Red – 1407.6 mm (near maximum length), Blue – 1382.6 mm and
Magenta – 1355.1 mm. Since the left and the right chamber lengths, 1l and 2l , are denominators the cylinder stiffness will explode if the length of one of the chambers approaches zero. Another issue with near zero chamber lengths is that the model does not include mechanical stops. A mechanical stop defines the allowed position domain of the piston. The piston could therefore end up slightly outside the domain. To avoid such problems no hydraulic cylinder was positioned to the absolute maximum or minimum length during the simulations. The minimum chamber length used is around 5 mm. The red curve in Figure 4 shows the behaviour of a hydraulic cylinder in such position. It is evident that the short chamber contributes much more to the stiffness than the long one, given the large difference in slope. It can also be seen in Figure 4 that when the piston moves closer to the middle of the cylinder, the stiffness contribution from the chambers gets equalized. It would be desirable during ADAMS modeling to use the hydraulic cylinder’s length deviation to determine when zero chamber pressure is obtained. The stiffness of a hydraulic cylinder is however dependent on the starting position of the piston. Thereby is the length deviation to obtain zero pressure in a chamber also varies with position, see equation (14). This quantity can thus not be used. Another way of determining the point where the phenomenon occurs is to use the pressure threshold directly. The advantage is that it applies to whatever hydraulic cylinder length. The ADAMS-model does not include the chamber pressure difference explicitly but is made available easily by use of equation (11). Values for the threshold tpΔ were not available so a swift measure was performed to get an approximate value. The boom raising cylinder and the lower swivel cylinder was measured during a couple of cylinder length changes. The result can be seen in the appendix A4. In the model there are two contributions to the elasticity of the hydraulic cylinder, oil compression and steel deformation. They do not contribute equally to the spring effect. For example the model gives the approximate distribution of the spring effect (in the boom raising cylinder), 90 % oil compressibility and 10 % material elasticity.
Sida 14 (46)
Utfärdare (namn, telefon) Dokumentnummer Utgåva Datum
Anders Anbo 0831-100831-TR-01 1 100831
0831-100526-01 Identification of extreme load cases for a surface drill rig by means of MBS-simulations
Bla
nket
t ID
(IS
O):
BL-
0065
-6.0
All hydraulic cylinders are naturally damped, due to friction and viscosity, but levels or values of the damping are unfortunately rarely known by the manufacturers. Damping should therefore be added to the model of the cylinders but the damping magnitude has to be estimated. Earlier ADAMS experiences have shown that the damping value [Ns/mm] has an upper limit which is 10 % of the spring constant value [N/mm] to yield reasonable simulation behaviour [13]. The damping was therefore chosen to be 5 % of the corresponding cylinder’s spring constant.
2.3 Geometry The geometry was based on the latest (2010-03-01) CAD assembly version of the Mustang 5 rig.
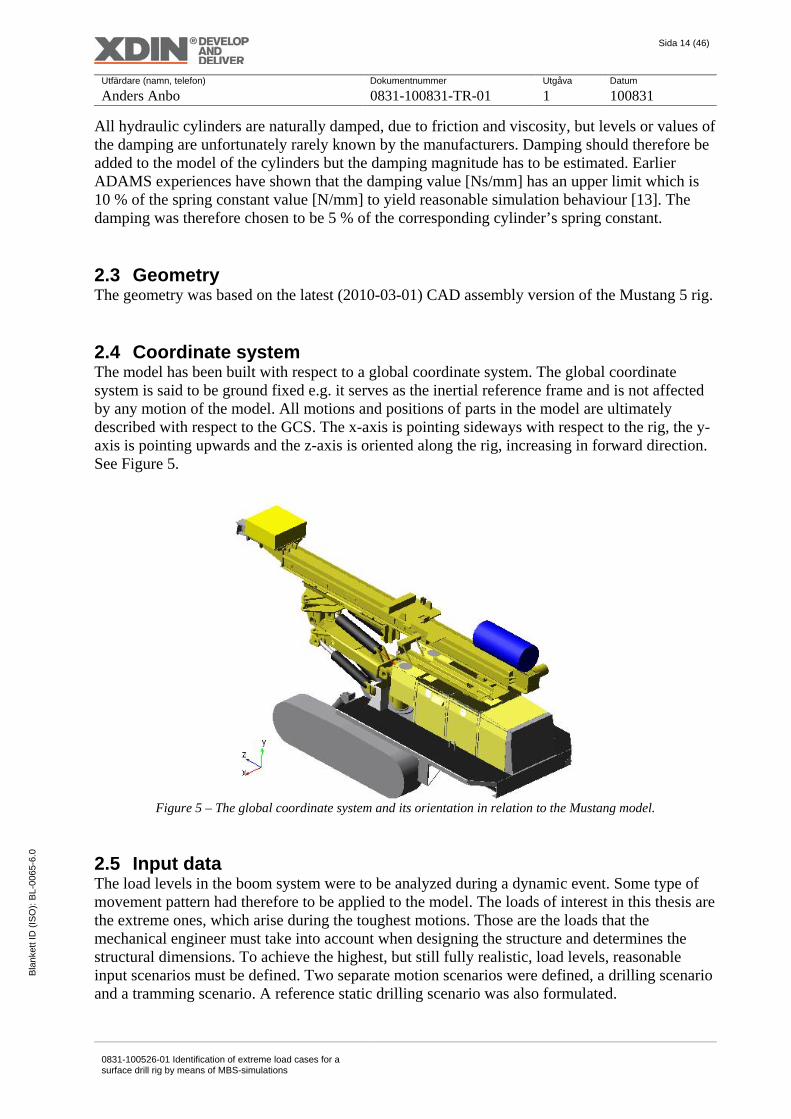
2.4 Coordinate system The model has been built with respect to a global coordinate system. The global coordinate system is said to be ground fixed e.g. it serves as the inertial reference frame and is not affected by any motion of the model. All motions and positions of parts in the model are ultimately described with respect to the GCS. The x-axis is pointing sideways with respect to the rig, the y-axis is pointing upwards and the z-axis is oriented along the rig, increasing in forward direction. See Figure 5.
Figure 5 – The global coordinate system and its orientation in relation to the Mustang model.
2.5 Input data The load levels in the boom system were to be analyzed during a dynamic event. Some type of movement pattern had therefore to be applied to the model. The loads of interest in this thesis are the extreme ones, which arise during the toughest motions. Those are the loads that the mechanical engineer must take into account when designing the structure and determines the structural dimensions. To achieve the highest, but still fully realistic, load levels, reasonable input scenarios must be defined. Two separate motion scenarios were defined, a drilling scenario and a tramming scenario. A reference static drilling scenario was also formulated.

Sida 15 (46)
Utfärdare (namn, telefon) Dokumentnummer Utgåva Datum
Anders Anbo 0831-100831-TR-01 1 100831
0831-100526-01 Identification of extreme load cases for a surface drill rig by means of MBS-simulations
Bla
nket
t ID
(IS
O):
BL-
0065
-6.0
2.5.1 Drilling According to the rig’s handling manual the feed ought to be somewhat fixed while drilling. This can be accomplished by means of the hydraulic cylinders, by pressing the feed’s end to the ground. To establish a good support it is desirable to apply sufficient pressure to the end of the feed so that the crawler rises a bit from the ground. However if the support cannot be established, due to soft soil, several degrees of freedom are introduced and the dynamics during operation is severely changed. Even if Atlas Copco urges the customers to follow the instructions, some customers, when there is time to save, do not operate the rig as instructed. The drilling motion scenario is based on the behavior on an observed Mustang 9 rig which was drilling positioned as in case 20, see Figure 8, in Italy. The sequence was recorded on film. The film clip makes it evident that the feed support has not been established and the feed was allowed to rock and oscillate. The maximum range of feed sway deviation in the film clip has earlier been estimated in the report “FE-analysis of boom failure in Mustang 9 drilling rig” [8] to approximately 50 mm. The sway appears mainly perpendicular to the feed’s lengthwise direction. The frequency df was estimated to 1.7 Hz. To recreate the filmed feed motion a rotating force was applied to the feed’s end (the same end where the hole is drilled) while the carrier was fixed. The force vector rotates, with constant length equivalent to 10 kN, in the plane perpendicular to the lengthwise direction of the feed. The force has the form
)ˆ)2cos(ˆ)2(sin(10 21 etfetfF dd ππ +=v
where t represents time, 1e and 2e are, feed fixed, unit vectors. The unit vectors are for example in Figure 5 equal to x and y . The unit of the force is kN. It is in this case more advantageous to use a force as input compared to applying a motion directly since it is easier to determine its plausibility. A motion is treated as a constraint in ADAMS and is fulfilled regardless the reaction forces. To achieve real magnitudes when applying a motion while a part is held fixed (the carrier in this case) acquire high model accuracy. For instance if a hydraulic cylinder would be modeled stiffer than in the real case, the resulting cylinder forces would consequently be too high. The “force input variant” would instead result in lower length deviations in the cylinder and maintain the resulting force levels. The drilling scenario is not expected to give rise to structurally restricting load levels but still sufficiently high to be restricting based on fatigue. The static drilling scenario is based on drilling case 20, see Figure 8. Instead of the rotating force is a constant force applied at the same position as the rotating force. The force points upward, along the y-axis, as if the feed was pressed against the ground. The force magnitude of 54 kN is equivalent to the force needed to slightly lift the crawler from ground. This is the preparation which Atlas Copco recommends when drilling according to case 20.
2.5.2 Tramming When tramming over an obstacle the carrier is exposed to a seesaw effect because, at some point, the center of mass moves over the obstacle from one side to the other. The rig starts to rotate with the obstacle as pivot point until the tracks reach the ground on the other side. It is expected that the highest loads when tramming are generated from an impact during a situation of this kind. The tramming simulation input is not based on this behavior, since it is difficult to define the seesaw effect and impacts without knowledge of acceleration levels. The tramming motion was designed as if the rig was tramming over a smooth bump. What happens when the rig is tramming over a bump is that the rig starts to rotate backwards or rise

Sida 16 (46)
Utfärdare (namn, telefon) Dokumentnummer Utgåva Datum
Anders Anbo 0831-100831-TR-01 1 100831
0831-100526-01 Identification of extreme load cases for a surface drill rig by means of MBS-simulations
Bla
nket
t ID
(IS
O):
BL-
0065
-6.0
while it moves upwards. At the top of the bump, the rig passes horizontal position while it tilts forward. This could be defined satisfactorily by trigonometric functions.
Figure 6 – A hypothetical bump
The rig has a maximum speed v of 2 km/h. The purpose of the applied motion is to provoke the extreme loads in the structure, which is the reason why the top speed was chosen as input speed to the model. The bump was thought to be of the same length L as the tracks, between the centres of the outermost sprockets, 2135 mm. The bump height H was chosen to 10 % of the length, see Figure 6. The period T for the rig to pass the bump is equal to 2L/v = 7.6 s. The rig is able to tram on a sloping surface and it is assumed to somewhat influence the load levels. There are regulations of drill rigs and a drill rig of Mustang type must be designed to fulfil a safety angle margin for tramming stability without anchoring. According to the Swedish Standards Institute’s “Drill rigs – Safety” [9] the angle is 10 degrees. This effect is included in the tramming scenario by letting the scenario consist of two bumps, one, for the tracks, symmetric and the other one which only one of the tracks runs over. It is in practise solved by adding a roll rotation with maximum angle deviation of 10 degrees that starts after time T. When tramming the track links, with length, l = 149 mm, induce quivers with a certain period
qT , determined by the velocity of the rig, l/v = qT = 0.268 s. Part of the rattle is absorbed by the carrier which does not happen in the ADAMS-model. It is therefore hard to estimate the remaining amplitudes of the oscillations after the transmission from the tracks to the boom system. The amplitude of the oscillation was tuned to a reasonable level by visual inspections of test simulations. A reasonable level was thought to be when the oscillations were not visible to the naked eye but nevertheless measurable as force deviations in the hydraulic cylinders. By combining these motions they can be formulated as
⎟⎠⎞
⎜⎝⎛=
Tt
THy ππ 2sin&
⎪⎩
⎪⎨⎧
<<
>⎟⎠⎞
⎜⎝⎛−=
Tt
TtT
tTz
00
2sin10 ππω
o
&
⎟⎟⎠
⎞⎜⎜⎝
⎛−⎟
⎠⎞
⎜⎝⎛−=
qx T
tT
t ππω 2sin0067.02sin71.5 oo
The combined motion is applied to a point P on the crawler ground level (y-axis), in between a track’s outer sprockets (z-axis) and in between the tracks (x-axis). y& is translational velocity along the y-axis, zω& is rotational velocity around the axis through the point P parallel to the z-axis and xω is rotation around the axis through the point P parallel to the x-axis. It results in a smooth motion of the carrier which actually is unwanted. An easy way to make the motion more extreme is by shortening the period T. For instance if the bump were a more distinct obstacle, like a stone, the period T would be approximately L/v = 3.8 s. Since it is expected that it would yield a motion closer to the real seesaw effect motion, this period was chosen to the tramming input scenario.

Sida 17 (46)
Utfärdare (namn, telefon) Dokumentnummer Utgåva Datum
Anders Anbo 0831-100831-TR-01 1 100831
0831-100526-01 Identification of extreme load cases for a surface drill rig by means of MBS-simulations
Bla
nket
t ID
(IS
O):
BL-
0065
-6.0
2.6 Positioning of the feed The five hydraulic cylinders in the boom system give the possibility to position the feed almost in any desired direction, see Figure 7. In order to find the worst boom system position from a load perspective it is necessary to limit the number of analyzed positions, mainly because it has to be possible to simulate and analyze all cases within a limited time. But also because it should be possible, with some reasoning, to determine if some of the degrees of freedom have no or little affect on the load levels. The following philosophy was used when interesting feed positioning was defined. When the centre of gravity is moved away from a pivot point the corresponding hydraulic cylinder loads is increased during a dynamic event. Partly because the moment of inertia increases but also when the lever arm to gravity is extended. The boom system position is expected to have a distinct impact on the load levels. It is therefore important to cover all extreme scenarios and reduce possible cases carefully. The first reduction that can be done applies to the lower swivel cylinder. It rotates the whole boom system and feed (seen to right in Figure 7) and since the, within this project, only analyzed quantities are within the boom system, the lower swivel cylinder has a low influence on the load levels. It is therefore of same length in all cases. If loads between the support and the carrier were analyzed, the length of this cylinder would instead be of great importance. The second reduction applies to the feed extension cylinder. It is thought to contribute most to the load levels when it positions the feed’s centre of gravity as far away from the boom system as possible which is the case when the cylinder’s length is maximized. This feed extension cylinder position combined with that the rotational unit is positioned as far back as possible (see Figure 5) is used in all cases. Two positioning matrices were defined, one for drilling analyzes and one for tramming.
Figure 7 – Illustration of the positioning possibilities of the feed. The position of the boom system is defined by the lengths of the hydraulic cylinders. Since no mechanical stops are present in the model, the lengths of the cylinders are in no case set to the absolute maximum or minimum. But since the lengths of the cylinders during simulations vary at most a couple of millimetres, mechanical stops are only of interest in the cases where the extreme lengths are supposed to be used. To avoid that the virtual piston is outside of the allowed domain, the length is, in the relevant cases, set to approximately 5 mm from the extreme value. Its impact on the dynamics is hardly of any importance.
2.6.1 Drilling An additional degree of freedom is reduced in the drilling scenario. The boom raising cylinder is most often positioned somewhere around half length when drilling which is why it is held in the same position during all drilling simulations (With the boom angle 5.18 degrees from horizontal

Sida 18 (46)
Utfärdare (namn, telefon) Dokumentnummer Utgåva Datum
Anders Anbo 0831-100831-TR-01 1 100831
0831-100526-01 Identification of extreme load cases for a surface drill rig by means of MBS-simulations
Bla
nket
t ID
(IS
O):
BL-
0065
-6.0
plane). It results in two degrees of freedom, namely the position of the tilt cylinder and the upper swivel cylinder. They constitute a 2 dimensional matrix. They are positioned in three lengths each, which yield the feed rotation 0, 45 and 90 degrees in two directions from the default boom system positioning seen in Figure 5. It results in the 3 by 3 matrix which can be seen in Figure 8. These 9 cases cover virtually every drilling scenario for a Mustang rig. However these are not all common scenarios. The distribution of time spent on different drilling cases with an average mustang rig was estimated by Lars Mickelsson [14]. The absolute most frequent scenario is case 20 which is vertical drilling. It is utilized approximately 65 % of a rig’s life span. The second most frequent case is 22, sideways horizontal drilling. The utilization rate of case 22 is approximately 15 %. It is more common than case 02 and 12 since the hole can be drilled closer to ground which is often preferred. Case 10 and 21, drilling diagonally downwards, are approximately utilized 5 % each. The rest of the cases are seldom applied and share the remaining 10 % of the life span. If a customer mainly uses the rig to drill horizontal holes they most often choose to equip the mustang rig with a 90 degrees swing bracket. It tilts the feed 90 degrees and when the operator drills according to case 22, a much better overview of the drill string and the borehole is achieved. Without the 90 degrees swing bracket, the drill string and the borehole is hidden behind the feed from an operator’s view standing at the control panel, which makes the drilling a lot more problematic. This indicates that for the standard version of the rig, which is analyzed within this thesis, the utilization rate of case 22 could be somewhat lower than 15 %.
Figure 8 – Drilling positioning matrix. The larger figures show the rig from the side and the smaller from above.
Two degrees of freedom is examined. The first digit represents position of the tilt cylinder and the second represents the position of the upper swivel cylinder.

Sida 19 (46)
Utfärdare (namn, telefon) Dokumentnummer Utgåva Datum
Anders Anbo 0831-100831-TR-01 1 100831
0831-100526-01 Identification of extreme load cases for a surface drill rig by means of MBS-simulations
Bla
nket
t ID
(IS
O):
BL-
0065
-6.0
2.6.2 Tramming All three degrees of freedom are examined during tramming simulations, the position of the tilt cylinder, the boom raising cylinder and the upper swivel cylinder. The boom raising cylinder and upper swivel cylinder are positioned in two lengths each, maximum and minimum cylinder length and 0 and 90 degrees feed rotation respectively. The tilt cylinder is positioned in four lengths which yield the feed rotation 0, 30, 60 and 90 degrees. The resulting 4 by 2 by 2 positioning matrix is presented in Figure 9. All examined cases are not applicable in a real case but can still be of interest since it adds to the total understanding of the relationship feed positioning – boom system stress during a dynamical scenario. It completes the picture of the load levels dependence on the positioning of the feed. The tramming cases which are not applicable are 101, 201, 301, 311 and 002. The reason for the inapplicability is, by looking at Figure 9, obvious. In case 101, 201, 301 and 311 the feed would be jammed into ground and make the rig impossible to move. The case 002 violates the physical constraint of the drill rig. Besides the tramming matrix, another feed positioning is simulated. It represents the default tramming position where the feed is lowered and horizontal, as in drilling case 00, see Figure 8. This positioning is by Atlas Copco recommended when tramming with the rig.

Sida 20 (46)
Utfärdare (namn, telefon) Dokumentnummer Utgåva Datum
Anders Anbo 0831-100831-TR-01 1 100831
0831-100526-01 Identification of extreme load cases for a surface drill rig by means of MBS-simulations
Bla
nket
t ID
(IS
O):
BL-
0065
-6.0
Figure 9 – Tramming positioning matrix. The larger figures show the rig from the side and the smaller from above. Three degrees of freedom is examined. The first digit represents position of the tilt cylinder, the second position of the upper swivel cylinder and the third represents the position of the boom raising cylinder.

Sida 21 (46)
Utfärdare (namn, telefon) Dokumentnummer Utgåva Datum
Anders Anbo 0831-100831-TR-01 1 100831
0831-100526-01 Identification of extreme load cases for a surface drill rig by means of MBS-simulations
Bla
nket
t ID
(IS
O):
BL-
0065
-6.0
3 Results The results are divided into two sections, namely drilling and tramming. The cases which yielded the highest load level, per hydraulic cylinder, are presented in Figure 10, for drilling, and Figure 16, for tramming. Cylinder force plots from the cases where an extreme force has occurred is from drilling simulations shown in Figure 11 to Figure 15 and from tramming simulations in Figure 17 to Figure 21. A positive force value represents a pulling force with respect to the hydraulic cylinder and vice versa. Extreme load results from all simulations are presented in appendix A1. Table 2 presents the positioning cases which constrain the strength of a boom system part. The table is only based on the hydraulic cylinder forces. It means that other joints on a part could be exposed to the maximum load during another case. Notice that the positioning in the drilling and tramming cases in each row are approximately the same, i.e. the extreme loads coincide in the same positioning regardless of input scenario. Table 2 – Strength constraining positioning cases for each part in the boom system, based on forces from the hydraulic cylinder mountings only. Forces in other joints e.g. between parts, is not taken into consideration. The cases within brackets yielded highest forces but are inapplicable. Part Connected cylinders Strength constraining
drilling cases Strength constraining tramming cases
Support Boom raising cylinder 22 312 Boom Boom raising cylinder 22 312
Tilt cylinder 00 102, (002, 301) Turntable Tilt cylinder 00 102, (002, 301)
Upper swivel cylinder 22 211 Bed carrier Upper swivel cylinder 22 211
Feed extension cylinder 20 302, (201) Rod joints Lower swivel cylinder 10 312 Both cases which give highest forces in the tilt cylinder are inapplicable tramming cases. Case 002 and 301 can therefore not be constraining and are shown within brackets. The second largest load occurred during case 102. The same is true with the feed extension cylinder during case 201. The applicable case which yielded highest force in the feed extension cylinder was 302.
3.1 Drilling In Figure 10, where for the hydraulic cylinders extreme cases are presented, is also each case utilization rate superimposed. It is visualized by the matrix cell background color, the darker color the more often is the corresponding positioning used. Each of the five hydraulic cylinder forces, from the cases where the maximum cylinder force occurred, are presented in Figure 11 to Figure 15. Included in those figures are also the resulting forces from simulations according to case 20, even though it, in most cases, did not yield the highest load levels, and the static drilling case. Case 20 is included, since it does not make sense to compare the static results to other than case 20. Due the feed position in the static case is the same as in case 20 and other static cases were not created.

Sida 22 (46)
Utfärdare (namn, telefon) Dokumentnummer Utgåva Datum
Anders Anbo 0831-100831-TR-01 1 100831
0831-100526-01 Identification of extreme load cases for a surface drill rig by means of MBS-simulations
Bla
nket
t ID
(IS
O):
BL-
0065
-6.0
Figure 10 – The extreme load case, per hydraulic cylinder during drilling, is represented by a red marked cylinder. If a hydraulic cylinder is red in more than one case, the resulting load in the case is no less than 90 % of the maximum load. The darker the background color, the more common is the drilling case. The small figures in the upper right corners show the positioning.
Figure 11 – The boom raising cylinder showed during drilling the highest reaction force with the positioning according to case 22, presented as a seamless red line. A comparison of the force level during case 20 and the corresponding static scenario can also be seen.

Sida 23 (46)
Utfärdare (namn, telefon) Dokumentnummer Utgåva Datum
Anders Anbo 0831-100831-TR-01 1 100831
0831-100526-01 Identification of extreme load cases for a surface drill rig by means of MBS-simulations
Bla
nket
t ID
(IS
O):
BL-
0065
-6.0
Figure 12 – The tilt cylinder showed during drilling the highest reaction force with the positioning according to case 00, presented as a seamless red line. A comparison of the force level during case 20 and the corresponding static scenario can also be seen.
Figure 13 – The upper swivel cylinder showed during drilling the highest reaction force with the positioning according to case 22, presented as a seamless red line. A comparison of the force level during case 20 and the corresponding static scenario can also be seen.

Sida 24 (46)
Utfärdare (namn, telefon) Dokumentnummer Utgåva Datum
Anders Anbo 0831-100831-TR-01 1 100831
0831-100526-01 Identification of extreme load cases for a surface drill rig by means of MBS-simulations
Bla
nket
t ID
(IS
O):
BL-
0065
-6.0
Figure 14 – The lower swivel cylinder showed during drilling the highest reaction force with the positioning according to case 10, presented as a seamless red line. A comparison of the force level during case 20 and the corresponding static scenario can also be seen.
Figure 15 – The feed extension cylinder showed during drilling the highest reaction force with the positioning according to case 20, presented as a seamless red line. For comparison is also the static scenario load level included.
3.2 Tramming The utilization rate is also in the tramming case superimposed in the figure which shows the extreme load cases, see Figure 16. They are approximates and based on the utilization rates from the drilling cases. There are indications that the positioning customers uses while drilling also is the positioning used while tramming. All hydraulic cylinder force results, Figure 17 to Figure 21, are plotted together with the corresponding force from the default tramming simulation. It is included for comparison between

Sida 25 (46)
Utfärdare (namn, telefon) Dokumentnummer Utgåva Datum
Anders Anbo 0831-100831-TR-01 1 100831
0831-100526-01 Identification of extreme load cases for a surface drill rig by means of MBS-simulations
Bla
nket
t ID
(IS
O):
BL-
0065
-6.0
the recommended tramming positioning and those positioning shown to be extreme, in terms of load levels. An important remark to make, regarding the load levels during the default tramming case, is that the load levels should be low, which is the obvious reason why the positioning is recommended. The results seem to coincide with the expected, except in the tilt cylinder case. The high load level in the tilt cylinder with the default positioning does not represent the true behavior. In reality, the feed rests on a supporting surface on the carrier which results in that the tilt cylinder is unloaded. This effect is not modeled in this project. Figure 22 and Figure 23 show comparison plots of the normal model setup and a modified hydraulic cylinder model. The modified model does not include the threshold effect and is strictly based on (14).
Figure 16 – The extreme load case, for each hydraulic cylinder during tramming, is represented by a red marked cylinder. If a hydraulic cylinder is red in more than one case, the resulting load in the case is no less than 90 % of the maximum load. The darker the background color, the more common is the tramming case (approximately). The small figures in the upper right corners show the positioning.

Sida 26 (46)
Utfärdare (namn, telefon) Dokumentnummer Utgåva Datum
Anders Anbo 0831-100831-TR-01 1 100831
0831-100526-01 Identification of extreme load cases for a surface drill rig by means of MBS-simulations
Bla
nket
t ID
(IS
O):
BL-
0065
-6.0
Figure 17 – Comparison of reaction force in the boom raising cylinder during tramming case 312 and the default tramming positioning. The boom raising cylinder showed during tramming the highest reaction force with the positioning according to case 312, presented as a seamless red line.
Figure 18 – Comparison of reaction force in the tilt cylinder during tramming case 002, 301 and the default tramming positioning. The tilt cylinder showed during tramming highest reaction forces with the positioning according to case 002 and 301, presented as a seamless red line and a dashed cyan line respectively. The cylinder is in case 002 object to a compressive force and in case 301 a pulling force.

Sida 27 (46)
Utfärdare (namn, telefon) Dokumentnummer Utgåva Datum
Anders Anbo 0831-100831-TR-01 1 100831
0831-100526-01 Identification of extreme load cases for a surface drill rig by means of MBS-simulations
Bla
nket
t ID
(IS
O):
BL-
0065
-6.0
Figure 19 – Comparison of reaction force in the upper swivel cylinder during tramming case 211 and the default tramming positioning. The upper swivel cylinder showed during tramming the highest reaction force with the positioning according to case 211, presented as a seamless red line.
Figure 20 – Comparison of reaction force in the lower swivel cylinder during tramming case 312 and the default tramming positioning. The lower swivel cylinder showed during tramming the highest reaction force with the positioning according to case 312, presented as a seamless red line.

Sida 28 (46)
Utfärdare (namn, telefon) Dokumentnummer Utgåva Datum
Anders Anbo 0831-100831-TR-01 1 100831
0831-100526-01 Identification of extreme load cases for a surface drill rig by means of MBS-simulations
Bla
nket
t ID
(IS
O):
BL-
0065
-6.0
Figure 21 – Comparison of reaction force in the feed extension cylinder during tramming case 201 and the default tramming positioning. The feed extension cylinder showed during tramming the highest reaction force with the positioning according to case 201, presented as a seamless red line.
Figure 22 – A comparison between the normal model setup and a modified model during tramming case 312. The modified model does not include the threshold effect in the hydraulic cylinders and is strictly based on (14).

Sida 29 (46)
Utfärdare (namn, telefon) Dokumentnummer Utgåva Datum
Anders Anbo 0831-100831-TR-01 1 100831
0831-100526-01 Identification of extreme load cases for a surface drill rig by means of MBS-simulations
Bla
nket
t ID
(IS
O):
BL-
0065
-6.0
Figure 23 – A comparison between the normal model setup and a modified model during tramming case 201. The modified model does not include the threshold effect in the hydraulic cylinders and is strictly based on (14).

Sida 30 (46)
Utfärdare (namn, telefon) Dokumentnummer Utgåva Datum
Anders Anbo 0831-100831-TR-01 1 100831
0831-100526-01 Identification of extreme load cases for a surface drill rig by means of MBS-simulations
Bla
nket
t ID
(IS
O):
BL-
0065
-6.0
4 Discussion The load levels are evidently highly dependent on the positioning of the feed. However the extreme cases for each of the hydraulic cylinders do not coincide in one and the same boom system positioning. The extreme values have a considerable spread throughout the positioning matrices, Figure 10 and Figure 16. In other words the worst scenario for a certain detail may have a mild impact on another, see Table 2. In particular the boom raising cylinder and the tilt cylinder seem to have somewhat of an inverse relationship. A natural explanation is that the feed’s centre of gravity is in many cases located in between the cylinder’s pivot points with respect to the horizontal plane. Since the centre of gravity of the feed is, in the rig’s default positioning, situated above the boom system the dynamics alters heavily when the centre of gravity is moved to another side of a hydraulic cylinders pivot point. Table 2 can be used when optimizing a part in the boom system. It presents the load cases which must be taken into account when a parts design is optimized. A part in the boom system is interconnected to at least one hydraulic cylinder and at least another part. The reaction force in the joint to the other part is not considered. Table 2 might have to be expanded to include this information as well to be complete. The table is however expected to virtually retain its form if this information was included. The only types of rig usage analyzed within this thesis are tramming and drilling, although the experimental data from Atlas Copco in Örebro has shown that positioning could also generate load levels of the same magnitude as from tramming [2]. Dynamical loads occur when positioning the boom system, especially when the hydraulic cylinders are set in motion or is stopped suddenly. To gain a complete load picture it may be necessary to investigate the positioning case as well.
4.1 Modeling The hydraulic cylinder model has a minor flaw. In the derivation the two chambers are treated as separate cylinders. But they are of course two sections of the same cylinder separated by the piston. When one expands the other contracts and this causes some boundary effects in the material around the piston not considered in the derivation. Also the volume change is based on theory applied on perfect, non-leaking cylinders. However it is expected to be negligible especially when the oil compressibility accounts for the major contribution. Phenomena that have not been introduced in the model are friction and mechanical stops. A reason to not add more functionality to the model is that there seldom exist values or measured levels of those phenomena. Values of hydraulic cylinder damping and friction are not even available from the manufacturer. As long as a model represents reality well, there is no reason to expand the complexity. In all, the model is expected to be a reasonable estimate of the hydraulic cylinder’s behavior. The challenge with the model is to find correct parameter values. Since Atlas Copco has many sub-contractors, all detail data are not easily accessible. Data such as mass and moment of inertia for the included parts were not readily available. In most cases, there were fairly complete CAD-drawings available, which were used to extract the mass and the moment of inertia from. In other cases, e.g. the hydraulic cylinders, rod holder and the rotational unit, the parts had to be approximated as simple geometrical bodies with the approximate correct total weight to achieve moment of inertia information.

Sida 31 (46)
Utfärdare (namn, telefon) Dokumentnummer Utgåva Datum
Anders Anbo 0831-100831-TR-01 1 100831
0831-100526-01 Identification of extreme load cases for a surface drill rig by means of MBS-simulations
Bla
nket
t ID
(IS
O):
BL-
0065
-6.0
The damping was chosen based on experience of earlier model behavior, but the accuracy is somewhat limited. The only visible force frequencies are the ones from the input data. In Figure 11 to Figure 15 is the frequency of 1.7 Hz from the rotating force used as drilling input visible. In Figure 17 to Figure 23 are the two frequencies from tramming input data visible, the slow 0.26 Hz frequency from the rotation and translation of the carrier and the faster 3.7 Hz frequency from the track links quaver. This suggests that the model is strongly damped since there are no other oscillations visible, e.g. from the hydraulic cylinders. Another challenging model parameter is the threshold which determines when the pressure in one of the chambers reaches zero. It was estimated from pressure measurements on the boom raising and lower swivel cylinder. The measurements did unfortunately not yield an unambiguous conclusion. The ground pressure levels in the chambers did not have distinct values. They seemed to vary within an interval of approximately 30 bar. A reason for this could be that the measured cylinders were constantly subjected to external forces, from the weight of the boom system and feed. The ideal would be to measure the value on an unloaded hydraulic cylinder, but a cylinder is always somewhat loaded when installed in a structure. The boom raising cylinder threshold could still be determined with a fair accuracy. The corresponding value for the feed extension cylinder was not measured but estimated based on the data from the measured cylinders and the relative size. The uncertainty in this value is greater but it should still be qualitatively acceptable. The contribution from modeling the pressure threshold to the resulting load levels seem however to be very mild. In Figure 22 the two resulting force curves follow each other tightly with a difference of some few kN and in Figure 23 the two simulation results are indistinguishable to the naked eye. That means, on the other hand, that it has a significant contribution to hydraulic cylinder length deviations since the threshold modeling changes the stiffness (N/mm). The chosen model should therefore be dependent on the resulting information of interest. In the cases where only the load levels are of interest, it seems that the threshold modeling simply does not have any significance. In the drilling case however, where the length deviation is used when choosing input data, is the threshold modeling likely to be more important. The same relationship should exist between flexible and rigid bodies, i.e. low contribution to the resulting load levels but more important for gaining accurate length deviations. All parts included in the model are modeled as rigid bodies which is a simplification. But since the requested quantity is load levels, the approximation is expected to be good and have a negligible affect on accuracy. No indications to the contrary can be found in the earlier master thesis either [3].
4.2 Input data The dominating source of error is presumably the input data. They are based on estimations and rough guesses. They were created and defined by estimations of the rig’s motion. Ideal would however be to have an experimental acceleration spectrum measured on the carrier. One step of estimation could have been eliminated this way. Since such data was not available, that option was not applicable. The simulation results are however correctly calculated for the motions given. The only question mark is whether they represent the extreme motions the rig is exposed to in reality, i.e. if the resulting load levels is the real extreme load levels. The method works anyway excellent for positioning comparison and for pointing out critical positioning. There might be some eigenfrequencies in the system that magnify the sway when tramming over a bump at a certain speed. It means that it might be worse if the bump was run over with a lower speed than with the maximum. Such information was not available and could therefore not be

Sida 32 (46)
Utfärdare (namn, telefon) Dokumentnummer Utgåva Datum
Anders Anbo 0831-100831-TR-01 1 100831
0831-100526-01 Identification of extreme load cases for a surface drill rig by means of MBS-simulations
Bla
nket
t ID
(IS
O):
BL-
0065
-6.0
taken into account. Without this effect the maximum speed definitively results in the worst dynamical loads. In the drilling cases the input is based on imitating a behavior seen on a Mustang 9. Even though it is not the same rig as the one modeled in this project they share most of the structure and features. Another weakness in this approach is that it is problematic to determine the sway amplitude of the feed by ocular inspection. Even if the amplitude is in essence correctly determined it is not directly applicable to the model since the degrees of freedom are reduced and the clearance in bushings is eliminated. For example, even if most of the sway in a real rig originates from the boom system and hydraulic cylinders, the carrier is also part of the sway even if slightly. Another source of higher amplitudes with the real rig is the flexibility of the bodies. All real bodies deform more or less when subjected to forces. Especially the long and slender parts, like the feed, are expected to contribute to the sway amplitude. Altogether, to generate correct load levels in the simulations, the hints strongly suggest that a lower deviation than the one estimated from visual inspection is required. The input data was with this reasoning chosen in such way that it resulted in smaller deviation amplitudes. For example the rotating 10 kN force applied to the feed results in simulation case 20 in a maximum deviation of 18 mm. It is approximately 70 % of the maximum deviation in the real case scenario. The plausibility of the magnitude of the applied force is, without experimental data to compare with, hard to determine. The choice of drilling input signal has been based on the rig behavior when drilling with the feed positioned as in case 20. Since there is no available material from other feed positions, the same rotating force is used in all other drilling simulations as well, even though the behavior during another feed positioning could call for a modified force. It can therefore be suspected that the resulting load levels in case 20 are the most accurate. Drilling case 20 is however by far the most common drilling scenario for the Mustang rig. Without proper input data to the ADAMS-model it is a bit like being back at square one. A profit with a MBS-software is to obtain more accurate input data for later FEM-analyses. Classically, if no experimental data is available as FEM input, the load levels are often approximated and estimated. If the MBS-software analysis incorporates an element of inconvenient approximations it could actually end up being just as accurate to directly approximate the input loads to a FEM-software.
4.3 Drilling The difference between drilling with sufficient support and achieving a somewhat static behavior and the case where the feed sways and oscillates can be seen in Figure 11 to Figure 15. Simulations according to case 20 are both presented with a static and an oscillating feed behavior. The results show large differences, the force direction is even reversed in several cases. The force levels in the non-static situation oscillate around the static equilibrium in case 20. The load deviation levels, which occur with the applied rotating force, are high. All hydraulic cylinders except for the feed extension cylinder are making it evident that the oscillating scenario generates significantly higher load levels than during static behavior and a similar situation would probably be seen if other positioning was compared to its static analogy. For example, there is a 300 % increase in force level in the tilt cylinder, seen in Figure 12. The total load levels are even high compared to tramming results. This, combined with the fact that apparent oscillations occur, yield an accelerated fatigue in the boom system. On the other hand it is not completely accurate to compare with a strictly static case since there is always some movement in the feed. The load levels in the static case can therefore be expected to be slightly higher.

Sida 33 (46)
Utfärdare (namn, telefon) Dokumentnummer Utgåva Datum
Anders Anbo 0831-100831-TR-01 1 100831
0831-100526-01 Identification of extreme load cases for a surface drill rig by means of MBS-simulations
Bla
nket
t ID
(IS
O):
BL-
0065
-6.0
The accuracy in the drilling results is limited due to reasons discussed in 4.2. There are not only quantitative uncertainties but also an uncertainty in the accuracy in comparing different drilling results. Since the drilling scenario is based on a behavior from one positioning, the correct behavior during other positioning might not be achieved. It is however clear that the feed sway gives an unwanted increase in the boom system’s load levels. The rig operator always has the choice when tramming to position the feed in a, for the boom system merciful, position. Unlike tramming scenarios, choosing another positioning when drilling is not an option. The positioning in this case is determined by the angle and type of hole that is desired. The way to spare the boom system from early fatigue is therefore to, in the best way possible, provide the feed support to prevent the oscillations. The mechanisms behind how the feed sway and oscillations occur are not yet known. It is obvious that the rotational unit in some situations induce oscillations in the feed. It can be run along the feed at speeds of 0.5 m/s and when its velocity changes direction abruptly it generates reaction forces in the feed which results in feed sway and oscillations. However this does not explain the observed behavior completely. An explanation could be that the drill resistance varies widely and rapidly in the soil.
4.4 Tramming It is obvious, from looking at tramming results in Figure 17 to Figure 21, that the feed positioning determines the load levels in the boom system. All hydraulic cylinders force plots, except the one from the tilt cylinder, verify the suspicion of problematic load levels during certain tramming situations. For example the boom raising cylinder experiences a sevenfold increase in force magnitude when tramming according to case 312 compared with the default tramming positioning. The tilt cylinder is actually no exception. The tilt cylinder result, in Figure 18, has an important remark. In reality when tramming with the default positioning of the boom system, the feed has contact with the carrier and is supported. The small motion of the feed which arises when tramming is consequently restrained by the contact surface. This phenomenon is however not modelled within this thesis. The significant difference between reality and simulation results should be the levels of the forces exerted on the tilt cylinder and it is not surprising to see the high load levels during the default tramming case in Figure 18. Gravity and the mass of the feed create a moment around the tilt cylinders pivot point. The counter moment is in the simulation only educed from the tilt cylinder while in reality the support surface on the carrier exerts the major part of the counter moment. The load levels from the default tramming case in Figure 18 should therefore be substantially lower. These results make it evident that tramming with the feed in unfavourable positions results in problems i.e. shortened lifespan. The straight forward way of avoiding problems of this kind, which is also practiced by Atlas Copco, is by instructing rig operators to only use recommended tramming positioning. Since operators are rarely forced to tram with a certain positioning, the default positioning ought to be sufficient. Yet it turns out that customers tram in other ways. What remains then is to try to improve the boom system to withstand the obtained load levels. This can be done by the use of Table 2. Force measures from the tramming simulations, Figure 16, seem to fit nicely with the arguments used to reduce the varying parameters during construction of the positioning matrices. The maximum load cases occur as suspected. Wherever the horizontal distance from a hydraulic cylinders pivot point to the center of gravity is maximized, the load in the corresponding cylinder is also at a maximum. In some cases it is also visible that moment of inertia effects also play a

Sida 34 (46)
Utfärdare (namn, telefon) Dokumentnummer Utgåva Datum
Anders Anbo 0831-100831-TR-01 1 100831
0831-100526-01 Identification of extreme load cases for a surface drill rig by means of MBS-simulations
Bla
nket
t ID
(IS
O):
BL-
0065
-6.0
part. For example the boom raising cylinder experiences the extreme loads during case 301 and 312 where the center of gravity is as far away from the pivot point, the joint between the support and the boom, as possible. The reason why 312 is heavier than 311 is due to the greater moment of inertia. It results in that the boom raising cylinder has to exert a higher force to rotate the boom system and the feed when the carrier starts to rotate over the bump. The maximal length deviation in the boom raising cylinder during tramming is in case 301 0.05 mm and 2 mm in case 302 while the force levels are relatively equivalent, -325 and -265 kN respectively. It shows the great impact cylinder position and length has on the resulting cylinder stiffness.
4.5 Further studies This chapter presents proposals for improvement of the model and the input signal applied to the model. There is also a discussion about evaluation of the accuracy in the obtained results with measurements. An experiment can be useful for two different reasons. First it can be used to obtain accurate input data, but it can also be used to evaluate the model.
4.5.1 Modeling The model can be expanded to include more of the degrees of freedom found on the rig. Especially the carrier could be more detailed and include functional tracks. Included in the MSC ADAMS series is the ADAMS tracked vehicle (ATV) software which is specialized in modeling tracked vehicles. The major advantage with functional tracks is that the model becomes independent of input data. The carrier motion is in this case rendered during simulation where, for instance, the rig could tram over a predefined surface shape. The use would have been great with an accurate and evaluated tracked rig model since it would be easy and cheap to evaluate all kinds of tramming situations. Such a model has however its drawbacks. The number of parameters increases drastically since the tracks and the carrier include many parts. The tracks are constructed by subcontractors, making the collection of data problematic. The environment in which the rig operates also has to be modeled in a satisfactorily way. Obstacles with correct stiffness and behavior would have been needed. Model complexity and simulation time increases drastically. The simulation time within this project is in the order of seconds. This regards a fairly simple model but MBS simulations are in general less time consuming than FEM simulations. A way to improve the model is to introduce deformable parts. This would imply that the parts would behave more realistically. The drawback is that the model gets more complex, simulation time increases and more parameters are needed. It is therefore desirable to be selective when replacing rigid parts with flexible ones. A method to be able to do this is to investigate the eigenmodes of the parts modeled. Thereby it is possible to find the parts which would give the biggest gain if modeled as flexible bodies. High eigenfrequencies means a stiff body which is suitable to approximate as a rigid body. If a body has a low eigenfrequency on the other hand, it could be required to model it as a flexible body to achieve accurate dynamic behavior. The model built in the earlier master thesis included two flexible parts [3]. The difference in outcome was never fully studied, but what was studied did not show any significant evidence of benefit, except in one special case which is not applicable to the Mustang rig. The now existing model can be improved with better parameter data. In order to enhance the accuracy of the rig’s physical properties, e.g. mass and moment of inertia, is a slight

Sida 35 (46)
Utfärdare (namn, telefon) Dokumentnummer Utgåva Datum
Anders Anbo 0831-100831-TR-01 1 100831
0831-100526-01 Identification of extreme load cases for a surface drill rig by means of MBS-simulations
Bla
nket
t ID
(IS
O):
BL-
0065
-6.0
improvement in the working procedure required. A recommendation to mechanical engineers at Atlas Copco is to assign part material data in CAD-drawings. The parts which come from subcontractors are most often, in the CAD assemblies, roughly drawn and lack details. If correct total masses are assigned during assembly, future analysis which requires such data could be improved and simplified. No oscillations, apart from the ones from the input data, were visible in the results. It would therefore be desirable to investigate the accuracy of the damping in the hydraulic cylinders. A simple procedure to measure the damping in a hydraulic cylinder could be to first measure the length deviation from the unloaded cylinder during a static load to obtain the correct value of the spring coefficient. The second step would then be to execute a kinematical test on the hydraulic cylinder to obtain the behaviour during motion. Finally the cylinder model is, with solely the damping coefficient, tuned to match the behaviour of the real cylinder. The hydraulic cylinder stiffness model can at the same time be evaluated which also is desirable. The hydraulic cylinder pressure threshold could be more accurately measured. Although the measure performed during this thesis indicated that there is no well-defined threshold value, measures on all the hydraulic cylinders could give a more accurate estimate.
4.5.2 Input data Experiments can be used to collect input data to the ADAMS-model. The advantage of measuring, for example the carrier’s or the feed’s behaviour, is to be able to eliminate one step of estimations. The motion should be measured when the rig is operated vividly, preferably on the edge to what the structure is expected to withstand, to obtain the extreme motions. When tramming, the boom system forces arise due to the motion of the carrier and gravity, so in the pursuit of finding the extreme load levels, the carrier motion is a crucial parameter. The carrier’s acceleration, three translational and three rotational, are sufficient as input data for the model built within this project. The resulting acceleration spectrum could then be applied directly to the carrier in the model. In that case, the inaccuracy in approximating the carrier’s acceleration levels as a motion, described by mathematical functions, is eliminated. The measuring procedure could be performed with different techniques and hardware. Accelerometers are fairly cheap and relatively accurate but have disadvantages. To measure a body’s movement is at least two three-axis accelerometers, positioned at different places, required and the post-processing of data into useful form is not trivial. When, as in this case, rotational information also is wanted, a more straight forward way to obtain such data is to use a sensor which is based on gyro technology. It measures rotational data directly. There are combined sensors which incorporate both the techniques into one unit, so called inertial sensor, which would be ideal to measure the carrier motion. The drilling case could in the same way be improved. By applying a measured acceleration spectrum to the modelled feed, the feed sway estimation becomes unnecessary. It means more work to collect motion data in this case since measurement must be performed for each unique positioning. Another factor that could make this case more complicated in order to obtain drilling input data compared to tramming is due to the scenario modelling. Two parts are actually assigned a motion in the drilling case – the feed and the carrier. It might not be sufficient to measure the feed only since the carrier during drilling is not absolutely fixed as it is modelled in this project. The greatest accuracy would however be achieved when both part’s motion are based on measurement but the accuracy is still expected to be better by only using feed motion measurement compared to the results achieved with the method used in this project.

Sida 36 (46)
Utfärdare (namn, telefon) Dokumentnummer Utgåva Datum
Anders Anbo 0831-100831-TR-01 1 100831
0831-100526-01 Identification of extreme load cases for a surface drill rig by means of MBS-simulations
Bla
nket
t ID
(IS
O):
BL-
0065
-6.0
It can be assumed to be preferable to measure the accelerations near the attachment to the boom system when measuring the feed, to avoid contributing flexibility effects, i.e. the sway amplitude is higher in ends of the feed compared to near the boom system attachment. A rigid body model would misrepresent the force levels if the measuring point would be far from the attachment.
4.5.3 Positioning of the feed The positioning matrices include different hydraulic cylinder lengths, covering 90 degrees rotations with 2, 3 or 4 steps. This could be refined for a better resolution. It is especially relevant to refine the step size around the critical positioning presented in Table 2. The positioning which constrains the strength of a boom system part can in this way be optimized. By finding the optimized maximum force, a higher accuracy would be achieved. The table should be enhanced with joint force information as well to be completely universal.
4.5.4 Model evaluation Model evaluation is the second reason why experimental information improves the MBS analysis and it is a natural step in developing result accuracy. To be able to use the model for more detailed analysis it has to be validated. To optimize the model and determine if and what needs to be improved, the results from the ADAMS simulations should be compared to experimental data. No such data from the Mustang rigs is available, therefore measurements must be performed. An experiment arrangement to obtain data for model evaluation is more extensive compared to the measures discussed in chapter 4.5.2. The reason for this is that there are more quantities which must be taken into consideration. Below is a proposal of what is required of an experiment, where the dynamic behaviour is measured, and how it can be performed. The quantities which are essential to, somehow, monitor are presented below.
• Hydraulic cylinder forces • Boom system positioning • Carrier motion during tramming, carrier and feed motion during drilling (motion includes
three rotational and three translational degrees of freedom) • Starting orientation of the carrier
Hydraulic cylinder forces can be measured in different ways. There exist techniques to measure force directly in the boom system. The, so called, force cells can be installed in the hydraulic cylinders mounting attachments where they register pulling or pushing cylinder force. These requires some installation work and are probably best suited for a permanently installed monitor system. Pressure sensors could be used to monitor the chamber pressures. It would then be easy to obtain the resulting force in the hydraulic cylinders by use of equation (1). There are unfortunately a number of disadvantages with pressure sensors. The pressure is not measurable in the fully drained chamber i.e. the case when the cylinder length is maximized or minimized. The sensor is either installed within the chamber of the hydraulic cylinder or put to place on the exterior of the cylinder. The first alternative interferes with the cylinders stroke length. To avoid an extension of the outer physical cylinder length, the sensors have to be installed externally on the cylinder. The problem with the latter alternative is that the exterior pressure sensors tend to be a bit bulky. External hardware needs to be rugged to withstand the rig’s often very rough environment. The standard equipment is consequently expected to have a short life time if installed externally.

Sida 37 (46)
Utfärdare (namn, telefon) Dokumentnummer Utgåva Datum
Anders Anbo 0831-100831-TR-01 1 100831
0831-100526-01 Identification of extreme load cases for a surface drill rig by means of MBS-simulations
Bla
nket
t ID
(IS
O):
BL-
0065
-6.0
The force could also be obtained by measuring the cylinder length deviation. The deviation is then used with equation (13) to obtain the force. This method requires a very high accuracy of measurement, at least an accuracy of one hundredth of a mm, since the maximum deviation, as seen in the boom raising cylinder, in some cases is not more than 0.05 mm. It requires also that the stiffness model is accurate, since if the stiffness model is inaccurate, the force will come out wrong regardless of the length deviation accuracy. In parallel to the force levels, the boom system positioning is also important to monitor. To be able to, in the model, recreate the dynamical event the boom system positioning must be known. It would be convenient to simultaneously measure the hydraulic cylinder length deviation and the total length. This requires both the accuracy of measurement and a wide measurable range which can be problematic to achieve. If only the total length shall be measured it would be sufficient with a wire transducer. Angle sensors could be a more accurate alternative which, instead of determining the positioning by measuring the cylinder lengths, measures the angle between the boom systems parts interconnected with rotational joints. The carrier motion is essential to measure if the model evaluation regards a tramming scenario. It forms the basis of the model input information together with the boom system positioning. The carrier should be measured as discussed in chapter 4.5.2. If the evaluation regards a drilling scenario, the feed motion is most important to measure but measuring the carrier motion as well might increase the accuracy. The starting orientation of the carrier is however important to determine in both cases, to be able to recreate a scenario completely.

Sida 38 (46)
Utfärdare (namn, telefon) Dokumentnummer Utgåva Datum
Anders Anbo 0831-100831-TR-01 1 100831
0831-100526-01 Identification of extreme load cases for a surface drill rig by means of MBS-simulations
Bla
nket
t ID
(IS
O):
BL-
0065
-6.0
5 Conclusions
• The load levels are highly dependent on the positioning of the feed both while drilling and tramming.
• In the most unfavorable feed positioning the tramming results reveal in some cases a sevenfold increase in load levels compared to the recommended tramming positioning. The load levels are in general substantially increased when other than the default positioning are used.
• If the feed is allowed to sway, as seen in filmed material from Italy, the load levels are increased significantly. Results with somewhat limited accuracy show an increase of load levels with as much as 300 %.
• All extreme loads do not occur within the same positioning. It means that, in most cases, consideration must be taken to more than one load case during design and optimization of a boom system part.
• In order to avoid that the rig’s lifespan is shortened, reduced incidence of “tramming with an unfavorable positioning” and “feed sway during drilling” is required. An alternative is to optimize the structure. A load case basis is formed in Table 2. It is designed for use in the process of improvement of the boom system.
• MBS analysis proves to have great potential and is a fast, cheap and accurate method of determining loads.
5.1 Future studies and improvements • The resulting load levels are accurately computed based on well-established physical
laws, given the motion of the carrier. The weakness in the approach is however the applied motion. The biggest improvement would therefore be to perform a measurement for model input use.
• To be able to evaluate the model, a measurement must be performed. It is required for more detailed analysis.
• The model can be expanded with a functional crawler which would make the model independent of input data.
• When model evaluation proves the need of model improvement, suggestions of possible improvements can be found in the discussion.

Sida 39 (46)
Utfärdare (namn, telefon) Dokumentnummer Utgåva Datum
Anders Anbo 0831-100831-TR-01 1 100831
0831-100526-01 Identification of extreme load cases for a surface drill rig by means of MBS-simulations
Bla
nket
t ID
(IS
O):
BL-
0065
-6.0
6 Recommendations
• The feed sway during drilling is prevented by establishing sufficient support. The only positioning which should be used while tramming is the default positioning (which is the most merciful positioning in terms of load levels). If it continues to prove insufficient to, in manuals and orally, recommend customers to operate the rig in a certain way, a boom system optimization is recommended.
• Table 2 should be used in future strength optimization. The critical positioning results presented are recommended to be used in order to optimize the boom system parts. It provides information of strength constraining load cases. Depending on what part in the boom system is being restructured and optimized, a certain feed positioning will be constraining in terms of strength.
• To increase the accuracy of the load magnitudes obtained during the analysis, a measurement needs to be performed. The measurements replace the input data used in this project. This would yield accurate force magnitudes and together with the critical positioning data from Table 2 form the complete load material for a future strength analysis.
• Continue the development of the ADAMS-model and incorporate MBS-analysis methods in the product development procedure.

Sida 40 (46)
Utfärdare (namn, telefon) Dokumentnummer Utgåva Datum
Anders Anbo 0831-100831-TR-01 1 100831
0831-100526-01 Identification of extreme load cases for a surface drill rig by means of MBS-simulations
Bla
nket
t ID
(IS
O):
BL-
0065
-6.0
7 References [1] Atlas Copco’s official homepage – www.atlascopco.com [2] A. Sandström. Utvärdering av lastmätning av bomsystem på ”terrängrigg” ROC D. Atlas Copco UTAT, Report nr: TD2003-0125, 2003-03-24. [3] P. Holmström and J. Theander. Surface drill rig simulation. Luleå University of
Technology, 2009-02-10. [4] M. Norling. ADAMS Simulation. Atlas Copco SDE, Report nr: TD2007-0377, 2007-08-
27. [5] MSC-software homepage – www.mscsoftware.com [6] C. Nordling and J. Österman. Physics Handbook for Science and Engineering, eighth
edition, Studentlitteratur, ISBN 91-44-04453-4, 2006. [7] R. Budynas and W. Young. Roark’s formulas for stress and strain, seventh edition,
McGraw-Hill, 2002. [8] E. Lagerkvist. FE-analysis of boom failure in Mustang 9 drilling rig. XDIN AB, Report
nr: 12626.05.01-TR-01, 2009-12-10. [9] Drill rigs – Safety. Swedish Standards Institute, SS-EN 791+A1:2009.
8 Contacts [10] Patrik Kenger, Manager Mechanical Design, Surface Drilling Equipment
E-mail: [email protected] [11] Stefan Elmqvist, Design Manager Mustang Rigs, Craelius
E-mail: [email protected] [12] Mats Idoff, Senior Designer Hydraulics, Craelius
E-mail: [email protected] [13] Morgan Norling, Senior MBS Analyst, Rocktec Division
E-mail: [email protected] [14] Lars Mickelsson, Product Manager – Integrated Systems, Craelius E-mail: [email protected]

Sida 41 (46)
Utfärdare (namn, telefon) Dokumentnummer Utgåva Datum
Anders Anbo 0831-100831-TR-01 1 100831
0831-100526-01 Identification of extreme load cases for a surface drill rig by means of MBS-simulations
Bla
nket
t ID
(IS
O):
BL-
0065
-6.0
Appendix A1 – Maximal forces during all simulation cases Table 3 – Maximal forces obtained during all drilling cases. All values are given in kN. Hydraulic Cylinder Boom raising Tilt Upper swivel Lower swivel Feed extension Case 00 -118 -337 -94 -64 0 Case 01 -151 -244 59 -56 0 Case 02 -228 40 -80 -36 0 Case 10 -208 -126 91 64 -21 Case 11 -235 -73 134 54 -15 Case 12 -292 93 219 -35 0 Case 20 -306 225 87 -46 -30 Case 21 -312 201 165 38 -21 Case 22 -315 164 276 34 0 Static case (case 20) 117 -82 -13 0 25 Table 4 – Maximal forces obtained during all tramming cases. All values are given in kN. Hydraulic Cylinder Boom raising Tilt Upper swivel Lower swivel Feed extension Case 001 -90 -219 63 -12 -19 Case 101 -178 -73 70 -25 -29 Case 201 -262 148 72 14 -32 Case 301 -325 297 66 -48 -28 Case 011 -200 87 135 -38 6 Case 111 -230 93 206 -40 6 Case 211 -241 105 227 -38 6 Case 311 -229 120 197 -35 5 Case 002 148 -297 45 4 23 Case 102 179 -226 58 5 12 Case 202 144 -197 70 5 -17 Case 302 -266 -193 79 -20 -28 Case 012 -162 -105 -165 -35 7 Case 112 -234 -46 -90 -43 7 Case 212 -303 57 121 -48 7 Case 312 -350 123 198 -52 7 Default case -52 -298 56 -6 6

Sida 42 (46)
Utfärdare (namn, telefon) Dokumentnummer Utgåva Datum
Anders Anbo 0831-100831-TR-01 1 100831
0831-100526-01 Identification of extreme load cases for a surface drill rig by means of MBS-simulations
Bla
nket
t ID
(IS
O):
BL-
0065
-6.0
Appendix A2 – Detailed rigid body data Table 5 – Data of rigid bodies included in the model. The centre of gravity is shown with respect to the global reference system and when the rig is positioned almost as in the default positioning (drilling case 00). The only difference is that the feed extension cylinder is positioned 760 mm shorter. Moment of inertia is shown with respect to a coordinate system positioned in the corresponding centre of gravity with the same orientation as the global reference system. The feed and the rod holder are in the model simulations merged.
Part
Centre of gravity [mm] Mass [kg]
Moment of inertia [kg mm^2]
x Y Z
Ixx Ixy Iyy Ixz Iyz Izz
Boom -14,14 658,53 1050,44 337 87499469 -52659 90218082 -1801487 -7770851 8200824 Bed Carrier -25,01 1300,31 1274,83 355 136341556 175 136672987 114 1985919 8316039 Support -25,02 379,35 73,63 116 5446436 -613 2338446 307 -420410 4546328 Turntable -46,13 1094,15 1757,27 206 7728111 280417 11014125 507272 -320739 8480383 Upper rod joint 305,57 671,91 1548,85 19 132573 886 133607 10129 -5009 76797 Lower rod joint 573,93 554 55,72 19 132462 0 134045 10471 0 76470 Feed 11,81 1594,39 735,78 1900 5,03E+09 (+ winch) 14376389 5,05E+09 25545638 -44963664 96023238
Automatically generated in ADAMS based on a box with depth = 680 mm,
length =650 mm and Height = 252,04 mm
Rod holder -25 1938,57 3374 480
Automatically generated in ADAMS based on a cylinder with diameter = 450
mm and length = 1000 mm
Rotation unit -25 2045,57 Max 2957 560RH 130 Min -1500

Sida 43 (46)
Utfärdare (namn, telefon) Dokumentnummer Utgåva Datum
Anders Anbo 0831-100831-TR-01 1 100831
0831-100526-01 Identification of extreme load cases for a surface drill rig by means of MBS-simulations
Bla
nket
t ID
(IS
O):
BL-
0065
-6.0
Appendix A3 – Hydraulic cylinder data
Figure 24 – Parameters used from the hydraulic cylinders. Table 6 – Data of the rigid parts of the hydraulic cylinders included in the model. Definitions of the data can be seen in Figure 24.
Hydraulic cylinder
Mass [kg]
Cylinder Rod Length H [mm]
Outer radius a [mm]
Inner radius b [mm]
Length L [mm]
Radius c [mm]
Boom raising 122 760 92 80 833 40 Tilt 130 888 92 80 838 40 Upper swivel 135 883 92 80 906 40 Lower swivel 96 937 80 70 896 35 Feed extension 31 1174 46 40 1178 20
Table 7 – Additional hydraulic cylinder information needed in the stiffness model to calculate chamber lengths. See Figure 24 for definitions. Hydraulic cylinder C [mm] Piston length d
[mm] Chamber length K [mm]
Boom raising 168 88 499 Tilt 168 88 629 Upper swivel 168 88 697 Lower swivel 146 85 696 Feed extension 91 53 1054

Sida 44 (46)
Utfärdare (namn, telefon) Dokumentnummer Utgåva Datum
Anders Anbo 0831-100831-TR-01 1 100831
0831-100526-01 Identification of extreme load cases for a surface drill rig by means of MBS-simulations
Bla
nket
t ID
(IS
O):
BL-
0065
-6.0
Table 8 – Hydraulic material and fluid data. Hydraulic cylinder material data Hydraulic oil Young’s modulus E [N/m^2]
Poisson’s ratio υ [-]
Compressibility κ [m^2/N]
Bulk modulus β [N/m^2]
2,1E+11 0,29 5,87E-10 1,70E+9

Sida 45 (46)
Utfärdare (namn, telefon) Dokumentnummer Utgåva Datum
Anders Anbo 0831-100831-TR-01 1 100831
0831-100526-01 Identification of extreme load cases for a surface drill rig by means of MBS-simulations
Bla
nket
t ID
(IS
O):
BL-
0065
-6.0
Appendix A4 – Pressure threshold measurement The threshold was estimated by taking the mean value of the measured set of values. A pressure drop of threshold magnitude was only obtained in the cap end chambers in the boom raising cylinder and feed extension cylinder. The threshold values used were 75 bar and 35 bar respectively.
Figure 25 – Pressure measure of both chambers in Boom raising cylinder. The length of the cylinder was altered a couple of times during 2 minutes. The rod end threshold was estimated to 75 bar.

Sida 46 (46)
Utfärdare (namn, telefon) Dokumentnummer Utgåva Datum
Anders Anbo 0831-100831-TR-01 1 100831
0831-100526-01 Identification of extreme load cases for a surface drill rig by means of MBS-simulations
Bla
nket
t ID
(IS
O):
BL-
0065
-6.0
Figure 26 – Pressure measure of both chambers in lower swivel cylinder. The length of the cylinder was altered a couple of times during 2 minutes.