identification of genetic polymorphisms that promote ... · identification of genetic polymorphisms...
TRANSCRIPT
Identification of genetic polymorphisms that promote
autoimmunity on New Zealand black (NZB) chromosome 1 and
their mechanisms of action
by
Nafiseh Talaei
A thesis submitted in conformity with the requirements
for the degree of Doctor of Philosophy
Department of Immunology
University of Toronto
© Copyright by Nafiseh Talaei 2016
ii
Identification of genetic polymorphisms that promote
autoimmunity on New Zealand black (NZB) chromosome 1 and
their mechanisms of action
Nafiseh Talaei
Doctor of philosophy
Department of Immunology
University of Toronto
2016
ABSTRACT
Systemic Lupus Erythematosus (SLE) is a multisystem autoimmune disease
characterized by the production of autoantibodies and the development of an immune
complex-mediated glomerulonephritis (GN). The New Zealand Black (NZB) mouse is
considered to be an excellent model of SLE. Identification of susceptibility loci and the
mechanisms through which they act to produce autoimmunity has been greatly aided by
the study of congenic mouse strains, in which homozygous intervals containing these loci
have been introduced onto a non-autoimmune B6 genetic background. Genetic loci on
NZB chromosome (c) 1 lead to antinuclear antibody (ANA) production and
glomerulonephritis (GN). Previously our laboratory showed that mice with a
homozygous NZB 70 to 100 cM c1 interval introgressed onto the B6 background develop
fatal GN. Using a series of congenic mice with shorter NZB c1 intervals, the laboratory
iii
has demonstrated that there are at least three lupus susceptibility loci located within this
region that are sufficient to lead to high titer anti-nuclear auto-antibody production and
severe life-threatening GN. In this thesis I have sought to further characterize the cellular
abnormalities and identify the genetic polymorphisms that produce the phenotype in
c1(70-100)mice. In the second chapter, I have characterized the immune functional
defects associated with the severity of disease in a series of sub-congenic mice with
shorter intervals derived from this mouse strain. I showed that the severity of renal
disease parallels expansion of Th1, Th17, and Tfh pro-inflammatory cell subsets. I also
demonstrate that expansion of these cell subsets results from altered T cell and dendritic
cell functional abnormalities, which is a consequence of interactions between at least 3
independent genetic loci. Next, I sought to identify the genetic polymorphism that leads
to altered dendritic cell function in NZB chromosome 1 congenic mice. In chapter 3, I
provide evidence suggesting that a polymorphism in EAT-2 leads to reduced levels of
expression of this molecule in NZB c1 congenic mice, resulting in increased levels of
cytokine secretion by myeloid DC that support expansion of pathogenic T cell subsets.

iv
Acknowledgments
I have several persons I want to thank for their time, patients, guidance, support
and encouragement during my PhD program at the University of Toronto. First, I would
like to express my sincere appreciation to my supervisor, Dr. Joan Wither, for giving me
an opportunity to carry out my graduate studies in her laboratory and for providing me
with invaluable source of support, guidance and independence to pursue my research.
I would like to thank members of my supervisory committee, Dr. Eleanor Fish
and Dr. Phillipe Poussier, for their feedbacks, suggestions, supports and encouragements.
I would like to thank all past and present members of Dr Wither’s lab: Dr. Nan Chang,
Dr. Carolina Landolt, Dr. Christina Loh, Dr. Evelyn Pau, Babak Noamani, Timothy Li,
Yuriy Baglaenko, Kimberley Lifeso, Gillian Minty, and Kieran Manion for their
generous help, support and suggestions, and most of all, friendship. In particular, I want
to gratefully acknowledge the help of Dr Nan Chang, who offered much helpful advice
and technical assistance. Also, I would like to extend a special thanks to my dear friend,
Ramtin, who have always stood by me during this long journey.
Finally, I’d like to thank all my family members. Words cannot even describe
how blessed and fortunate I am to have such a supportive and caring family. I want to
extend my greatest gratitude to my husband, Reza, and my beautiful daughter, Annisa,
for their tremendous support and love in all aspect and tolerance throughout my PhD
program. I want to thank my mom for instilling in me such a strong work ethic. Finally,
in loving memory of my dear father, Mehdi Talaei, thank you for giving me life and
being a great inspiration to me I am proud to be your daughter I miss you so much.

v
TABLE OF CONTENTS
ABSTRACT……………………………………………………...……….….ii
TABLE OF CONTENTS………………………………………...…………..v
LIST OF TABLES…………………………………………………….…….xi
LIST OF FIGURES…………………..………………………..…………....xii
LIST OF ABBREVIATIONS……………………………………..……......xv
vi
CHAPTER 1: INTRODUCTION.…………...…………..……..………1-47
1.1- Systemic lupus erythematosus …………………………………………………….....1
1.1.1- Genetic factors in SLE…………………………………………….……….1
1.2 Lupus prone mouse models……….…………………………………………….…….4
1.2.1- MRL/lpr mice ……………………………………………………………...4
1.2.1.1-Genetic associations/mechanisms associated with the development of
lupus in MLR/lpr mouse strain…………………………………………………....5
1.2.2- BXSB mice ………………………………………………………………...7
1.2.2.1-Genetic associations/mechanisms associated with the development of
lupus in BXSB mouse strain….………………………………………………….8
1.2.3- NZ mice ……………………………………………………………….......9
1.2.3.1-Genetic associations/mechanisms associated with the development of
lupus in NZ mouse strain………………………………………………………..11
1.2.4- Chromosome 1 congenic mouse strains …………………………………12
1.2.4.1-NZM-derived chromosome 1 congenic mouse strains………………….13
1.2.4.2-NZB-derived chromosome 1 congenic mouse strains …………………16
1.3- SLAM/CD2 family of receptors...……………………………………...…………...24
1.3.1-General characteristics…………………………………………………….24
vii
1.3.2- SLAM family polymorphisms and lupus..……………………………….28
1.3.3- SLAM- associated protein (SAP) family adaptors………....…………….30
1.3.4- EAT-2 …...……………………………………………....……………......31
1.4-Dendritic cells……………………………………………………………………......32
1.4.1- Myeloid and plasmocytoid dendritic cell subsets ……………………….33
1.4.1.2- Role of mDC in the pathogenesis of lupus ………………………….....33
1. 4.1.2- Role of pDC in the pathogenesis of lupus..……………………………35
1.5- Role of T cells in the pathogenesis of SLE...…...………………………….39
1.5.1- Role of Th1 cells in the pathogenesis of lupus …………………………..39
1. 5.2- Role of Tfh cells in the pathogenesis of lupus …………………………..41
1.5.3- Role of Th17 cells in the pathogenesis of lupus .………………………..42
1.6- Thesis objectives……....………………………………….………….……..………45
CHAPTER 2: T cell and Dendritic cell Abnormalities Synergize to Expand
Pro-inflammatory T cell Subsets Leading to Fatal Autoimmunity in
B6.NZBc1 Lupus-Prone Mice...…..........................................................48-89
2.1- Abstract……..…….………………….………………………….………………….49
2.2- Introduction.…….……………….……………………………………..…………...50
viii
2.3- Materials and Methods……..…………………………………………..………..….52
2.3.1- Ethics statement…………………………………………..…....………….52
2.3.2- Mice……………………..…………………………….……….…….……52
2.3.3- Flow cytometry……………………………………………….……..…….52
2.3.4- Detection of cytokine-secreting T cells……………………..……….…....53
2.3.5- Naïve CD4+ T cell isolation and differentiation……………….………....54
2.3.6- In-vivo differentiation of OVA-specific T cells………………….…..…...55
2.3.7- Immunofluorescence staining of tissue sections……………………..…...55
2.3.8-BMDC isolation and stimulation…………………………………………..56
2.3.9- In-vitro culture of BMDCs and OVA-specific T cells.…………………...56
2.3.10- In-vitro culture of splenocytes and OVA-specific T cells.….......….…...57
2.3.11- Statistical analysis…………….…………………..…………………......57
2.4- Results………………………………………………………………………………58
2.4.1- Expansion of pro-inflammatory CD4+ T cell subsets in NZB c1 congenic
Mice……….…………..…………………………………………………..……..58
2.4.2- Intrinsic skewing of the immune system towards increased generation
of Tfh, Th17 and Th1 cell subsets in c1 congenic mice...……………...….…….69
2.4.3- Altered T cell differentiation in c1 congenic mice results from defects
affecting T and non-T cell function…………………………….………………..71
ix
2.4.4- DC from c1(88-100) and c1(70-100) mice demonstrate altered function
that promotes differentiation of pro-inflammatory T cell subsets……………….76
2.5- Discussion……..………………………………………………..……….…………..85
CHAPTER 3: Identification of the SLAM Adapter Molecule EAT-2 as a
Lupus Susceptibility Gene that Acts through Impaired Negative Regulation
of Dendritic Cell Signaling……………………………………………91-121
3.1- Abstract……………………………………………………………………………...92
3.2-Introduction………………………………………………………………………….93
3.3- Materials and Methods……..………………………………………….………..….95
3.3.1- Ethics statement…………………………………………..……………….95
3.3.2- Mice……………………..………………………………………….……..95
3.3.3- Flow cytometry…………………………………………………….……...95
3.3.4- BMDC isolation and exapansion……..…………………………………...96
3.3.5- Measurement of EAT-2 mRNA expression in BMDC…………………..96
3.3.6- Promoter sequencing and Luciferase Assay………………………..…......97
3.3.7- Transfection of BMDC with EAT-2 siRNAs……………………….……….98
3.3.8- In-vitro culture of transfected BMDC and OVA-specific T cells..……….98
3.3.9-Western Blots....…………………………………………………………...99
x
3.3.10- BMDC CD40 stimulation……...………………………….…..….….......99
3.3.11- Phospho-flow..........…………………………………………………….100
3.3.12- Immunoprecipitation …..……...………………………….…..….…....100
3.3.13- Statistical analysis…………….…………………..……………………101
3.4- Results…………………………………………………………………………………….102
3.4.1- A genetic polymorphism in the promoter region of EAT-2 in NZB c1
congenic mice results in altered expression of EAT….………………………...102
3.4.2- Knockdown of EAT-2 in BMDC from B6 and c1(96-100) mice
recapitulates the c1(70-100) phenotype…………………………………………103
2.4.3- Reduced levels of EAT-2 in c1 congenic DC result in enhanced IL-12
production in response to CD40 signaling.……………………………………..110
3.5- Discussion…………………………………………………………….……117
CHAPTER 4: General Discussion and Future Directions....................123-133
References………………………………………………………........134-154
xi
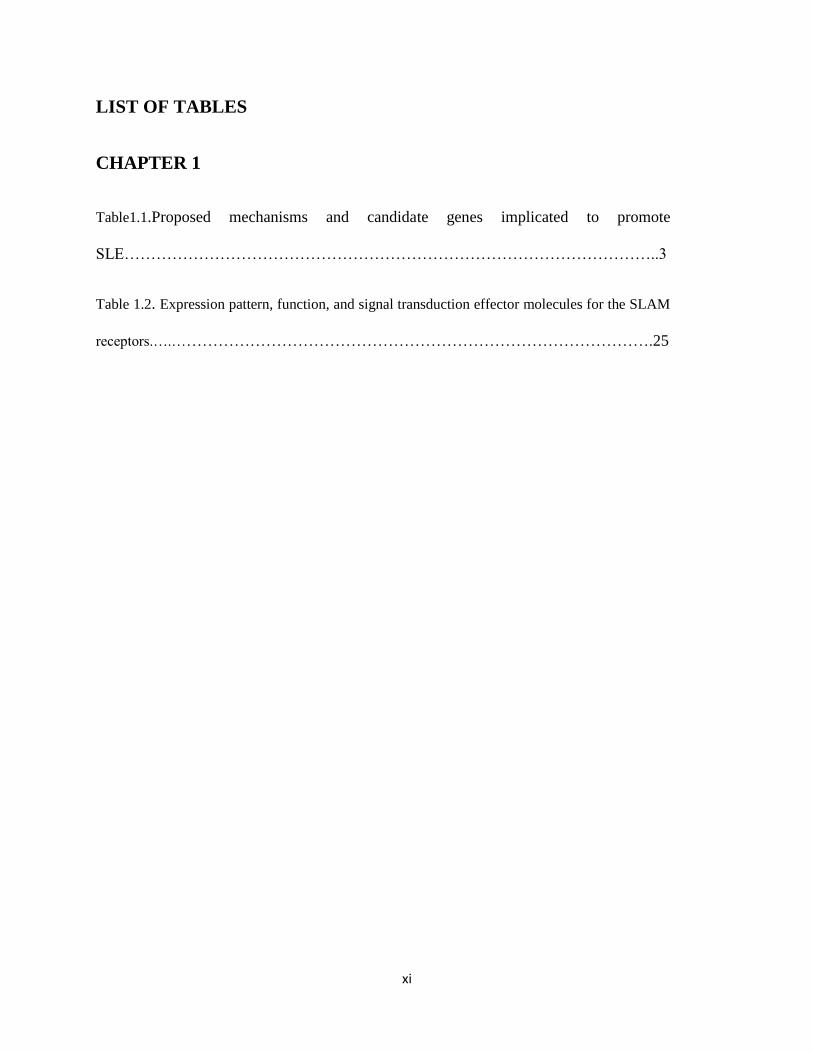
LIST OF TABLES
CHAPTER 1
Table1.1.Proposed mechanisms and candidate genes implicated to promote
SLE………………………………………………………………………………………..3
Table 1.2. Expression pattern, function, and signal transduction effector molecules for the SLAM
receptors.….……………………………………………………………………………….25
xii
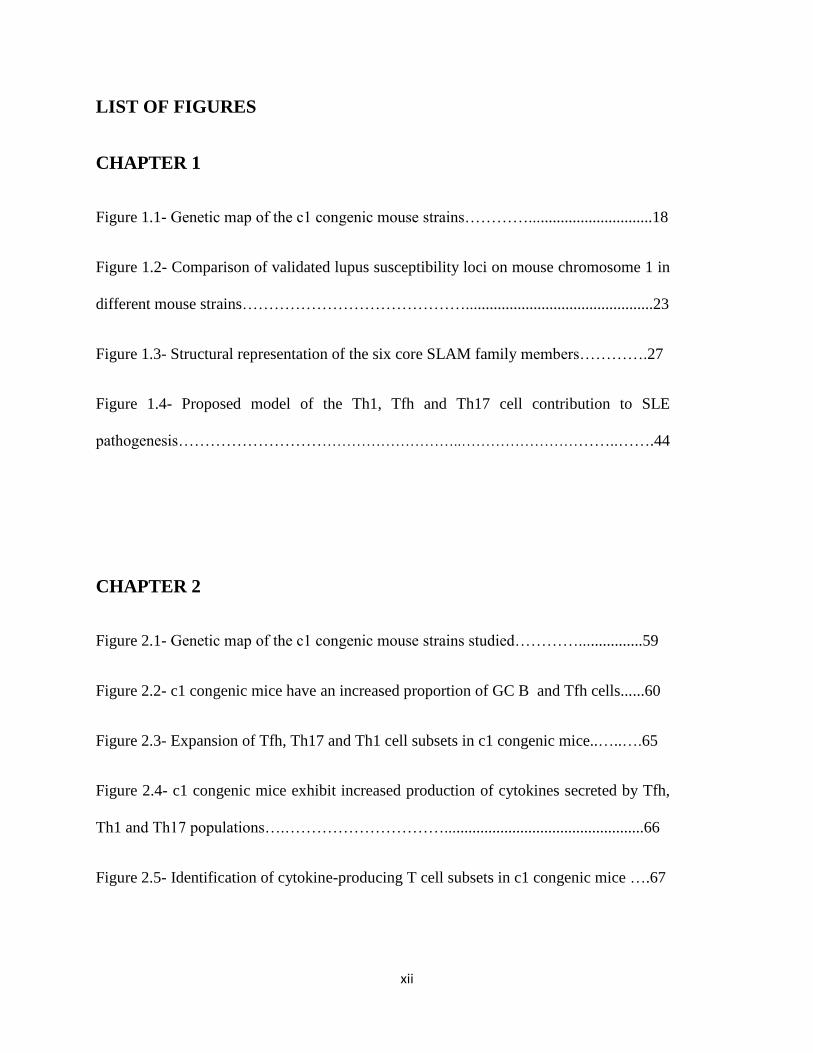
LIST OF FIGURES
CHAPTER 1
Figure 1.1- Genetic map of the c1 congenic mouse strains…………...............................18
Figure 1.2- Comparison of validated lupus susceptibility loci on mouse chromosome 1 in
different mouse strains……………………………………...............................................23
Figure 1.3- Structural representation of the six core SLAM family members………….27
Figure 1.4- Proposed model of the Th1, Tfh and Th17 cell contribution to SLE
pathogenesis………………………………………………..…………………………..…….44
CHAPTER 2
Figure 2.1- Genetic map of the c1 congenic mouse strains studied…………................59
Figure 2.2- c1 congenic mice have an increased proportion of GC B and Tfh cells......60
Figure 2.3- Expansion of Tfh, Th17 and Th1 cell subsets in c1 congenic mice..…..….65
Figure 2.4- c1 congenic mice exhibit increased production of cytokines secreted by Tfh,
Th1 and Th17 populations….…………………………..................................................66
Figure 2.5- Identification of cytokine-producing T cell subsets in c1 congenic mice ….67
xiii
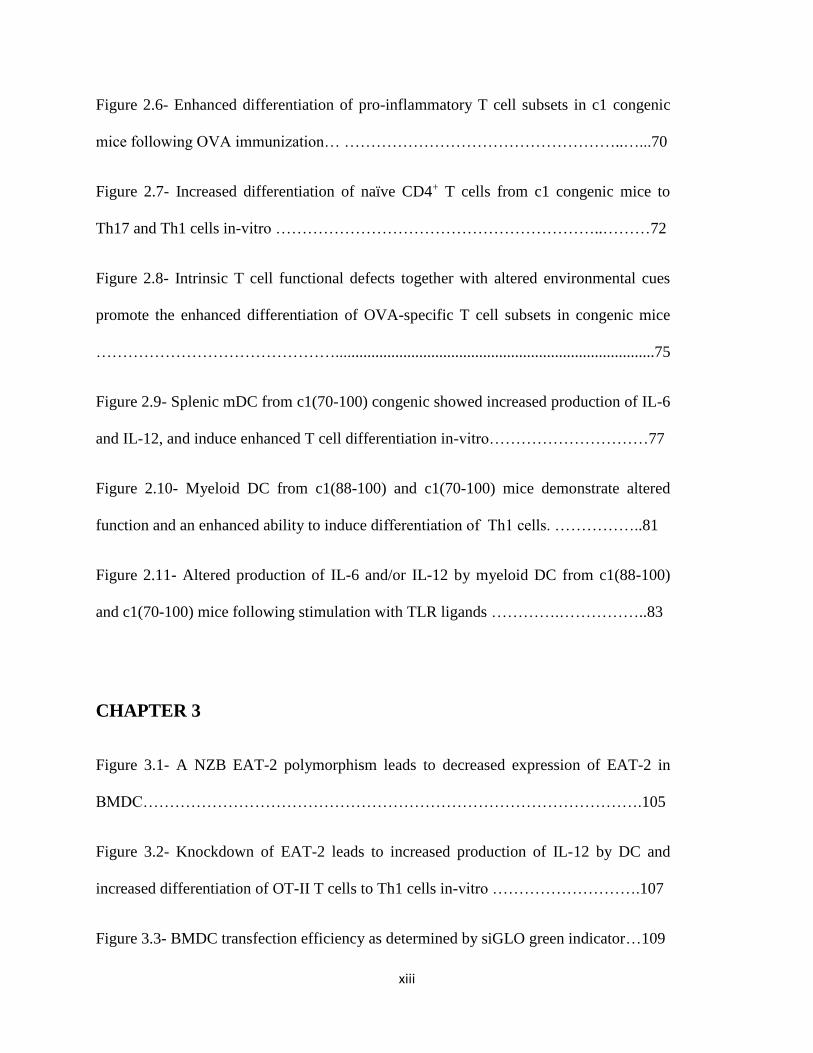
Figure 2.6- Enhanced differentiation of pro-inflammatory T cell subsets in c1 congenic
mice following OVA immunization… ……………………………………………..…...70
Figure 2.7- Increased differentiation of naïve CD4+ T cells from c1 congenic mice to
Th17 and Th1 cells in-vitro ……………………………………………………..………72
Figure 2.8- Intrinsic T cell functional defects together with altered environmental cues
promote the enhanced differentiation of OVA-specific T cell subsets in congenic mice
………………………………………................................................................................75
Figure 2.9- Splenic mDC from c1(70-100) congenic showed increased production of IL-6
and IL-12, and induce enhanced T cell differentiation in-vitro…………………………77
Figure 2.10- Myeloid DC from c1(88-100) and c1(70-100) mice demonstrate altered
function and an enhanced ability to induce differentiation of Th1 cells. ……………..81
Figure 2.11- Altered production of IL-6 and/or IL-12 by myeloid DC from c1(88-100)
and c1(70-100) mice following stimulation with TLR ligands ………….……………..83
CHAPTER 3
Figure 3.1- A NZB EAT-2 polymorphism leads to decreased expression of EAT-2 in
BMDC………………………………………………………………………………….105
Figure 3.2- Knockdown of EAT-2 leads to increased production of IL-12 by DC and
increased differentiation of OT-II T cells to Th1 cells in-vitro ……………………….107
Figure 3.3- BMDC transfection efficiency as determined by siGLO green indicator…109
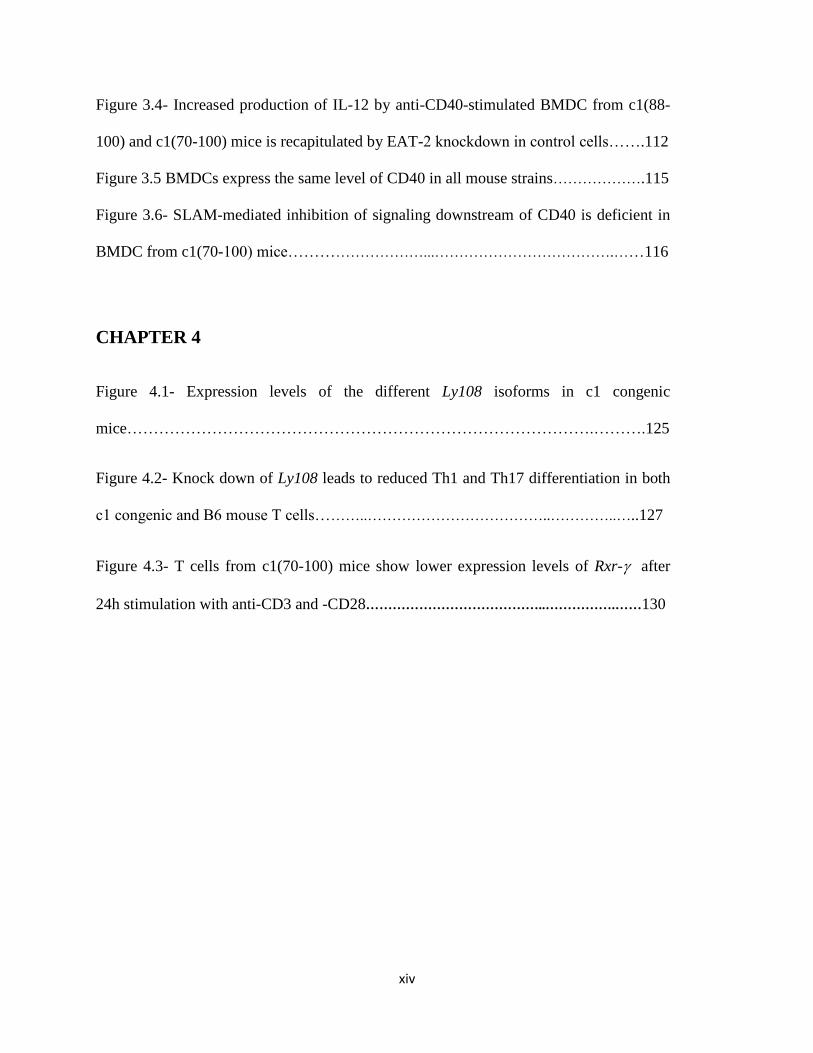
xiv
Figure 3.4- Increased production of IL-12 by anti-CD40-stimulated BMDC from c1(88-
100) and c1(70-100) mice is recapitulated by EAT-2 knockdown in control cells…….112
Figure 3.5 BMDCs express the same level of CD40 in all mouse strains……………….115
Figure 3.6- SLAM-mediated inhibition of signaling downstream of CD40 is deficient in
BMDC from c1(70-100) mice………………………...……………………………….……116
CHAPTER 4
Figure 4.1- Expression levels of the different Ly108 isoforms in c1 congenic
mice…………………………………………………………………………….……….125
Figure 4.2- Knock down of Ly108 leads to reduced Th1 and Th17 differentiation in both
c1 congenic and B6 mouse T cells………..………………………………..…………..…..127
Figure 4.3- T cells from c1(70-100) mice show lower expression levels of Rxr- after
24h stimulation with anti-CD3 and -CD28…………………………………..…………….……130
xv
LIST OF ABBREVIATIONS
Ab – Antibody
Ag – Antigen
ANA – Anti-nuclear antibody
APC – Antigen presenting cell
B – B lymphocyte
B6 – C57BL/6
BCR – B cell receptor
Breg – Regulatory B cell
BM – Bone marrow
BMDC – Bone marrow dendritic cells
c – Chromosome
CD – Cluster of differentiation
cM – Centimorgan
DC – Dendritic cell
dsDNA – Double stranded DNA
dTg – Double transgenic
GN – Glomerulonephritis
GM-CSF – Granulocyte-Macrophage Colony Stimulating Factor
HEL – Hen egg white lysozyme
IC – Immune complex
IFN – Interferon
Ig – Immunoglobulin
xvi
IL – Interleukin
LOD – Logarithm of the odds
LPS – Lipopolysaccharide
ITAMs – Immunoreceptor tyrosine activation motifs
Mb – Mega base
mAb – Monoclonal antibody
MHC – Major histocompatibility complex
mDC – Myeloid dendritic cell
NZB – New Zealand Black
NZM – New Zealand Mixed
NZW – New Zealand White
ODN – Oligodeoxynucleotide
pDC – Plasmacytoid dendritic cell
PI – Propidium iodide
RBC – Red blood cell
qRT-PCR – Quantitative real-time polymerase chain reaction
sHEL – Soluble hen egg white lysozyme
ssDNA – Single stranded DNA
SLE – Systemic lupus erythematosus
SNP – Single nucleotide polymorphism
T – T lymphocyte
Tfh – T follicular helper cells
Tg – Transgene/transgenic
xvii
Th1 – T helper 1 cells
Th2 – T helper 2 cells
TLR – Toll-like receptor
Treg – Regulatory T cell
TNF-– umour necrosis factor alpha
TNFSF4 – TNF superfamily gene 4
Yaa – Y-linked autoimmune accelerator
1
Chapter 1
Introduction
1.1 Systemic lupus erythematosus
Systemic lupus erythematosus (SLE) is a chronic multi-organ autoimmune disease that
is characterized by the production of antibodies directed against nuclear antigens (1, 2).
These autoantibodies (autoAb) bind to their cognate antigens, resulting in the formation of
immune complexes (IC) that deposit in various organs such as the skin, joints, brain, heart,
and kidney. This leads to activation of the complement system, resulting in inflammation and
tissue damage (3, 4).
1.1.1 Genetic factors in SLE
Genetic factors are believed to play a significant role in the pathogenesis of lupus. SLE
is a complex genetic disease in which multiple genetic polymorphisms, each of which
contributes a relatively small increased risk, act in concert to produce the disease phenotype.
Although genetic investigations such as genome wide association studies have been useful in
identifying genetic polymorphisms that confer an increased risk for SLE, the precise alleles
that are associated with SLE and the mechanisms by which they act to promote disease remain
to be identified. In this context, studies of genetically modified or spontaneously arising
lupus-prone mouse strains have been extremely helpful in providing a conceptual framework
for lupus pathogenesis. These studies indicate that the genetic modifications that promote
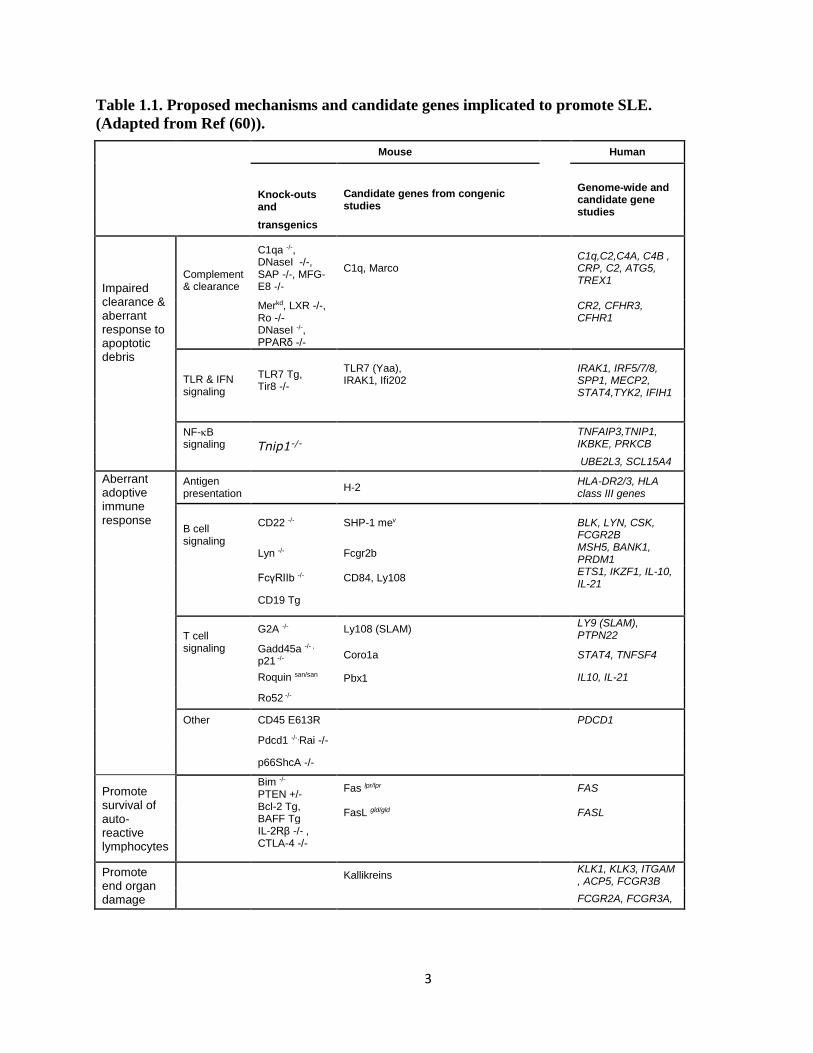
lupus can be classified into four groups (Table 1.1): 1) Those that promote impaired clearance
of, or an abnormal response to, apoptotic debris; 2) those that alter the strength or nature of
2
signals delivered to B and/or T cells, resulting in abnormal stimulation of autoreactive
lymphocytes; 3) those that lead to impaired apoptosis and/or increased survival of autoreactive
lymphocytes; and 4) those that promote end organ damage (5, 6). In addition, study of
spontaneously arising lupus-prone mouse strains has provided insight into how the individual
genetic loci interact with each other to produce clinical disease. These studies have been
greatly aided by primer-assisted breeding, the so-called ‘speed congenic’ technique that has
enabled the rapid generation of congenic mouse strains in which a chromosomal region linked
to the lupus phenotype is introgressed onto a well-defined, lupus-resistant (usually C57BL/6
(B6)) genetic background (7). By producing mice with combinations of susceptibility alleles,
the genetic interactions between susceptibility loci can be examined.
3
Table 1.1. Proposed mechanisms and candidate genes implicated to promote SLE.
(Adapted from Ref (60)).
Mouse Human
Knock-outs and
Candidate genes from congenic studies
Genome-wide and candidate gene studies
transgenics
Impaired clearance & aberrant response to apoptotic debris
Complement & clearance
C1qa -/-, DNaseI -/-, SAP -/-, MFG-E8 -/-
C1q, Marco C1q,C2,C4A, C4B , CRP, C2, ATG5, TREX1
Merkd, LXR -/-, Ro -/-
CR2, CFHR3, CFHR1
DNaseI -/-, PPARδ -/-
TLR & IFN signaling
TLR7 Tg, Tir8 -/-
TLR7 (Yaa), IRAK1, Ifi202
IRAK1, IRF5/7/8, SPP1, MECP2, STAT4,TYK2, IFIH1
NF-B signaling Tnip1-/-
TNFAIP3,TNIP1, IKBKE, PRKCB
UBE2L3, SCL15A4
Aberrant adoptive immune response
Antigen presentation
H-2 HLA-DR2/3, HLA class III genes
B cell signaling
CD22 -/- SHP-1 mev
BLK, LYN, CSK, FCGR2B
Lyn -/- Fcgr2b
MSH5, BANK1, PRDM1
FcγRIIb -/- CD84, Ly108
ETS1, IKZF1, IL-10, IL-21
CD19 Tg
T cell signaling
G2A -/- Ly108 (SLAM) LY9 (SLAM), PTPN22
Gadd45a -/- ,
p21 -/- Coro1a
STAT4, TNFSF4
Roquin san/san Pbx1
IL10, IL-21
Ro52 -/-
Other CD45 E613R PDCD1
Pdcd1 -/-,Rai -/-
p66ShcA -/-
Promote survival of auto-reactive lymphocytes
Bim -/- PTEN +/-
Fas lpr/lpr FAS
Bcl-2 Tg, BAFF Tg
FasL gld/gld
FASL
IL-2Rβ -/- , CTLA-4 -/-
Promote end organ damage
Kallikreins KLK1, KLK3, ITGAM , ACP5, FCGR3B
FCGR2A, FCGR3A,
4
1.2 Lupus-prone mouse models
Several murine models spontaneously develop lupus-like disease and have been
widely used to investigate the cellular and genetic basis of SLE induction. These include: the
MRL/lpr, and BXSB/Yaa, New Zealand (NZ) mouse strains (such as New Zealand Black
(NZB), New Zealand White (NZW), an F1 hybrid of NZB and NZW (NZB/W F1), and
recombinant inbred mouse strains with a mixture of genetic material from these 2 strains (eg.
NZM2410)) strains (8). Each of these models develops a unique iteration of lupus-like
disease, exhibiting a subset of symptoms resembling those in human SLE, including
autoantibody production, lymphocyte activation and lupus nephritis (9, 10).
In the subsequent sections, I will focus on what has been learned from these
spontaneous mouse models of SLE, as studies of these mice have led to the identification of a
number of potential genetic polymorphisms, signaling pathways and mechanisms of
interaction by which lupus susceptibility loci produce the lupus phenotype.
1.2.1 MRL/lpr mice
The MRL strain was generated from inter breeding of several mouse strains, with the
majority of the MRL genome deriving from the LG/J strain and minor contributions from
C3H/Di, C57BL/6, and AKR/J strains (8). Characterization of MRL sub-strains revealed that
one strain, named MRL/lpr, carries a single gene mutation that accelerates lupus-like disease.
MRL/lpr mice are homozygous for the lymphoproliferation (lpr) mutation in the Fas receptor
(FasR), which is located on chromosome 19. This mutation results in acceleration of the mild
lupus-like autoimmunity seen in mice with the MRL background, leading to production of
5
high titers of various autoantibodies such as anti-ssDNA, anti-dsDNA, and anti-Sm
antibodies, as well as rheumatoid factors. These autoantibodies result in the development of
severe lupus nephritis and death from fulminant renal failure in approximately 50% of the
mice by 5 months of age (9, 11, 12). In addition, these mice develop a marked accumulation
of double negative (CD4- CD8-) B220+ T cells that results in the development of massive
splenomegaly and lymphadenopathy (9, 13). Both males and females are significantly affected
in the MRL/lpr strain.
1.2.1.1 Genetic associations/mechanisms associated with the development of
lupus in MRL/lpr mouse strain
The FasR, which belongs to the tumor necrosis factor receptor (TNF-R) family,
induces apoptosis upon binding its ligand FasL (14). In MRL/lpr mice, the genetic
polymorphism encoding lpr leads to a truncated non-functional transcript of the Fas gene (15)
and both the B and T cells from MRL/lpr mice have a defect in Fas-mediated apoptosis (16).
Fas-mediated apoptosis plays an important role in the removal of germinal center B cells that
have lost specificity for the immunizing antigen, such as those that have acquired
autoreactivity, and studies show that B cell tolerance mechanisms are defective in MRL/lpr
mice (17, 18). Activated T cells are also subjected to Fas-mediated apoptosis once they are no
longer needed. In MRL/lpr mice, the marked expansion of CD4-CD8- T cells has been shown
to be due to accumulation of ‘exhausted’ CD8+ T cells that have lost expression of CD8 (19-
21) .
A mutation in the Fas ligand gene gld (generalized lymphoproliferative disease) has
also been shown to lead to an autoimmune disorder similar to the lpr mutation, with abnormal
6
survival and activation of autoreactive B cells and T cells (22), pointing out the importance of
the Fas pathway in the prevention of lupus-like autoimmunity. Studies of the interaction
between genetic background and the lpr mutation have demonstrated that although the lpr
mutation promotes ANA production in non-lupus-prone mouse strains such as C3H/HeJ and
C57BL/6J, it is not sufficient to cause nephritis in these strains (23). Therefore, MRL
background genes also play an important role in promoting the development of disease in this
mouse model.
Lupus susceptibility loci in MRL/lpr mice have been identified using F2 or N2 genetic
crosses of MRL/lpr mice with various mouse strains, and genetic loci have been found on
chromosomes 1, 4, 5, 7 and 10, that promote disease (9). Currently, there is limited data on the
candidate genes within these loci. B6 congenic mice, with a portion of MRL chromosome 1,
have altered FcγRIIB and FcγRIII expression, which has been shown to promote development
of GN in the presence of the lpr gene defect (24). A study of (MRL-Faslpr × C57BL/6-Faslpr)
F2 mice revealed four susceptibility loci, Lmb1–Lmb4, that were linked to production of anti-
dsDNA autoantibodies and glomerulonephritis (25). Studies of the Lmb3 lupus susceptibility
locus on MRL-lpr chromosome 7, have shown that this locus leads to significantly enhanced
T cell proliferation, as well as, anti-dsDNA autoantibody production and GN (9, 26). This
enhanced proliferation was recently shown to be due to the presence of a functional coronin-
1A gene in MRL mice. In B6 mice there is a single nonsense mutation in the coronin-1A
gene, which ameliorates the autoimmune disease when crossed onto MRL/lpr background
(27). Coronin-1A binds F-actin and prevents its assembly and depolymerization. The mutation
in coronin-1A in B6 mice leads to increased T cell apoptosis and reduced T cell activation and
7
proliferation, suggesting that amelioration of disease by this mutation is mediated through
impaired activation and/or increase apoptosis of autoreactive T cells.
In human lupus, defects in the Fas signaling pathway are rarely seen. However,
individuals with defects in this pathway (mostly due to dominant negative mutations in FasR)
have been described and have a similar syndrome, termed the autoimmune
lymphoproliferative syndrome, to that observed in MRL/lpr mice. Although these individuals
have lymphoid expansion due to accumulation of CD4-CD8- T cells and develop
autoimmunity, the severity of these phenotypes is highly variable even within the same
pedigree, highlighting the requirement for interactions with other background genes for
expression of the disease phenotype (28).
1.2.2 BXSB mice
The BXSB mouse strain is a recombinant inbred cross between the C57BL/6 and
SB/Le mouse strains (9, 29). In contrast to other lupus-prone mouse strains, the disease is
more severe in male than female BXSB mice. Lupus-like disease in these mice is
characterized by: anti-nuclear, -erythrocyte, -cardiolipin, and -platelet antibody production,
enlarged secondary lymphoid organs, and severe immune complex-mediated GN.
Acceleration of disease in male mice has been shown to be due to the presence of the Y-linked
autoimmune accelerator (Yaa) locus, which results in an increased rate of mortality in male
versus female mice due to proliferative GN. Approximately 50% of males die by 5 months of
age, whereas this takes ~14 months in female mice (30).
8
1.2.2.1 Genetic associations/mechanisms associated with the development of
lupus in the BXSB mouse strain
It has been demonstrated that the Yaa locus is not sufficient to induce the development
of disease in non-autoimmune-prone mouse strains, such as the CBA/J or C57BL/6 strains
(31, 32), but that it can significantly augment disease onset in other spontaneous lupus-prone
mouse strains including the New Zealand Black (NZB), New Zealand White (NZW) and
MRL/ lpr strains (31, 33). Thus, it has been suggested that the Yaa locus acts together with
other lupus susceptibility genes to potentiate the disease.
It is now known that a translocation of the telomeric end of the X chromosome to the
Y chromosome is responsible for the Yaa locus. This results in the duplication of at least 16
genes, which consequently leads to a two-fold increase in the expression of many of these
genes (34, 35). Among these genes is Toll-like Receptor 7 (Tlr7), which has been shown to be
involved in augmenting lymphocyte signalling and accelerating lupus pathogenesis (35, 36).
There also appears to be a minor influence from other genes located within the Yaa interval,
as knock out of Tlr7 does not reduce all Yaa-induced phenotypes. For example, in Yaa+ mice,
there is still elevated autoantibody production in Tlr7 knockout mice compared to Tlr7
sufficient mice (37, 38).
As mentioned above, B6 mice with the Yaa locus do not develop lupus, suggesting the
requirement for additional lupus susceptibility genes from the BXSB background for
expression of disease. Several mapping studies have been performed leading to the
identification of multiple lupus susceptibility loci in BXSB mice on chromosomes 1, 3, and 13
(39, 40). At least four susceptibility loci, termed Bxs1-4, are located on chromosome 1, and
studies using congenic mouse models have confirmed that these loci are linked to nephritis
9
and anti-dsDNA autoantibody production (41). Of these, Bxs3 overlaps with the Sle1 locus
found on chromosome 1 in the NZM2410 lupus-prone mouse strain and seems to have the
strongest effect on disease development. Although Bxs5, which is located on chromosome 3,
modulates disease, it appears to act as a suppressor locus (42), whereas Bxs6, located on
chromosome 13, has been linked to increased production of antibodies to serum glycoprotein
subunit 70 (gp70), and gp70 immune complex (gp70IC), which are thought to promote renal
disease (43). The presence of the Yaa locus significantly increases Bxs6-mediated disease
activity, resulting in increased nephritis due to upregulated production of anti-gp70
autoantibody and elevated levels of gp70 IC deposition in glomeruli (30). Bsx6 overlaps with
two genetic loci discovered in other lupus-prone mouse strains, NZW-derived Sgp3 (44) and
129-derived Gv1 (45), which have also been shown to play a role in the regulation of serum
gp70 levels.
A single candidate gene named Marco (macrophage receptor with collagenous
structure) has been identified on chromosome 1 in BXSB mice. Marco is an innate scavenger
receptor that plays a role in the clearance of apoptotic debris. In BXSB mice, lower RNA and
protein levels lead to defective clearance of apoptotic cells by macrophages, which based
upon studies of mice with induced mutations, is thought to promote the development of lupus-
like autoimmunity (46).
1.2.3 NZ mice
The NZ mouse strains include the NZ Black (NZB), NZ White (NZW), (NZB x
NZW)F1 cross (NZB/W), and recombinant NZ Mixed (NZM) inbred lines derived by crossing
NZB and NZW mouse strains, of which NZM2410 and NZM2328 are the best characterized
10
(8, 47). These strains are thought to closely mimic the human disease, with a similar female
sex bias (~6:1 ratio) for disease development. Consequently, numerous studies have used
these mouse strains to investigate the pathogenesis of lupus (5). The NZB strain
spontaneously develops a lupus-like autoimmune disease characterized by production of anti-
ssDNA and -red blood cell antibodies leading to hemolytic anemia at 6 to 8 months and mild
GN at 12 months of age, with the mice typically dying around 16 months of age (reviewed in
(8)). This mouse strain appears to possess all of the genes necessary to develop lupus nephritis
except a permissive MHC haplotype, as MHC congenic NZB.H2b and NZB.H2bm12 mouse
strains spontaneously develop severe kidney disease (48).
Although the NZW mouse does not develop autoimmunity, it was found that F1
crosses between NZB and NZW mice developed more severe kidney disease when compared
to the parental strains. This is likely due to the elevated levels of IgG serum antinuclear
autoantibodies (ANA), in particular anti-dsDNA Abs, which has been shown to deposit in the
kidneys of these mice around 5-6 months of age, resulting in the development of proteinuria
and fatal GN. Approximately 50% of the mice die from kidney disease by 8.5 months of age
(49).
Backcrossing of the NZB/W F1 and NZW strains, followed by brother-sister mating,
has been used to generate 27 fully inbred mouse strains with both NZB and NZW genetic
material, labeled NZM (50). Among the NZM mouse strains, the NZM2410 and NZM2328
mouse strains have been extensively examined and characterized. As in NZB/W mice, both
NZM2410 and NZM2328 mouse strains demonstrate high titer anti-dsDNA production and
severe GN resulting in 50% mortality at 5 to 6 months of age; however, NZM2410 has a
weaker gender bias as both male and female mice develop the disease (50-52).
11
1.2.3.1 Genetic associations/mechanisms associated with the development of
lupus in NZ mouse strains
Several groups, including our laboratory, have conducted extensive mapping studies of
various NZ mouse strains to identify the susceptibility loci and genetic polymorphisms
responsible for disease development. Wakeland’s group was the first to conduct a mapping
study of the NZM2410 mice, leading to the identification of three major lupus susceptibility
loci (Sle1, Sle2, and Sle3) that were linked to anti-dsDNA autoAb production and the
development of severe GN in this mouse strain (51). To determine how each susceptibility
locus in the NZM2410 mouse contributed to autoimmunity, a series of congenic mice was
generated by this group, in which these loci were introgressed onto the B6 background (53-
59). Sle1, located on chromosome 1, appeared to play a critical role in the loss of tolerance to
nuclear Ags, impacting on both T and B cell function and resulting in the production of
antinuclear autoantibodies (59). Sle2, located on chromosome 4, led to B cell hyperactivity,
polyclonal activation, and expansion of both splenic and peritoneal CD5+ B1a cells as well as
elevated serum levels of IgM, but did not induce any autoimmune pathology (53, 60).
Similarly, Sle3, located on chromosome 7, was not by itself associated with autoimmune
disease, although these mice demonstrated expansion and proliferation of CD4+ T cells with
reduced activation-induced T cell death (61). Although each of these three loci on their own
did not lead to the development of a severe autoimmune phenotype, subsequent studies
examining mice with two or three of these congenic intervals showed that epistatic
interactions resulted in increasingly severe disease, with tri-congenic mice demonstrating a
phenotype similar to the parental strain.
12
A surprising finding of these NZM mapping studies was that the majority of genetic
loci that promote disease in these mice are derived from the NZW parent. Since NZW mice
do not have an autoimmune phenotype, this raised the question of what prevents the
development of autoimmune disease in this mouse strain. Subsequent mapping studies showed
the presence of several NZW-derived suppressor loci, the strongest of which, Sles1, was
closely linked to the major histocompatibility complex (MHC) class II locus H-2z (62). Study
of the Sles1 locus showed that it interacts with the Sle1 locus, ameliorating the abnormal B
and T cell activation, autoantibody production and development of renal disease (63).
Early mapping studies done in NZB/W mice indicated that multiple genes from the NZB
parent contributed to the severity of disease in this mouse strain. These genes mapped to
chromosomes 1, 4, 7, 10, 13, and 19, and appeared to act in concert to induce severe renal
disease (49, 64-66). Subsequent studies, by our group as well as others, have confirmed the
presence of susceptibility loci that promote the generation of autoantibodies and/or nephritis
on NZB chromosomes 1, 4, 7, and 13 (5, 67, 68), and congenic mice with intervals
corresponding to these loci have been produced. However, only mice with intervals derived
from NZB chromosome (c) 1 or 13 spontaneously develop lupus-like autoimmunity.
1.2.4 Chromosome 1 congenic mouse strains
Although autoimmune disease in each lupus-prone mouse strain arises spontaneously
from the interactions between several different genetic loci, some of which facilitate and some
of which inhibit disease, there is significant overlap of these loci between the different lupus-
prone strains, particularly for loci contained on chromosomes 1, 4, 7 and 13 (reviewed in (6, 67-
13
69). Generation of congenic mouse strains, in which a chromosomal region linked to the lupus-
phenotype is introgressed onto a non-autoimmune background, has played an important role in
the identification of these genetic loci and the mechanisms by which they act to promote disease
(70). Of the 35 murine susceptibility loci that have been identified on these chromosomes in 6
different lupus-prone mouse strains, 6 have been mapped to chromosome 1, indicating the
importance of this chromosomal region in the generation of the lupus phenotype (10). Multiple
susceptibility loci located at the telomeric end of chromosome 1 in lupus-prone mouse strains,
including NZB, NZM2410, NZM2328, 129, MRL/lpr and BXSB mice, have been repeatedly
mapped and linked to development of autoantibodies and/or nephritis (39, 51, 70, 71). The
telomeric region of c1 is synergic to human c1q23-42, a region confirmed to have several
associations with human lupus. To identify the susceptibility loci that contribute to the
development of disease in this region, several congenic mouse strains, including B6.Sle1 from
NZM2410 mice (interval of NZW origin) (72), B6.NZBc1 and B6.Nba2 from NZB mice (73,
74), B6.MRLc1 from MRL mice (71), and B6.Bxs1-4 from BXSB mice (41), have been
generated. Although the MRL and BXSB c1 congenic mouse strains demonstrated autoantibody
production and have intervals that overlap with those studied in NZ mice, little is known about
the candidate genes in these mice. Therefore in the subsequent sections I will focus on NZ-
derived c1 congenic mice as they are more relevant to my thesis.
1.2.4.1 NZM-derived chromosome 1 congenic mouse strains
The best characterized of the c1 congenic mouse strains is the B6.Sle1 strain, in which
susceptibility loci derived from the NZM2410 154-197 Mb interval of chromosome 1 have been
introgressed onto the B6 mouse background. Studies of mixed hematopoietic chimeric mice
with a mixture of B6 and B6.Sle1 bone marrow indicated that intrinsic B and T cell functional
14
defects contribute to the loss of tolerance to chromatin with production of IgG anti-chromatin
autoAbs and priming of autoreactive T cells to the histone epitopes on chromatin (57, 75).
Through generation of subcongenic mice, in which each mouse carries different portions of the
Sle1 locus, it was later shown that four non-overlapping loci within Sle1, termed Sle1a, Sle1b,
Sle1c and Sle1d, independently contribute to the development of the autoimmune phenotype in
these mice (76-82).
Sle1a (localized to the 168.3-173 Mb region of the Sle1 locus) was shown to have the
strongest association with lupus nephritis in the NZM2410 mouse model. This interval is
associated with spontaneous priming of T cells to nucleosomes and reduced proportions of
CD4+Foxp3+ regulatory T cells (82). Two independent loci, Sle1a1 and Sle1a2, comprise the
Sle1a locus and both intervals are required for complete expression of the autoimmune T cell
phenotype (82). Recent studies have shown that the Sle1a1 phenotype likely results from the
expression of a novel splice isoform of the Pbx-1 gene, named Pbx-1d. Pbx-1 expression is
reported to increase in activated/memory CD4+ T cells (83). Through overexpression of Pbx-1d
in Jurkat T cells, it was shown that Pbx1-d induces the expression of genes related to T cell
activation and Th17 cell differentiation. Since Pbx1 is the only relevant gene in the Sle1a1
interval, it was suggested that the enhanced proportion of activated and autoreactive CD4+ T
cells and decreased Treg populations seen in Sle1a1 mice likely results from the expression of
Pbx1-d isoforms in activated/memory T cells. The genetic function of Sle1a2 is currently
unknown.
Sle1b is localized to a 1 Mb interval extending from 173-174 Mb within the Sle1 locus.
This region demonstrates the strongest association within the Sle1 locus with high titer anti-
nuclear antibody (ANA) production (84, 85). Extensive polymorphism of the SLAM/CD2 gene
15
family (including Cd244, Cd229, Cs1, Cd48, Cd150, Ly108 and Cd84) has been reported in the
Sle1b region (85). Several of these molecules were shown to be differentially expressed in T
and/or B cells, with Ly108 being the most studied of these. Differential expression of Ly108
splice isoforms by B6 and NZM2410 alleles has been shown to impact on B cell deletion and
anergy induction, as well as the T cell activation and differentiation to IFN- producing cells in
B6.Sle1b mice (84-86). Recently, polymorphisms in both CD84 and Ly108 in B6.Sle1b mice
were shown to lead to attenuated BCR signaling, resulting in reduced apoptosis, attenuated B
cell–T cell interactions, impaired GC tolerance mechanisms, and the generation of ANA-
producing cells (87).
Sle1c, another sub-locus of Sle1 that is located in the NZM 190-197 Mb interval, is also
associated with GN and anti-chromatin IgG production, but at lower penetrance than is
observed for the Sle1b locus (72). Further studies revealed that this locus contained two sub-
loci, Sle1c1 and Slelc2. Within the Sle1c1 interval, a single nucleotide polymorphism (SNP) has
been identified in the Cr2 gene, which encodes the complement receptor type 2. Studies have
shown that this receptor type acts as a B cell co-receptor, potentially contributing to the Sle1c1
phenotype by impacting on germinal center tolerance mechanisms (61, 78). Analysis of
B6.Sle1c2 CD4+ T cell function revealed the presence of an intrinsic T cell defect, resulting in
the accumulation of activated T cells and a decreased proportion of regulatory T cells in this
congenic mouse strain (61). These mice also exhibited a significant expansion of IFN-γ
expressing T cells (88).
The fourth locus, Sle1d, located between Sle1b and Sle1c2, increases the severity of GN
when B6.Sle1d mice are crossed with NZW mice (72); however, the candidate gene(s) within
this region has not been identified.
16
1.2.4.2 NZB-derived chromosome 1 congenic mouse strains
Congenic mouse models with NZB chromosome 1 intervals have been generated
independently by our laboratory and others. B6.Nba2 congenic mice, originally generated by
Kotzin’s group, carry a homozygous 155 to 194 Mb interval from NZB chromosome 1. This
interval leads to the development of a lupus-like disease with elevated serum levels of ANAs,
lymphadenopathy, splenomegaly, IgG immune complex deposition in the kidneys, and elevated
levels of IFN-α in serum. However, B6.Nba2 congenic mice do not develop severe GN (65, 89,
90). Several candidate genes were proposed in this interval including the FcγR family,
SLAM/CD2 family, and the IFN-inducible Ifi200 family of genes (encoding for the p200 family
proteins), all of which are polymorphic in NZB as compared to B6 mice.
A number of subcongenic mouse strains with smaller intervals derived from the initial
congenic interval containing the Nba2 lupus susceptibility locus were generated, denoted
B6.Nba2-A (154.7-174.5Mb), B6.Nba2- A′B (169.1- 175.9Mb), B6.Nba2-B (172.8-175.9Mb),
B6.Nba2-BC (172.8-194.1Mb), and B6.Nba2-C (174.5-194.1Mb) (91). B6.Nba2-A (154.7-
174.5Mb) female mice harboring the NZB FcγR gene locus and B6.Nba2-B (172.8-175.9Mb)
mice carrying the NZB Slam locus both developed detectable levels of ANAs. However,
significantly higher levels of ANAs were found in the B6.Nba2-A′B mice that had both the
NZB FcγR and the NZB Slam-family genetic loci, raising the possibility that these two loci
work in tandem to promote autoantibody production (91, 92). B6.Nba2-A′B mice also produced
increased levels of type I IFN. B6.Nba2-C subcongenic mice, with just the Ifi200 family of
genes, developed neither ANAs nor type I IFN elevations. Consistent with a negligible effect of
the polymorphisms in this gene family on the development of the autoimmune phenotype in
B6.Nba2 mice, antibody production was not increased in B6.Nba2-BC as compared to
17
B6.Nba2-C mice. Although the authors of this study suggest that their findings confirm the role
of the FcγR and SLAM loci in production of ANA and nephritis in B6.Nba2 congenic mice, an
important caveat to this work is that each of these intervals contains a number of additional
genes that could contribute to the autoimmune phenotype, and therefore the findings do not
prove that these genetic loci are indeed the relevant candidate genes in these intervals.
Our laboratory has also generated a number of NZB c1 congenic mouse strains. Based
upon the results of a mapping study that identified the 1 LOD (logarithm of the odds score)
confidence interval for a genetic locus (loci) linked to B cell activation and autoantibody
production on chromosome 1 in NZB mice, congenic mice were produced with a homozygous
NZB interval extending from 35 to 106 centimorgans (cM) (62-191 Mb) introgressed onto the
B6 background (66) . These mice, termed c1(35-106), produced high titers of IgG anti-ssDNA
and -chromatin autoantibodies and developed moderate non-lethal renal disease (66, 93). In
addition, increased spontaneous T and B cell activation and an increased number of germinal
centers were noted. Studies of mixed hematopoietic chimeric mice with a mixture of c1(35-106)
and tagged B6 bone marrow indicated the presence of intrinsic B and T cell functional defects
in these mice, resulting in increased spontaneous activation of T and B cells, with enhanced
recruitment of c1(35-106) B cells into germinal centers, as compared to their B6 counterparts
(93).
Subsequently, to further localize the susceptibility loci on NZB chromosome 1, a series
of subcongenic mouse strains with smaller c1 intervals was produced (shown in Figure 1.1).
18
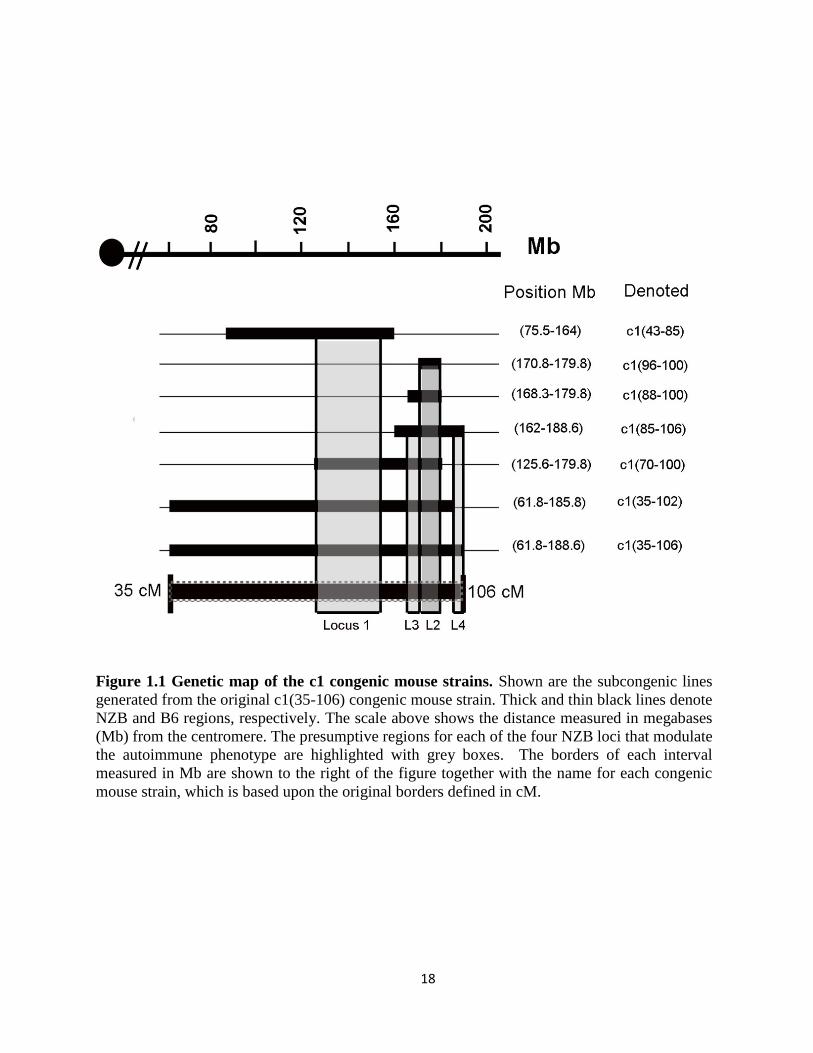
Figure 1.1 Genetic map of the c1 congenic mouse strains. Shown are the subcongenic lines
generated from the original c1(35-106) congenic mouse strain. Thick and thin black lines denote
NZB and B6 regions, respectively. The scale above shows the distance measured in megabases
(Mb) from the centromere. The presumptive regions for each of the four NZB loci that modulate
the autoimmune phenotype are highlighted with grey boxes. The borders of each interval
measured in Mb are shown to the right of the figure together with the name for each congenic
mouse strain, which is based upon the original borders defined in cM.
19
Congenic mice with NZB 100-106 cM intervals or 43-85 cM intervals did not produce
autoantibodies, whereas mice with a 70-100 interval produced high titers of anti-dsDNA Abs
and developed severe GN, leading to death of ~40% of the mice by 8 months of age (94). These
findings localized the gene(s) that lead to autoantibody production to the 85-100 interval.
Consistent with this inference, congenic mice with an NZB interval extending from 88 to 100
cM (168.3-179.8 Mb; c1(88 to 100)) produced anti-dsDNA antibodies and developed moderate
non-lethal GN, suggesting that a gene or genes within the 70-88 region augments the severity of
renal disease. Mice with the shortest NZB interval that was crossed onto the B6 background,
which extends from 96 to 100 cM (170.8-179.8 Mb; c1(96-100)), had mild subclinical
autoimmunity characterized by production of anti-ssDNA Abs in the absence of anti-dsDNA
Abs or kidney disease. These findings indicate that there is a genetic locus (loci) within the 96-
100 cM region that breaches tolerance to nuclear antigens, but that at least two additional loci
within the 70-96 interval are required for full expression of the autoimmune phenotype in
c1(70-100) mice.
Studies in the laboratory have further characterized the B and T cell functional
abnormalities in c1(96-100) mice. To investigate the nature of the B cell tolerance abnormalities
in these mice, soluble hen egg lysozyme (sHEL) and anti-HEL immunoglobulin (Ig) transgenes
were crossed onto the c1(96-100) background. B cells from double transgenic c1(96-100) mice
showed elevated expression of activation markers, increased recruitment into germinal centers,
and significantly enhanced production of IgG and IgM anti-HEL autoantibodies, as compared
to corresponding B6 B cells (N. Chang et al, manuscript in preparation). These findings suggest
that there is a generalized breach of B cell anergy in these mice.
20
It is likely that other mechanisms of B cell tolerance in these mice are also defective.
Studies of HEL double transgenic mice, performed in the laboratory, indicate that there is
attenuated BCR signaling with reduced Ca2+ mobilization in the immature B cells of c1(96-100)
as compared to B6 mice and that this is associated with reduced receptor editing and impaired
apoptosis of the self-reactive B cell compartment. In this respect, the B cell defect in c1(96-100)
mice is similar to that observed for B6.Sle1b mice, suggesting that it might arise from shared
polymorphisms in the SLAM family. This remains to be confirmed, as there are some sequence
differences in this locus between the NZB and NZM alleles.
Studies by our laboratory and others suggest that germinal center tolerance mechanisms
may also be defective in c1(96-100) mice. It is possible that this defect is related to the SLAM
polymorphisms in NZB mice, as previous work in the NZM mouse model suggests that these
polymorphisms impact on germinal center tolerance (84). Altered expression of the inhibitory
type II FcR (FcRIIB), due to a polymorphism in the promoter region of the Fcgr2b gene, has
also been proposed to contribute to the altered germinal center tolerance and increased
production of autoantibodies observed in NZB mice (95, 96). However, studies of FcRIIb
knockout mice suggest that absence of this receptor leads to enhanced development of plasma
cells and increased production of autoantibodies, but has little impact on other B cell tolerance
mechanisms (97). Notably, comparison of the immunologic phenotype observed in c1(96-100)
mice, which have an interval containing both the FcR and SLAM loci, with published results of
mice with the B6.Nba2 A’B and B intervals, suggests that these mice have the same phenotype
as B mice, and that our c1(88-100) mice have the same phenotype as the A’B mice. These
findings suggest that the enhanced autoantibody production observed in B6.Nba2A’B mice (and
c1(88-100) mice) is not due to the FcR locus, as previously proposed, but another locus in this
21
interval. Experiments outlined in this thesis provide insight into this locus and will be outlined
in detail later.
In addition to B cell defects, c1(96-100) mice also demonstrate altered T cell function.
T cells from young c1(96-100) mice have a decreased threshold for IFN- production and T cell
proliferation following stimulation with anti-CD3 when compared with B6 control T cells. It is
possible that this functional alteration arises from polymorphisms in the SLAM locus,
particularly in Ly108, as previous work has shown that the absence of the Ly108-H1 splice
variant in NZM mice leads to enhanced differentiation of IFN- producing T cells (86).
Comparison of subcongenic mouse strains with longer intervals that included the c1(96-
100) region showed an increased number of splenic germinal centers as compared to c1(96-100)
mice. The increases in the number of splenic germinal centers observed in c1(88-100) and
c1(70-100) mice were similar, and roughly paralleled increases in the extent of chronic T cell
activation, as indicated by elevated proportions of recently activated (CD69+) and
memory/effector (CD44hiCD62Llo) T cells in these mice (94). These findings imply that there is
at least one locus in the 88-96 interval that is involved in qualitative or quantitative aspects of T
cell help. This interval overlaps with the Sle1a susceptibility locus, previously identified in
NZM2410 mice (Figure 1.2). Although this interval in NZM mice is derived from the NZW
parent, B6.Sle1a mice have several T cell abnormalities, including increased T cell activation,
reduced numbers and function of Treg cells, and increased CD4+ T cell support for IgG anti-
chromatin production by B cells, suggesting that they may share susceptibility loci with NZB
mice in this region (72, 98). This possibility was addressed by investigations in this thesis.

22
It is likely that there is another susceptibility locus located in the 70-88 cM interval (125.6 -
168.3Mb) of NZB mice. Addition of this region to the 88-100 cM interval resulted in
increases in B cell activation, autoantibody titers, immunoglobulin deposition in the kidney,
renal disease, and mortality. Experiments examining the immune mechanisms leading to the
increased disease severity in these mice are outlined in this thesis.
23
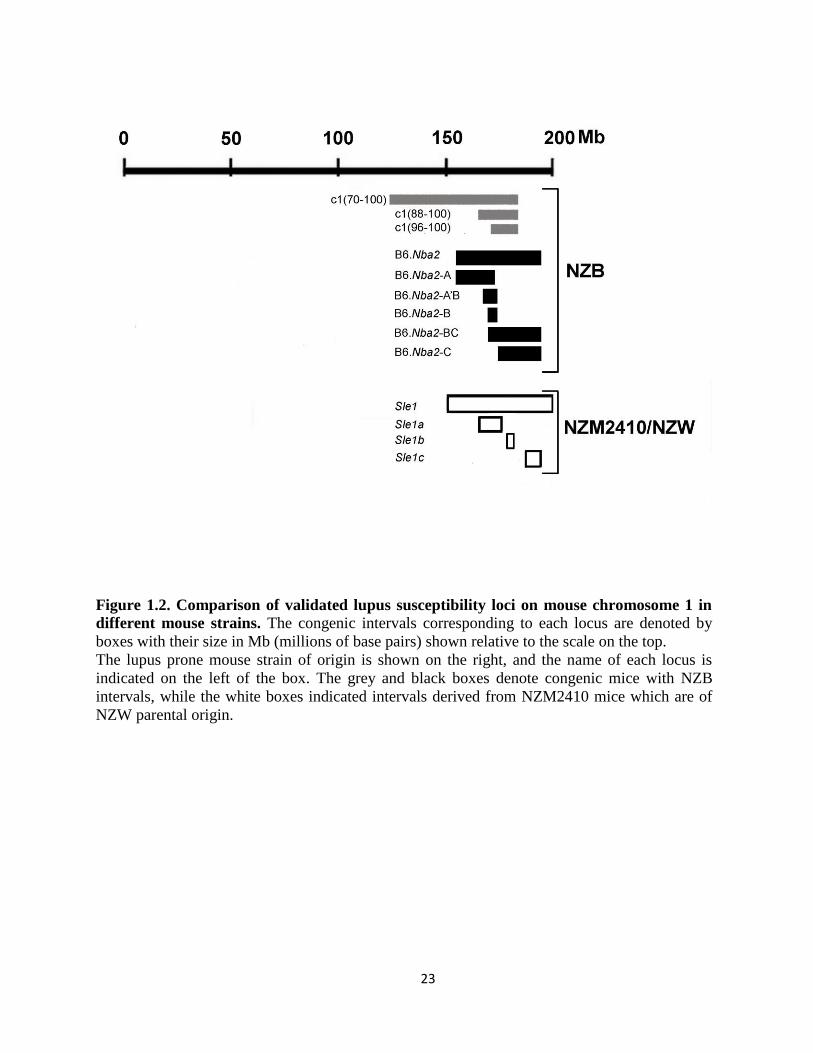
Figure 1.2. Comparison of validated lupus susceptibility loci on mouse chromosome 1 in
different mouse strains. The congenic intervals corresponding to each locus are denoted by
boxes with their size in Mb (millions of base pairs) shown relative to the scale on the top.
The lupus prone mouse strain of origin is shown on the right, and the name of each locus is
indicated on the left of the box. The grey and black boxes denote congenic mice with NZB
intervals, while the white boxes indicated intervals derived from NZM2410 mice which are of
NZW parental origin.
24
1.3 The SLAM/CD2 family of receptors
1.3.1 General characteristics
The signaling lymphocyte activation molecule (SLAM) family constitutes a group of
receptors that regulate the activation and differentiation of a wide variety of cell types
involved in innate and adaptive immune responses (99-102) . The SLAM family of receptors
belongs to the CD2 subset of the immunoglobulin superfamily and has nine distinct members:
SLAMF1 (CD150, SLAM), SLAMF2 (CD48), SLAMF3 (CD229, LY9), SLAMF4 (CD244,
2B4), SLAMF5 (CD84), SLAMF6 (CD352, NTB-A (NK-T-B-antigen) in humans or Ly108
in mice), SLAMF7 (CD319, Cs1 or CRACC (CD2-like receptor activating cytotoxic cells)),
SLAMF8 (CD353 or BLAME (B lymphocyte activator macrophage expressed)) and SLAMF9
(CD84-H1). The genes that encode seven of the SLAM family members, SLAMF1-SLAMF7
(the SLAM/CD2 cluster) are located within a 400-500 kilobase (kb) genomic segment on
human chromosome 1q23 or mouse chromosome 1H3 (99, 103) . The other two remaining
SLAM family members (SLAMF8 and SLAMF9) are located outside of the SLAM/CD2
cluster (roughly 1 Mb centromeric to the SLAM/CD2 cluster) (99, 104). The SLAM
molecules are ubiquitously expressed on variety of immune cells including different subsets of
T and B lymphocytes, NK and NKT cells, monocytes, macrophages, DCs, pDCs, platelets,
granulocytes, and hematopoietic stem and progenitor cells, but the precise family members
expressed and their downstream adapters vary with each cell type (Table 1.2) (99, 103, 105).
25
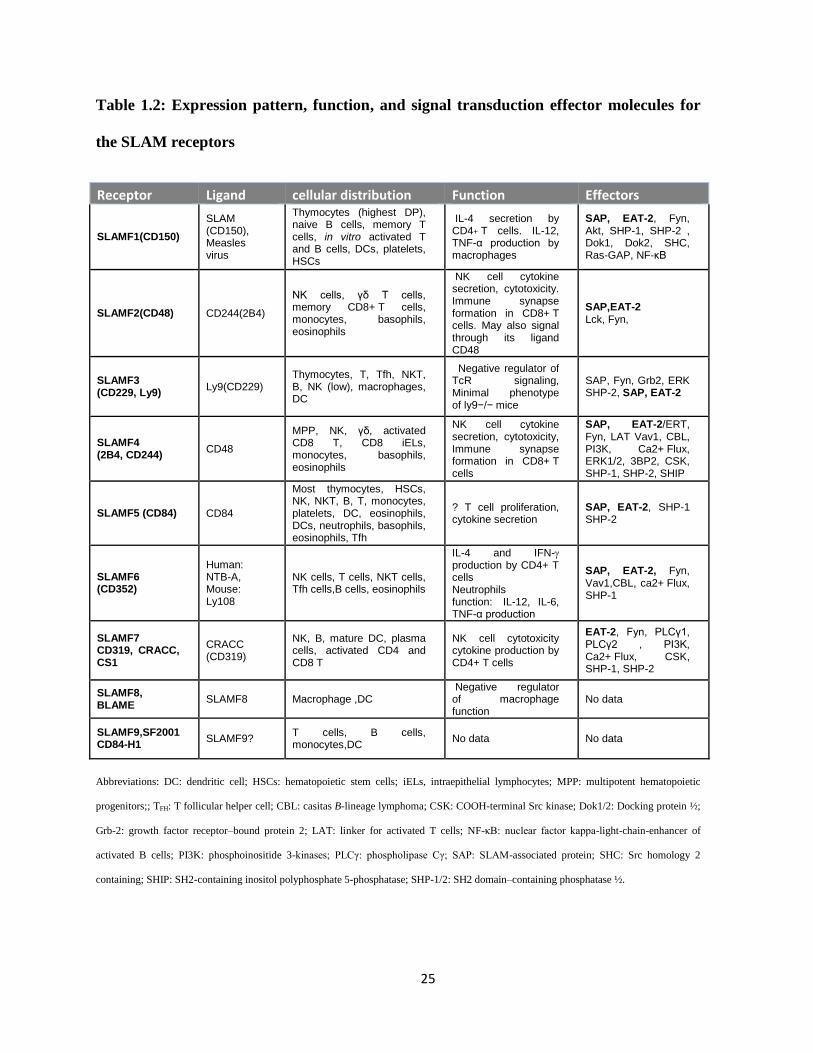
Table 1.2: Expression pattern, function, and signal transduction effector molecules for
the SLAM receptors
Receptor Ligand cellular distribution Function Effectors
SLAMF1(CD150)
SLAM (CD150), Measles virus
Thymocytes (highest DP), naive B cells, memory T cells, in vitro activated T and B cells, DCs, platelets, HSCs
IL-4 secretion by CD4+ T cells. IL-12, TNF-α production by macrophages
SAP, EAT-2, Fyn, Akt, SHP-1, SHP-2 , Dok1, Dok2, SHC, Ras-GAP, NF-κB
SLAMF2(CD48) CD244(2B4)
NK cells, γδ T cells, memory CD8+ T cells, monocytes, basophils, eosinophils
NK cell cytokine secretion, cytotoxicity. Immune synapse formation in CD8+ T cells. May also signal through its ligand CD48
SAP,EAT-2 Lck, Fyn,
SLAMF3 (CD229, Ly9)
Ly9(CD229) Thymocytes, T, Tfh, NKT, B, NK (low), macrophages, DC
Negative regulator of TcR signaling, Minimal phenotype of ly9−/− mice
SAP, Fyn, Grb2, ERK SHP-2, SAP, EAT-2
SLAMF4 (2B4, CD244)
CD48
MPP, NK, γδ, activated CD8 T, CD8 iELs, monocytes, basophils, eosinophils
NK cell cytokine secretion, cytotoxicity, Immune synapse formation in CD8+ T cells
SAP, EAT-2/ERT, Fyn, LAT Vav1, CBL, PI3K, Ca2+ Flux, ERK1/2, 3BP2, CSK, SHP-1, SHP-2, SHIP
SLAMF5 (CD84) CD84
Most thymocytes, HSCs, NK, NKT, B, T, monocytes, platelets, DC, eosinophils, DCs, neutrophils, basophils, eosinophils, Tfh
? T cell proliferation, cytokine secretion
SAP, EAT-2, SHP-1 SHP-2
SLAMF6 (CD352)
Human: NTB-A, Mouse: Ly108
NK cells, T cells, NKT cells, Tfh cells,B cells, eosinophils
IL-4 and IFN- production by CD4+ T cells Neutrophils function: IL-12, IL-6, TNF-α production
SAP, EAT-2, Fyn, Vav1,CBL, ca2+ Flux, SHP-1
SLAMF7 CD319, CRACC, CS1
CRACC (CD319)
NK, B, mature DC, plasma cells, activated CD4 and CD8 T
NK cell cytotoxicity cytokine production by CD4+ T cells
EAT-2, Fyn, PLCγ1, PLCγ2 , PI3K, Ca2+ Flux, CSK, SHP-1, SHP-2
SLAMF8, BLAME
SLAMF8 Macrophage ,DC Negative regulator of macrophage function
No data
SLAMF9,SF2001 CD84-H1
SLAMF9? T cells, B cells, monocytes,DC
No data No data
Abbreviations: DC: dendritic cell; HSCs: hematopoietic stem cells; iELs, intraepithelial lymphocytes; MPP: multipotent hematopoietic
progenitors;; TFH: T follicular helper cell; CBL: casitas B-lineage lymphoma; CSK: COOH-terminal Src kinase; Dok1/2: Docking protein ½;
Grb-2: growth factor receptor–bound protein 2; LAT: linker for activated T cells; NF-κB: nuclear factor kappa-light-chain-enhancer of
activated B cells; PI3K: phosphoinositide 3-kinases; PLCγ: phospholipase Cγ; SAP: SLAM-associated protein; SHC: Src homology 2
containing; SHIP: SH2-containing inositol polyphosphate 5-phosphatase; SHP-1/2: SH2 domain–containing phosphatase ½.
26
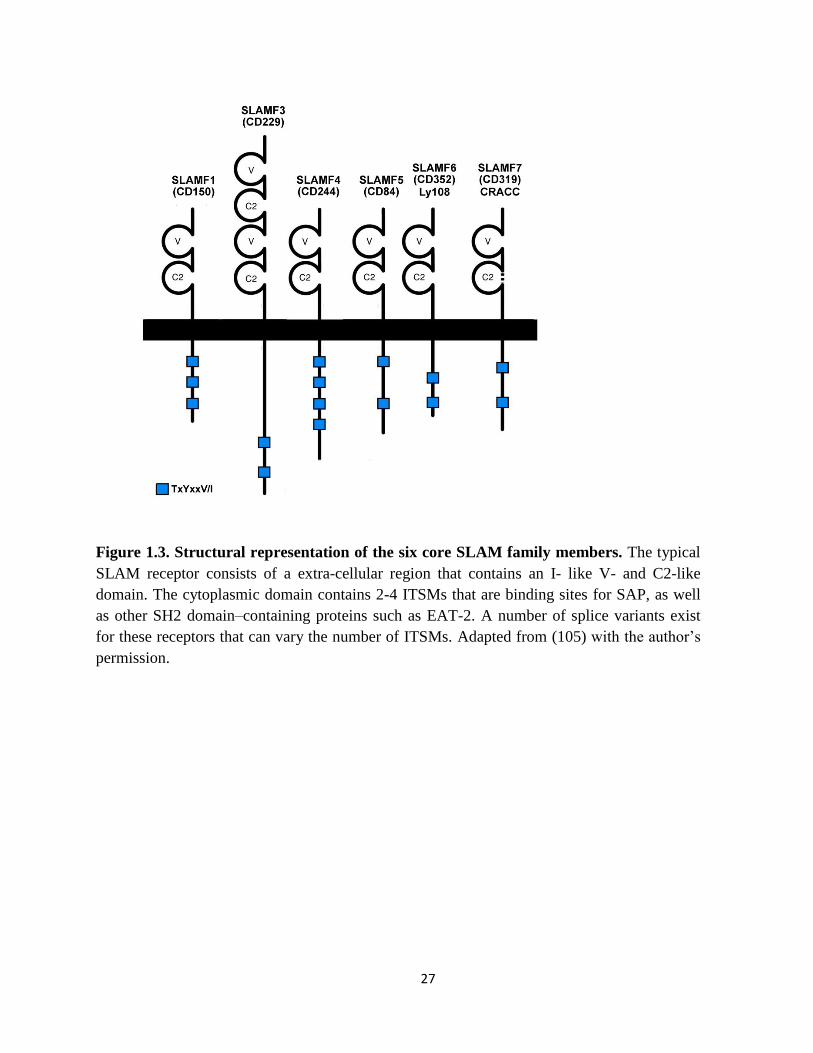
The SLAM family of receptors are type I glycoproteins. In addition to two
extracellular immunoglobulin (Ig)-like domains, each receptor has a cytoplasmic signaling
domain that bears multiple tyrosine-based activation motifs which, through linkage with
members of the SLAM-associated protein (SAP) family of signaling adaptors, convey either
activating or inhibitory signals (102). SLAMF1, 2B4, CD84, Ly108, CRACC and Ly9 all
share similar extracellular and cytoplasmic domains (Figure 1.3). These SLAM molecules all
have intracellular tyrosine based switch motifs (ITSMs; consensus sequence TxYxxV/I) in
their cytoplasmic tails, which are crucial for signaling and transmit either activating or
inhibitory signals via associations with intracellular SH2 domain-containing adaptor
molecules. With the exception of 2B4, all members of this core SLAM family interact in a
homophilic manner in a head-to-head conformation, and therefore act as self-ligands (106-
111). Phosphorylation of Y residues within the ITSM is triggered by these homophilic
interactions, which consequently act as a docking site for intracellular adaptor molecules and
enzymes bearing SH2 domains, such as SHP-2, SHP-1, Csk, and SHIP-1. However, the
adaptor molecules SLAM-associated protein (SAP), EWS/FLI activated transcript-2 (EAT-2)
and EAT-2-related transducer (ERT) have a particularly high affinity for this unique motif
(99, 112). Genes encoding EAT-2 and ERT, the latter a pseudogene in humans, are located in
the vicinity of the SLAM locus on chromosome 1, while the SAP gene has been mapped to
the human and murine X chromosome.
27
Figure 1.3. Structural representation of the six core SLAM family members. The typical
SLAM receptor consists of a extra-cellular region that contains an I- like V- and C2-like
domain. The cytoplasmic domain contains 2-4 ITSMs that are binding sites for SAP, as well
as other SH2 domain–containing proteins such as EAT-2. A number of splice variants exist
for these receptors that can vary the number of ITSMs. Adapted from (105) with the author’s
permission.
28
1.3.2 SLAM family polymorphisms and lupus
Extensive polymorphisms in many of the SLAM/CD2 genes have been identified and
linked to autoimmune diseases in humans and mice (113). Several lupus-susceptible mouse
strains have been reported to have polymorphisms in the SLAM family. As outlined
previously, the Sle1b locus contains the SLAM locus, and this very polymorphic cluster of
genes has been identified as potential candidate genes in this region (85). Subsequent
experiments have largely focused upon the role of Ly108/SLAMF6 in this phenotype, where
differences in the expression of several splice variants of this gene have been noted. Ly108
was initially found to have two isoforms resulting from alternate splicing (114). B6 mice
express predominantly the Ly108.2 isoform, whereas NZM2410 mice express higher levels of
the Ly108.1 isoform (85). NZB, NZW, BXSB, 129, and MRL mice were all shown to have
similar SLAM alleles to NZM2410 mice, suggesting that the SLAM locus acts as a lupus
susceptibility locus in multiple strains of mice.
Functional differences in the two Ly108 isoforms were found after transfection of a
mouse T cell line with the Ly108.1 isoform resulted in stronger SAP-dependent protein
tyrosine phosphorylation of Vav-1 and c-Cbl as compared to the Ly108.2 isoform (115). This
is in keeping with the observation that T cells derived from B6.Sle1b exhibit increased TCR-
induced Ca2+ flux (85) and more robust proliferation (86) when compared to B6 controls.
However, this differed in the B cell compartment, where transfection of the B cell WEHI-231
line with Ly108.1 isoform resulted in reduced Ca2+ influx upon IgM crosslinking, reduced cell
death, and lower RAG expression (84). Similar phenotypes were seen when the immature B
cell compartment was examined in the B6.Sle1b mouse strain, with immature B cells
demonstrating muted signal transduction downstream of the BCR, reduced Ca2+ flux,
29
impaired RAG re-expression, and reduced deletion, as compared to their B6 counterparts (84).
Recently, Terhorst’s group reported a third isoform of Ly108, named Ly108-H1, expressed in
the cells of the B6 mouse strain, but absent in B6.Sle1b mice. Introduction of a transgene
expressing the Ly108-H1 encoding allele onto the B6.Sle1b background prevented the
development of lupus in this mouse strain (86). Together, these observations demonstrate that
genetic variation in Ly108 may be an important factor in the induction of lupus in B6.Sle1b
mice through its effects on B and T cell function and tolerance.
The other polymorphic variants of the SLAM family receptors in the B6.Sle1b mouse
strain are located in the exon regions of 2B4, Ly9, CRACC, and CD84 (85). The consequence
of these polymorphisms and their contribution to the autoimmune phenotype in various lupus
mouse models has yet to be determined. It has been proposed that a change in the amino acid
sequence in the binding domains of these receptors may result in changes to their affinity for
their ligands and, as a consequence, may affect the activation of different downstream signal
transduction pathways mediated by these receptors in different immune cells (116).
As previously outlined, while NZB mice are thought to share many of the same
polymorphisms in the SLAM locus that are seen in NZM mice, some differences have been
reported. Consequently, it is not known to what extent the findings observed in B6.Sle1b mice
will be replicated in NZB congenic mice.
30
1.3.3 The SLAM-associated protein (SAP) family adaptors
The SAP family of adaptor molecules includes SAP (encoded by Sh2d1a), EAT-2
(encoded by Sh2d1b1) and ERT (encoded by Sh2d1b2). As outlined previously, following
SLAM engagement, the SAP family of adaptors binds to the phosphorylated ITSM (117)
through the SH2 domain. Seven of the SLAM receptors have been shown to associate with
either SAP and/or EAT-2/ERT (see Table 1.2) (117, 118). Which adaptor binds to the receptor
is dictated both by the SLAM molecule that is being engaged and by the cell type that it is
expressed in. SAP adaptors are only expressed in immune cells. SAP is found in T cells, NK
cells, NK-T cells, and B cells (germinal center and memory B cells) (119, 120), while EAT-2
is expressed in NK cells, DCs, and macrophages. ERT has only been found in mouse NK
cells.
It was initially reported that SAP promoted cell activation by blocking the association of
the SLAM receptors with inhibitory transduction molecules, such as SH2 domain-containing
protein tyrosine phosphatase-1 (SHP-1), SH2 domain-containing protein tyrosine phosphatase-2
(SHP-2), SH2 domain-containing inositol-5-phosphatase (SHIP-1) and the inhibitory kinase Csk
(121). Subsequent work identified a novel mechanism of SAP adaptor function, whereby SAP
binds directly to the phosphorylated ITSM domains of the SLAM receptors and then binds to
the SH3 domain of Fyn through its SH2 domain, resulting in recruitment of the tyrosine kinase
Fyn and initiation of signal transduction (122). SAP may also serve as docking site for the SH3
domain of protein kinase C-θ (PKC-θ), which has been shown to be important for SAP-
dependent IL-4 production by CD4+ T cells (123).
Mutations in the Sh2d1b1 gene have been shown to lead to X-linked
lymphoproliferative disease (XLP). This mutation results in three major disease features:
31
fulminant infectious mononucleosis, B cell lymphomas, and dys-gammaglobulinemia (103,
124). Studies from mouse knockout models have shown that while IL-4 production is
impaired in SAP−/− T cells, IFN-γ production is increased following stimulation with anti-CD3
and -CD28 mAbs. Consistent with these in vitro findings, SAP knockout mice are hyper-
responsive to lymphocytic choriomeningitis virus infection, with elevated levels of IFN-γ–
producing cells in the spleen and liver (125, 126)
1.3.4 EAT-2
EAT-2 is homologous with SAP, with ∼50% of amino acid sequence identity. It has
been shown to bind to the tyrosine phosphorylated ITSM motifs of CD150, Ly9, CD84 , 2B4 ,
and CRACC following receptor engagement (54,56) (104, 127). Unlike SAP, EAT-2 cannot
bind Fyn because it lacks the necessary arginine at position 78 in the carboxyl terminal (117,
128); instead, tyrosine residues located in the carboxyl terminal tail (1 in humans, 2 in mice)
convey inhibitory signals when phosphorylated (120, 129).
The role of EAT-2 has been most extensively studied in NK cells. Examination of the
function of NK cells in EAT-2 knockout mice demonstrated that EAT-2-/- NK cells secrete
increased amounts of IFN- in response to various stimuli, including SLAMF4 (2B4), CD16,
NK group 2, member D (NKG2D) and lymphocyte antigen 49D (Ly49D) activation. The
ability of NK-cells to kill certain targets is also augmented in EAT-2 deficient mice (127).
Similar findings were observed for ERT-/- NK cells, suggesting that ERT also acts as a
negative regulator of NK cell function. The mechanism of NK-cell inhibition by EAT-2 and
ERT remains to be fully clarified, but could involve binding of protein tyrosine phosphatases,
32
inhibitory kinases or ubiquitin ligases to the phosphorylated tails of EAT-2 and ERT.
However, not all studies have shown an inhibitory role for EAT-2. In a study examining the
role of EAT-2 downstream of SLAMF7 (CD319, CRACC) activation, NK cell-mediated
cytotoxicity was impaired in EAT-2-/- NK cells (130).
1.4 Dendritic cells
Dendritic cells (DCs) are antigen-presenting cells (APC) that play a key role in both
innate and adaptive immunity, and provide antigen (Ag) to T cells to induce immune responses.
As an initiator of adaptive immunity, immature DCs capture antigens derived from infectious
pathogens, tissue necrosis, and local inflammation in peripheral tissues. In the presence of these
'danger' signals as well as pro-inflammatory cytokines such as interleukin (IL)-1, IL-6,
prostaglandins, and tumor necrosis factor (TNF)-α, DCs undergo a maturation and activation
process (131, 132). Depending on the cytokine milieu, naïve T cells then proliferate and
differentiate into Th1, Th2, Tfh (T follicular helper cells) or Treg cells with diverse cytokine
production profiles: interferon (IFN)- (Th1), interleukin (IL)-4/IL-13 (Th2), IL-21 (Tfh) and
IL-10/transforming growth factor (TGF)ß (Treg), respectively (133), resulting in the induction
of immunity or tolerance. Several reports show that immature (non-activated) DCs act as
inducers of T cell tolerance in the periphery after capturing self-antigens (e.g. apoptotic cells)
(134-136), whereas mature antigen-loaded DCs induce antigen-specific immunity (137, 138).
Given the roles of DCs in the regulation of immune responses and tolerance, it is not surprising
that abnormal DC activation has been shown to skew self-antigen presentation from tolerance to
autoimmunity in SLE.
33
1.4.1 Myeloid and Plasmocytoid dendritic cell subsets
DCs constitute a complex system of cells, which comprise several subsets and display
different characteristics and tissue distributions. Discussion of all the DC subsets is beyond the
scope of this thesis; however, DCs can be classically divided into two distinct subsets:
conventional dendritic cells (cDCs) and plasmacytoid DC (pDC). cDC can also be divided into
a number of subsets according to their localization. Myeloid dendritic cells (mDC), a typical
cDC subtype, can be differentiated from human monocytes or mouse bone marrow in vitro in
the presence of GM-CSF, and are usually CD11c+CD11b+B220- cells. pDCs can also be
differentiated from bone marrow-derived cells or human monocytes but require the presence of
Flt-3 ligand (Flt-3L) for their generation (reviewed at (139)).
1.4.1.1 Role of mDCs in the pathogenesis of lupus
Considerable evidence suggests that defective clearance of apoptotic cells by
macrophages plays an important role in the pathogenesis of lupus (140, 141). mDCs have been
shown to take up apoptotic and necrotic cell material and present it to T cells (137, 140). While
uptake of early apoptotic cells promotes tolerance, uptake of inefficiently cleared later apoptotic
or necrotic cells leads to mDC activation and activation of T cells. Indeed, many of the
potential endogenous ligands that can activate DCs, including RNA, DNA, and HMGB1, are
found in the apoptotic blebs released by late apoptotic cells. Uptake of this late apoptotic debris
by immature mDCs induces their maturation, leading to upregulation of CD40 and
costimulatory molecules as well as production of pro-inflammatory cytokines, such as IL-12
and IL-6 (Reviewed in (139, 142)). Presentation of autoantigens derived from apoptotic debris
34
by activated mDCs to autoreactive T cells is proposed to induce differentiation of Th1, Th17
and Tfh cells. In particular, production of IL-6, together with other pro-inflammatory cytokines,
acts to promote differentiation of Th17 cells and Tfh cells, and inhibit differentiation/activation
of Treg cells (143). Production of IL-6 by activated mDCs also promotes the survival and
differentiation of B cells (144), which together with T cell help leads to the production of
autoantibodies. Activated mDCs are also a source of the B-cell activating factor, BAFF, which
further promotes B cell activation, survival, and autoantibody production (145).
In mice, mDCs can also take up early apoptotic antigens that are complexed with
autoantibodies in an Fc-dependent manner (such as receptors for the Fc region of IgG (FcγR)),
leading to activation of TLR7 and TLR9 by endogenous RNA and DNA in the apoptotic debris,
respectively (146, 147). Thus, once autoantibodies are produced that can bind to the improperly
cleared apoptotic debris, immune complexes further enhance the uptake of apoptotic debris by
mDCs, resulting in further augmentation of pro-inflammatory cytokine production, contributing
to a positive feed-back loop (148).
Several studies have revealed that functional abnormalities of mDCs promote the
development of lupus (reviewed at (139)). For example, induced mutations or susceptibility
alleles that lead to enhanced production of pro-inflammatory cytokines in response to TLR
signaling, such as the Sigirr knockout or the yaa allele, promote lupus. There is evidence that
DC function is also defective in the NZ mouse strains. The mDCs of B6.Sle1.Sle2.Sle3 (B6.TC)
triple congenic mice, which have NZM2410-derived susceptibility loci from chromosomes 1, 4,
and 7 backcrossed on a B6 background, accumulate in the bone marrow, spleen and lymph
nodes as compared to B6 controls (149). Although bone marrow-derived myeloid DCs from
these mice express lower levels of CD80, CD86, and MHC class II, they induce more
35
proliferation in CD4+ T cells and inhibit the suppressive activity of Treg cells, as compared to
B6 DCs. In support of a role for IL-6 in the inhibition of Treg development in these mice,
B6.TC DCs display enhanced production of IL-6, which was shown to lead to blockade of Treg
activity. Interestingly, the increased production of IL-6 by DCs and blockade of Treg activity in
B6.TC both mapped to the Sle1 locus. In further support of a role for IL-6 in the pathogenesis of
disease in NZ mice, inhibition of IL-6 ameliorated kidney disease and reduced the titers of anti-
dsDNA antibodies in the NZB/W model (150).
Although there is evidence that mDC function may also be altered in SLE patients, the
data are somewhat contradictory. One group reported that monocyte-derived DCs (Mo-DCs)
from SLE patients, which have similar features to mDCs, were decreased in number and had
lower surface levels of HLA-DR, CD86 and CD80, as well as an impaired ability to stimulate T
cells, compared to those from normal healthy controls (151). In contrast, others have reported
higher levels of HLA-DR, CD86 and CD80, and an enhanced ability to stimulate allogeneic T
cell proliferation responses in-vitro for Mo-DC from SLE patients (152).
1.4.1.2 Role of pDCs in the pathogenesis of lupus
pDCs are rare circulating innate immune cells (0.2-0.8% of leukocytes) that are potent
producers of type I interferons (IFN-α/β) in response to viral nucleic acids sensed through TLR7
and TLR9 (153, 154). Type I IFNs are pivotal in the activation of the innate and adoptive
immune system and in the antiviral response (155-158). In addition to virus-derived DNA and
RNA, pDCs can also be activated by self-nucleic acids complexed with antibodies (159) or
DNA/RNA-binding proteins such as HMGB1(160).
36
Several lines of evidence support an important role for type I IFNs in the pathogenesis of
SLE (reviewed in (161, 162)). IFN- overexpression strongly exacerbates experimental SLE
and administration of therapeutic doses of IFN- can lead to development of SLE in humans
(163). Hence, the blockade of IFN signaling (for example, using antibodies to IFN or
IFNAR(IFN- receptor)) represents a potential therapeutic approach to SLE (164). Indeed,
several groups have found a higher expression of IFN-responsive genes in peripheral blood cells
of lupus patients, which is known as the “Interferon Signature” (165-167).
Lupus mouse models also support a role for type I IFNs in the initiation of autoimmunity
in lupus. Deletion of the type I IFN receptor (IFNAR1) in NZB mice ameliorates disease
activity resulting in reduced mortality, hemolytic anemia, and GN as well as diminished
production of autoantibodies (168). Similar findings were reported in other lupus mouse models
such as C57BL/lpr, (B6.Nba2 × NZW)F1 and NZM2328 when IFNAR1 was deleted in these
mouse models (90, 169-171). In contrast, MRL/lpr mice deficient in IFNAR1 showed
augmented disease (172), despite the observation that MRL/lpr have increased expression of
type I IFN responsive genes (173). In addition, deletion of the IFNAR1 gene had a minimal
impact on B6.Nba2 mice (174). These latter finding suggests that type I IFN may not play an
important role in the exacerbation of all lupus-prone mouse models.
Type I IFNs have pleomorphic effects on the immune system, most of which are
predicted to augment the immune dysregulation in lupus. IFN-α promotes the differentiation of
monocytes to antigen-presenting cells (175) and induces the maturation and activation of mDCs
(162), promoting increased differentiation and activation of T cells. IFN-α also promotes the
polarization of T cells to Th1 cells, suppresses Treg cell differentiation, and directly activates
37
cytotoxic T cells (176). Furthermore, IFN-α activates B cells to differentiate into antibody-
producing plasma cells (177) and enhances the cytotoxicity of NK cells (178).
As pDCs produce large amounts of type I IFNs, it has been proposed that they are the
major source of pathogenic IFN in SLE. In support of this, IFN-producing pDCs have been
found infiltrating various inflamed tissues, such as the skin and kidneys, of SLE patients.
Several studies in humans and mice have shown that immune complexes (IC) containing nucleic
acids, including dsDNA and RNA, induce IFN-α production by pDCs (reviewed in (179, 180)).
Uptake of these immune complexes is mediated by receptors for the Fc region of IgG (FcγR), in
particular, FcγRIIa (159), which targets the complex to the late endosomal compartment, where
the nuclear antigens within the complex can bind to and stimulate relevant TLRs (TLR7 for
RNA and TLR9 for dsDNA). Although free dsDNA and RNA is not taken up by pDCs, recent
work suggests that dsDNA complexed with the anti-microbial proteins found in neutrophil
extracellular traps can also be taken up in a FcR-independent fashion, leading to TLR
stimulation. In addition to being the major producers of type I IFNs, pDCs can process and
present autoantigen to autoreactive T cells, further promoting their activation and proliferation.
Although pDC function appears to be mostly normal in SLE, there is some evidence that
pDCs may be functionally abnormal in NZ mouse strains. The pDCs from NZB mice have been
shown to secrete high levels of IFN- when stimulated with a TLR9 agonist in-vitro (181).
Subsequent studies in B6.Nba2 subcongenic mice have linked this abnormality to an interval
containing both the FcR and SLAM loci (91) and revealed that this interval controls expansion
and TLR9 sensitivity of pDCs, leading to enhanced production of cytokines such as IL-10 and
IFN-. Indeed, work from our laboratory also showed marked expansion of splenic pDC and
38
mDC populations in B6.NZBc1c13 bicongenic mice that contain both c1 (extending from 62-
191 Mb) and c13 (extending from 37.7-119.6 Mb) intervals (182). However, despite expansion
of pDCs in B6.NZBc1c13 bicongenic mice, splenic IFN- levels remained low and production
of IFN-α by pDCs was reduced in older mice. Previous experiments in our laboratory indicate
that B6.NZBc13 mice have a defect in clearance of apoptotic debris by macrophages, resulting
in increased availability of TLR-stimulating nuclear antigens (183), so it was hypothesized that
chronic exposure to nuclear antigen-containing ICs in vivo might lead to impaired IFN-α
production. This hypothesis was examined by repeated stimulation of bone marrow pDCs with
TLR ligands, and the results showed that chronic stimulation of pDCs with TLR ligands leads to
impaired IFN-α production, a phenomenon termed TLR tolerance. These observations
suggested that expansion of pDCs and production of anti-nuclear antibodies is not necessarily
associated with increased IFN-α production. Nevertheless, B6.NZBc1c13 bicongenic mice were
found to produce high levels of other pro-inflammatory factors such as IFN-γ, TNF-α and
BAFF, raising the possibility that the expansion of DCs in these mice may arise from increased
amounts of pro-inflammatory factors rather than TLR-hyper-responsiveness. Abnormal
production of pro-inflammatory cytokines was linked to the genetic loci on chromosome 1, as
increased levels of these cytokines, with the possible exception of TNF-α, were not seen in
B6.NZBc13 mice.
Expansion of pDCs also has been reported in B6.TC mice. However, mDCs from B6.TC
mice expressed a type I IFN signature before initiation of disease, suggesting that mDCs may be
more relevant before disease onset (149, 169, 184). In support of a role for both mDCs and
pDCs in the pathogenesis of lupus, it has been demonstrated that depletion of mDCs and pDCs
in the MRL/lpr model ameliorated the lupus phenotype (185).
39
1.5 Role of T cells in the pathogenesis of SLE
CD4+ T helper (Th) cells are active mediators of SLE pathogenesis, and have been
shown to play an important role in disease pathogenesis in a number of induced mutant and
spontaneously arising mouse models of lupus as well as human lupus (186-188).
The contribution of different effector T-helper cell subsets to the pathogenesis of lupus
has been the subject of much research over the years. Several studies have been conducted in
different lupus mouse models, indicating the central role of Th1, Th17 and Tfh cells in the
pathogenesis of lupus. Earlier studies had indicated a predominant role for Th1 cells in lupus
(189, 190), however increasing data suggest an important role for T follicular helper cells (Tfh)
and Th17 cells in lupus (191). However, some disagreement still exists regarding the relative
contributions of specific Th cell subsets and their related cytokines to the pathogenesis of lupus.
Evidence demonstrating the role of different T cell subsets in the pathogenesis of lupus will be
discussed in the following sections.
1.5.1 Role of Th1 cells in the pathogenesis of lupus
Th1 self-reactive T cells have been identified in several murine models of lupus and are
thought to provide support for autoantibody production (192-195). The first evidence showing
the importance of IFN- signaling in the pathogenesis of murine lupus was provided by Ozmen
et al., who showed that blockade of IFN- with antibodies against IFN- or the IFN- receptor
(IFN-R) resulted in inhibition of kidney disease in NZB/W mice (193). Subsequent reports
confirmed this observation by showing that genetic disruption of the Ifngr gene in MRL/lpr and
NZB/W lupus-prone mice led to reduced autoantibody production and kidney damage (194-
40
196). Similar findings were observed when IFN- was blocked by treatment with IFN-R-Fc
(197) or by knock out of the T-box transcription factor (T-bet) that plays a critical role in Th1
lineage commitment, where decreases in serum levels of pathogenic autoantibodies such as
IgG2a and IgG3 paralleled reduction in kidney disease (198). Th1 cells and their main effector
cytokine, IFN-, have also been implicated in the development of lupus in humans (199).
Several studies have shown increased proportions of Th1 cells in the peripheral blood of SLE
patients compared to healthy individuals (200).
Despite the evidence strongly implicating IFN- in the pathogenesis of lupus, the precise
pathogenic mechanism by which this cytokine contributes to disease is poorly understood.
Previous reports suggested that IFN- contributes to the development of lupus through its
capacity to induce B cell immunoglobulin (Ig) switching to IgG2a and IgG3 isotypes that are
particularly efficient at activating downstream inflammatory cascades (201, 202). However, a
recent report demonstrating that T cell-derived IFN- does not directly stimulate antibody
production by human B cells (203) suggests that B cells may not be the direct target of IFN- in
its pathogenic role to induce the disease (203).
Indirect effects of IFN- on B cells could be mediated via stimulation of myeloid cells to
produce BAFF, thereby supporting aberrant B cell responses (204, 205). Interestingly a recent
report demonstrated a fundamentally different mechanism of action of IFN-. They showed that
IFN- induced accumulation of Tfh cells, resulting in abnormal GC formation and autoantibody
production in the sanroque mouse model of lupus (206).
41
1.5.2 Role of Tfh cells in the pathogenesis of lupus
Tfh cells are a distinct subset of Th cells involved in the regulation of antigen-specific B
cell immunity by, providing signals and cytokines required for clonal expansion, class
switching, plasma cell differentiation and formation of germinal centers (207, 208). Tfh cells
express the unique transcription factor Bcl6 (209, 210) and are characterized by expression of
high levels of CD40L, ICOS, PD1 and most importantly, CXCR5, which allows them to
localize to developing germinal centers (211-214). These cells characteristically produce high
levels of IL-21, a cytokine that has been shown to be critical in the generation of plasma cells,
isotype switching, and germinal center formation (211, 215).
The role of this population in lupus was first suggested when investigations into the
sanroque mouse strain revealed that a point mutation in the gene encoding Roquin was
associated with an intrinsic T cell defect that resulted in spontaneous expansion of Tfh cells
and increased germinal center formation (216). These mice developed a lupus-like disease,
characterized by ANA production and GN. Notably, introduction of a deletion in SLAM-
associated protein (SAP) onto this background, which inhibits Tfh cell development, resulted
in correction of autoimmunity and normalization of the number of Tfh cells (217). This
finding raised the possibility that abnormal help provided by deregulated Tfh cells might
promote lupus. In support of this concept, increased proportions of Tfh cells that produce high
levels of IL-21 have also been seen in MRL/lpr and BXSB/Yaa lupus-prone mice (218, 219).
Deletion of IL-21 receptors in BXSB/Yaa mice was associated with decreased numbers of Tfh
cells and ameliorated development of pathogenic autoantibody production, GN and mortality
(218). Increased numbers of circulating Tfh-like cells have also been observed in human SLE
patients, and are associated with more severe disease (203, 220). Additionally, IL-21
42
polymorphisms are associated with human SLE (221). Taken together, the existing evidence
suggests that this cell population may play a pathogenic role in both human and murine lupus.
1.5.3 Role of Th17 cells in the pathogenesis of lupus
Th17 cells have been shown to develop via a pathway distinct from other Th lineages as
they uniquely express orphan retinoid nuclear receptor (ROR)γt for their differentiation (222),
which acts synergistically with RORα to induce complete Th17 differentiation (223). Lineage
commitment to Th17 cells from naïve T cells is induced by the combination of transforming
growth factor (TGF)-β and IL-6 cytokines, or IL-21 stimulation (224-226). Th17 cells produce
IL-17A and IL-17F, which are potent pro-inflammatory cytokines involved in the early
immune response against extracellular bacteria and fungi (29). They also produce IL-21, IL-
22, TNF, IL-6 and IL-9 (227-229).
Studies in lupus-prone mice provide evidence for the participation of Th17 cells in
lupus pathogenesis. Splenocytes from (NZB x SWR)F1 mice produce significant levels of IL-
17 when stimulated with nucleosomes and Th17 cells are also found in the kidneys of these
mice (230). In NZM2328 mice with a gene deletion of TNF receptors 1 and 2, increased
numbers of Th17 cells were seen and associated with high anti-dsDNA antibody levels and
accelerated nephritis (231). Increased serum levels of IL-17 and an increased proportion of
splenic Th17 cells were also detected in BXD2 mice, a recombinant inbred strain derived from
intercrossing C57BL/6 and DBA/2 mice (232). BXD2 lupus-prone mice exhibited increased
production of IgG anti-DNA antibodies, as well as spontaneous development of elevated
numbers of germinal centers. Introduction of a null gene for the IL-17A receptor onto the
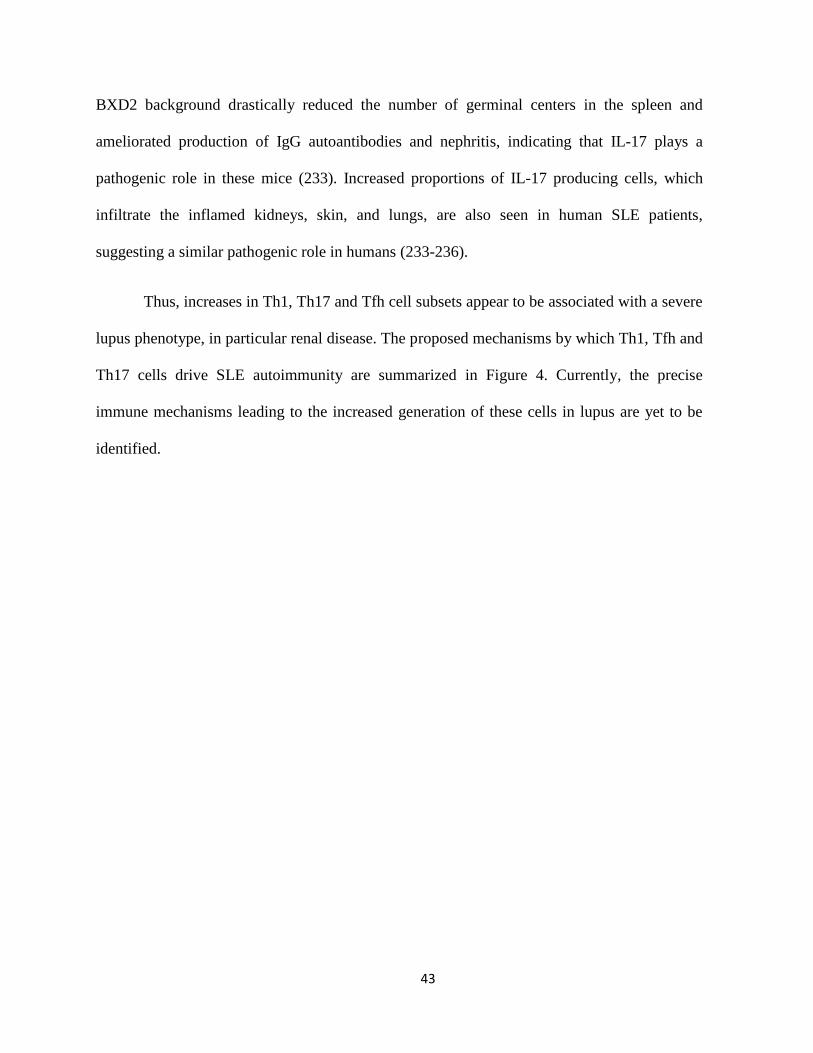
43
BXD2 background drastically reduced the number of germinal centers in the spleen and
ameliorated production of IgG autoantibodies and nephritis, indicating that IL-17 plays a
pathogenic role in these mice (233). Increased proportions of IL-17 producing cells, which
infiltrate the inflamed kidneys, skin, and lungs, are also seen in human SLE patients,
suggesting a similar pathogenic role in humans (233-236).
Thus, increases in Th1, Th17 and Tfh cell subsets appear to be associated with a severe
lupus phenotype, in particular renal disease. The proposed mechanisms by which Th1, Tfh and
Th17 cells drive SLE autoimmunity are summarized in Figure 4. Currently, the precise
immune mechanisms leading to the increased generation of these cells in lupus are yet to be
identified.
44
Figure 1.4. Proposed model on Th1, Tfh and Th17 cells contribution to SLE
pathogenesis. Th1 cells produce large amounts of IFN-, inducing accumulation of Tfh cells
and promoting differentiation of autoreactive B cell to plasma cells that produce pathogenic
IgG2a and IgG3 isotypes. In parallel, production of IL-21 by Tfh cells promotes survival, class-
switching, and production of antinuclear autoantibodies by autoreactive B cells and Th17 cells
differentiation. Th17 cells also produce IL-21, providing an autocrine signal, which is
important for effective Th17 differentiation. Ultimately, Th17 cells infiltrate the kidneys, and
through production of IL-17 activate macrophages, renal fibroblasts and epithelial cells to
produce pro-inflammatory chemokines and cytokines. In addition, antibody production by
autoreactive B cells can complex with nuclear Ag and complement factors, activating
macrophages, and in tandem with IL-17 this leads to production of cytokines and chemokines
such as G-CSF, GM-CSF, IL-6, TNFα, CXCL1, CXCL2 and CXCL5. This results in the
recruitment and activation of neutrophils, which together with pro-inflammatory cytokines and
complement activation, leads to kidney damage.
45
1.6 Thesis objectives and hypothesis
Experiments in the Wither laboratory have focused on the NZB mouse strain, one of
the first lupus-prone murine models discovered. This strain spontaneously develops an
autoimmune disease that is remarkably similar to human SLE.
Our laboratory has identified a region on NZB c1 that is linked to the development of
GN and production of anti-nuclear antibodies. B6 congenic mice with a NZB c1 interval,
extending from 35-106 cM, produce anti-nuclear antibodies and develop mild GN. By
creating mice with smaller overlapping NZB c1 intervals, in previous work we have
demonstrated that there are at least three lupus susceptibility loci located on NZB c1 within
the 70cM to 100cM region, that are sufficient to induce disease. In these preliminary studies,
T cells from young pre-autoimmune mice (which were predominantly naïve) demonstrated
increased production of IFN-γ in response to anti-CD3 stimulation, suggesting the presence of
an intrinsically altered T cell function. This was further supported by results in mixed
hematopoietic chimeric mice, where B6.NZBc1 demonstrated enhanced spontaneous T cell
activation compared to their B6 counterparts. Thus, one or more of the loci appeared to
promote lupus by altered T cell activation and/or differentiation.
The overall objective of my studies was to identify the lupus susceptibility genes
within the c1(70-100) interval and to define the immune mechanisms by which they act to
promote disease with the following hypothesis:
Intrinsic T cell defects in c1(70-100) mice lead to increased differentiation to, and/or
altered function of, Tfh and/or Th17 cells, and the differences in the severity of renal disease
46
in subcongenic mouse strains with shorter regions in this interval reflect differences in their
capacity to promote differentiation of these T cell subsets.
Therefore the initial Aims of my thesis were:
Aim 1. To characterize the pro-inflammatory T cell subsets in c1(70-100) mice and to localize
the genetic regions associated with the observed abnormalities using c1 subcongenic mouse
strains.
Aim2. To determine whether alterations in the proportions of various T cell populations in
NZB c1 congenic mouse strains arise from intrinsic T cell functional abnormalities and/or
altered function in other cell populations.
Findings from Aims 1 and 2, outlined in chapter II of the thesis, suggested that genetic
polymorphisms on NZB c1, located in the 70-100 cM interval, resulted in intrinsic T cell and
other immune cell defects, one of which was localized to DC, that interacted in an epistatic
fashion to enhance differentiation of autoreactive and antigen-primed T cells to IL-17-, IL-21-
and IFN--producing cells, promoting renal disease in these mice.
Since these findings localized the genetic polymorphism leading to altered DC
function to the 88-96 interval of NZB c1 congenic mice, which contains only 18 protein
coding genes, my subsequent experiments focused upon identification of the candidate gene
within this interval. These experiments are outlined in Chapter 3 of thesis and had the
following specific aim:
Aim 3. To identify the candidate gene in the NZB 88-96 interval and determine how it leads to
the altered DC function in these mice.

47
48
Chapter 2
T cell and Dendritic cell Abnormalities Synergize to Expand Pro-inflammatory T
cell Subsets Leading to Fatal Autoimmunity in B6.NZBc1 Lupus-Prone Mice
Nafiseh Talaei1,2, Yui-Ho Cheung1,2, Carolina Landolt-Marticorena3,4, Babak Noamani1, Timothy Li1 and
Joan E. Wither1,2,3,4
1Arthritis Centre of Excellence, Division of Genetics and Development, Toronto Western Research
Institute, University Health Network, Toronto, Ontario; Departments of 2Immunology and 3Medicine,
University of Toronto, Toronto, Ontario; 4Division of Rheumatology, University Health Network,
Toronto, Ontario
All experiments were performed by N. Talaei. Y. Cheung contributed to generation of c1 congenic mice,
C. Landolt and B. Noamani helped with sacrificing of mice and isolation of organs, T. Li performed the
genotyping.
Published in PLoS One. September 2013, Volume 10, e75166. © Copyright 2013. PLoS.
49
2.1 Abstract
We have previously shown that B6 congenic mice with a New Zealand Black
chromosome 1 (c1) 96-100 cM interval produce anti-nuclear Abs and that at least two additional
genetic loci are required to convert this subclinical disease to fatal glomerulonephritis in mice
with a c1 70-100 cM interval (c1(70-100)). Here we show that the number of T follicular helper
and IL-21-, IFN--, and IL-17-secreting CD4+ T cells parallels disease severity and the number
of susceptibility loci in these mice. Immunization of pre-autoimmune mice with OVA
recapitulated these differences. Differentiation of naïve T cells in-vitro under polarizing
conditions and in-vivo following adoptive transfer of OVA-specific TCR transgenic cells into
c1(70-100) or B6 recipient mice, revealed T cell functional defects leading to increased
differentiation of IFN-- and IL-17-producing cells in the 96-100 cM and 88-96 cM intervals,
respectively. However, in-vivo enhanced differentiation of pro-inflammatory T cell subsets was
predominantly restricted to c1(70-100) recipient mice, which demonstrated altered dendritic cell
function, with increased production of IL-6 and IL-12. The data provide support for the role of
pro-inflammatory T cells in the conversion of subclinical disease to fatal autoimmunity and
highlight the importance of synergistic interactions between individual susceptibility loci in this
process.
50
2.2 Introduction
Systemic Lupus Erythematosus (SLE) is a generalized autoimmune disease
characterized by the production of autoantibodies, particularly those directed against nuclear
antigens, which form immune complexes that deposit in tissues. Studies of SLE in humans and
lupus-prone mice indicate that multiple genetic polymorphisms affecting diverse immune
populations interact with each other to produce the lupus phenotype. Among these populations
are T helper (Th) cells. Although early studies demonstrated a predominant role for Th1 cells in
lupus, several recent studies suggest that two other pro-inflammatory Th cell subsets, T
follicular helper (Tfh) and Th17 cells, are also pathogenic (237).
Tfh cells are a distinct subset of Th cells that provide help for antigen specific B cell
responses in the context of germinal centers (GC) and produce high levels of IL-21 (207, 208).
A potential role for this population in the pathogenesis of lupus was first suggested by the
observation that lupus-prone mice with a homozygous point mutation in the Roquin gene,
demonstrated expansion of their Tfh population, and subsequently supported by demonstration
of similar expansions in MRLlpr and BXSB/Yaa lupus-prone mice (238).
Although Th17 cells are defined by their IL-17 production, they produce a variety of
other cytokines including IL-21, IL-22, TNF-α, IL-6 and IL-9 (239). Expansion of this
population has been demonstrated in several lupus-prone mouse strains, including (New
Zealand Black (NZB) x SWR)F1, TNF receptor 1 and 2 gene-deleted New Zealand Mixed 2328,
and BXD2 mice (230-232). Notably, introduction of a null gene for the IL-17A receptor onto
the BXD2 background significantly attenuated production of IgG autoantibodies and nephritis
(232). Despite compelling evidence that Tfh and Th17 cells play a central role in lupus
51
pathogenesis, the genetic basis leading to the aberrant activation of these cell populations
remains unknown.
To characterize the immunologic abnormalities that promote lupus, our laboratory has
produced a series of congenic mouse strains with homozygous NZB chromosomal intervals
crossed onto the non-autoimmune C57BL/6 (B6) background. In previous experiments we
showed that mice with a NZB c1 interval extending from 70-100 cM (c1(70-100)) develop a
severe lupus phenotype, with high titers of anti-dsDNA Abs and glomerulonephritis (GN),
leading to death of ~40% of the mice by 8 months of age. This phenotype appeared to result
from at least 3 genetic loci, as indicated by progressively attenuated disease in mice with NZB
c1 intervals extending from 88- or 96-100 cM (94). Here we show that the disease severity in
these mice parallels the expansion of pro-inflammatory T cell subsets, specifically Th1, Th17,
and Tfh cells. We further demonstrate that this expansion can be recapitulated following
immunization of pre-autoimmune mice with an exogenous antigen. This T cell skewing results
from a combination of immune cell functional abnormalities in congenic mice that localize to
different regions within the c1 70-100 interval. Naïve T cell functional abnormalities that lead
to expansion of IFN-- and IL-17- producing cells localized to the 96-100 and 88-96 intervals,
respectively, whereas DC functional abnormalities that promote expansion of all the pro-
inflammatory T cell subsets localized to the 88-96 and 70-88 intervals. Notably, altered DC
function appeared to play a critical role in this expansion, because in the absence of DC
abnormalities, minimal expansion of pro-inflammatory T cell subsets was seen. Our findings
provide insight into how individual susceptibility loci, which alone produce modest changes in
immune function, interact synergistically to profoundly alter immune function leading to severe
clinically relevant autoimmune disease.
52
2.3 Materials and Methods
2.3.1 Ethics statement
Mice were housed in a Canadian Council on Animal Care approved facility at the
Toronto Western Research Institute, part of the University Health Network. All mice used and
experiments performed in this study were approved by the Animal Care Committee of the
University Health Network (Animal Use Protocol #123).
2.3.2 Mice
B6 and NZB mice were purchased from Taconic (Germantown, NY) and Harlan
Sprague Dawley (Blackthorn, England), respectively. B6.OT-II TCR Tg and B6.Thy1aIgHa
mice were originally obtained from Taconic and The Jackson Laboratory (Bar Harbor, ME),
respectively, and bred in our facility. Congenic mice were generated as previously described
(94). OT-II TCR Tg and Thy1aIgHa (termed Thy1.1 for simplicity) congenic mice were
produced by polymorphic marker assisted backcrossing. Only female mice were examined and
all mice were specific-pathogen free.
2.3.3 Flow cytometry
Half a million RBC-depleted splenocytes were incubated with mouse IgG
(Sigma-Aldrich) for 15 min prior to staining with various combinations of directly-conjugated
mAbs. Allophycocyanin- or PerCP-Cy5.5-conjugated streptavidin (SA) (BD Biosciences) were
used to reveal biotin-conjugated Ab staining. Dead cells were excluded by staining with 0.6
μg/ml PI (Sigma-Aldrich). Events were acquired using a LSR II instrument (BD Biosciences)
and analyzed using FlowJo software (Tree Star Inc.; Ashland, OR). The following directly
53
conjugated mAbs were purchased from BD Biosciences: Biotin-conjugated anti-CXCR5 (2G8),
-CD3 (145-2C11), -CD4 (RM4-5), -B220(RA3-6B2), -CD86 (B7.2; GL1), and -CD90.2
(Thy1.2; 30-H12); PE-conjugated anti-CD69 (H1.2F3), -CD44 (IM7), -CD95 (Jo2), -B7.2
(GL1), -IA/IE (M5/114.15.2) and -PD1 (J43); PE-Cy7 conjugated anti-CD44 (IM7) and -CD11c
(N418); allophycocyanin-Cy7 conjugated anti-CD44 (IM7) and -CXCR5 (2G8); Pacific Blue-
conjugated anti-B220 (RA3-6B2) and -CD4 (RM4-5); PerCP-Cy5.5-conjugated anti-B220
(RA3-6B2); and FITC-conjugated anti-CD90.1 (Thy1.1; OX-7) and -CD11b (M1/70). All
isotype controls were obtained from BD Biosciences. Biotin-conjugated peanut agglutinin
(PNA) was purchased from Sigma-Aldrich and FITC-conjugated anti-CD62L (MEL-14) mAb
was purchased from Cedarlane Laboratories (Burlington, ON, Canada).
2.3.4 Detection of cytokine-secreting T cells
CD4+ T cells were isolated from RBC-depleted splenocytes using the Dynal Mouse CD4
Negative Isolation Kit (114.15D, Invitrogen), re-suspended in complete RPMI medium (10%
FBS, non-essential amino acids, L-glutamine, β-mercaptoethanol, penicillin, and streptomycin),
and stimulated at 2.5 x 10⁵ cells per well in 96-well plates with plate-bound anti-CD3 Ab
(4µg/ml; Cedarlane) and 1 μg/ml soluble anti-CD28 Ab (BD Biosciences). Supernatants were
harvested after 72 h and the levels of IL-2, IL-4, IL-17, and IFN-γ measured using a mouse
cytometric bead array kit specific for Th1/Th2/Th17 cytokines (BD Biosciences). IL-21 levels
were measured using a mouse IL-21 Duo-Set ELISA kit (R&D Systems). Cytokine-secreting
CD4+ T cells were detected by flow cytometry. RBC-depleted splenocytes were stimulated for 5
h with PMA (50 ng/ml; Sigma-Aldrich) and ionomycin (1 µg/ml; Sigma-Aldrich) in the
presence of GolgiStop (BD Biosciences). The cells were stained with Pacific Blue-anti-CD4
54
and biotinylated-anti-CD3 followed by PerCP-Cy5.5-SA, and then fixed and permeabilized with
Cytofix/Cytoperm (BD Biosciences) before intracellular staining with allophycocyanin-anti–
IFN- (XMG1.2), Alexa Fluor® 488-anti-IL-17A (TC11-18H10), and PE-anti–IL-4 (BVD4-
1D11). To quantify IL-21-secreting cells, fixed and permeablized cells were incubated with an
IL-21R/Fc chimera (R&D Systems) and then stained with a PE-conjugated affinity-purified
F(ab’)2 goat anti-human Fc Ab (Jackson ImmunoResearch Laboratories) (240).
2.3.5 Naïve CD4+ T cell isolation and differentiation
Naïve CD4+ T cells (CD4+CD62Lhi) were purified using a mouse CD4+CD62L+ T Cell
Isolation Kit (Miltenyi Biotec), re-suspended in complete RPMI, and stimulated with plate-
bound anti-CD3 (4 μg/ml) and soluble anti-CD28 (1 μg/ml) in 96-well plates under the
following conditions (all cytokines and mAb purchased from R&D Systems): Th0 cell: anti-
IFN- (10 µg/ml) and anti-IL-4 (10 µg/ml); Th1 cell: IL-12 (10 ng/ml), and anti-IL-4 (10
µg/ml); Th2 cell: IL-4(10 ng/ml), and anti-IFN- (10 µg/ml); Th17 cell: IL-6 (10 ng/ml), IL-23
(10 ng/ml), TGF-1 (2.5 ng/ml), anti-IFN- (10 µg/ml) and anti-IL-4 (10 µg/ml); and IL-21-
producing T cell: IL-6 (30 ng/ml), anti-IFN- (10 µg/ml) and anti-IL-4 (10 µg/ml). After 4
days, the cells were washed and re-stimulated for 4 h with 50 ng/ml PMA and 1 µg/ml
ionomycin in the presence of GolgiStop. Cytokine-secreting T cells were quantified as outlined
previously.
55
2.3.6 In-vivo differentiation of OVA-specific T cells
Mice (8-12-wk old) were immunized i.p. with 100 μg OVA (Grade II, Sigma) or PBS
emulsified in CFA (Sigma) and sacrificed 2 wks later. For measurement of OVA-specific
cytokine production, 1 x 10⁶ RBC-depleted splenocytes were cultured in complete RPMI (5%
FBS) alone, or containing 100 µg/ml OVA, per well in 96-well plates. Supernatants were
harvested at 72 h and assayed for IL-4, IFN-, IL-17, and IL-21, as outlined previously. For
adoptive transfers, 3 x 10⁶ naive splenic CD4+ T cells from 8-10-wk-old B6 or congenic OT-II
mice were injected into the tail vein of 8-10-wk-old B6.Thy1.1 or c1(70-100).Thy1.1 recipients.
The following day mice were immunized with OVA emulsified in CFA. The proportion of
various T cell subsets within the spleen was determined 2 wks later by flow cytometry after
gating Thy1.2+ (transferred) T cells.
2.3.7 Immunofluorescence staining of tissue sections
Spleens were snap-frozen in OCT compound (Sakura Finetek; Torrance, CA) at the time
of sacrifice. Cryostat sections (5 µm) were fixed in acetone, washed with PBS, and blocked
with 5% FBS/PBS. Sections were stained with biotinylated-PNA, allophycocyanin-conjugated
anti-CD4, PE-conjugated anti-PD1 and FITC-conjugated anti-IgM F(ab’)2 (Jackson
Immunoresearch), to detect Tfh cells within GC. Biotin staining was revealed using 7-amino-4-
methylcoumarin-3-acetic acid-conjugated streptavidin as a secondary reagent (Jackson
Immunoresearch). Stained sections were mounted with Fluoro-Gel (Electron Microscopy
Sciences) and tissue fluorescence was visualized using a Zeiss Axioplan 2 imaging microscope
(Oberkochen, Germany). Digital images were obtained using the manufacturer’s imaging
system.
56
2.3.8 BMDC isolation and stimulation
Bone marrow cells were isolated by flushing femurs of 8–12 wk-old mice. After RBC
lysis, the cells were re-suspended at 106 cells/mL and cultured for 7 days with recombinant
human FLT3L (20 ng/mL; R&D Systems) in complete RPMI. For TLR stimulation, 4 x 10⁵
cells were cultured in 96-well flat-bottom plates for 24 h with media alone or containing various
TLR ligands including: Imiquimod (2 µM), Poly (I:C) (50 µg/mL), CpG ODN 2216 or control
(250 nM), CpG ODN 1826 or control (250 nM) (all from InvivoGen; San Diego, CA), or LPS
(25 µg/mL; Sigma-Aldrich), as a positive control. The cells were then harvested and stained
with anti-CD11c, -CD11b, and -B220. Staining with anti-CD86 (B7.2) and -MHC-II was used
to assess cellular activation and intra-cellular levels of IL-12, IL-6 and TNF- were used to
assess cytokine production. GolgiStop or GolgiPlug (BD Biosciences) were added to cell
cultures for the last 4 h of the incubation, prior to measurement of intracellular cytokines, which
were detected using allophycocyanin-conjugated anti-IL-12 (C15.6), Alexa Fluor® 488-
conjugated anti-IL-6 (MP5-20F3) and PE-conjugated anti–TNF- (TN3-19.12). BD Horizon
fixable viability stain 450 (FVS450) was used to exclude dead cells. To assess IFN-α and IL-23
production, cytokine levels in tissue culture supernatants were measured by ELISA kits as
follows: IFN-α (PBL Biomedical Laboratories; Piscataway, NJ); and IL-23 (IL-23 Duo-Set,
R&D Systems).
2.3.9 In-vitro culture of BMDCs and OVA-specific T cells
2x10⁴ BMDC were co-cultured with OVA 323-339 peptide (GenScript, Piscataway, NJ)
and 2x10⁵ naïve CD4+ T cells, isolated from the spleens of 8-10-wk-old B6.OT-II or c1
congenic OT.II mice, in the presence of 5 ng/ml recombinant mouse GM-CSF (R&D Systems)
57
for 4 days. Cells were stimulated with PMA (50 ng/ml) and ionomycin (1 g/ml) in the
presence of GolgiPlug or GolgiStop (BD Biosciences) for 4 h before harvesting. The cells were
then stained for cell surface DC (CD11c, CD11b, B220) or T cell (CD3, CD4) markers, fixed,
permeabilized, and stained for detection of intracellular cytokines, including IL-6, IL-12, IL-21,
IL-17 and IFN-, as outlined previously.
2.3.10 In-vitro culture of splenocytes and OVA-specific T cells
Splenocytes were isolated from 5-6-wk-old B6.Thy1.1 or c1(70-100).Thy1.1 mice. Total
splenocytes were seeded in 96-well U-bottom plates at 2x10⁵ cells per well, then co-cultured for
72 hr with 1 µg/ml OVA 323-339 peptide (GenScript, Piscataway, NJ) and 2x10⁵ purified naïve
CD4+ T cells isolated from the spleens of 8-10-wk-old B6.OT-II or c1(70-100) congenic OT.II
mice. PMA (50 ng/ml) and ionomycin (1 g/ml) together with GolgiPlug or GolgiStop (BD
Biosciences) were added for the last 4 h before harvesting. The cells were then stained for cell
surface DC (CD11c, CD11b, B220), B cells (CD19 and B220) or T cell (CD3, CD4) markers,
fixed, permeabilized, and stained for detection of intracellular cytokines, as outlined previously.
2.3.11 Statistical analysis
Comparisons of differences between groups of mice for continuous data were performed
using one-way ANOVA followed by Dunns’ post-test for multiple comparisons. All statistical
analyses were performed using GraphPad software (La Jolla, CA, USA).
58
2.4 Results
2.4.1 Expansion of pro-inflammatory CD4+ T cell subsets in NZB c1 congenic
mice
B6 congenic mice with NZB c1 intervals extending from 96-100 cM (172.8-183.0 Mb;
c1(96-100)), 88-100 cM (170.3-183.0 Mb; c1(88-100)) or 70-100 cM (126.6-183.0 Mb; c1(70-
100)) demonstrate progressively more severe disease with increasing length of the c1 interval
(Figure 2.1). Since increases in the number and size of GC paralleled disease severity in these
mice, we postulated that changes in Th cell number/function were producing these differences.
To address this possibility, Th cell subsets were examined in 4-mo-old B6 and congenic mice,
using flow cytometry. As shown in Figure 2A&B, the proportion and number of Tfh cells
(gated as CD4+CD44hiCD62LloCXCR5hiPD1hi) was significantly increased in c1(88-100) and
c1(70-100) mice, whereas the level of these cells in c1(96-100) mice was similar to B6 mice.
Consistent with the increases in Tfh, and our previous findings, there was a trend to increased
proportions of GC B cells in all three congenic mouse strains with the greatest increase seen in
c1(70-100) mice (Figure 2.2 A&B). The expansion of Tfh was further confirmed by
immunofluorescence microscopy where increased numbers of Tfh cells were seen in the GC of
c1(88-100) and c1(70-100) mice (Figure 2.2 C&D).
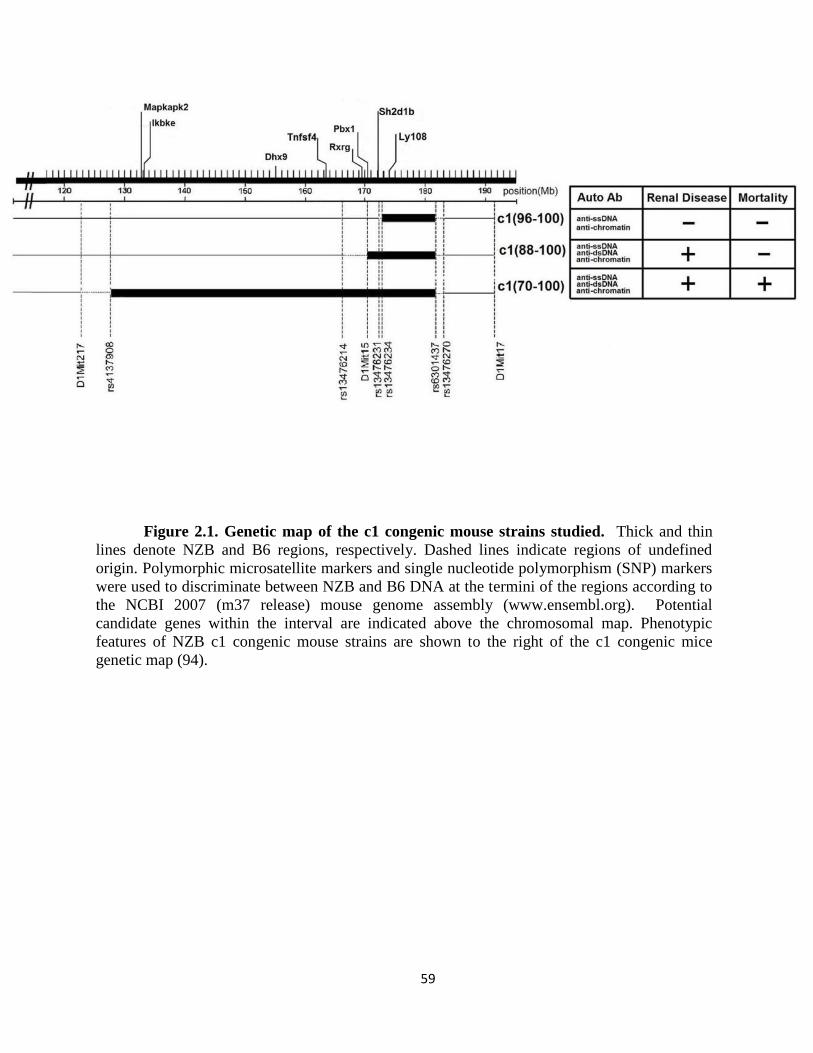
59
Figure 2.1. Genetic map of the c1 congenic mouse strains studied. Thick and thin
lines denote NZB and B6 regions, respectively. Dashed lines indicate regions of undefined
origin. Polymorphic microsatellite markers and single nucleotide polymorphism (SNP) markers
were used to discriminate between NZB and B6 DNA at the termini of the regions according to
the NCBI 2007 (m37 release) mouse genome assembly (www.ensembl.org). Potential
candidate genes within the interval are indicated above the chromosomal map. Phenotypic
features of NZB c1 congenic mouse strains are shown to the right of the c1 congenic mice
genetic map (94).
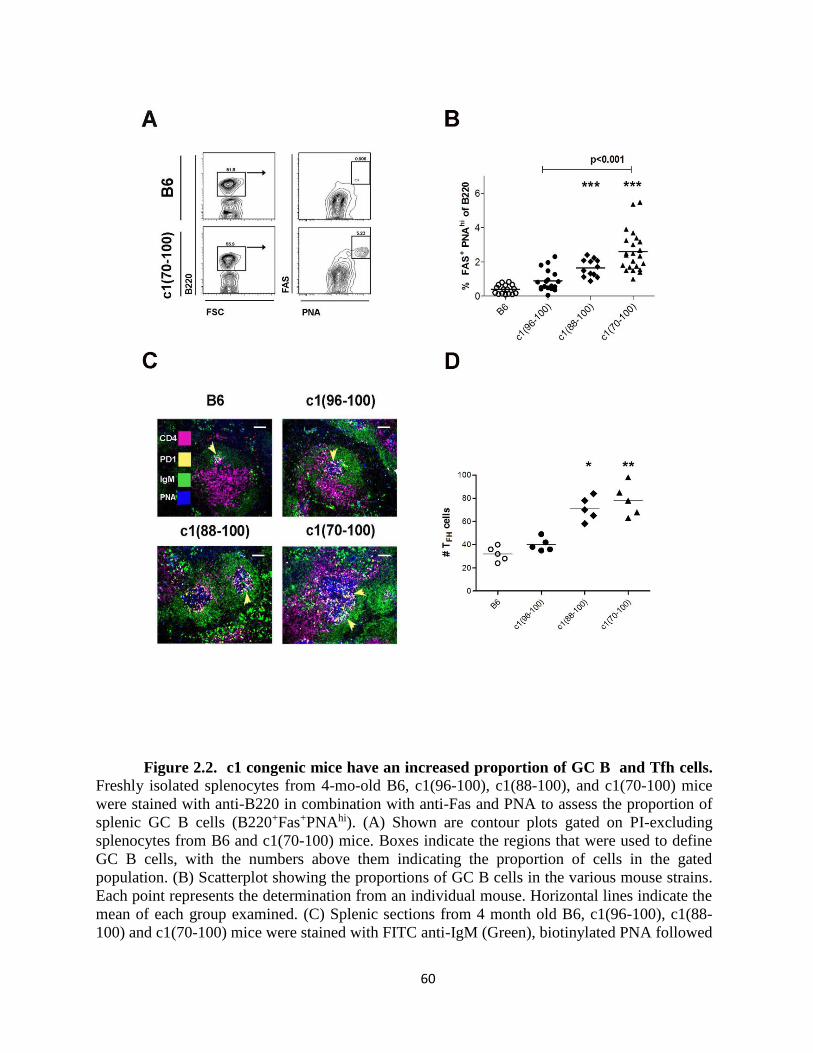
60
Figure 2.2. c1 congenic mice have an increased proportion of GC B and Tfh cells.
Freshly isolated splenocytes from 4-mo-old B6, c1(96-100), c1(88-100), and c1(70-100) mice
were stained with anti-B220 in combination with anti-Fas and PNA to assess the proportion of
splenic GC B cells (B220+Fas+PNAhi). (A) Shown are contour plots gated on PI-excluding
splenocytes from B6 and c1(70-100) mice. Boxes indicate the regions that were used to define
GC B cells, with the numbers above them indicating the proportion of cells in the gated
population. (B) Scatterplot showing the proportions of GC B cells in the various mouse strains.
Each point represents the determination from an individual mouse. Horizontal lines indicate the
mean of each group examined. (C) Splenic sections from 4 month old B6, c1(96-100), c1(88-
100) and c1(70-100) mice were stained with FITC anti-IgM (Green), biotinylated PNA followed
61
by 7-amino-4-methylcoumarin-3-acetic acid-conjugated streptavidin (Blue), PE anti-PD1
(Yellow) and allophycocyanin anti-CD4 (Purple). Arrows indicate the location of Tfh cells
within the germinal center for each mouse strain. Note the increased numbers of Tfh cells
(white dots) distributed throughout the large germinal center in c1(70-100) and to a lesser extent
c1(88-100) mice. Magnification= 10. The scale bar indicates 100 µm. (D) Scatter plot
showing the number of Tfh cells within GC. Each point represents the average number of Tfh
cells per GC for an individual mouse, with 5-7 GC being counted per mouse. Horizontal lines
indicate the mean of each group examined. Significance levels were determined by one-way
ANOVA with Dunns’ post-test. The p values for significant differences between B6 and
congenic mouse strains are shown with *p<0.05, **p<0.01, ***p<0.001. Bars with p values
above denote significant differences between congenic strains.
62
To examine the other Th subsets, cytokine-producing CD4+ T cells were quantified by
flow cytometry following stimulation of freshly isolated splenocytes for 4 hrs with PMA and
ionomycin, and intracellular staining for IL-4, IFN-, and IL-17 (Figure 2.3 C). There were no
differences between strains in the proportion of IL-4 producing cells, but a trend to a
progressive increase in IFN- and IL-17 producing T cells with increasing size of the NZB c1
interval was seen (Figure 2.3 D). Similar findings were obtained when CD4+ T cells were
stimulated in-vitro with anti-CD3 and -CD28 Abs, and secretion of various cytokines was
quantified in the supernatants (Figure 2.4). While there was no significant difference between
the mouse strains in the production of IL-2 and IL-4, there was a progressive increase in the
secretion of IFN-, IL-17, and IL-21 that correlated with increasing length of the c1 interval.
To further define the CD4+ T cell populations secreting these cytokines, intra-cellular
cytokine levels were examined in cells stained with anti-CD3, -CD4, -CXCR5, and -PD1 to
permit discrimination between Tfh (CD4+CXCR5hiPD1hi) and conventional CD4+ T cells
(including Th17 and extrafollicular T cells). This revealed that the increase in IL-21 and IFN-
secreting cells observed in c1 mice results from increases in the numbers of both Tfh and
conventional CD4+ T cells that secrete these cytokines (Figures 2.5 A&B), which positively
correlated with the number of NZB genetic loci. A significant proportion of the IL-21 secreting
cells also secreted IFN- (20-40% Tfh, 40-60% conventional), and conversely IFN- secreting
cells also secreted IL-21 (40-60% Tfh, 30-50% conventional), with the proportion of co-
secretors paralleling the length of NZB interval in congenic mice (Figure 2.5A).
The majority of IL-17 secreting cells were seen in the conventional CD4+ T cell
population (Figure 2.5 B), with ~5% of the cells also secreting IFN- and 80% of cells secreting
IL-21 in all mouse strains examined (Figure 2.5A). Consistent with the flow cytometry

63
findings, the majority of IL-17 secreting cells were seen within the T cell zone and the number
of these cells was increased in c1(88-100) and c1(70-100) mice (Figure 2.5 C&D).
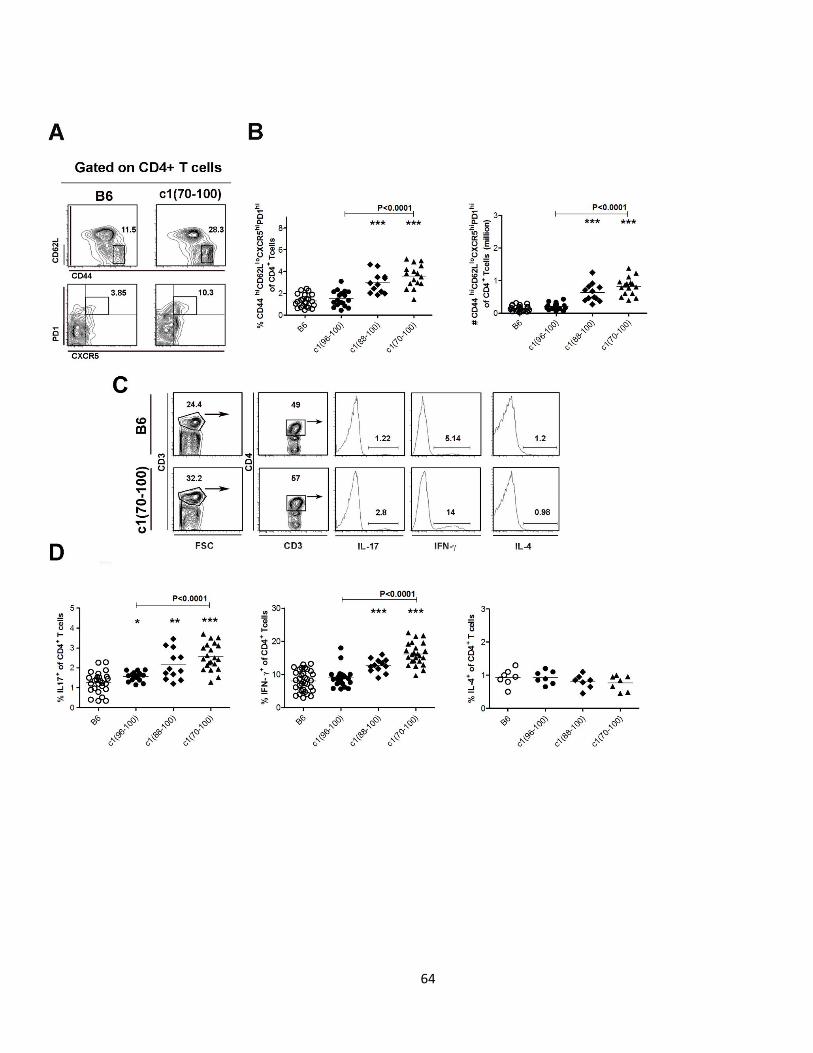
64
65
Figure 2.3. Expansion of Tfh, Th17 and Th1 cell subsets in c1 congenic mice. Splenocytes from 4-mo-old mice were stained to assess the proportion of Tfh
(CD4+CD44hiCD62LloCXCR5hiPD1hi) cells. (A)Representative contour plots from B6 and
c1(70-100) mice. Thick boxes denote the regions that were used to identify Tfh cells. Cells
shown in the right panels were gated on the regions shown in the left panels. (B) Scatter plots
showing the proportion of Tfh cells within the CD4+ T cell subset and absolute number of
splenic Tfh cells. (C) Representative contour plots and histograms from flow cytometry
analysis of IL-17-, IFN-γ-, and IL-4-expressing CD4+ T cells in B6 and c1(70-100) mice.
Splenocytes were stimulated with PMA and ionomycin in the presence of GolgiStop for 4 h,
and then fixed, stained with anti-CD3 and -CD4, permeabilized, and stained with anti-cytokine
Ab. Thick lines outline the regions used to gate CD4+CD3+ T cells. For histograms, the
percentage of cells staining positively for each cytokine is indicated. (D) Scatterplots showing
the percentages of cytokine-producing cells as a proportion of the CD4+ T cell population.
Horizontal lines indicate the mean of each group examined. Significance levels were
determined by one-way ANOVA with Dunns’ post-test. The p values for significant differences
between B6 and congenic mouse strains are shown with **p<0.01, ***p<0.001. Bars with p
values above denote significant differences between congenic strains.
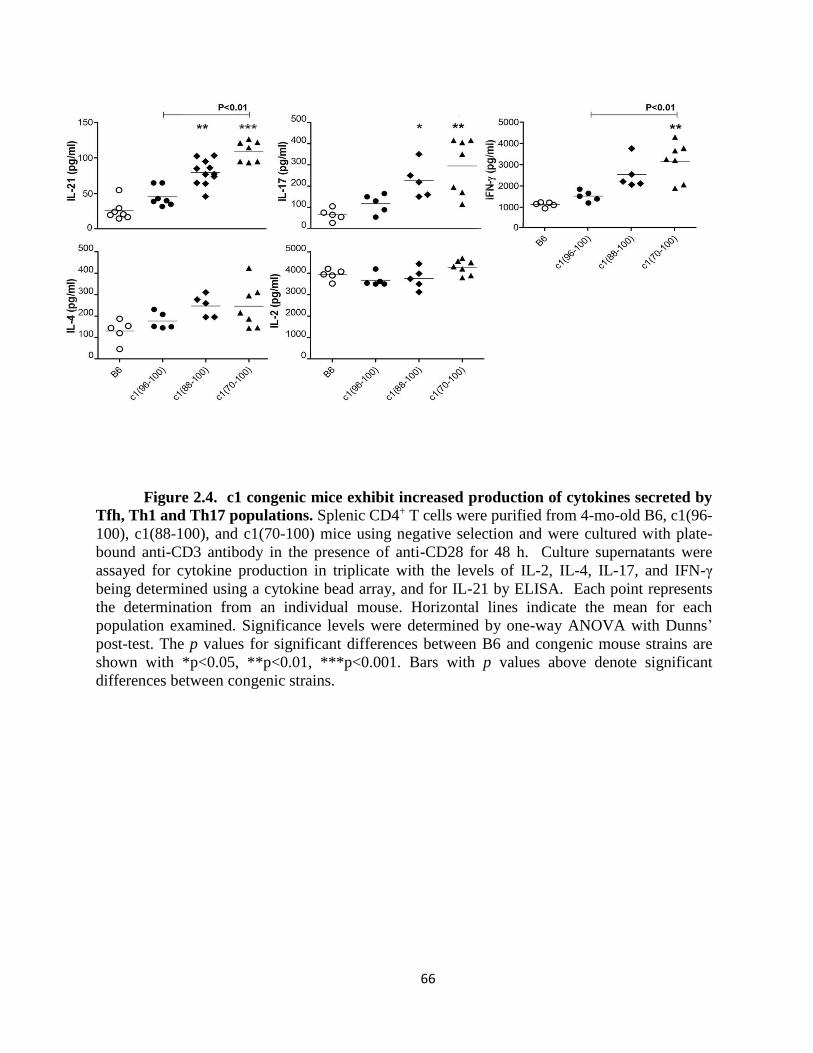
66
Figure 2.4. c1 congenic mice exhibit increased production of cytokines secreted by
Tfh, Th1 and Th17 populations. Splenic CD4+ T cells were purified from 4-mo-old B6, c1(96-
100), c1(88-100), and c1(70-100) mice using negative selection and were cultured with plate-
bound anti-CD3 antibody in the presence of anti-CD28 for 48 h. Culture supernatants were
assayed for cytokine production in triplicate with the levels of IL-2, IL-4, IL-17, and IFN-γ
being determined using a cytokine bead array, and for IL-21 by ELISA. Each point represents
the determination from an individual mouse. Horizontal lines indicate the mean for each
population examined. Significance levels were determined by one-way ANOVA with Dunns’
post-test. The p values for significant differences between B6 and congenic mouse strains are
shown with *p<0.05, **p<0.01, ***p<0.001. Bars with p values above denote significant
differences between congenic strains.
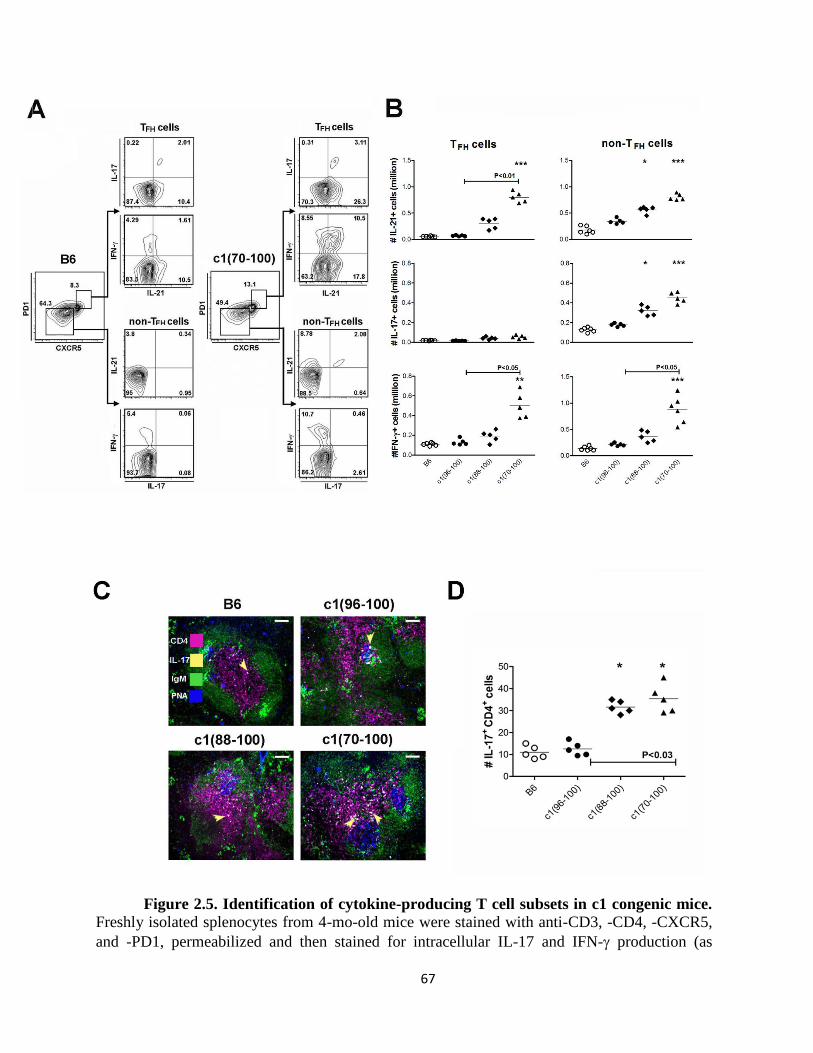
67
Figure 2.5. Identification of cytokine-producing T cell subsets in c1 congenic mice. Freshly isolated splenocytes from 4-mo-old mice were stained with anti-CD3, -CD4, -CXCR5,
and -PD1, permeabilized and then stained for intracellular IL-17 and IFN- production (as
68
described in Figure 2.3) with the addition of IL-21R/Fc chimera to detect IL-21 production. (A)
Representative contour plots gated on CD3+CD4+ T cells from B6 and c1(70-100) mice are
shown on the left for each strain. The regions used to define the Tfh and conventional (non-
Tfh) cells are shown. Numbers indicate the proportion of each cell subset in the gated
population. To the right are contour plots showing representative results for cytokine staining.
The quadrants used to identify positively staining cells are shown. (B) Scatterplots showing the
absolute number of Tfh, and non-Tfh cells producing IL-21 (top), IL-17 (middle), and IFN-
(bottom). Each point represents the determination from an individual mouse. Horizontal lines
indicate the mean for each population examined. (C) Splenic sections from 4-mo-old B6, c1(96-
100), c1(88-00), and c1(70-100) mice were stained with FITC anti-IgM (Green), biotinylated-
PNA followed by 7-amino-4-methylcoumarin-3-acetic acid-conjugated streptavidin (Blue), PE
anti-IL-17 (Yellow) and allophycocyanin anti-CD4 (Purple). Arrows indicate the location of IL-
17 producing CD4+ T cells within T cell areas for each mouse strain. Note that the increased
numbers of IL-17-producing CD4+ T cells (white dots) in c1(70-100) mice are located
predominantly in the T cell zone and not the GC. Magnification = 10. The scale bar indicates
100 µm. (D) Scatter plot showing the number of IL-17-producing CD4+ T cells within the T cell
zone. Each point represents the average number of IL-17-producing cells per T cell zone for an
individual mouse, with 5-7 T cell zones being counted per mouse. Significance levels were
determined by one-way ANOVA with Dunns’ post-test. The p values for significant differences
between B6 and congenic mouse strains are shown with *p<0.05, **p<0.01, ***p<0.001. Bars
with p values above denote significant differences between congenic strains.
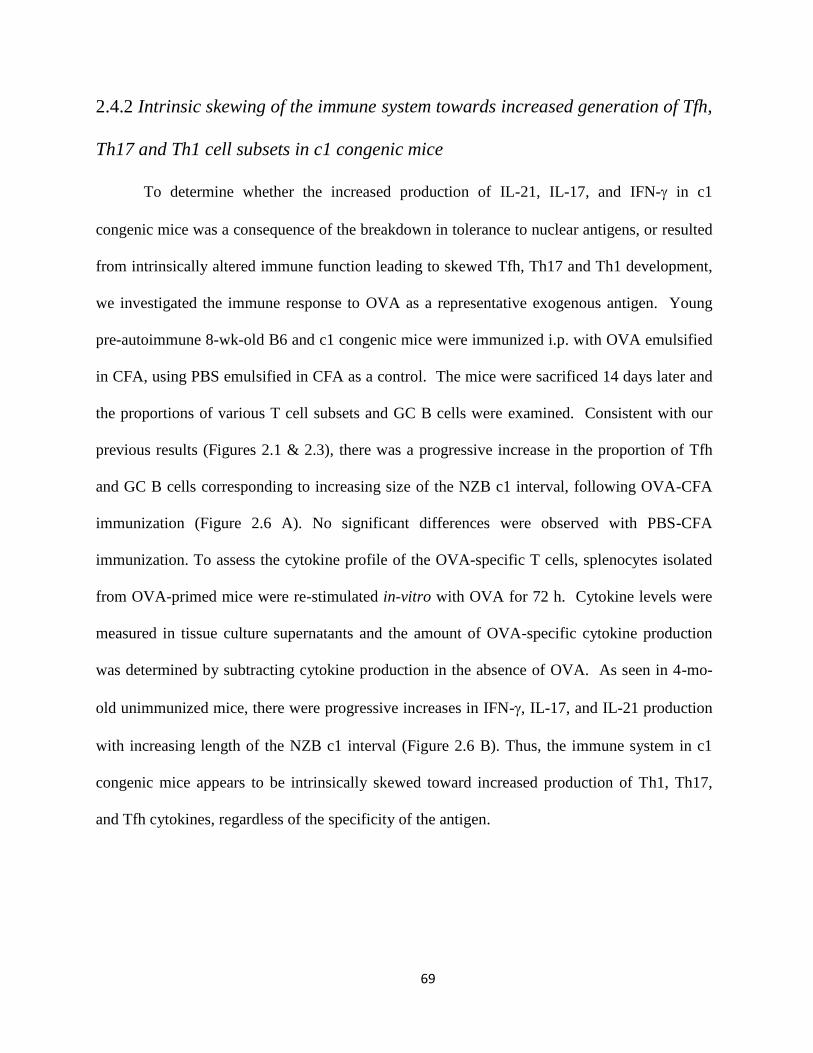
69
2.4.2 Intrinsic skewing of the immune system towards increased generation of Tfh,
Th17 and Th1 cell subsets in c1 congenic mice
To determine whether the increased production of IL-21, IL-17, and IFN- in c1
congenic mice was a consequence of the breakdown in tolerance to nuclear antigens, or resulted
from intrinsically altered immune function leading to skewed Tfh, Th17 and Th1 development,
we investigated the immune response to OVA as a representative exogenous antigen. Young
pre-autoimmune 8-wk-old B6 and c1 congenic mice were immunized i.p. with OVA emulsified
in CFA, using PBS emulsified in CFA as a control. The mice were sacrificed 14 days later and
the proportions of various T cell subsets and GC B cells were examined. Consistent with our
previous results (Figures 2.1 & 2.3), there was a progressive increase in the proportion of Tfh
and GC B cells corresponding to increasing size of the NZB c1 interval, following OVA-CFA
immunization (Figure 2.6 A). No significant differences were observed with PBS-CFA
immunization. To assess the cytokine profile of the OVA-specific T cells, splenocytes isolated
from OVA-primed mice were re-stimulated in-vitro with OVA for 72 h. Cytokine levels were
measured in tissue culture supernatants and the amount of OVA-specific cytokine production
was determined by subtracting cytokine production in the absence of OVA. As seen in 4-mo-
old unimmunized mice, there were progressive increases in IFN-, IL-17, and IL-21 production
with increasing length of the NZB c1 interval (Figure 2.6 B). Thus, the immune system in c1
congenic mice appears to be intrinsically skewed toward increased production of Th1, Th17,
and Tfh cytokines, regardless of the specificity of the antigen.
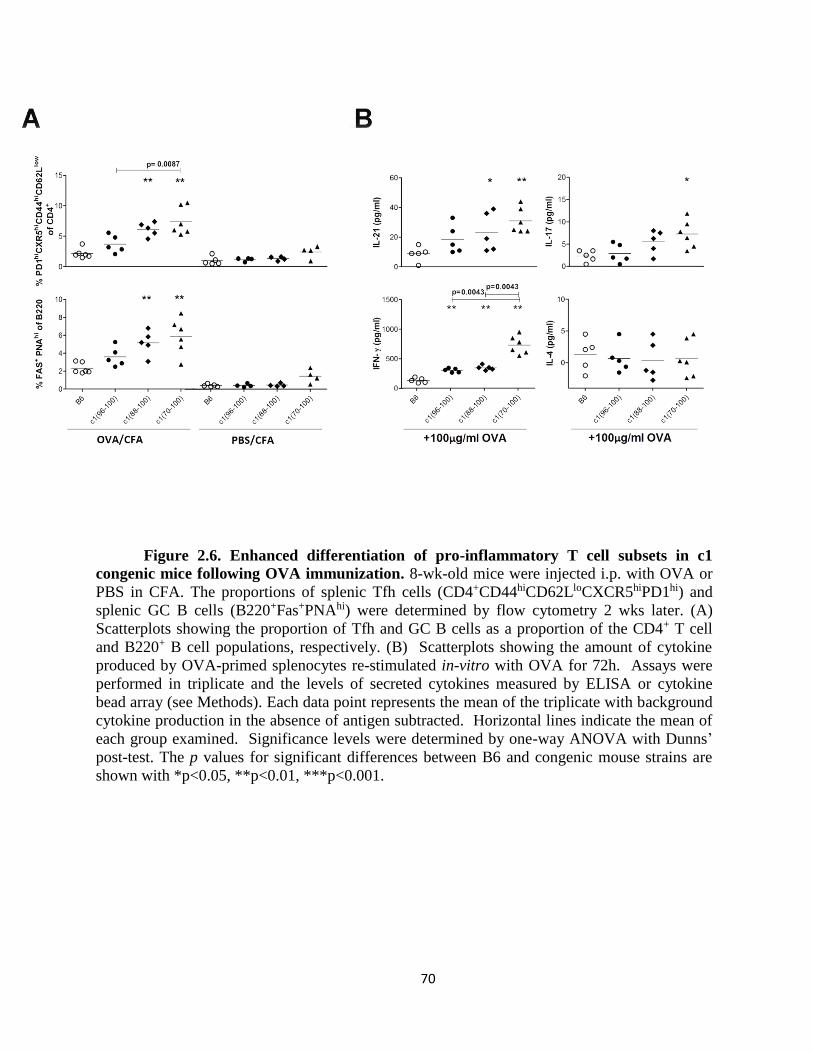
70
Figure 2.6. Enhanced differentiation of pro-inflammatory T cell subsets in c1
congenic mice following OVA immunization. 8-wk-old mice were injected i.p. with OVA or
PBS in CFA. The proportions of splenic Tfh cells (CD4+CD44hiCD62LloCXCR5hiPD1hi) and
splenic GC B cells (B220+Fas+PNAhi) were determined by flow cytometry 2 wks later. (A)
Scatterplots showing the proportion of Tfh and GC B cells as a proportion of the CD4+ T cell
and B220+ B cell populations, respectively. (B) Scatterplots showing the amount of cytokine
produced by OVA-primed splenocytes re-stimulated in-vitro with OVA for 72h. Assays were
performed in triplicate and the levels of secreted cytokines measured by ELISA or cytokine
bead array (see Methods). Each data point represents the mean of the triplicate with background
cytokine production in the absence of antigen subtracted. Horizontal lines indicate the mean of
each group examined. Significance levels were determined by one-way ANOVA with Dunns’
post-test. The p values for significant differences between B6 and congenic mouse strains are
shown with *p<0.05, **p<0.01, ***p<0.001.
71
2.4.3 Altered T cell differentiation in c1 congenic mice results from defects
affecting T and non-T cell function
To determine the immune defects that lead to the increased differentiation of CD4+ T
cells into Th1, Th17 and Tfh cells in c1 congenic mice, several approaches were used. In the
first approach, naïve T cells from the spleens of 8-wk-old pre-autoimmune mice were isolated
and induced to differentiate into various T cell subsets using cocktails of cytokines and mAbs
(see Materials and Methods). Under Th0 conditions there was minimal differentiation of either
B6 or c1 congenic T cells into IL-21- (< 0.21 %), IL-17- (<0.12%), IFN-- (<0.82%), or IL-4-
(<0.41%) secreting cells with similar levels seen for all mouse strains (Figure 2.7 A). In
contrast, under Th1-inducing conditions, all c1 congenic mice demonstrated increased
differentiation to IFN--secreting cells compared to B6 mice (Figure 2.7 B), suggesting that a
genetic locus in the NZB c1 96-100 cM interval promotes differentiation of this cell subset.
Using Th17-inducing conditions, both c1(88-100) and c1(70-100) naïve T cells demonstrated
equivalently increased differentiation to IL-17-producing cells compared to B6 or c1(96-100) T
cells. Thus, a genetic locus located within the NZB c1 88-96 interval alters T cell function to
promote IL-17 secretion. In contrast, similar proportions of Th2 and IL-21-producing cells were
seen for all mouse strains tested under their respective cytokine inducing conditions, suggesting
that the increased proportions of IL-21 producing cells seen in-vivo in c1 congenic mice do not
arise from a T cell functional defect.
72
Figure 2.7. Increased differentiation of naïve CD4+ T cells from c1 congenic mice to
Th17 and Th1 cells in-vitro. Naïve T cells from 8-wk-old mice were stimulated under Th0,
Th1, Th2, Th17, and IL-21-producing polarizing conditions and cytokine production quantified
5 days later by flow cytometry (see Methods). (A) Representative contour plots gated on
CD3+CD4+ T cells from B6 and c1(70-100) mice. For each polarizing condition, plots for
relevant cytokine production under Th0 conditions (-) and polarizing conditions (+) are shown.
The quadrants used to define positively and negatively staining cells are indicated. (B)
Scatterplots showing the percentage of T cells that are IL-21-producing (Tfh), Th17, Th1 and
Th2 cells, under relevant polarizing conditions. Horizontal lines indicate the mean for each
population examined. Significance levels were determined by one-way ANOVA with Dunns’
post-test. The p values for significant differences between B6 and congenic mouse strains are
shown with *p<0.05, **p<0.01, ***p<0.001. Bars with p values above denote significant
differences between congenic strains.
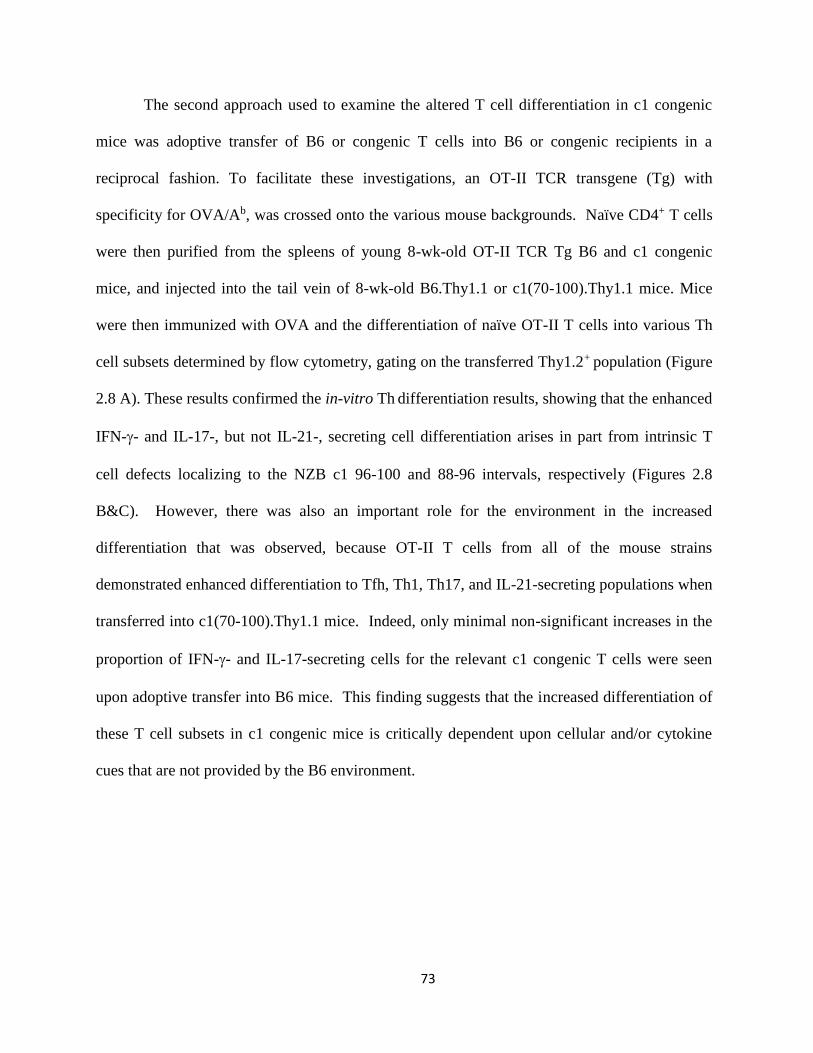
73
The second approach used to examine the altered T cell differentiation in c1 congenic
mice was adoptive transfer of B6 or congenic T cells into B6 or congenic recipients in a
reciprocal fashion. To facilitate these investigations, an OT-II TCR transgene (Tg) with
specificity for OVA/Ab, was crossed onto the various mouse backgrounds. Naïve CD4+ T cells
were then purified from the spleens of young 8-wk-old OT-II TCR Tg B6 and c1 congenic
mice, and injected into the tail vein of 8-wk-old B6.Thy1.1 or c1(70-100).Thy1.1 mice. Mice
were then immunized with OVA and the differentiation of naïve OT-II T cells into various Th
cell subsets determined by flow cytometry, gating on the transferred Thy1.2+ population (Figure
2.8 A). These results confirmed the in-vitro Th differentiation results, showing that the enhanced
IFN-- and IL-17-, but not IL-21-, secreting cell differentiation arises in part from intrinsic T
cell defects localizing to the NZB c1 96-100 and 88-96 intervals, respectively (Figures 2.8
B&C). However, there was also an important role for the environment in the increased
differentiation that was observed, because OT-II T cells from all of the mouse strains
demonstrated enhanced differentiation to Tfh, Th1, Th17, and IL-21-secreting populations when
transferred into c1(70-100).Thy1.1 mice. Indeed, only minimal non-significant increases in the
proportion of IFN-- and IL-17-secreting cells for the relevant c1 congenic T cells were seen
upon adoptive transfer into B6 mice. This finding suggests that the increased differentiation of
these T cell subsets in c1 congenic mice is critically dependent upon cellular and/or cytokine
cues that are not provided by the B6 environment.
74
75
Figure 2.8. Intrinsic T cell functional defects together with altered environmental
cues promote the enhanced differentiation of OVA-specific T cell subsets in congenic mice. Naïve T cells from OT-II TCR Tg mice were transferred into pre-autoimmune B6.Thy1.1 or
c1(70-100).Thy1.1 mice, that were subsequently immunized with OVA in CFA. Mice were
sacrificed 2 wks later and the proportion of transferred T cells differentiating to various T cell
subsets was examined by flow cytometry. (A) Representative contour plots following transfer of
B6 or c1(70-100) OT-II cells into c1(70-100).Thy1.1 mice. Transferred cells were identified by
staining the splenocytes from recipient mice with anti-Thy1.2 mAb. Tfh cells were identified by
gating on the CD4+CD44hiPD1hiCXCR5hi cells (indicated by boxed regions) within this subset.
Cytokine-producing cells were identified as outlined in Figures 1 and 2, and the Methods.
Scatter plots of the proportion of (B) Tfh and (C) cytokine-producing cells within the
transferred T cell population. The open and closed symbols represent cells transferred into B6 or
c1(70-100) recipient mice. Horizontal lines indicate the mean of each group examined.
Significance levels were determined by one-way ANOVA with Dunns’ post-test. The p values
for significant differences between B6 and congenic mouse strains are shown with *p<0.05.
76
2.4.4 DC from c1(88-100) and c1(70-100) mice demonstrate altered function that
promotes differentiation of pro-inflammatory T cell subsets
Cues from DC play an important role in directing the differentiation of T cells following
Ag challenge. We therefore contrasted the ability of DC from the various strains of mice to
direct the differentiation of OT-II T cells when cultured with low concentrations of OVA in-
vitro. To this end, bone marrow was isolated from 8-12-wk-old B6 and c1 congenic mice and
cultured with FLT3L for 7 days to expand DC. This yielded bone marrow DC (BMDC) that
were ~25% plasmacytoid DC (pDC) and ~30% myeloid DC (mDC) with the remaining cells
having an indeterminate phenotype. Similar proportions and numbers of DC were seen for all
strains. The BMDC were then co-cultured with OVA 323-339 peptide and OT-II T cells from
B6 or c1 congenic mice for 4 days in the presence of GM-CSF. As shown in Figure 2.10A,
BMDC from c1(70-100) mice demonstrated a significantly enhanced ability to induce
differentiation of Th1 cells compared to those from B6 and c1(96-100) mice, and similar non-
significant trends were seen for c1(88-100) mice and for Th17 and Tfh cell differentiation. For
Th1 cells this increased induction was only seen for OT-II cells from the congenic mouse
strains, indicating that T cell and DC defects must interact with each other to induce this
phenotype. Similar findings were observed for Th17 cells, where differences between induction
of Th17 differentiation by B6 and c1(88-100) or c1(70-100) DC were most pronounced for
c1(88-100) and c1(70-100) T cells. Thus, BMDC from congenic mice appear to be able to
direct differentiation of T cells in a way that is compatible with the altered differentiation that is
observed in-vivo. Experiments using BMDC expanded with GM-CSF or whole splenocytes
(Figure 2.9 A) as antigen-presenting cells yielded very similar results for comparison of B6 and
c1(70-100) cells.
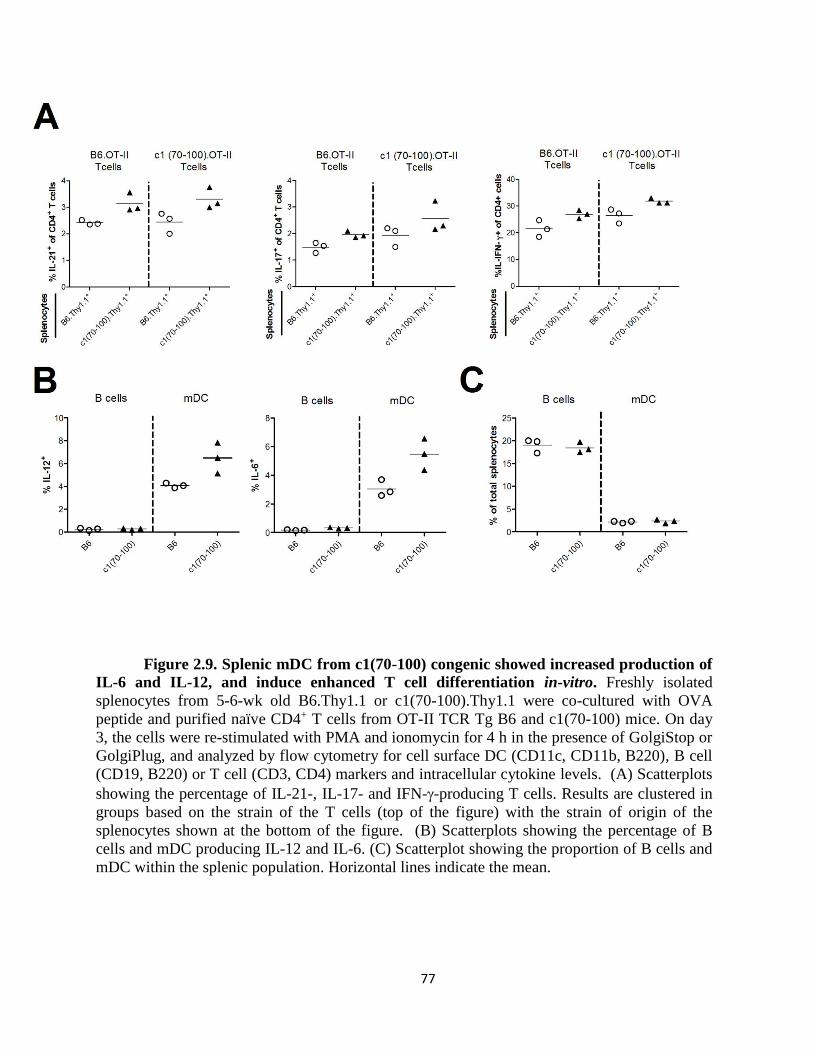
77
Figure 2.9. Splenic mDC from c1(70-100) congenic showed increased production of
IL-6 and IL-12, and induce enhanced T cell differentiation in-vitro. Freshly isolated
splenocytes from 5-6-wk old B6.Thy1.1 or c1(70-100).Thy1.1 were co-cultured with OVA
peptide and purified naïve CD4+ T cells from OT-II TCR Tg B6 and c1(70-100) mice. On day
3, the cells were re-stimulated with PMA and ionomycin for 4 h in the presence of GolgiStop or
GolgiPlug, and analyzed by flow cytometry for cell surface DC (CD11c, CD11b, B220), B cell
(CD19, B220) or T cell (CD3, CD4) markers and intracellular cytokine levels. (A) Scatterplots
showing the percentage of IL-21-, IL-17- and IFN--producing T cells. Results are clustered in
groups based on the strain of the T cells (top of the figure) with the strain of origin of the
splenocytes shown at the bottom of the figure. (B) Scatterplots showing the percentage of B
cells and mDC producing IL-12 and IL-6. (C) Scatterplot showing the proportion of B cells and
mDC within the splenic population. Horizontal lines indicate the mean.
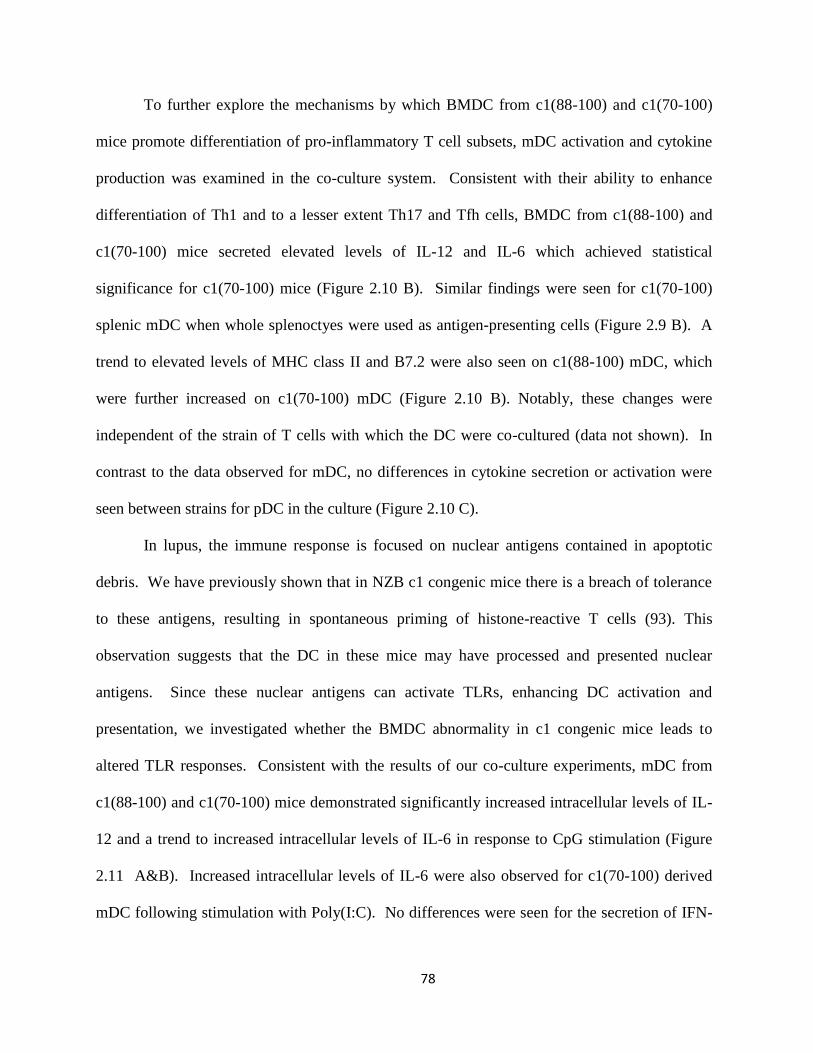
78
To further explore the mechanisms by which BMDC from c1(88-100) and c1(70-100)
mice promote differentiation of pro-inflammatory T cell subsets, mDC activation and cytokine
production was examined in the co-culture system. Consistent with their ability to enhance
differentiation of Th1 and to a lesser extent Th17 and Tfh cells, BMDC from c1(88-100) and
c1(70-100) mice secreted elevated levels of IL-12 and IL-6 which achieved statistical
significance for c1(70-100) mice (Figure 2.10 B). Similar findings were seen for c1(70-100)
splenic mDC when whole splenoctyes were used as antigen-presenting cells (Figure 2.9 B). A
trend to elevated levels of MHC class II and B7.2 were also seen on c1(88-100) mDC, which
were further increased on c1(70-100) mDC (Figure 2.10 B). Notably, these changes were
independent of the strain of T cells with which the DC were co-cultured (data not shown). In
contrast to the data observed for mDC, no differences in cytokine secretion or activation were
seen between strains for pDC in the culture (Figure 2.10 C).
In lupus, the immune response is focused on nuclear antigens contained in apoptotic
debris. We have previously shown that in NZB c1 congenic mice there is a breach of tolerance
to these antigens, resulting in spontaneous priming of histone-reactive T cells (93). This
observation suggests that the DC in these mice may have processed and presented nuclear
antigens. Since these nuclear antigens can activate TLRs, enhancing DC activation and
presentation, we investigated whether the BMDC abnormality in c1 congenic mice leads to
altered TLR responses. Consistent with the results of our co-culture experiments, mDC from
c1(88-100) and c1(70-100) mice demonstrated significantly increased intracellular levels of IL-
12 and a trend to increased intracellular levels of IL-6 in response to CpG stimulation (Figure
2.11 A&B). Increased intracellular levels of IL-6 were also observed for c1(70-100) derived
mDC following stimulation with Poly(I:C). No differences were seen for the secretion of IFN-

79
, IL-23 or TNF- (Figure 2.11 C&D), nor were differences seen for MHC-II or B7.2
expression following TLR stimulation (data not shown). These findings indicate that the altered
DC function in c1(88-100) and c1(70-100) mice also affects the response to certain TLR
signals.
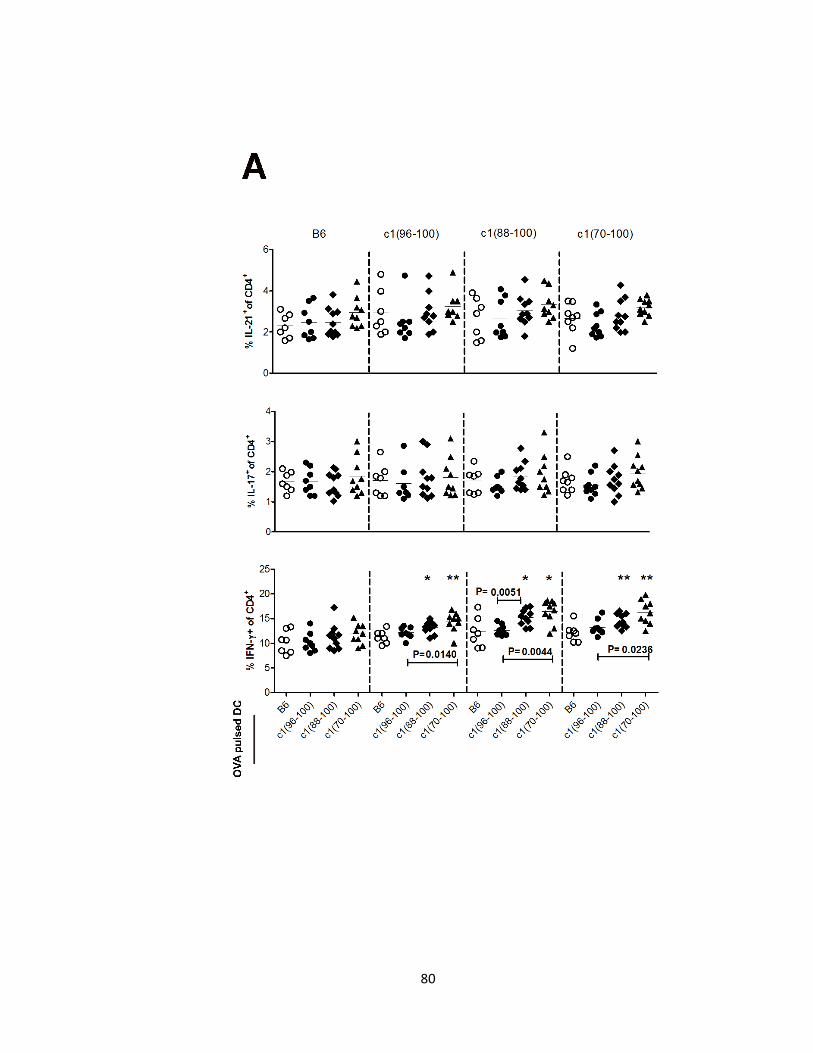
80
81
Figure 2.10. Myeloid DC from c1(88-100) and c1(70-100) mice demonstrate altered
function and an enhanced ability to induce differentiation of Th1 cells. BMDC from 8–12
wk-old mice were expanded with FLT3L for 7 days and then co-cultured with OVA peptide
and purified naïve CD4+ T cells from OT-II TCR Tg mice. On day 4, the cells were re-
stimulated with PMA and ionomycin for 4 h in the presence of GolgiStop or GolgiPlug, and
analyzed by flow cytometry for cell surface DC (CD11c, CD11b, B220, MHC-II, B7.2) or T
cell (CD3, CD4) markers and intracellular cytokine levels. (A) Scatterplots showing the
percentage of IL-21-, IL-17- and IFN--producing T cells. Results are clustered in groups
based on the strain of T cells (top of the figure) with the DC strain shown at the bottom of the
figure. Scatterplots showing the percentage of CD11c+CD11b+B220− mDC (B) and
CD11c+CD11b-B220+ pDC (C) expressing elevated levels of MHCII and B7.2, or IL-6 and IL-
12. Results with the different strains of T cells have been pooled as no differences were noted
between strains. Horizontal lines indicate the mean. Significance levels were determined by
one-way ANOVA with Dunns’ post-test. The p values for significant differences between B6
and congenic mouse strains are shown with *p<0.05, **p<0.01, ***p<0.001. Bars with p
values above denote significant differences between congenic strains.
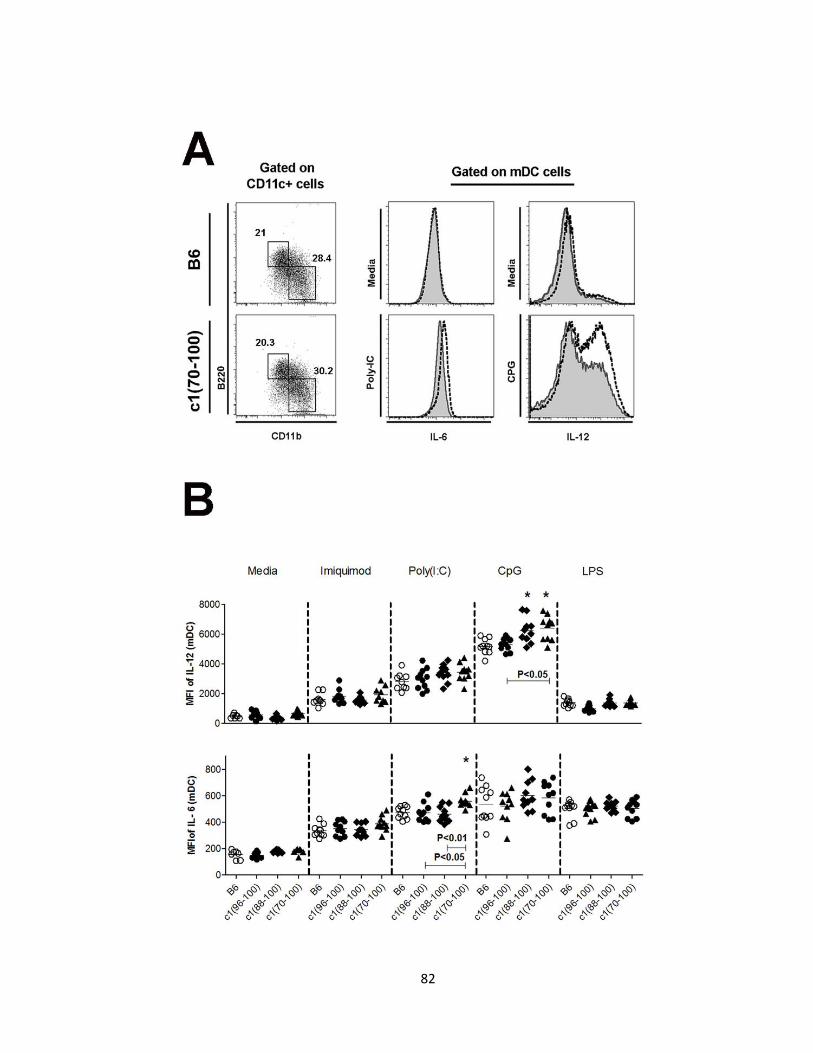
82
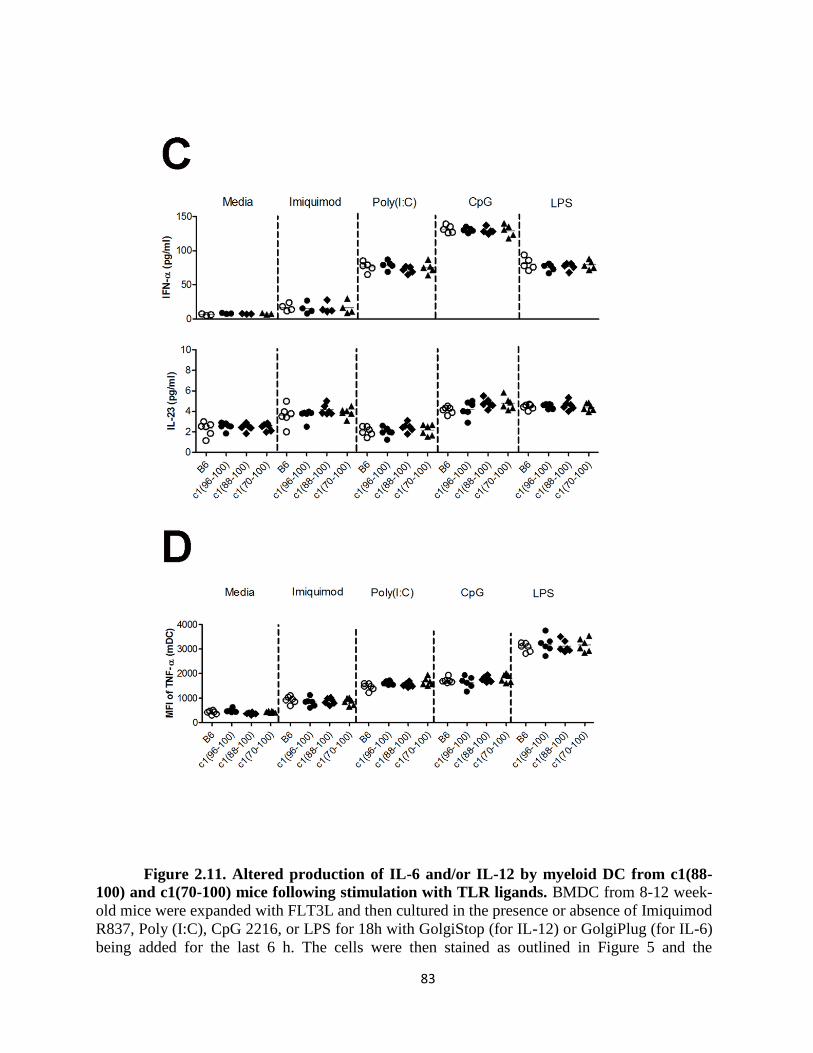
83
Figure 2.11. Altered production of IL-6 and/or IL-12 by myeloid DC from c1(88-
100) and c1(70-100) mice following stimulation with TLR ligands. BMDC from 8-12 week-
old mice were expanded with FLT3L and then cultured in the presence or absence of Imiquimod
R837, Poly (I:C), CpG 2216, or LPS for 18h with GolgiStop (for IL-12) or GolgiPlug (for IL-6)
being added for the last 6 h. The cells were then stained as outlined in Figure 5 and the
84
Methods. (A) Left panel shows representative dot plots indicating the regions used to gate
B220+CD11b- pDC (top left box) and B220-CD11b+ mDC (bottom right box) within the CD11c+
population. Shown to the right are representative histogram plots of IL-6 and IL-12 for B6
(solid grey) and c1(70-100) mice (black line) in unstimulated (Media) and stimulated (Poly
(I:C) for IL-6 or CpG 2216 for IL-12) conditions. (B) Scatterplots showing the MFI for IL-6 and
IL-12 expression on mDC. (C) IFN-α and IL-23 levels in the culture supernatants of BMDC as
measured by ELISA. (D) MFI for TNF-α expression in mDC. Horizontal lines indicate the
mean. Significance levels were determined by one-way ANOVA with Dunns’ post-test. The p
values for significant differences between B6 and congenic mouse strains are shown with
*p<0.05, **p<0.01. Bars with p values above denote significant differences between congenic
strains.
85
2.5 Discussion
In this paper, we show that differences in the severity of renal disease that we have
previously published for a series of NZB c1 congenic mouse strains correlate with the
expansion of pro-inflammatory T cell subsets including, Th1, Th17, and Tfh cells. These
findings are compatible with previous work suggesting that these cells populations drive
pathogenic autoantibody production and/or inflammatory changes in the kidney (207, 217, 232,
237).
Mice with the shortest NZB c1 interval, c1(96-100), showed no evidence of Tfh cell
expansion. Consistent with the lack of Tfh cell expansion, the major increase in cytokine
production in these mice appeared to arise from the conventional T cell subset, where slight
increases in the number of IFN-, IL-17, and IL-21 secreting cells were seen. In contrast,
c1(88-100) mice demonstrated significant increases in Tfh and IFN--, IL-17-, and IL-21-
producing T cells. While our experiments do not allow us to definitively conclude which
expanded cell populations are driving the increased disease severity in these mice, we have
previously shown that IgG2a Ab and complement are deposited in their kidneys (94),
implicating IFN--producing T cells in this process. However, it is likely that Tfh also play a
role, since we have shown that CD40L is necessary for production of GC and nephritis in NZB
and c1 mice ((241) and unpublished observations). Notably, the Tfh cells in c1(88-100) mice
do not produce significant amounts of IL-17. This finding contrasts with those observed in
BXD2 lupus-prone mice, where substantial numbers of IL-17-producing Tfh cells were seen
and introduction of an IL-17R knockout attenuated disease (232).
86
Although c1(70-100) mice showed trends to increased numbers and/or proportions of
IFN--, IL-17-, and IL-21-secreting cells compared to c1(88-100) mice, the most marked
differences were for IL-21-secreting cells, particularly those that also secreted IFN- (data not
shown). Since the severity of renal disease in our mice is closely associated with IgG
deposition in the kidney (94), it is likely that these changes augment kidney disease through
enhanced selection of pathogenic IgG in the GC. Nevertheless, we cannot exclude a possible
role for the IFN- or IL-17-producing cells in either providing extra-follicular T cell help or
directly impacting inflammation in the kidney in these mice. In keeping with the latter
possibility, both IFN-- and IL-17-secreting cells have been found infiltrating the kidneys of
c1(70-100) mice (unpublished observations).
Experiments in young pre-autoimmune mice immunized with a representative foreign
antigen recapitulated the same types of pro-inflammatory cell expansions as seen in older mice.
Using various approaches it was demonstrated that alterations in both T cell and DC function
contribute to the changes observed. Enhanced differentiation of naïve T cells to IFN--
producing cells was localized to the NZB c1 96-100 interval. Although the genetic
polymorphism leading to this altered differentiation has not been definitively identified, it is
likely that it arises from polymorphisms in the Slam family. The NZB c1 96-100 interval
overlaps with the region containing the Sle1b lupus susceptibility allele identified in NZM2410
mice. NZB, NZM2410, and a variety of other autoimmune mouse strains share the same Slam
allele which differs from that of B6 mice at genetic loci for multiple Slam family members. The
top candidate gene in this interval is Ly108, which encodes a self-ligating membrane
glycoprotein that has at least three alternatively spliced isoforms differing in their cytoplasmic
domains (84, 114, 242). In autoimmune mouse strains, expression of Ly108-1 is increased,
87
whereas Ly108-2 expression is decreased and Ly108-H1 is absent (84, 86). Since stimulation
with anti-Ly108 antibody induces T cell IFN- secretion, it is possible that increased expression
of the Ly108-1 variant in c1(96-100) T cells leads to enhanced differentiation to IFN--
producing cells (243). Alternatively, the absence of Ly108-H1 expression could produce this
phenotype, since introduction of a BAC Ly108-H1 transgene onto mice lacking this isoform
was associated with reduced numbers of IFN--producing CD4+ T cells in-vivo (86). Recently,
B6.Sle1b mice were found to have an expansion of Tfh cells that was first detectable at 6-8
months of age (a time point 2 months later than the mice examined in our study) and that could
be corrected with the Ly108-H1 transgene (244). Since c1(96-100) also lack the Ly108-H1
isoform (our own unpublished observations), the findings reported herein suggest that this
expansion does not arise from an intrinsic T cell functional defect.
A second T cell functional change, leading to increased generation of IL-17-producing T
cells, appeared to require the NZB c1 88-96 interval. It is currently unknown whether this
functional change arises solely from genetic polymorphisms located within the c1 88-96 interval
or results from interaction between polymorphisms in the c1 96-100 and 88-96 intervals.
Candidate genes within the 88-96 interval include: the retinoid X receptor gamma (Rxrg), a
member of the RXR family of nuclear receptors which have been shown to modify the balance
between Th1 and Th2 cells (245-247); and Pre-B cell leukemia homeobox 1 (Pbx1) that has also
been shown to influence T cell differentiation. Recently, increased T cell expression of a novel
splice isoform of this gene, Pbx1-d, was found in B6 congenic mice with the Sle1a lupus
susceptibility locus (83).
Despite the presence of intrinsic T cell functional abnormalities in c1 congenic mice,
this does not appear to be sufficient to induce altered spontaneous T cell differentiation in vivo,

88
pointing to a critical role of environmental cues in the induction of the abnormal differentiation
of T cells in c1(88-100) and c1(70-100) mice. Nevertheless, T cell abnormalities also appear to
be essential, as B6 T cells did not differentiate efficiently to IFN-- or IL-17-producing cells
following adoptive transfer into c1(70-100) mice in-vivo. Our experiments suggest that altered
DC function provides one of the environmental cues that enhances pro-inflammatory T cell
differentiation in c1(88-100) and c1(70-100) mice. DC from c1(70-100), and to a lesser extent
c1(88-100), mice demonstrated enhanced production of IL-12 which has been shown to promote
differentiation of naïve T cells to Th1 and Tfh phenotypes (248-250) and increased levels of IL-
6 which has been shown to promote differentiation of naïve T cells to Th17 and Tfh phenotypes
(211, 225, 251, 252). Following these initial interactions, IL-21 production by activated Th17
and Tfh cells could act in an autocrine manner to further direct DC-primed CD4+ T cells to
become Th17 and Tfh cells (226, 228, 253), resulting in a positive feedback loop. It is likely
that the enhanced ability of mDC from c1(70-100) and, to a lesser extent, c1(88-100) mice to
upregulate MHC class II and B7.2 in response to T-DC interaction further augments the
differentiation of pro-inflammatory T cell subsets in these mice.
In summary, we demonstrate that T cell and DC defects, derived from several genetic
loci, synergize to convert preclinical disease to fatal GN by leading to expansion of pro-
inflammatory T cells. This data joins an increasing body of data from the study of congenic
mouse strains demonstrating that impact of individual genetic loci on immune function and
autoimmunity is highly dependent upon their genetic/immunologic context (182, 254-256).
These studies have important implications for the study of human autoimmune disease, in that
they provide an explanation for how the presence of a susceptibility locus in the family
members of a patient with autoimmune disease can be compatible with relatively normal

89
immune function, whereas the same locus in the patient leads to profoundly altered immune
function. Thus, the identification of individuals with an increased likelihood of developing
autoimmune disease must necessarily involve characterization of multiple interacting genetic
loci.

90
91
Chapter 3
Identification of the SLAM Adapter Molecule EAT-2 as a Lupus
Susceptibility Gene that Acts through Impaired Negative Regulation of
Dendritic Cell Signaling
Nafiseh Talaei*,†, Tao Yu‡, Kieran Manion*,†, Rod Bremner‡,§, and Joan E. Wither*,†,¶
*Arthritis Centre of Excellence, Toronto Western Research Institute, University Health
Network, Toronto, Ontario; ‡Lunenfeld Tanenbaum Research Institute, Mount Sinai Hospital,
Toronto, Ontario; and Departments of †Immunology, §Laboratory Medicine and Pathology, and
¶Medicine, University of Toronto, Toronto, Ontario
All experiments were performed by N. Talaei . T. Yu assisted in generation of results for Figure 3.1 E,
K. Manion provided help with mouse breeding and the bone marrow isolations.
Published in J Immunol. November 2015, 195(10), 4623-31 © Copyright 2015. J Immunol
92
3.1 Abstract
We have previously shown that C57BL/6 congenic mice with an introgressed
homozygous 70-100 cM chromosome 1 interval (c1(70-100)) from the lupus-prone New
Zealand Black (NZB) mouse, develop high titres of antinuclear antibodies and severe
glomerulonephritis. Using sub-congenic mice, we found that a genetic locus in the 88-96 cM
region was associated with altered dendritic cell (DC) function and synergized with T cell
functional defects to promote expansion of pathogenic pro-inflammatory T cell subsets. Here
we show that the promoter region of the NZB gene, encoding the SLAM signaling pathway
adapter molecule EAT-2, is polymorphic and that this results in a ~70% reduction in EAT-2 in
DCs. Silencing of the EAT-2 gene in DCs that lacked this polymorphism led to increased
production of IL-12 and enhanced differentiation of T cells to a Th1 phenotype in T cell - DC
co-cultures, reproducing the phenotype observed for c1(70-100) DC. SLAM signaling has been
previously shown to inhibit production of IL-12 by CD40L-activated DCs. Consistent with a
role for EAT-2 in this inhibition, knock-down of EAT-2 resulted in increased production of IL-
12 by CD40-stimulated DCs. Assessment of downstream signaling following CD40
crosslinking in the presence or absence of SLAM crosslinking revealed that SLAM co-
engagement blocked activation of p38 MAP Kinase and JNK signaling pathways in DCs, which
was reversed in DCs with the NZB EAT-2 allele. We conclude that EAT-2 negatively regulates
cytokine production in DCs downstream of SLAM engagement and that a genetic
polymorphism that disturbs this process promotes the development of lupus.
93
3.2 Introduction
SLE is a complex genetic disease in which multiple susceptibility loci interact with each
other to produce the autoimmune phenotype (257). Given the outbred nature of the human
population, investigation of mouse strains that spontaneously develop a lupus-like illness, where
genetic regions containing susceptibility loci can be isolated for study by crossing them onto a
non-autoimmune background, have played an important role in the identification of genetic
polymorphisms and immune abnormalities that lead to lupus, together with how they interact to
promote disease development (6, 67).
Studies in our laboratory have focused on the New Zealand Black (NZB) mouse that
develops a lupus-like disease characterized by production of anti-ssDNA and –RBC antibodies
(Abs), leading to hemolytic anemia and mild glomerulonephritis (GN) (8, 74). To identify the
immune mechanisms leading to disease in these mice, we produced and characterized a series of
C57BL/6 (B6) congenic mouse strains with homozygous intervals containing susceptibility loci
derived from this mouse strain. In previous work, we showed that mice with an NZB interval
extending from 70 cM (125.6 Mb) to 100 cM (179.8 Mb) on chromosome 1 (c1(70-100))
developed a severe lupus phenotype, with fatal GN developing in 40% of animals by 8 months
of age (94). By examining sub-congenic mice with shorter overlapping intervals, we found that
at least 3 genetic loci were required to produce this phenotype (94). Congenic mice with the
shortest NZB interval, extending from 96 to 100 cM (170.8-179.8 Mb; c1(96-100)) and
containing the polymorphic SLAM locus, had mild subclinical autoimmunity characterized by
production of anti-ssDNA Abs in the absence of anti-dsDNA Abs or kidney disease. In contrast,
mice with longer NZB intervals demonstrated a progressive increase in the levels of anti-
dsDNA Abs and the severity of renal disease that paralleled the size of the NZB interval.
94
Further investigation of the immune mechanisms accompanying this increase in disease severity
revealed the presence of intrinsic T cell and dendritic cell (DC) functional abnormalities that led
to enhanced expansion of pro-inflammatory T cell subsets, including Th1, Th17 and T follicular
helper (TFH) cells (258).
In this study, we sought to identify the genetic polymorphism that leads to altered DC
function in NZB c1 congenic mice. We have previously shown that the gene leading to this
altered function is localized to the 88-96 cM interval and that it leads to increased production of
IL-12 and IL-6 by bone marrow-derived dendritic cells (BMDC) in T cell – DC co-culture
experiments in vitro (258). Here we show that there is a promoter polymorphism in NZB mice
that leads to reduced levels of the SLAM adapter molecule EWS-activated transcript 2 (EAT-2,
also called sh2d1b1) within the 88-96 interval, and that knockdown of EAT-2 in BMDC of mice
that lack this polymorphism reproduces the altered DC phenotype. We further demonstrate that
BMDC from mice with the NZB polymorphism or that have EAT-2 knocked down produce
increased amounts of cytokines in response to CD40 crosslinking and that EAT-2 plays an
important role in the negative regulation of CD40 signaling following SLAM engagement.
95
3.3 Materials and Methods
3.3.1 Ethics statement
Mice were housed in a Canadian Council on Animal Care approved facility at the
Toronto Western Research Institute, part of the University Health Network. All mice used and
experiments performed in this study were approved by the Animal Care Committee of the
University Health Network (Animal Use Protocol #123).
3.3.2 Mice
B6 mice were purchased from Taconic (Germantown, NY). B6.OT-II TCR transgenic
(Tg) mice were originally obtained from The Jackson Laboratory (Bar Harbor, ME) and then
bred in our facility. Congenic mouse strains with homozygous NZB chromosome 1 intervals of
varying length were generated as previously described (94). OT-II TCR Tg congenic mice were
produced by polymorphic marker assisted backcrossing. Only female mice were examined and
all mice were specific-pathogen free.
3.3.3 Flow cytometry
RBC-depleted splenocytes (0.5 x 10⁶) were incubated with mouse IgG (Sigma-Aldrich,
St. Louis, MO) for 15 min and then stained with various combinations of directly-conjugated
mAbs followed by allophycocyanin- or PerCP-Cy5.5-conjugated streptavidin (BD Biosciences
(San Diego, CA) and BioLegend (San Diego, CA), respectively). Dead cells were excluded by
staining with 0.6 μg/ml propidium iodide (PI, Sigma-Aldrich). Events were acquired using a
LSR II instrument (BD Biosciences) and analyzed using FlowJo software (Tree Star Inc.,
Ashland, OR). The following directly conjugated mAbs were purchased from BD Biosciences
96
or BioLegend: Biotin-conjugated anti-CD4 (RM4-5), -B220(RA3-6B2), and -CD86 (B7.2;
GL1); PE-conjugated anti-CD44 (IM7), B7.2 (GL1), CD40(3/23), CD84(mCD84.7) and -IA/IE
(M5/114.15.2); PE-Cy7-conjugated anti-CD44 (IM7) and -CD11c (N418); Pacific Blue-
conjugated anti-B220 (RA3-6B2) and -CD4 (RM4-5); PerCP-Cy5.5-conjugated anti-B220
(RA3-6B2); Allophycocyanin-conjugated anti-CD150 (TC15-12F12.2); and FITC-conjugated
anti-CD11b (M1/70), -CD62L (MEL-14). All isotype controls were obtained from BD
Biosciences or BioLegend.
3.3.4 BMDC isolation and expansion
Bone marrow cells were isolated by flushing the femurs of 6–10-wk-old congenic or B6
mice. RBC were lysed and then the cells were re-suspended at 106 cells/mL in complete RPMI
medium (10% FCS + additives) and cultured for 8 days with 40 ng/ml recombinant mouse GM-
CSF (R&D Systems, Minneapolis, MN) to expand BMDC. Non-adherent cells, harvested at day
8, were used for all experiments.
3.3.5 Measurement of EAT-2 mRNA expression in BMDC
RNA was purified from BMDC using a Total RNA Mini Kit (FroggaBio, Toronto, ON,
Canada), and converted to cDNA using a High Capacity cDNA Reverse Transcription Kit
(Applied Biosystems, Forster City, CA). Quantitative real-time PCR (qRT-PCR) was performed
with SYBR Green Master Mix on a 7900HT Fast Real-Time PCR System (Applied Biosystems)
using default cycling conditions. Primer sequences were as follows: β-actin
(TTGCTGACAGGATGCAGAAG, and GTACTTGCGCTCAGGAGGAG); EAT-2
(ATGCTCATACTCCAAGAACGA, and TCAGCTCTAACTCCATTCTTCT). Gene
97
expression was analyzed using the relative standard curve method and was normalized to β-
actin expression.
3.3.6 Promoter sequencing and Luciferase Assay
Genomic DNA was extracted from the kidneys of B6 and NZB mice. Briefly, the tissue
was digested with lysis buffer (100 mM NaCl, 10mM Tris-Hcl, 25 mM EDTA pH=8, 0.5%
Sodium Dodecyl Sulfate, 0.1 mg/ml Proteinase K), extracted with phenol:chloroform:isomyl
alcohol (25:24:1), and the DNA precipitated from the aqueous layer by addition of ammonium
acetate and ethanol. The EAT-2 promoter region extending from -300 base pair (bp) to +159 bp
from the initiation codon was amplified using forward TTAGTGCTGCTGCTCCAGCC and
reverse CCTGCATGAAGATGAGGATAC primers, cloned into a TOPO 2.1 vector
(Invitrogen), and sequenced (ACGT Corp., Toronto, Canada). Reporter constructs were
generated by cloning the EAT-2 promoter region into a firefly luciferase reporter plasmid,
pREP4–Luc (259). 300 bp fragments containing the EAT-2 promoter region were prepared
using forward, AGATCTGATTTTAGTGCTGCTGCTCCA (BglII site underlined) and reverse
GCGGCCGCGGAGGGTTGTTATGTTTAAACCG (NotI site underlined) primers and then
directionally cloned into the BglII/NotI sites of pREP4–Luc to generate EAT-2 reporter
plasmids (pREP4–B6-EAT2–Luc and pREP4–NZB-EAT2–Luc). Correct integration of the
fragments was confirmed by sequencing. BMDC were prepared from 6-8-wk-old B6 mice, as
described above, and 5 106 cells were transfected with 5 μg of EAT-2 reporter plasmid or
pREP4–Luc empty vector (plus 50 ng of a Renilla luciferase plasmid (Promega, USA) as a
control for transfection efficiency) by electroporation using 400 V, 200 µF and 1000 ohms (Bio-
Rad, Hercules, CA). After 24 or 48 h of incubation with GM-CSF (40 ng/ml), the cells were
98
harvested and washed, and extracts were prepared using a Dual Luciferase Assay Kit
(Promega). Luciferase activity was measured by luminometer (PerkinElmer Victor3) and the
results expressed as Firefly luciferase activity normalized to Renilla luciferase activity.
3.3.7 Transfection of BMDC with EAT-2 siRNAs
A total of 5 106 BMDC were electroporated, as above, with siGENOME Non-
Targeting Control siRNAs (scrambled control) or siGENOME SMARTpool Sh2d1b1(EAT-2)
siRNAs (GE Healthcare Dharmacon, Lafayette, CO) at a final concentration of 4 µM. siGLO
Green transfection indicator (100 nM, GE Healthcare Dharmacon) was used to measure the
transfection efficiency. After transfection, cells were incubated in RPMI 1640 containing 20%
FCS plus additives for 24 h. The BMDC were washed before use in subsequent experiments.
3.3.8 In vitro culture of transfected BMDC and OVA-specific T cells
Naïve CD4+ T cells (CD4+CD62Lhi) were isolated from the spleens of 6-12-wk-old B6
or congenic OT-II Tg mice using a mouse CD4+CD62L+ T Cell Isolation Kit (Miltenyi Biotec,
Bergisch Gladbach, Germany). 2 x 10⁵ OT.II naïve CD4+ T cells were then co-cultured with 2 x
104 transfected BMDC and OVA 323-339 peptide (GenScript, Piscataway, NJ) in the presence
of 5 ng/ml recombinant mouse GM-CSF (R&D Systems) for 2 days. Prior to measurement of
intracellular cytokines, PMA (50 ng/ml) and ionomycin (1 g/ml) together with GolgiPlug or
GolgiStop (BD Biosciences) were added for the last 4 h before harvesting. The cells were then
stained for cell surface DC (CD11c, CD11b) or T cell (CD4) markers, fixed, permeabilized, and
stained for detection of intracellular cytokines, as previously described (258). For T cells,
intracellular cytokines were detected using allophycocyanin-anti–IFN- (XMG1.2), Alexa
99
Fluor® 488-anti-IL-17A (TC11-18H10), and PE-anti–IL-21 (mhalx21), all from e-Bioscience.
For DC, intracellular cytokines were detected using allophycocyanin-conjugated anti-IL-12
(C15.6) or Alexa Fluor® 488-conjugated anti-IL-6 (MP5-20F3), both from BD Biosciences. BD
Horizon fixable viability stain 450 (FVS450) was used to exclude dead cells.
3.3.9 Western Blots
BMDC were lysed in RIPA buffer (150mM NaCl, 50mM Tris, 1mM EDTA, 0.5%
sodium deoxycholate, 0.1% SDS), with phenylmethylsulfonyl fluoride and Protease Inhibitor
Cocktail (Santa Cruz Biotechnology Inc, Dallas, TX) added immediately prior to use. Lysates
were incubated on ice for 5 min, centrifuged for 10 min, and then the supernatant harvested.
Protein concentration was determined using a BSA Protein Assay Kit (Thermo Scientific,
Rockford, IL). Samples were then separated by SDS-PAGE and transferred to nitrocellulose
membranes. Membranes were blocked with 5% skim milk and probed with anti-mouse-EAT-2
(Santa Cruz Biotechnology) or anti-mouse--actin (Cell Signaling Technology) for 2 h at room
temperature (RT) or overnight at 4°C. Immunoreactive bands were detected using horseradish
peroxidase–conjugated secondary antibody and visualized using an enhanced chemiluminescent
system (Thermo Fisher scientific, Waltham, MA).
3.3.10 BMDC CD40 stimulation
BMDC (1 106) were stimulated with 10 μg/ml anti-mouse CD40 (3/23, BD
Biosciences) for 24 h, with GolgiPlug or GolgiStop (BD Biosciences) added for the last 4h
before harvesting. The cells were then stained for cell surface DC markers (CD11c, CD11b),
100
fixed, permeabilized, and stained for detection of intracellular cytokines as described
previously.
3.3.11 Phospho-flow
BM-derived DCs (BMDC) (1 106) were resuspended in 200 l RPMI (1% FCS plus
additives) and incubated for 30 min at 4°C in the presence of 5 µg/ml anti-CD150 (TC15-
12F12.2, BioLegend) or anti-CD84 (mCD84.7, BioLegend). After washing to remove unbound
antibody, the cells were warmed to 37°C for 10 min, and incubated for 2 min in the presence or
absence of 10 µg/ml anti-CD40 , and 5 µg/ml goat anti-rat IgG (BioLegend) or goat anti-
Armenian Hamster IgG (Jackson Immunoresearch Labs, West Grove, PA) to crosslink CD150
and CD84, respectively. The cells were then fixed with 2% paraformaldehyde and frozen at -
80°C. Following thawing, the cells were stained to detect cell surface molecules, permeabilized
in 70% methanol, re-suspended in Perm/Wash™ buffer (BD Biosciences), and stained with
antibodies directed against intracellular signaling molecules as follows: PE-anti-phospho (p)-
JNK (pT183/pY185; N9-66) and -p-P38 MAPK (pT180/pY182; 36/p38), all from BD
Biosciences.
3.3.12 Immunoprecipitation
BMDC (1 107) were resuspended in 200 µl RPMI (1% FCS plus additives) and
incubated for 30 min at 4°C in the presence of 5 µg/ml anti-CD150 or anti-CD84. After
washing, the cells were warmed to 37°C for 10 min, and incubated for 2 min with 5 µg/ml goat
anti-rat IgG or goat anti-Armenian Hamster IgG to crosslink CD150 and CD84, respectively.
Lysis buffer was then added to each sample and the lysate pre-cleared by incubation with
101
Protein A/G PLUS-Agarose (Santa Cruz Biotechnology) for 1 h at 4°C. After centrifugation,
the solution was incubated with 5 µg/ml anti-CD150 (BioLegend) or anti-CD84 (BioLegend)
for 4 h or overnight at 4°C, followed by incubation with 20 µL of Protein A/G PLUS-Agarose
for 2 h at 4°C. Immunoprecipitated proteins were then collected by boiling in electrophoresis
sample buffer (Santa Cruz Biotechnology), separated by SDS-PAGE, and transferred to
nitrocellulose membranes. Membranes were blocked with 5% skim milk or 5% BSA and
probed with anti-phosphotyrosine antibody (clone 4G10, EMD Millipore, MA, USA), anti-
CD150, or anti-CD84 antibodies for 2 hours at room temperature or overnight at 4°C.
Immunoreactive bands were visualized as described above.
3.3.13 Statistical analysis
Comparisons of differences between groups of mice for continuous data were performed
using a one-way ANOVA followed by Dunns’ post-test for multiple comparisons or a Mann-
Whitney nonparametric test when two groups were compared. Differences with p values of <
0.05 were considered statistically significant. All statistical analyses were performed using
GraphPad software (La Jolla, CA, USA).
102
3.4 Results
3.4.1 A genetic polymorphism in the promoter region of EAT-2 in NZB c1
congenic mice results in altered expression of EAT-2
Our previous work suggested that there was a lupus susceptibility gene in the 88-96 cM
interval of NZB c1 that acts by altering DC function. Of the 80 genes within this interval, there
are 18 protein coding genes, with EAT-2 being the only gene reported to be expressed in DCs.
As the coding regions of B6 and NZB EAT-2 alleles had been sequenced and did not differ
(260), we investigated whether there were altered levels of expression of EAT-2 in the DCs of
mice with the NZB c1 88-96 cM interval. RNA was isolated from BMDCs following culture in
media containing recombinant GM-CSF for 8 days, and the expression of EAT-2 mRNA was
evaluated using qRT-PCR. As shown in Figure 3.1A, the levels of EAT-2 were reduced by
~70% in BMDC from c1(70-100) and c1(88-100) mice, both of which have NZB c1 intervals
containing the NZB EAT-2 variant, compared to c1(96-100) and B6 mice, which do not.
Western blots confirmed that the protein levels of EAT-2 were similarly reduced in c1(88-100)
and c1(70-100) BMDC (Figure 3.1 B&C).
To determine whether the altered expression of EAT-2 in these mice resulted from a
promoter polymorphism, DNA from B6 and NZB mice was sequenced. This revealed two
mutations in the EAT-2 promoter region of mice with the NZB variant that were just upstream of
the initiation codon. Computational analysis suggested that the mutated regions were potential
binding sites for the transcription factors CREB1 and Klf4, and that the mutations in NZB mice
resulted in disruption of these binding sites (Figure 3.1D).
To confirm that the promoter polymorphism in the NZB EAT-2 gene leads to reduced
gene expression, the B6 and NZB EAT-2 promoter regions were cloned into a luciferase reporter
103
construct (pREP4-Luc) (259). The constructs were then transfected into B6 BMDCs and
luciferase activity was measured. There was significantly reduced luciferase activity with the
construct containing the NZB promoter region compared to the B6-derived EAT-2 promoter
(Figure 3.1 E). Thus, the reduced levels of EAT-2 in c1(88-100) and c1(70-100) mice appear to
arise from a promoter polymorphism that leads to reduced RNA expression in DCs.
3.4.2 Knockdown of EAT-2 in BMDCs from B6 and c1(96-100) mice recapitulates
the c1(70-100) phenotype.
We have previously shown that BMDCs from congenic mice with a NZB 88-96 cM
region demonstrate enhanced secretion of IL-12 and IL-6 when co-cultured with OVA 323-339
peptide and naïve TCR transgenic OT-II OVA-specific T cells, which was associated with
significantly enhanced differentiation of the OT-II cells to Th1 and a trend to increased
generation of Th17 and Tfh cells (258). As shown in Figure 3.2 A, c1(70-100) BMDCs
produced increased amounts of IL-12 in co-culture with T cells from all strains tested, whereas
increased amounts of IL-6 were only produced in co-cultures with c1(96-100) or c1(70-100) T
cells, suggesting that genetic interactions between the NZB loci in the 88-96 and 96-100 regions
augment IL-6 production.
To determine whether knockdown of EAT-2 alters DC function in a way compatible
with these functional changes, siRNAs targeting this gene were introduced into B6 and c1(96-
100) BMDCs, with scrambled non-targeting siRNAs acting as a control. Transfection
efficiency, as determined using the siGLO Green transfection indicator, was 85-90% (Figure
3.3).
104
Introduction of targeting siRNAs into BMDCs resulted in a ~85% reduction in EAT-2
RNA expression (Figure 3.2B), leading to a ~80% reduction in EAT-2 protein levels (Figure 3.2
C). 24 h after transfection, BMDCs were co-cultured with naïve OT-II T cells from B6 or
c1(96-100) mice, together with OVA peptide for 2 days. Representative results are shown in
Figure 3.2 D&E, with pooled results from several experiments shown in Figure 3.2 F&G. As
seen for c1(70-100) BMDCs, knockdown of the EAT-2 gene in BMDCs from both B6 and
c1(96-100) strains resulted in increased production of IL-12 compared to scrambled control, and
this was associated with increased differentiation of OVA-specific T cells from both B6 and
c1(96-100) mice to a Th1 phenotype (Figure 3.2 F). Findings similar to those observed for
c1(70-100) BMDCs were also seen for IL-6, where knockdown of EAT-2 in BMDCs led to
increased IL-6 production only in co-cultures with c1(96-100) OT-II T cells (Figure 3.2 G).
However, this was only observed when EAT-2 was reduced in c1(96-100) BMDCs, indicating
that a NZB 96-100 genetic polymorphism is also required in BMDCs for increased generation
of IL-6. This was associated with enhanced production of IL-21 (Figure 3.2 G) but not IL-17 in
co-cultured c1(96-100) OT-II T cells. Knockdown of EAT-2 did not affect production of IL-12
and IL-6 by DCs in response to TLR ligands (data not shown). In summary, EAT-2 appears to
be negatively regulating cytokine production in DCs and the low levels of EAT-2 in c1(70-100)
and c1(88-100) mice may contribute to the increased production of IL-12 and IL-6 that we have
previously observed for their DCs.
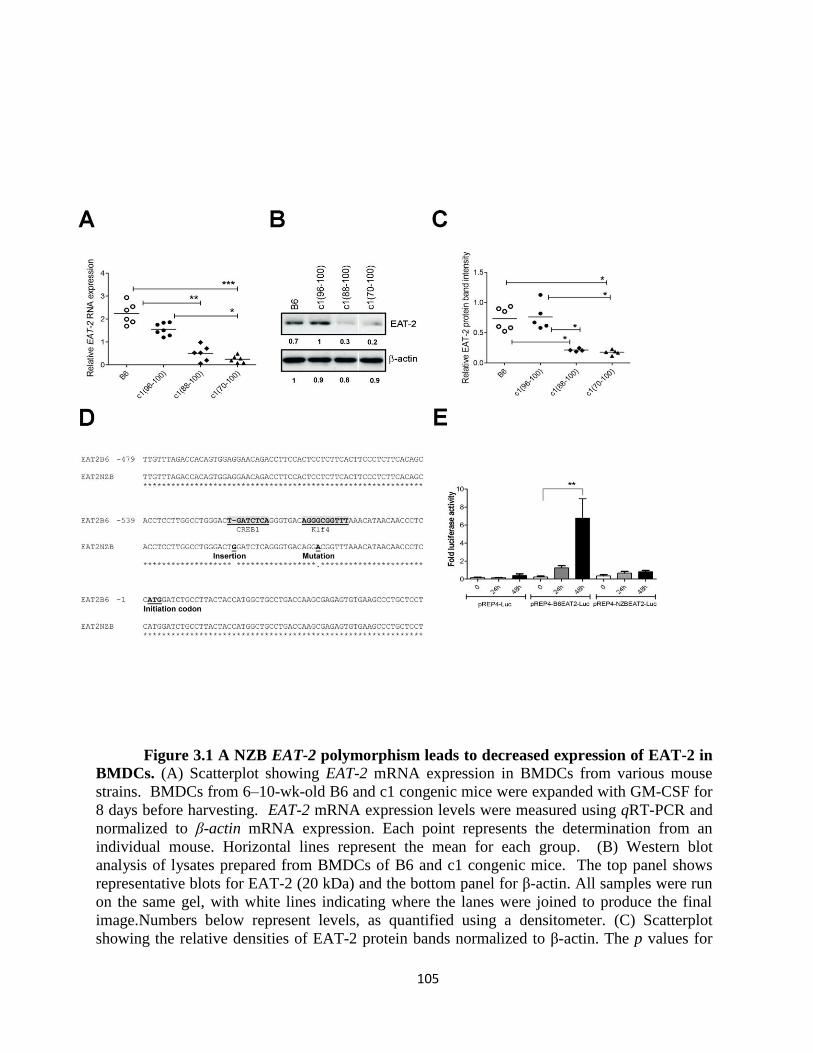
105
Figure 3.1 A NZB EAT-2 polymorphism leads to decreased expression of EAT-2 in
BMDCs. (A) Scatterplot showing EAT-2 mRNA expression in BMDCs from various mouse
strains. BMDCs from 6–10-wk-old B6 and c1 congenic mice were expanded with GM-CSF for
8 days before harvesting. EAT-2 mRNA expression levels were measured using qRT-PCR and
normalized to β-actin mRNA expression. Each point represents the determination from an
individual mouse. Horizontal lines represent the mean for each group. (B) Western blot
analysis of lysates prepared from BMDCs of B6 and c1 congenic mice. The top panel shows
representative blots for EAT-2 (20 kDa) and the bottom panel for β-actin. All samples were run
on the same gel, with white lines indicating where the lanes were joined to produce the final
image.Numbers below represent levels, as quantified using a densitometer. (C) Scatterplot
showing the relative densities of EAT-2 protein bands normalized to β-actin. The p values for
106
significant differences between B6 controls and various congenic mice are shown, *p<0.05,
**p<0.01. (D) Sequencing results from NZB and B6 genomic DNA. Highlighted sequences
indicate differences in the EAT-2 promoter region in the NZB as compared to the B6 mouse
strain. (E) B6 BMDCs were transfected with EAT-2 reporter plasmids (pREP4–B6-EAT2–Luc
and pREP4–NZB-EAT2–Luc) or pREP4–Luc empty vectors. Shown is the activity of the
indicated firefly luciferase reporter in transfected BMDCs, at 0, 24, or 48 h, following
incubation with GM-CSF. The firefly luciferase activity has been normalized to that of Renilla
luciferase. Data represent the means ± standard deviation of triplicate samples from three
different experiments. The p value for significant differences between different luciferase
vectors is shown, **p<0.01.
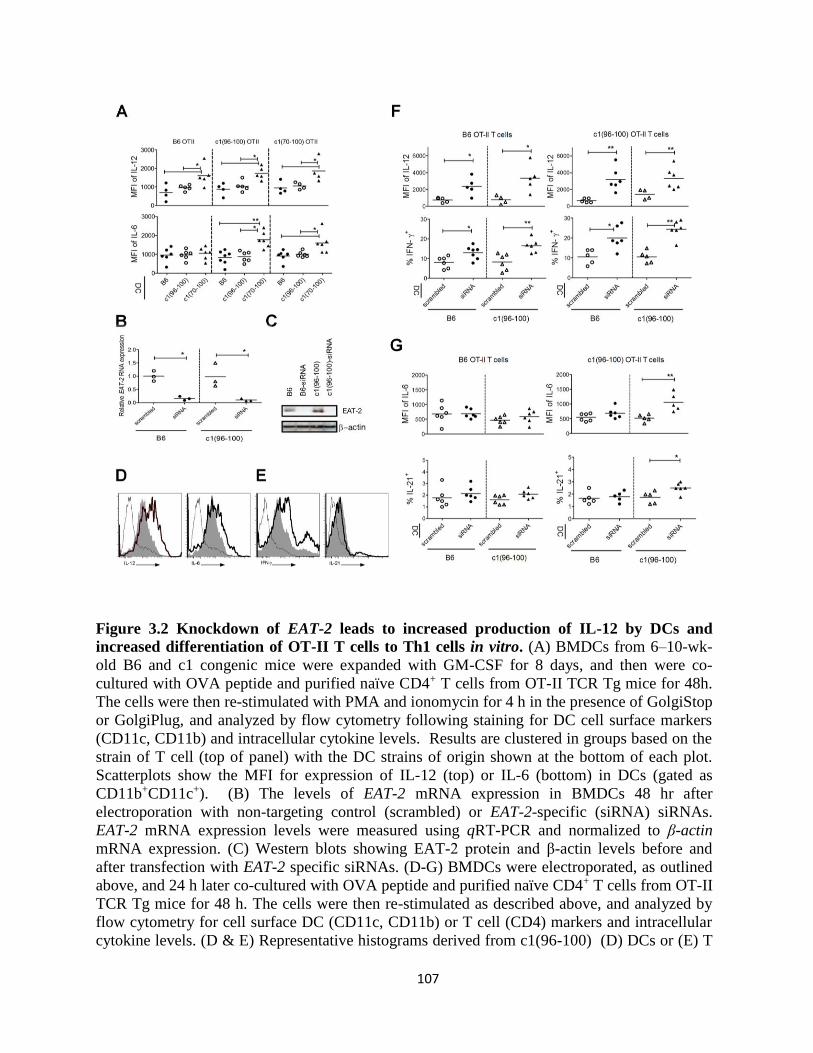
107
Figure 3.2 Knockdown of EAT-2 leads to increased production of IL-12 by DCs and
increased differentiation of OT-II T cells to Th1 cells in vitro. (A) BMDCs from 6–10-wk-
old B6 and c1 congenic mice were expanded with GM-CSF for 8 days, and then were co-
cultured with OVA peptide and purified naïve CD4+ T cells from OT-II TCR Tg mice for 48h.
The cells were then re-stimulated with PMA and ionomycin for 4 h in the presence of GolgiStop
or GolgiPlug, and analyzed by flow cytometry following staining for DC cell surface markers
(CD11c, CD11b) and intracellular cytokine levels. Results are clustered in groups based on the
strain of T cell (top of panel) with the DC strains of origin shown at the bottom of each plot.
Scatterplots show the MFI for expression of IL-12 (top) or IL-6 (bottom) in DCs (gated as
CD11b+CD11c+). (B) The levels of EAT-2 mRNA expression in BMDCs 48 hr after
electroporation with non-targeting control (scrambled) or EAT-2-specific (siRNA) siRNAs.
EAT-2 mRNA expression levels were measured using qRT-PCR and normalized to β-actin
mRNA expression. (C) Western blots showing EAT-2 protein and β-actin levels before and
after transfection with EAT-2 specific siRNAs. (D-G) BMDCs were electroporated, as outlined
above, and 24 h later co-cultured with OVA peptide and purified naïve CD4+ T cells from OT-II
TCR Tg mice for 48 h. The cells were then re-stimulated as described above, and analyzed by
flow cytometry for cell surface DC (CD11c, CD11b) or T cell (CD4) markers and intracellular
cytokine levels. (D & E) Representative histograms derived from c1(96-100) (D) DCs or (E) T
108
cells showing intracellular (D) IL-12 and IL-6 or (E) IFN- and IL-21 staining levels. Grey
shaded histograms represent cells from co-cultures with BMDC transfected with scrambled
control; thick line histograms represent cells from co-cultures with BMDCs transfected with
EAT-2-specific siRNAs. The thin line represents the unstained control. (F) Scatterplots showing
the MFI for DC IL-12 expression (top) and the percentage of IFN--producing T cells (bottom).
(G) Scatterplots showing the MFI for DC IL-6 expression (top) and the percentage of IL-21-
producing T cells (bottom). Each point represents the determination from an individual mouse.
Horizontal lines represent the mean for each group. Asterisks indicate the significance level for
comparisons between different mouse strains (* p<0.05, ** p<0.01).
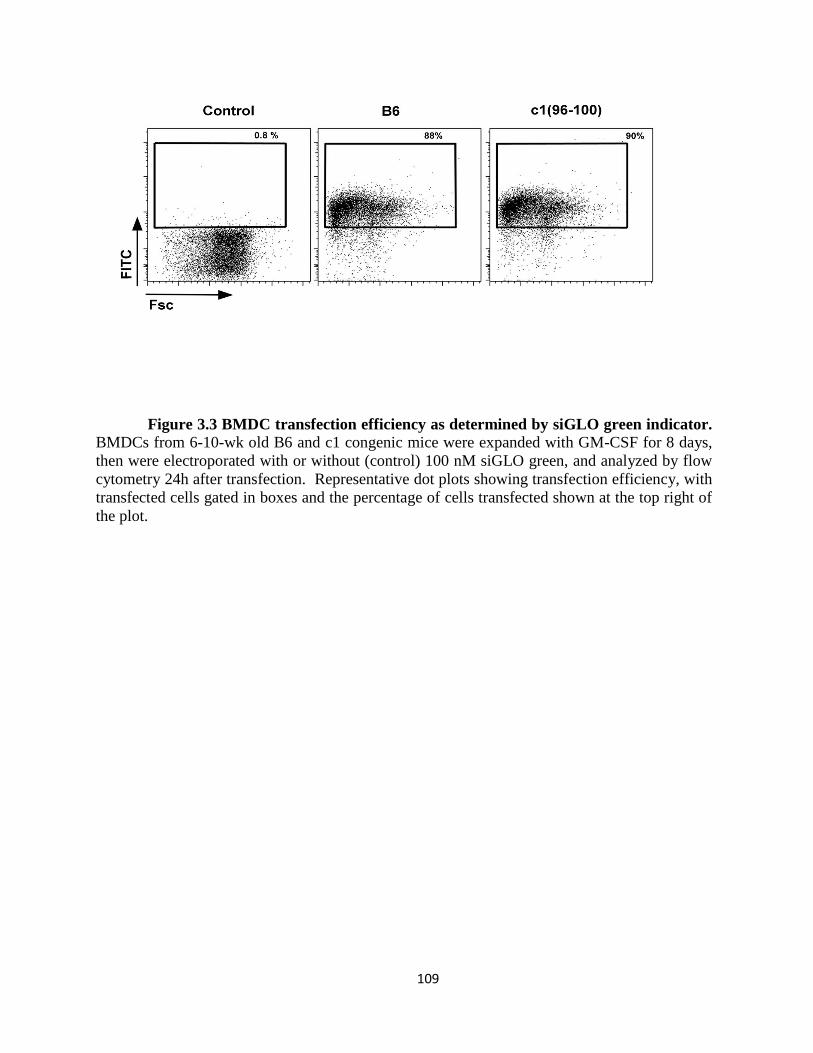
109
Figure 3.3 BMDC transfection efficiency as determined by siGLO green indicator. BMDCs from 6-10-wk old B6 and c1 congenic mice were expanded with GM-CSF for 8 days,
then were electroporated with or without (control) 100 nM siGLO green, and analyzed by flow
cytometry 24h after transfection. Representative dot plots showing transfection efficiency, with
transfected cells gated in boxes and the percentage of cells transfected shown at the top right of
the plot.
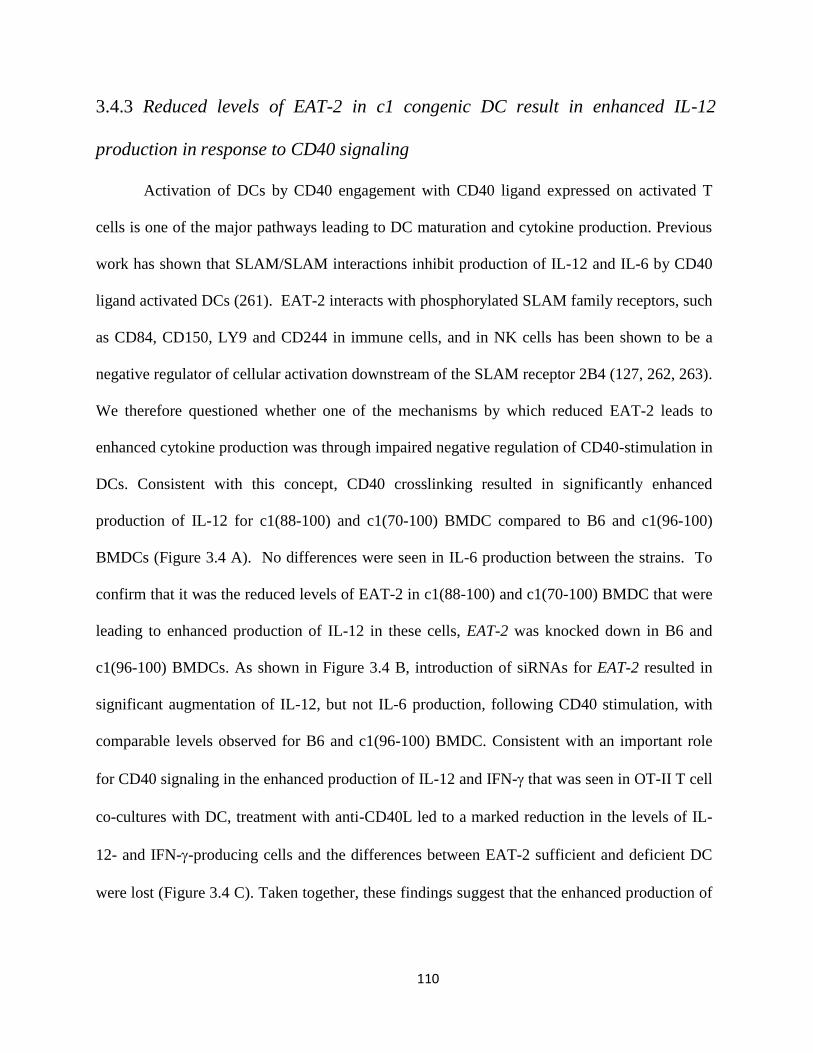
110
3.4.3 Reduced levels of EAT-2 in c1 congenic DC result in enhanced IL-12
production in response to CD40 signaling
Activation of DCs by CD40 engagement with CD40 ligand expressed on activated T
cells is one of the major pathways leading to DC maturation and cytokine production. Previous
work has shown that SLAM/SLAM interactions inhibit production of IL-12 and IL-6 by CD40
ligand activated DCs (261). EAT-2 interacts with phosphorylated SLAM family receptors, such
as CD84, CD150, LY9 and CD244 in immune cells, and in NK cells has been shown to be a
negative regulator of cellular activation downstream of the SLAM receptor 2B4 (127, 262, 263).
We therefore questioned whether one of the mechanisms by which reduced EAT-2 leads to
enhanced cytokine production was through impaired negative regulation of CD40-stimulation in
DCs. Consistent with this concept, CD40 crosslinking resulted in significantly enhanced
production of IL-12 for c1(88-100) and c1(70-100) BMDC compared to B6 and c1(96-100)
BMDCs (Figure 3.4 A). No differences were seen in IL-6 production between the strains. To
confirm that it was the reduced levels of EAT-2 in c1(88-100) and c1(70-100) BMDC that were
leading to enhanced production of IL-12 in these cells, EAT-2 was knocked down in B6 and
c1(96-100) BMDCs. As shown in Figure 3.4 B, introduction of siRNAs for EAT-2 resulted in
significant augmentation of IL-12, but not IL-6 production, following CD40 stimulation, with
comparable levels observed for B6 and c1(96-100) BMDC. Consistent with an important role
for CD40 signaling in the enhanced production of IL-12 and IFN- that was seen in OT-II T cell
co-cultures with DC, treatment with anti-CD40L led to a marked reduction in the levels of IL-
12- and IFN--producing cells and the differences between EAT-2 sufficient and deficient DC
were lost (Figure 3.4 C). Taken together, these findings suggest that the enhanced production of

111
IL-12 in c1 congenic mice with the NZB EAT-2 polymorphism results from impaired SLAM-
mediated negative regulation of CD40 signaling.
112
Figure 3.4 Increased production of IL-12 by anti-CD40-stimulated BMDC from
c1(88-100) and c1(70-100) mice is recapitulated by EAT-2 knockdown in control cells.
BMDCs were stimulated with 10μg/ml anti-CD40 mAb for 24h and the levels of IL-12 or IL-6
production examined by flow cytometry as described in the Materials and Methods section. (A)
Scatterplots showing the MFI for IL-12 (top) and IL-6 (bottom) expression after CD40
stimulation. (B) Scatter plots showing MFI for IL-12 and IL-6 expression in transfected
stimulated DCs. BMDCs from B6 or c1(96-100) mice were transfected with scrambled control
or EAT-2 specific siRNAs (as described in Figure 3.2) and stimulated with anti-CD40, as
described above. (C) Scatterplots showing the MFI for DC IL-12 expression (top) and the
percentage of IFN--producing T cells (bottom). BMDC from B6 or c1(96-100) mice were
transfected with scrambled control or EAT-2 specific siRNAs (as described in Figure 2) and 24
h later co-cultured with OVA peptide and purified naïve CD4+ T cells from OT-II TCR Tg mice
±10 μg/ml anti-CD40L mAb for 48 h. The cells were then re-stimulated with PMA and
ionomycin for 4 h in the presence of GolgiStop or GolgiPlug, and then analyzed by flow
cytometry for cell surface DC (CD11c, CD11b) or T cell (CD4) markers and intracellular
cytokine levels. Each point represents the determination from an individual mouse. Horizontal
lines represent the mean for each group. Asterisks indicate the significance level for
comparisons between different mouse strains (* p<0.05).
113
CD40-mediated signal transduction induces activation of several well-characterized
signal transduction pathways including p38 Mitogen-activated protein kinase (MAPK) and Jun
amino-terminal kinase (JNK), which have been shown to promote IL-12 production downstream
of CD40 in DCs (264). To determine whether EAT-2 negatively regulates this pathway, DCs
from all mouse strains were stimulated with anti-CD40 alone or in tandem with activating anti-
SLAM antibodies. There were no differences between the mouse strains in the levels of CD40
expression ( Figure 3.5). As CD150 engagement has been previously shown to inhibit CD40-
mediated activation of DCs, anti-CD150 antibodies were used to activate the SLAM pathway
(261). However, examination of CD150 expression on GM-CSF-expanded BMDCs revealed
significantly reduced levels of CD150 on c1 congenic BMDCs compared to B6 BMDCs (Figure
3.6 A&B). Therefore, as an additional control for potential expression level related effects, we
also examined cytokine secretion following anti-CD84 crosslinking. CD84 was chosen because
it is expressed at high levels on DCs and previous reports indicated CD84 negatively regulates
the cytokine secretion induced by FcεRI receptor stimulation in mast cells (261, 265). In
contrast to CD150 expression, CD84 expression was elevated on c1 congenic BMDCs relative to
B6 BMDCs (Figure 3.6 A&B).
As shown in Figure 3.6 C, crosslinking of CD84 or CD150 led to similar levels of
phosphorylation on a per molecule basis for all mouse strains, confirming that the antibodies are
activating and that there are no differences between strains in the ability of the antibodies to
induce phosphorylation of these molecules. Similarly, stimulation with anti-CD40 alone led to
equivalently enhanced phosphorylation of MAPK-P38 and JNK in all mouse strains (Figure 3.5
D). In contrast, CD40 stimulation in tandem with anti-CD84 or -CD150 crosslinking led to
significant inhibition of JNK and p38 MAPK phosphorylation in B6 and c1(96-100) BMDCs, as
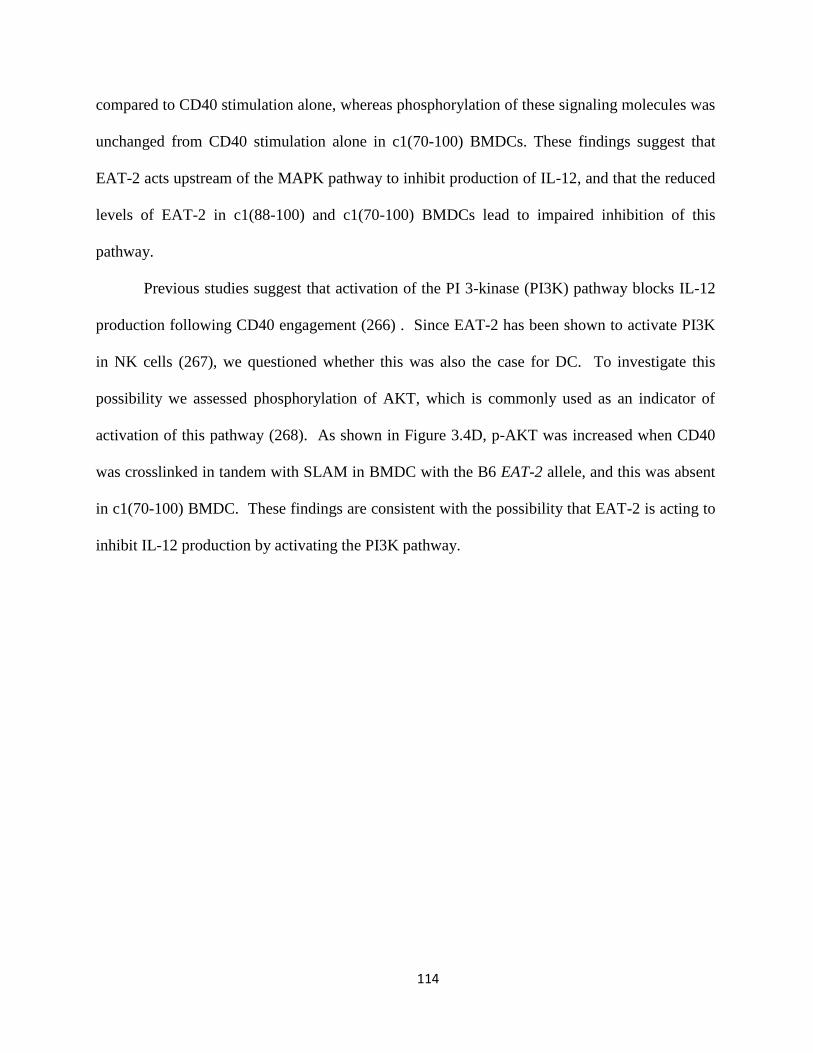
114
compared to CD40 stimulation alone, whereas phosphorylation of these signaling molecules was
unchanged from CD40 stimulation alone in c1(70-100) BMDCs. These findings suggest that
EAT-2 acts upstream of the MAPK pathway to inhibit production of IL-12, and that the reduced
levels of EAT-2 in c1(88-100) and c1(70-100) BMDCs lead to impaired inhibition of this
pathway.
Previous studies suggest that activation of the PI 3-kinase (PI3K) pathway blocks IL-12
production following CD40 engagement (266) . Since EAT-2 has been shown to activate PI3K
in NK cells (267), we questioned whether this was also the case for DC. To investigate this
possibility we assessed phosphorylation of AKT, which is commonly used as an indicator of
activation of this pathway (268). As shown in Figure 3.4D, p-AKT was increased when CD40
was crosslinked in tandem with SLAM in BMDC with the B6 EAT-2 allele, and this was absent
in c1(70-100) BMDC. These findings are consistent with the possibility that EAT-2 is acting to
inhibit IL-12 production by activating the PI3K pathway.
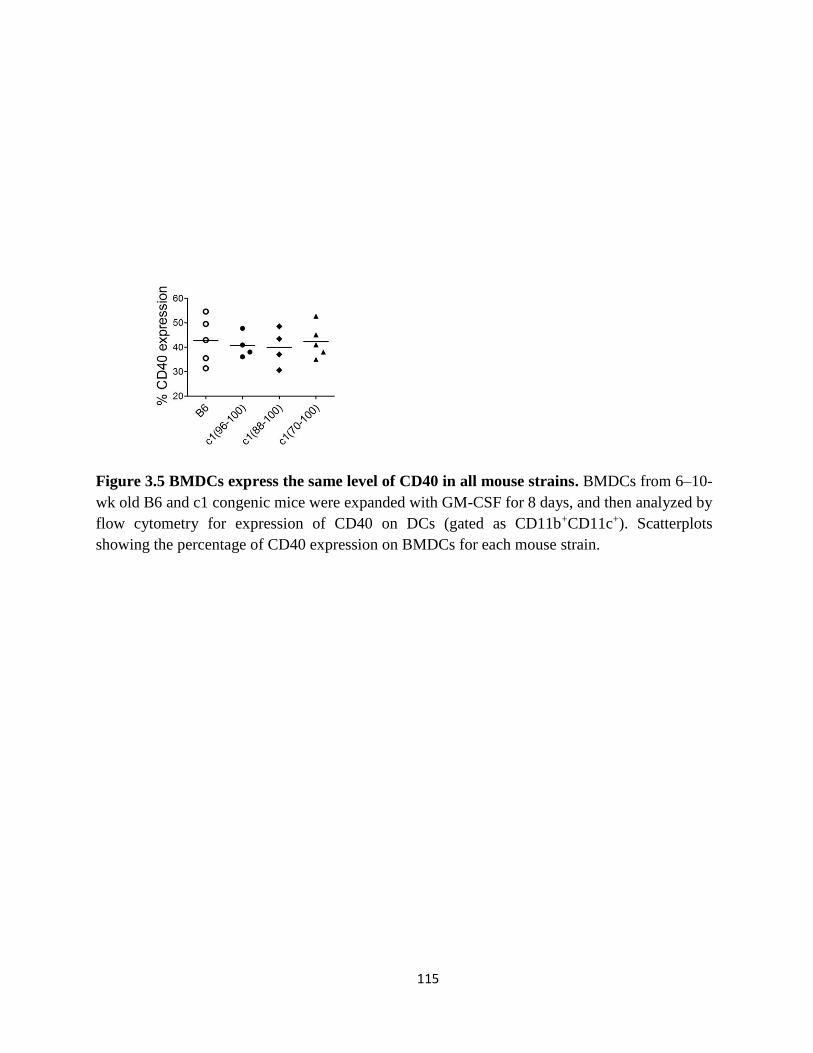
115
Figure 3.5 BMDCs express the same level of CD40 in all mouse strains. BMDCs from 6–10-
wk old B6 and c1 congenic mice were expanded with GM-CSF for 8 days, and then analyzed by
flow cytometry for expression of CD40 on DCs (gated as CD11b+CD11c+). Scatterplots
showing the percentage of CD40 expression on BMDCs for each mouse strain.
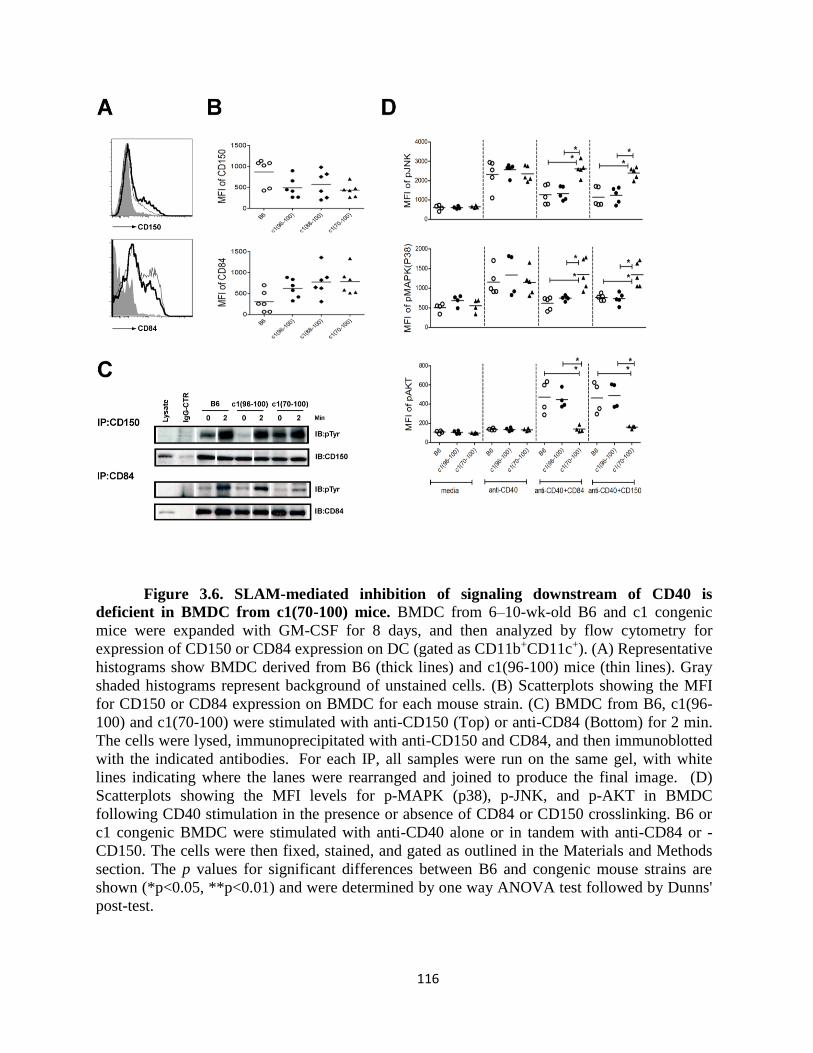
116
Figure 3.6. SLAM-mediated inhibition of signaling downstream of CD40 is
deficient in BMDC from c1(70-100) mice. BMDC from 6–10-wk-old B6 and c1 congenic
mice were expanded with GM-CSF for 8 days, and then analyzed by flow cytometry for
expression of CD150 or CD84 expression on DC (gated as CD11b+CD11c+). (A) Representative
histograms show BMDC derived from B6 (thick lines) and c1(96-100) mice (thin lines). Gray
shaded histograms represent background of unstained cells. (B) Scatterplots showing the MFI
for CD150 or CD84 expression on BMDC for each mouse strain. (C) BMDC from B6, c1(96-
100) and c1(70-100) were stimulated with anti-CD150 (Top) or anti-CD84 (Bottom) for 2 min.
The cells were lysed, immunoprecipitated with anti-CD150 and CD84, and then immunoblotted
with the indicated antibodies. For each IP, all samples were run on the same gel, with white
lines indicating where the lanes were rearranged and joined to produce the final image. (D)
Scatterplots showing the MFI levels for p-MAPK (p38), p-JNK, and p-AKT in BMDC
following CD40 stimulation in the presence or absence of CD84 or CD150 crosslinking. B6 or
c1 congenic BMDC were stimulated with anti-CD40 alone or in tandem with anti-CD84 or -
CD150. The cells were then fixed, stained, and gated as outlined in the Materials and Methods
section. The p values for significant differences between B6 and congenic mouse strains are
shown (*p<0.05, **p<0.01) and were determined by one way ANOVA test followed by Dunns'
post-test.
117
3.5 Discussion
We previously showed that full expression of the autoimmune phenotype in NZB c1
congenic mice results from the interaction between at least 3 genetic loci (94). While a breach
of tolerance to nuclear antigens was seen in mice with the NZB c1 96-100 cM interval,
pathogenic autoimmunity required the presence of additional defects localized to the NZB 70-
96 cM interval that were associated with marked expansion of pro-inflammatory T cell subsets
including Th1, Th17, and Tfh cells in vivo. As the same abnormal expansion could be observed
for foreign antigen-specific responses, we were able to dissect the functional abnormalities
leading to the altered T cell differentiation in NZB c1 congenic mice, showing that T cell and
DC functional alterations interacted to produce this phenotype. Despite the presence of intrinsic
T cell functional abnormalities in c1 congenic mice leading to enhanced differentiation of their
naïve T cells in response to Th1 and Th17 polarizing stimuli, maximal expansion of pro-
inflammatory T cell subsets in an antigenic response required interaction of these T cells with
DCs from mice with a NZB c1 interval containing the 88-100 cM region (258). Mice with this
interval were shown to have functionally altered DCs that produced increased amounts of IL-12
and IL-6 in co-culture experiments with T cells. Here we provide several lines of evidence
indicating that this altered function results from a promoter polymorphism in the NZB EAT-2
gene that leads to reduced levels of EAT-2 protein expression.
Although the SLAM family of receptors modulates immune responses through several
adapters including SAP, EAT-2 and ERT, EAT-2 is the only known SLAM-associated adapter
protein expressed in DCs (263). EAT-2 is also found in NK cells (263, 269), where it has been
shown to play an important role in the regulation of NK cell function mediated by SLAM
family members (269). Although some controversy exists surrounding whether EAT-2 can
118
promote or inhibit NK cell function depending on the upstream SLAM molecule that is engaged
(130, 270, 271), EAT-2 has been shown to be required for the inhibition of NK cell function
that is mediated by 2B4 (127). Based on this observation and previous findings indicating that
engagement of CD150 leads to impaired production of cytokines by DCs in response to CD40
engagement (261), we hypothesized that the reduced levels of Eat-2 in c1 congenic BMDC lead
to impaired negative regulation of this signaling pathway, resulting in augmented production of
cytokines. Consistent with this hypothesis, we show that knocking down the levels of EAT-2 in
DCs leads to augmented cytokine production similar to that observed for the NZB EAT-2
polymorphism in T-DC co-culture experiments and also leads to significantly increased
production of IL-12 in response to CD40 engagement.
In contrast to the results for IL-12, knockdown of EAT-2 did not lead to enhanced
production of IL-6 with CD40 stimulation alone. This finding, together with the observation
that enhanced IL-6 production was only seen for c1(96-100) BMDCs with EAT-2 knocked
down that had been co-cultured with c1 congenic T cells, suggests that there are additional
signals derived from NZB polymorphisms in the 96-100 interval that are required to promote
IL-6 production. Although several polymorphic genes have been described in this interval, the
most likely candidates to produce these differences are members of the SLAM family itself.
NZB mice are reported to have a similar SLAM allele to NZM mice, although minor sequence
variations were noted (85). The presence of this SLAM allele was found to correlate with
susceptibility to SLE and was associated with altered expression of several SLAM family
members (85). Subsequent experiments have largely focused upon the role of Ly108 in this
phenotype, where differences in the expression of several splice variants of this gene have been
noted. In autoimmune mouse strains, expression of Ly108-1 is increased, whereas Ly108-2
119
expression is decreased and Ly108-H1 is absent (84, 86). Unpublished experiments from our
laboratory have confirmed similarly altered expression of these splice variants in c1 congenic T
cells. Notably, absence of a Ly108-H1 splice variant has been shown to promote differentiation
of IFN--producing T cells (86). Therefore, it is likely that this contributes to the enhanced
production of IFN- by c1 congenic T cells in T cell - DC co-cultures (see Figure 2F).
Although IFN- induces IL-6 production in monocytes and other cell types (272, 273), which
could contribute to enhanced production of IL-6 in BMDCs, this is insufficient to explain the
increased IL-6 production in the T-DC co-cultures, because this is not observed for B6 BMDCs.
Thus, additional NZB-derived functional differences in BMDCs must contribute to this
phenotype. In this connection, it is interesting to note that there are several SLAM family
members that are differentially expressed in c1 congenic and B6 BMDCs and T cells. As
shown in this paper, GM-CSF-expanded c1 congenic BMDCs have decreased levels of CD150
and increased levels of CD84, and similar changes are seen on CD4+ T cells. Previous
experiments indicate that in the absence of CD150, IFN- production by T cells is increased
(274), raising the possibility that the low levels of CD150 could contribute to the enhanced IFN-
production observed for c1 congenic T cells. As the majority of SLAM-molecules, including
CD150 and CD84, are homophillic receptors, low levels of CD150 on BMDCs could further
enhance IFN- production by c1 congenic CD4+ T cells, leading to further increases in IL-6.
This finding is consistent with the observation that knocking down EAT-2 in c1(96-100)
BMDCs leads to a greater enhancement in IFN- production than knockdown of EAT-2 in B6
BMDCs (see Figure 2).
It has been reported that CD40-mediated activation of the p38 MAP Kinase and JNK
signaling pathways promotes IL-12 production by DCs (275-278) and that PI 3-kinase (PI3K)

120
has an inhibitory effect on this production by blocking these pathways through an unknown
mechanism (266). Since engagement of CD150 or CS1 has been shown to trigger PI3K
activation (267, 279-281) and this activation is mediated by EAT-2 in NK cells (267), we
hypothesized that EAT-2 acts downstream of SLAM engagement to decrease IL-12 production
in BMDC by blocking activation of the p38 MAPK and JNK pathways. Consistent with this
possibility, engagement of CD150 or CD84 led to significantly reduced levels of p38 MAPK
and JNK phosphorylation following CD40 stimulation of BMDCs, which was not seen for c1
congenic mouse strains with the NZB EAT-2 polymorphism. Currently, the precise molecules
that are recruited through EAT-2 activation downstream of the SLAM receptors in DCs and
mechanisms by which they inhibit p38 MAPK and JNK activation downstream of the CD40
receptor are unknown.
Our findings further highlight the importance of the SLAM signaling pathway in the
regulation of autoimmunity. SLAM signaling plays an important role in the fine-tuning of a
diverse array of immunologic functions including: 1) cytokine production by T cells,
macrophages, neutrophils and DCs (263, 274, 282); 2) B-T cell adhesion (283); 3) B cell
signaling and tolerance (84, 284, 285); 4) NK T cell development (118); 5) NK function (118);
6) T cell differentiation, in particular to Tfh cells (274, 286); and 7) platelet aggregation (118).
Mice bearing the autoimmune-associated SLAM allele have been shown to have disturbances in
several of these processes, such as enhanced differentiation of their T cells to Th1 and Tfh cells,
decreased immature B cell receptor editing and apoptosis, impaired GC B cell tolerance, and
altered pDC function with increased production of IL-10 and IFN- .
The majority of these differences have been ascribed to the altered splicing of Ly108 observed
in these mice, although a role for altered expression of other polymorphic members of the
121
SLAM family cannot be excluded. In this report, we provide evidence for a second murine
lupus-susceptibility gene that affects the SLAM signaling pathway. Although our report focuses
upon the role of this polymorphism in DCs, it is also possible that this polymorphism leads to
altered function other cell populations, such as B cells and NK cells that are known to express
EAT-2 (263).
It is likely that disturbed SLAM signaling also plays a role in the immunologic
derangement associated with human lupus. Altered expression of several SLAM family
members has been noted on the T cells, NK cells, and pDCs of SLE patients (287-290). In T
cells, this altered expression is associated with an enhanced ability of the SLE T cells to
differentiate to IL-17-producing cells with Th17 polarizing stimuli (288). While there is some
data suggesting that there are lupus genetic risk variants in the SLAM signaling pathway (113,
291, 292), it is currently unclear whether this altered expression arises from these variants or
from the pro-inflammatory milieu associated with the disease.
In summary, our findings indicate that the SLAM pathway, and in particular EAT-2,
appears to play a crucial role in limiting cytokine secretion in myeloid DCs. In this context, it is
notable that expression of all SLAM molecules examined increased following CD40
stimulation, suggesting the presence of a negative feedback loop in which up-regulation of
SLAM molecules following DC activation blocks cytokine secretion, limiting the expansion of
pro-inflammatory T cell subsets. As demonstrated in this and our previous paper (258), the
consequence of this impaired negative regulation is increased provision of help for pathogenic
auto-antibody production, promoting the conversion of sub-clinical autoimmunity to fatal lupus
nephritis.

122

123
Chapter 4
General Discussion and Future Directions
The main focus of this thesis was to identify the lupus susceptibility genes located
within the 70 and 100 cM of NZB chromosome and to define the immune mechanisms by
which they act to promote disease. In work done prior to my experiments, Dr. Wither’s
laboratory had shown that mice with a NZB c1 interval extending from 70-100 cM (c1(70-
100)) develop a severe lupus phenotype, with high titers of anti-dsDNA Abs and GN, leading
to the death of ~40% of the mice by 8 months of age. This phenotype appeared to result from
at least 3 genetic loci, as indicated by progressively attenuated disease in mice with NZB c1
intervals extending from 88- or 96-100 cM (94).
In Chapter 2, I characterized the immune changes in a series of sub-congenic mice with
varying lengths of intervals derived from the NZB 70-100 cM region that differed in the
severity of disease. I showed that the disease severity in these mice paralleled the expansion of
pro-inflammatory T cell subsets, specifically Th1, Th17, and Tfh cells. I further demonstrated
that this expansion could be recapitulated following immunization of pre-autoimmune mice
with an exogenous antigen. This T cell skewing resulted from a combination of immune cell
functional abnormalities in congenic mice that localized to different regions within the c1(70-
100) interval. Naïve T cell functional abnormalities that promote differentiation/expansion of
IFN-γ- and IL-17- producing cells localized to the 96-100 and 88-96 intervals, respectively,
whereas DC functional abnormalities that promote expansion of all the pro-inflammatory T cell
subsets localized to the 88-96 and 70-88 intervals. Notably, altered DC function appeared to
124
play a critical role in this expansion because in the absence of DC abnormalities, minimal
expansion of pro-inflammatory T cell subsets was seen.
In addition to understanding the mechanism of disease in c1 congenic mice, it is
important to identify the genes that mediate these functional abnormalities. While the T cell
functional changes leading to expansion of IFN--producing cells appear to map to the 96-100
region, it is currently unknown whether T cell functional changes leading to expansion of IL-17-
producings cells in c1 congenic mice arise solely from genetic polymorphisms located within
the c1 88-96 interval, or result from interactions between polymorphisms in the c1 96-100 and
88-96 intervals.
Within the 88-100 interval, Ly108, Pbx1 and Rxr- are three attractive candidate genes
that theoretically may promote altered T cell function in c1 congenic mice. To determine
whether these candidate genes are associated with altered generation of Th1 and Th17 cells, I
have examined the expression level of Ly108, Pbx1 and Rxr- in naïve CD4+ splenic T cells and
in unstimulated or anti-CD3/CD28 stimulated cells using qRT-PCR.
Ly108 is within the 96-100 interval and is a member of the SLAM/CD2 gene family that
has at least three alternatively spliced isoforms (85). In autoimmune mouse strains, expression
of Ly108.1 is increased, whereas Ly108.2 expression is decreased and Ly108-H1 is absent.
Looking at the RNA expression levels of different Ly108 isoforms showed that consistent with
previous findings for the NZM2410 mouse strain (which has the NZW SLAM allele),
stimulated T cells from c1 congenic mice had increased expression of the Ly108.1 isoform and
lacked Ly108-H1 (Figure 4.1). However in contrast to previous reports for NZM2410 mice,
differences in expression of the Ly108.1 or Ly108.2 isoforms were only noted following
activation of the cells (Figure 4.1).
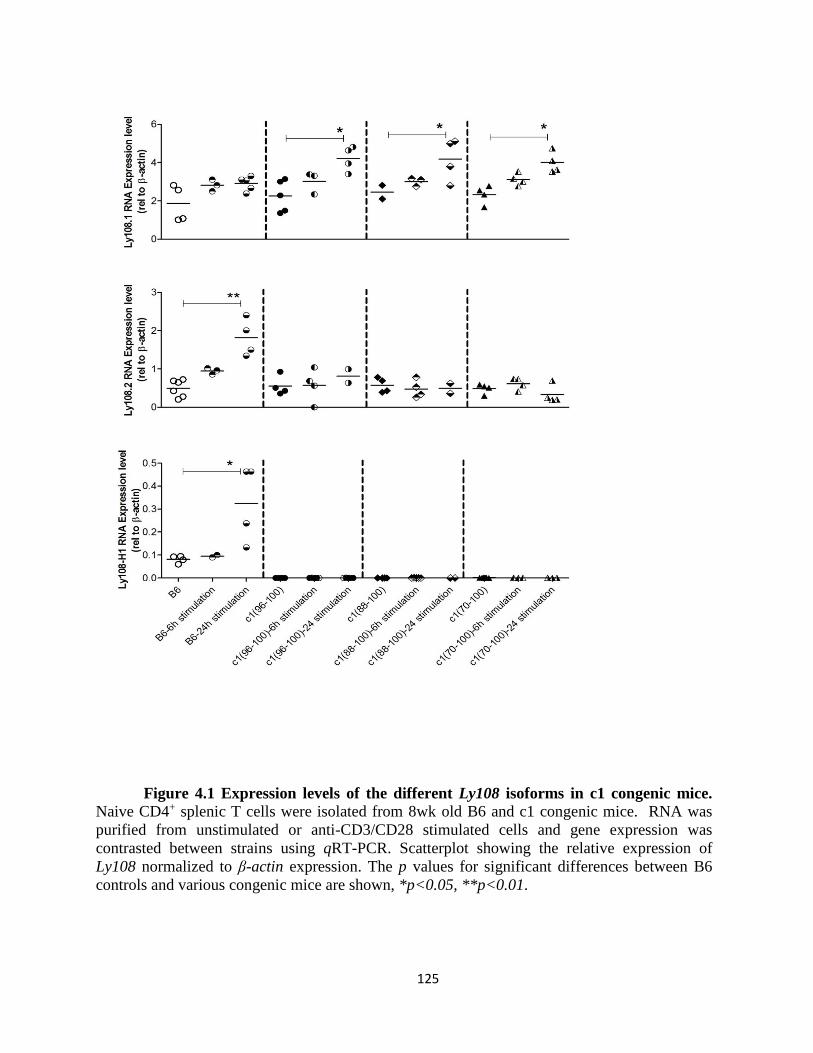
125
Figure 4.1 Expression levels of the different Ly108 isoforms in c1 congenic mice.
Naive CD4+ splenic T cells were isolated from 8wk old B6 and c1 congenic mice. RNA was
purified from unstimulated or anti-CD3/CD28 stimulated cells and gene expression was
contrasted between strains using qRT-PCR. Scatterplot showing the relative expression of
Ly108 normalized to β-actin expression. The p values for significant differences between B6
controls and various congenic mice are shown, *p<0.05, **p<0.01.
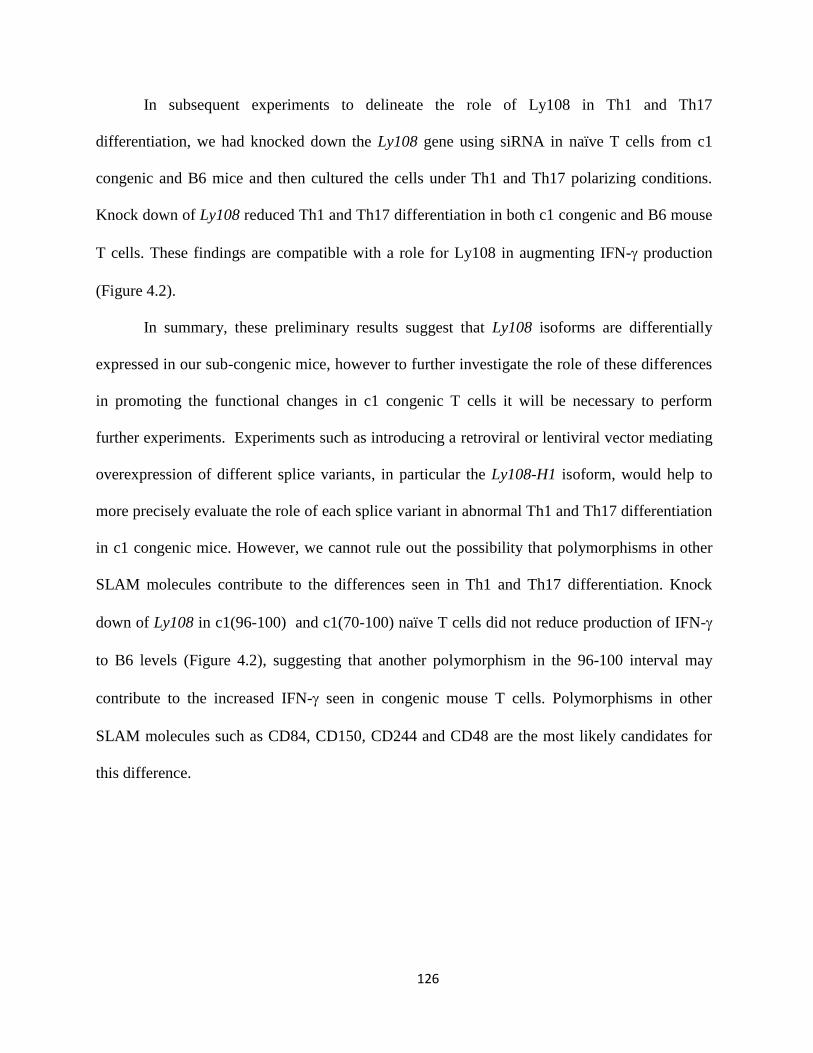
126
In subsequent experiments to delineate the role of Ly108 in Th1 and Th17
differentiation, we had knocked down the Ly108 gene using siRNA in naïve T cells from c1
congenic and B6 mice and then cultured the cells under Th1 and Th17 polarizing conditions.
Knock down of Ly108 reduced Th1 and Th17 differentiation in both c1 congenic and B6 mouse
T cells. These findings are compatible with a role for Ly108 in augmenting IFN- production
(Figure 4.2).
In summary, these preliminary results suggest that Ly108 isoforms are differentially
expressed in our sub-congenic mice, however to further investigate the role of these differences
in promoting the functional changes in c1 congenic T cells it will be necessary to perform
further experiments. Experiments such as introducing a retroviral or lentiviral vector mediating
overexpression of different splice variants, in particular the Ly108-H1 isoform, would help to
more precisely evaluate the role of each splice variant in abnormal Th1 and Th17 differentiation
in c1 congenic mice. However, we cannot rule out the possibility that polymorphisms in other
SLAM molecules contribute to the differences seen in Th1 and Th17 differentiation. Knock
down of Ly108 in c1(96-100) and c1(70-100) naïve T cells did not reduce production of IFN-
to B6 levels (Figure 4.2), suggesting that another polymorphism in the 96-100 interval may
contribute to the increased IFN- seen in congenic mouse T cells. Polymorphisms in other
SLAM molecules such as CD84, CD150, CD244 and CD48 are the most likely candidates for
this difference.
127
Figure 4.2 Knock down of Ly108 leads to reduced Th1 and Th17 differentiation in both c1
congenic and B6 mouse T cells. Naive CD4+ splenic T cells were isolated from 8wk old B6
and c1 congenic mice and transfected with Ly108 siRNA or scramble control. The cells were
cultured under Th1 or Th17 polarizing conditions (according to figure 2.3). On day 3, the cells
were re-stimulated with PMA and ionomycin for 4 h in the presence of GolgiPlug, and analyzed
by flow cytometry for cell surface T cell (CD3, CD4) markers and intracellular cytokine levels.
Scatterplots showing percentage of IFN- and IL-17 -producing T cells. Asterisks indicate the
significance level for comparisons between different mouse strains (* p<0.05, ** p<0.01).
128
The second candidate gene, Pre-leukemia homeobox (Pbx) 1, is located within the 88-96
region and has three different isoforms: a, b and d. The Pbx1-d isoform is expressed at high
levels in the NZM2410 lupus-prone mouse strain and has been shown to have a dominant
negative effect on Pbx1 function, resulting in altered T cell activation and tolerance (83).
Expression levels of Pbx1-a, b and d isoforms in naïve and activated T cells did not differ
between c1 congenic and B6 mice (data not shown). However, these preliminary data cannot
rule out possible expression differences for the Pbx1-d isoform in c1 congenic mice, as we only
evaluated the expression levels in naïve T cells derived from 6-8 week old mice. Previous
reports suggest that Pbx1 is upregulated in memory T cells and that the altered expression of
Pbx-1d is particularly apparent in the memory activated proportion of T cells from aged Sle1a
mice. Consequently, evaluation of the expression levels of the Pbx1-d isoform in CD4+ T cells
from aged c1 congenic mice, in particular the memory activated compartment, is necessary
before this can be excluded as a candidate gene.
Pbx1 appears to play an important role in the control of T cell differentiation by the
retinoic acid (RA) signaling pathway (83). RA induces differentiation of induced regulatory T
cells (iTregs) and inhibits Th17 differentiation in the presence of TGFβ, by enhancing TGFβ–
driven Smad3 signaling and inhibiting IL-6 and IL-23 expression, resulting in enhanced
suppressive activity of murine (293-295) and human T cells (296, 297). Expression of the Pbx1-
d isoform in Sle1a1 induces a defective CD4+ T cell response to RA and TGFβ under Th17-
polarizing conditions, resulting in significantly reduced expansion of iTregs (298). Evaluation
of the Sle1a1 transcriptional signature revealed defective Th17/Treg homeostasis in response to
RA. Therefore, assessment of the CD4+ response to RA would help to identify whether this
pathway is abnormal in c1(70-100) congenic mice. In particular, evaluation of T cell

129
differentiation in response to RA and TGFβ in Th17 polarization conditions would help to
identify a potential role for Pbx1d in the increased differentiation of Th17 cells in c1 congenic
mice.
The third candidate gene, which is located within the 88-96 interval, is Retinoid X
receptor-γ (Rxr-γ). Rxr-γ belongs to the family of Retinoid X receptors (RXRs), which are
members of the NR2B family of nuclear receptors and are common binding partners to many
nuclear receptors, including PPARs (peroxisome proliferation/activation receptors). PPARs play
essential roles in the regulation of T cell survival, activation and differentiation into the Th1,
Th2, Th17, and Treg lineages (299). Recently, a member of the PPAR family, named PPAR
gamma, has been identified as a Th17 differentiation regulator (300). Indeed, studies have
shown that RXRs play a role in Th differentiation and T cell response modulation by modifying
the balance of Th1 and Th2 cells (245, 246).
Although Rxr- appears to be an attractive candidate gene, expression levels of Rxr- in
naïve T cells did not differ between B6 and c1 congenic mice at rest and only T cells from
c1(70-100) mice showed lower expression after 24h stimulation with anti-CD3 and CD28
(Figure 4.3). Since Rxr- is polymorphic between the B6 and NZB mouse strains, and the
recombination between B6 and NZB genetic material for c1(88-100) mice appears to be within
this gene, further work will be required to clarify the role of this gene in T cell responses. This
includes examination of the expression levels of different splice variants in naïve T cells from
c1(88-100) and c1(70-100) mice and knock down of RXR- in T cells to determine its impact on
T cell differentiation.
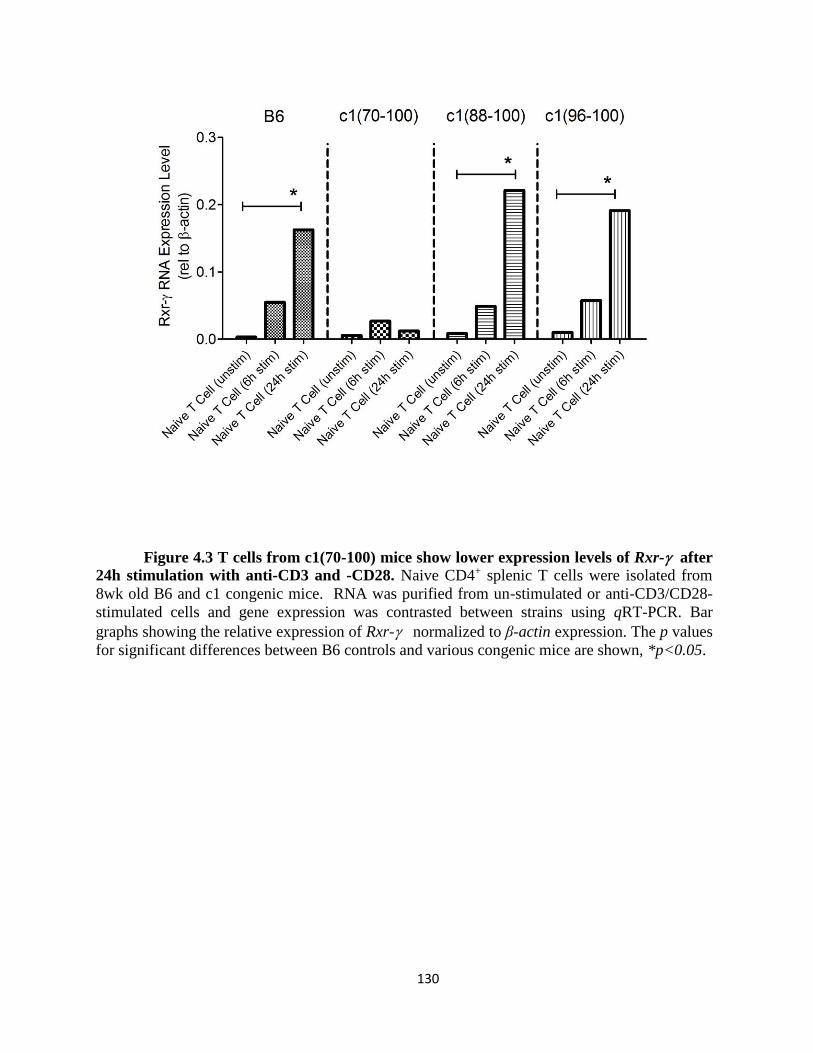
130
Figure 4.3 T cells from c1(70-100) mice show lower expression levels of Rxr- after
24h stimulation with anti-CD3 and -CD28. Naive CD4+ splenic T cells were isolated from
8wk old B6 and c1 congenic mice. RNA was purified from un-stimulated or anti-CD3/CD28-
stimulated cells and gene expression was contrasted between strains using qRT-PCR. Bar
graphs showing the relative expression of Rxr- normalized to β-actin expression. The p values
for significant differences between B6 controls and various congenic mice are shown, *p<0.05.
131
Examining the potential link between the expansion of Th17 cells and altered expression
levels of different Rxr- isoforms may reveal a potential mechanism for transcriptional
regulation of Th17 differentiation by Rxr- through interaction with PPAR receptors.
Understanding the mechanisms by which Rxr- controls Th17 differentiation will help to
elucidate the function of this important receptor family during Th17 differentiation and may
provide new targets for the treatment of Th17-dependent autoimmunity.
In Chapter 3, I identified the genetic polymorphism that leads to altered DC function in
NZB chromosome 1 congenic mice. I showed that the promoter region of the NZB gene
encoding the SLAM signaling pathway adapter molecule EAT-2 is polymorphic and that this
results in a ~70% reduction in EAT-2 in DCs. Knockdown of EAT-2 in BMDCs of mice that
lacked this polymorphism reproduced the altered DC phenotype. I further demonstrated that
BMDCs from mice with the NZB polymorphism, or that have EAT-2 knocked down, produce
increased amounts of cytokines in response to CD40 crosslinking and that EAT-2 plays an
important role in the negative regulation of CD40 signaling following SLAM engagement.
Our findings indicate that the SLAM pathway, and in particular EAT-2, appears to play
a crucial role in limiting cytokine secretion in mDCs. In this context, it is notable that
expression of all SLAM molecules examined increased following CD40 stimulation, suggesting
the presence of a negative feedback loop in which up-regulation of SLAM molecules following
DC activation blocks cytokine secretion, limiting the expansion of pro-inflammatory T cell
subsets. The consequence of this impaired negative regulation is increased support for
pathogenic auto-antibody production, converting the benign anti-nuclear antibody production
seen in c1(96-100) mice to the severe life-threatening nephritis observed in c1(70-100) mice.
132
More work needs to be done to identify the other genetic polymorphisms within the 70-
88 interval that augment the severity of disease in c1(70-100) mice. This interval contains over
200 genes, many of which have, or are predicted to have, immune functions. Of these, several
have been shown to modify TLR responses in DCs, including: Map kinase activated protein
kinase 2 (Mapkapk2), inhibitor of kappa B kinase epsilon (Ikbke), and DEAH box polypeptide
nine (Dhx9). The gene encoding Ox40L (Tnfsf4) is also localized within this interval. This
suggests a putative role for receptor/ ligand interaction (OX40/OX40L) in enhancing the
division and survival of T cells in c1(70-100) mice (301). OX40-OX40L interactions are
implicated in the pathogenesis of human lupus as revelaed by recent reports demonstrating a
direct association between the severity of lupus nephritis and increased expression of OX40 on
CD4+ T cells and enhanced serum levels of OX40L (302).
The findings outlined in this thesis provide important insights into how individual
susceptibility loci, which alone produce modest changes in immune function, interact
synergistically to profoundly alter immune functions, leading to progression from preclinical to
pathogenic autoimmunity. By themselves, neither the T cell nor the DC functional alterations
were sufficient to induce enhanced differentiation of pro-inflammatory T cell subsets. Thus, no
single cell population and no single genetic locus in isolation is sufficient to produce clinical
autoimmune disease in this model. Indeed, our studies of murine lupus outlined in this thesis
have important implications for the study of human autoimmune disease, in that they provide an
explanation for how genetic loci that are present in the family members of patients with
autoimmune disease can be compatible with relatively normal immune function, whereas in
patients they lead to profoundly altered immune function. The results also suggest that the
impact of individual genetic loci on immune function is highly dependent upon their

133
genetic/immunologic context. Thus, the identification of individuals with an increased
likelihood of developing autoimmune disease must necessarily involve characterization of
multiple genetic elements acting in concert. Identification of susceptible genes may provide
insights into the pathogenesis behind SLE and may lead to targeted therapies of lupus nephritis.
134
References
1. Vyse, T. J., and B. L. Kotzin. 1996. Genetic basis of systemic lupus erythematosus. Curr
Opin Immunol 8:843-851.
2. Hahn, B. H. 1998. Antibodies to DNA. N Engl J Med 338:1359-1368.
3. Mevorach, D. Clearance of dying cells and systemic lupus erythematosus: the role of
C1q and the complement system. Apoptosis 15:1114-1123.
4. Mizuno, M., S. Blanchin, P. Gasque, K. Nishikawa, and S. Matsuo. 2007. High levels of
complement C3a receptor in the glomeruli in lupus nephritis. Am J Kidney Dis 49:598-
606.
5. Kono, D. H., and A. N. Theofilopoulos. 2000. Genetics of systemic autoimmunity in
mouse models of lupus. Int Rev Immunol 19:367-387.
6. Wakeland, E. K., K. Liu, R. R. Graham, and T. W. Behrens. 2001. Delineating the
genetic basis of systemic lupus erythematosus. Immunity 15:397-408.
7. Wakeland, E., L. Morel, K. Achey, M. Yui, and J. Longmate. 1997. Speed congenics: a
classic technique in the fast lane (relatively speaking). Immunol Today 18:472-477.
8. Theofilopoulos, A. N., and F. J. Dixon. 1985. Murine models of systemic lupus
erythematosus. Adv Immunol 37:269-390.
9. Andrews, B. S., R. A. Eisenberg, A. N. Theofilopoulos, S. Izui, C. B. Wilson, P. J.
McConahey, E. D. Murphy, J. B. Roths, and F. J. Dixon. 1978. Spontaneous murine
lupus-like syndromes. Clinical and immunopathological manifestations in several
strains. J Exp Med 148:1198-1215.
10. Xu, Z., and L. Morel. Genetics of systemic lupus erythematosus: contributions of mouse
models in the era of human genome-wide association studies. Discov Med 10:71-78.
11. Watanabe-Fukunaga, R., C. I. Brannan, N. G. Copeland, N. A. Jenkins, and S. Nagata.
1992. Lymphoproliferation disorder in mice explained by defects in Fas antigen that
mediates apoptosis. Nature 356:314-317.
12. Theofilopoulos, A. N., P. J. McConahey, S. Izui, R. A. Eisenberg, A. B. Pereira, and W.
D. Creighton. 1980. A comparative immunologic analysis of several murine strains with
autoimmune manifestations. Clin Immunol Immunopathol 15:258-278.
13. Smathers, P. A., T. J. Santoro, T. M. Chused, J. P. Reeves, and A. D. Steinberg. 1984.
Studies of lymphoproliferation in MRL-lpr/lpr mice. J Immunol 133:1955-1961.
14. Strasser, A., P. J. Jost, and S. Nagata. 2009. The many roles of FAS receptor signaling in
the immune system. Immunity 30:180-192.
15. Nagata, S. 1994. Mutations in the Fas antigen gene in lpr mice. Semin Immunol 6:3-8.
16. Takahashi, T., M. Tanaka, C. I. Brannan, N. A. Jenkins, N. G. Copeland, T. Suda, and S.
Nagata. 1994. Generalized lymphoproliferative disease in mice, caused by a point
mutation in the Fas ligand. Cell 76:969-976.
17. Shlomchik, M. J., M. P. Madaio, D. Ni, M. Trounstein, and D. Huszar. 1994. The role of
B cells in lpr/lpr-induced autoimmunity. J Exp Med 180:1295-1306.
18. Reap, E. A., D. Leslie, M. Abrahams, R. A. Eisenberg, and P. L. Cohen. 1995.
Apoptosis abnormalities of splenic lymphocytes in autoimmune lpr and gld mice. J
Immunol 154:936-943.
135
19. Mogil, R. J., L. Radvanyi, R. Gonzalez-Quintial, R. Miller, G. Mills, A. N.
Theofilopoulos, and D. R. Green. 1995. Fas (CD95) participates in peripheral T cell
deletion and associated apoptosis in vivo. Int Immunol 7:1451-1458.
20. Landolfi, M. M., N. Van Houten, J. Q. Russell, R. Scollay, J. R. Parnes, and R. C. Budd.
1993. CD2-CD4-CD8- lymph node T lymphocytes in MRL lpr/lpr mice are derived
from a CD2+CD4+CD8+ thymic precursor. J Immunol 151:1086-1096.
21. Russell, J. H., B. Rush, C. Weaver, and R. Wang. 1993. Mature T cells of autoimmune
lpr/lpr mice have a defect in antigen-stimulated suicide. Proc Natl Acad Sci U S A
90:4409-4413.
22. Koppi, T. A., T. Tough-Bement, D. M. Lewinsohn, D. H. Lynch, and M. R. Alderson.
1997. CD40 ligand inhibits Fas/CD95-mediated apoptosis of human blood-derived
dendritic cells. Eur J Immunol 27:3161-3165.
23. Kelley, V. E., and J. B. Roths. 1985. Interaction of mutant lpr gene with background
strain influences renal disease. Clin Immunol Immunopathol 37:220-229.
24. Ichii, O., A. Konno, N. Sasaki, D. Endoh, Y. Hashimoto, and Y. Kon. 2008. Altered
balance of inhibitory and active Fc gamma receptors in murine autoimmune
glomerulonephritis. Kidney Int 74:339-347.
25. Vidal, S., D. H. Kono, and A. N. Theofilopoulos. 1998. Loci predisposing to
autoimmunity in MRL-Fas lpr and C57BL/6-Faslpr mice. J Clin Invest 101:696-702.
26. Santiago-Raber, M. L., M. K. Haraldsson, A. N. Theofilopoulos, and D. H. Kono. 2007.
Characterization of reciprocal Lmb1-4 interval MRL-Faslpr and C57BL/6-Faslpr
congenic mice reveals significant effects from Lmb3. J Immunol 178:8195-8202.
27. Haraldsson, M. K., C. A. Louis-Dit-Sully, B. R. Lawson, G. Sternik, M. L. Santiago-
Raber, N. R. Gascoigne, A. N. Theofilopoulos, and D. H. Kono. 2008. The lupus-related
Lmb3 locus contains a disease-suppressing Coronin-1A gene mutation. Immunity 28:40-
51.
28. Teachey, D. T., A. E. Seif, and S. A. Grupp. Advances in the management and
understanding of autoimmune lymphoproliferative syndrome (ALPS). Br J Haematol
148:205-216.
29. Maibaum, M. A., M. E. Haywood, M. J. Walport, and B. J. Morley. 2000. Lupus
susceptibility loci map within regions of BXSB derived from the SB/Le parental strain.
Immunogenetics 51:370-372.
30. Murphy, E. D., and J. B. Roths. 1979. A Y chromosome associated factor in strain
BXSB producing accelerated autoimmunity and lymphoproliferation. Arthritis Rheum
22:1188-1194.
31. Hudgins, C. C., R. T. Steinberg, D. M. Klinman, M. J. Reeves, and A. D. Steinberg.
1985. Studies of consomic mice bearing the Y chromosome of the BXSB mouse. J
Immunol 134:3849-3854.
32. Izui, S., M. Higaki, D. Morrow, and R. Merino. 1988. The Y chromosome from
autoimmune BXSB/MpJ mice induces a lupus-like syndrome in (NZW x C57BL/6)F1
male mice, but not in C57BL/6 male mice. Eur J Immunol 18:911-915.
33. Merino, R., T. Shibata, S. De Kossodo, and S. Izui. 1989. Differential effect of the
autoimmune Yaa and lpr genes on the acceleration of lupus-like syndrome in MRL/MpJ
mice. Eur J Immunol 19:2131-2137.
136
34. Pisitkun, P., J. A. Deane, M. J. Difilippantonio, T. Tarasenko, A. B. Satterthwaite, and S.
Bolland. 2006. Autoreactive B cell responses to RNA-related antigens due to TLR7 gene
duplication. Science 312:1669-1672.
35. Subramanian, S., K. Tus, Q. Z. Li, A. Wang, X. H. Tian, J. Zhou, C. Liang, G. Bartov,
L. D. McDaniel, X. J. Zhou, R. A. Schultz, and E. K. Wakeland. 2006. A Tlr7
translocation accelerates systemic autoimmunity in murine lupus. Proc Natl Acad Sci U
S A 103:9970-9975.
36. Deane, J. A., P. Pisitkun, R. S. Barrett, L. Feigenbaum, T. Town, J. M. Ward, R. A.
Flavell, and S. Bolland. 2007. Control of toll-like receptor 7 expression is essential to
restrict autoimmunity and dendritic cell proliferation. Immunity 27:801-810.
37. Santiago-Raber, M. L., S. Kikuchi, P. Borel, S. Uematsu, S. Akira, B. L. Kotzin, and S.
Izui. 2008. Evidence for genes in addition to Tlr7 in the Yaa translocation linked with
acceleration of systemic lupus erythematosus. J Immunol 181:1556-1562.
38. Fairhurst, A. M., S. H. Hwang, A. Wang, X. H. Tian, C. Boudreaux, X. J. Zhou, J.
Casco, Q. Z. Li, J. E. Connolly, and E. K. Wakeland. 2008. Yaa autoimmune phenotypes
are conferred by overexpression of TLR7. Eur J Immunol 38:1971-1978.
39. Hogarth, M. B., J. H. Slingsby, P. J. Allen, E. M. Thompson, P. Chandler, K. A. Davies,
E. Simpson, B. J. Morley, and M. J. Walport. 1998. Multiple lupus susceptibility loci
map to chromosome 1 in BXSB mice. J Immunol 161:2753-2761.
40. Haywood, M. E., M. B. Hogarth, J. H. Slingsby, S. J. Rose, P. J. Allen, E. M.
Thompson, M. A. Maibaum, P. Chandler, K. A. Davies, E. Simpson, M. J. Walport, and
B. J. Morley. 2000. Identification of intervals on chromosomes 1, 3, and 13 linked to the
development of lupus in BXSB mice. Arthritis Rheum 43:349-355.
41. Haywood, M. E., N. J. Rogers, S. J. Rose, J. Boyle, A. McDermott, J. M. Rankin, V.
Thiruudaian, M. R. Lewis, L. Fossati-Jimack, S. Izui, M. J. Walport, and B. J. Morley.
2004. Dissection of BXSB lupus phenotype using mice congenic for chromosome 1
demonstrates that separate intervals direct different aspects of disease. J Immunol
173:4277-4285.
42. Haywood, M. E., L. Gabriel, S. J. Rose, N. J. Rogers, S. Izui, and B. J. Morley. 2007.
BXSB/long-lived is a recombinant inbred strain containing powerful disease suppressor
loci. J Immunol 179:2428-2434.
43. Haywood, M. E., T. J. Vyse, A. McDermott, E. M. Thompson, A. Ida, M. J. Walport, S.
Izui, and B. J. Morley. 2001. Autoantigen glycoprotein 70 expression is regulated by a
single locus, which acts as a checkpoint for pathogenic anti-glycoprotein 70
autoantibody production and hence for the corresponding development of severe
nephritis, in lupus-prone PXSB mice. J Immunol 167:1728-1733.
44. Santiago, M. L., C. Mary, D. Parzy, C. Jacquet, X. Montagutelli, R. M. Parkhouse, R.
Lemoine, S. Izui, and L. Reininger. 1998. Linkage of a major quantitative trait locus to
Yaa gene-induced lupus-like nephritis in (NZW x C57BL/6)F1 mice. Eur J Immunol
28:4257-4267.
45. Oliver, P. L., and J. P. Stoye. 1999. Genetic analysis of Gv1, a gene controlling
transcription of endogenous murine polytropic proviruses. J Virol 73:8227-8234.
46. Munoz, L. E., K. Lauber, M. Schiller, A. A. Manfredi, and M. Herrmann. The role of
defective clearance of apoptotic cells in systemic autoimmunity. Nat Rev Rheumatol
6:280-289.
137
47. Bielschowsky, M., and C. M. Goodall. 1970. Origin of inbred NZ mouse strains. Cancer
Res 30:834-836.
48. Chiang, B. L., E. Bearer, A. Ansari, K. Dorshkind, and M. E. Gershwin. 1990. The
BM12 mutation and autoantibodies to dsDNA in NZB.H-2bm12 mice. J Immunol
145:94-101.
49. Drake, C. G., S. K. Babcock, E. Palmer, and B. L. Kotzin. 1994. Genetic analysis of the
NZB contribution to lupus-like autoimmune disease in (NZB x NZW)F1 mice. Proc
Natl Acad Sci U S A 91:4062-4066.
50. Rudofsky, U. H., B. D. Evans, S. L. Balaban, V. D. Mottironi, and A. E. Gabrielsen.
1993. Differences in expression of lupus nephritis in New Zealand mixed H-2z
homozygous inbred strains of mice derived from New Zealand black and New Zealand
white mice. Origins and initial characterization. Lab Invest 68:419-426.
51. Morel, L., U. H. Rudofsky, J. A. Longmate, J. Schiffenbauer, and E. K. Wakeland. 1994.
Polygenic control of susceptibility to murine systemic lupus erythematosus. Immunity
1:219-229.
52. Waters, S. T., S. M. Fu, F. Gaskin, U. S. Deshmukh, S. S. Sung, C. C. Kannapell, K. S.
Tung, S. B. McEwen, and M. McDuffie. 2001. NZM2328: a new mouse model of
systemic lupus erythematosus with unique genetic susceptibility loci. Clin Immunol
100:372-383.
53. Mohan, C., L. Morel, P. Yang, and E. K. Wakeland. 1997. Genetic dissection of
systemic lupus erythematosus pathogenesis: Sle2 on murine chromosome 4 leads to B
cell hyperactivity. J Immunol 159:454-465.
54. Morel, L., C. Mohan, Y. Yu, B. P. Croker, N. Tian, A. Deng, and E. K. Wakeland. 1997.
Functional dissection of systemic lupus erythematosus using congenic mouse strains. J
Immunol 158:6019-6028.
55. Mohan, C., E. Alas, L. Morel, P. Yang, and E. K. Wakeland. 1998. Genetic dissection of
SLE pathogenesis. Sle1 on murine chromosome 1 leads to a selective loss of tolerance to
H2A/H2B/DNA subnucleosomes. J Clin Invest 101:1362-1372.
56. Mohan, C., Y. Yu, L. Morel, P. Yang, and E. K. Wakeland. 1999. Genetic dissection of
Sle pathogenesis: Sle3 on murine chromosome 7 impacts T cell activation,
differentiation, and cell death. J Immunol 162:6492-6502.
57. Sobel, E. S., C. Mohan, L. Morel, J. Schiffenbauer, and E. K. Wakeland. 1999. Genetic
dissection of SLE pathogenesis: adoptive transfer of Sle1 mediates the loss of tolerance
by bone marrow-derived B cells. J Immunol 162:2415-2421.
58. Sobel, E. S., L. Morel, R. Baert, C. Mohan, J. Schiffenbauer, and E. K. Wakeland. 2002.
Genetic dissection of systemic lupus erythematosus pathogenesis: evidence for
functional expression of Sle3/5 by non-T cells. J Immunol 169:4025-4032.
59. Sobel, E. S., M. Satoh, Y. Chen, E. K. Wakeland, and L. Morel. 2002. The major murine
systemic lupus erythematosus susceptibility locus Sle1 results in abnormal functions of
both B and T cells. J Immunol 169:2694-2700.
60. Xu, Z., B. Duan, B. P. Croker, E. K. Wakeland, and L. Morel. 2005. Genetic dissection
of the murine lupus susceptibility locus Sle2: contributions to increased peritoneal B-1a
cells and lupus nephritis map to different loci. J Immunol 175:936-943.
61. Chen, Y., D. Perry, S. A. Boackle, E. S. Sobel, H. Molina, B. P. Croker, and L. Morel.
2005. Several genes contribute to the production of autoreactive B and T cells in the
murine lupus susceptibility locus Sle1c. J Immunol 175:1080-1089.
138
62. Morel, L., X. H. Tian, B. P. Croker, and E. K. Wakeland. 1999. Epistatic modifiers of
autoimmunity in a murine model of lupus nephritis. Immunity 11:131-139.
63. Subramanian, S., Y. S. Yim, K. Liu, K. Tus, X. J. Zhou, and E. K. Wakeland. 2005.
Epistatic suppression of systemic lupus erythematosus: fine mapping of Sles1 to less
than 1 mb. J Immunol 175:1062-1072.
64. Drake, C. G., S. J. Rozzo, T. J. Vyse, E. Palmer, and B. L. Kotzin. 1995. Genetic
contributions to lupus-like disease in (NZB x NZW)F1 mice. Immunol Rev 144:51-74.
65. Drake, C. G., S. J. Rozzo, H. F. Hirschfeld, N. P. Smarnworawong, E. Palmer, and B. L.
Kotzin. 1995. Analysis of the New Zealand Black contribution to lupus-like renal
disease. Multiple genes that operate in a threshold manner. J Immunol 154:2441-2447.
66. Wither, J. E., A. D. Paterson, and B. Vukusic. 2000. Genetic dissection of B cell traits in
New Zealand black mice. The expanded population of B cells expressing up-regulated
costimulatory molecules shows linkage to Nba2. Eur J Immunol 30:356-365.
67. Cheung, Y. H., C. Loh, E. Pau, J. Kim, and J. Wither. 2009. Insights into the genetic
basis and immunopathogenesis of systemic lupus erythematosus from the study of
mouse models. Semin Immunol 21:372-382.
68. Kono, D. H., and A. N. Theofilopoulos. 2006. Genetics of SLE in mice. Springer Semin
Immunopathol 28:83-96.
69. Morel, L. Genetics of SLE: evidence from mouse models. Nat Rev Rheumatol 6:348-
357.
70. Vyse, T. J., S. J. Rozzo, C. G. Drake, S. Izui, and B. L. Kotzin. 1997. Control of
multiple autoantibodies linked with a lupus nephritis susceptibility locus in New Zealand
black mice. J Immunol 158:5566-5574.
71. Ichii, O., A. Konno, N. Sasaki, D. Endoh, Y. Hashimoto, and Y. Kon. 2008.
Autoimmune glomerulonephritis induced in congenic mouse strain carrying telomeric
region of chromosome 1 derived from MRL/MpJ. Histol Histopathol 23:411-422.
72. Morel, L., K. R. Blenman, B. P. Croker, and E. K. Wakeland. 2001. The major murine
systemic lupus erythematosus susceptibility locus, Sle1, is a cluster of functionally
related genes. Proc Natl Acad Sci U S A 98:1787-1792.
73. Rozzo, S. J., J. D. Allard, D. Choubey, T. J. Vyse, S. Izui, G. Peltz, and B. L. Kotzin.
2001. Evidence for an interferon-inducible gene, Ifi202, in the susceptibility to systemic
lupus. Immunity 15:435-443.
74. Wither, J. E., G. Lajoie, S. Heinrichs, Y. C. Cai, N. Chang, A. Ciofani, Y. H. Cheung,
and R. MacLeod. 2003. Functional dissection of lupus susceptibility loci on the New
Zealand black mouse chromosome 1: evidence for independent genetic loci affecting T
and B cell activation. J Immunol 171:1697-1706.
75. Morel, L., Y. Yu, K. R. Blenman, R. A. Caldwell, and E. K. Wakeland. 1996.
Production of congenic mouse strains carrying genomic intervals containing SLE-
susceptibility genes derived from the SLE-prone NZM2410 strain. Mamm Genome
7:335-339.
76. Mohan, C., L. Morel, P. Yang, and E. K. Wakeland. 1998. Accumulation of splenic B1a
cells with potent antigen-presenting capability in NZM2410 lupus-prone mice. Arthritis
Rheum 41:1652-1662.
77. Jones, H. C., B. J. Carter, J. S. Depelteau, M. Roman, and L. Morel. 2001. Chromosomal
linkage associated with disease severity in the hydrocephalic H-Tx rat. Behav Genet
31:101-111.
139
78. Boackle, S. A., V. M. Holers, X. Chen, G. Szakonyi, D. R. Karp, E. K. Wakeland, and
L. Morel. 2001. Cr2, a candidate gene in the murine Sle1c lupus susceptibility locus,
encodes a dysfunctional protein. Immunity 15:775-785.
79. Morra, M., R. A. Barrington, A. C. Abadia-Molina, S. Okamoto, A. Julien, C. Gullo, A.
Kalsy, M. J. Edwards, G. Chen, R. Spolski, W. J. Leonard, B. T. Huber, P. Borrow, C.
A. Biron, A. R. Satoskar, M. C. Carroll, and C. Terhorst. 2005. Defective B cell
responses in the absence of SH2D1A. Proc Natl Acad Sci U S A 102:4819-4823.
80. Cuda, C. M., S. Wan, E. S. Sobel, B. P. Croker, and L. Morel. 2007. Murine lupus
susceptibility locus Sle1a controls regulatory T cell number and function through
multiple mechanisms. J Immunol 179:7439-7447.
81. Rahman, Z. S., H. Niu, D. Perry, E. Wakeland, T. Manser, and L. Morel. 2007.
Expression of the autoimmune Fcgr2b NZW allele fails to be upregulated in germinal
center B cells and is associated with increased IgG production. Genes Immun 8:604-612.
82. Cuda, C. M., L. Zeumer, E. S. Sobel, B. P. Croker, and L. Morel. Murine lupus
susceptibility locus Sle1a requires the expression of two sub-loci to induce inflammatory
T cells. Genes Immun 11:542-553.
83. Cuda, C. M., S. Li, S. Liang, Y. Yin, H. H. Potula, Z. Xu, M. Sengupta, Y. Chen, E.
Butfiloski, H. Baker, L. J. Chang, I. Dozmorov, E. S. Sobel, and L. Morel. Pre-B cell
leukemia homeobox 1 is associated with lupus susceptibility in mice and humans. J
Immunol 188:604-614.
84. Kumar, K. R., L. Li, M. Yan, M. Bhaskarabhatla, A. B. Mobley, C. Nguyen, J. M.
Mooney, J. D. Schatzle, E. K. Wakeland, and C. Mohan. 2006. Regulation of B cell
tolerance by the lupus susceptibility gene Ly108. Science 312:1665-1669.
85. Wandstrat, A. E., C. Nguyen, N. Limaye, A. Y. Chan, S. Subramanian, X. H. Tian, Y. S.
Yim, A. Pertsemlidis, H. R. Garner, Jr., L. Morel, and E. K. Wakeland. 2004.
Association of extensive polymorphisms in the SLAM/CD2 gene cluster with murine
lupus. Immunity 21:769-780.
86. Keszei, M., C. Detre, S. T. Rietdijk, P. Munoz, X. Romero, S. B. Berger, S. Calpe, G.
Liao, W. Castro, A. Julien, Y. Y. Wu, D. M. Shin, J. Sancho, M. Zubiaur, H. C. Morse,
3rd, L. Morel, P. Engel, N. Wang, and C. Terhorst. A novel isoform of the Ly108 gene
ameliorates murine lupus. J Exp Med 208:811-822.
87. Wong, E. B., C. Soni, A. Y. Chan, P. P. Domeier, Shwetank, T. Abraham, N. Limaye, T.
N. Khan, M. J. Elias, S. B. Chodisetti, E. K. Wakeland, and Z. S. Rahman. B Cell-
Intrinsic CD84 and Ly108 Maintain Germinal Center B Cell Tolerance. J Immunol
194:4130-4143.
88. Perry, D. J., Y. Yin, T. Telarico, H. V. Baker, I. Dozmorov, A. Perl, and L. Morel.
Murine lupus susceptibility locus Sle1c2 mediates CD4+ T cell activation and maps to
estrogen-related receptor gamma. J Immunol 189:793-803.
89. Gubbels, M. R., T. N. Jorgensen, T. E. Metzger, K. Menze, H. Steele, S. A. Flannery, S.
J. Rozzo, and B. L. Kotzin. 2005. Effects of MHC and gender on lupus-like
autoimmunity in Nba2 congenic mice. J Immunol 175:6190-6196.
90. Jorgensen, T. N., E. Roper, J. M. Thurman, P. Marrack, and B. L. Kotzin. 2007. Type I
interferon signaling is involved in the spontaneous development of lupus-like disease in
B6.Nba2 and (B6.Nba2 x NZW)F(1) mice. Genes Immun 8:653-662.
91. Jorgensen, T. N., J. Alfaro, H. L. Enriquez, C. Jiang, W. M. Loo, S. Atencio, M. R.
Bupp, C. M. Mailloux, T. Metzger, S. Flannery, S. J. Rozzo, B. L. Kotzin, M.
140
Rosemblatt, M. R. Bono, and L. D. Erickson. Development of murine lupus involves the
combined genetic contribution of the SLAM and FcgammaR intervals within the Nba2
autoimmune susceptibility locus. J Immunol 184:775-786.
92. Zimmerman, M., D. Yang, X. Hu, F. Liu, N. Singh, D. Browning, V. Ganapathy, P.
Chandler, D. Choubey, S. I. Abrams, and K. Liu. IFN-gamma upregulates survivin and
Ifi202 expression to induce survival and proliferation of tumor-specific T cells. PLoS
One 5:e14076.
93. Cheung, Y. H., N. H. Chang, Y. C. Cai, G. Bonventi, R. MacLeod, and J. E. Wither.
2005. Functional interplay between intrinsic B and T cell defects leads to amplification
of autoimmune disease in New Zealand black chromosome 1 congenic mice. J Immunol
175:8154-8164.
94. Cheung, Y. H., C. Landolt-Marticorena, G. Lajoie, and J. E. Wither. The lupus
phenotype in B6.NZBc1 congenic mice reflects interactions between multiple
susceptibility loci and a suppressor locus. Genes Immun 12:251-262.
95. Jiang, Y., S. Hirose, R. Sanokawa-Akakura, M. Abe, X. Mi, N. Li, Y. Miura, J. Shirai,
D. Zhang, Y. Hamano, and T. Shirai. 1999. Genetically determined aberrant down-
regulation of FcgammaRIIB1 in germinal center B cells associated with hyper-IgG and
IgG autoantibodies in murine systemic lupus erythematosus. Int Immunol 11:1685-1691.
96. Pritchard, N. R., A. J. Cutler, S. Uribe, S. J. Chadban, B. J. Morley, and K. G. Smith.
2000. Autoimmune-prone mice share a promoter haplotype associated with reduced
expression and function of the Fc receptor FcgammaRII. Curr Biol 10:227-230.
97. Ravetch, J. V., and S. Bolland. 2001. IgG Fc receptors. Annu Rev Immunol 19:275-290.
98. Chen, Y., C. Cuda, and L. Morel. 2005. Genetic determination of T cell help in loss of
tolerance to nuclear antigens. J Immunol 174:7692-7702.
99. Calpe, S., N. Wang, X. Romero, S. B. Berger, A. Lanyi, P. Engel, and C. Terhorst. 2008.
The SLAM and SAP gene families control innate and adaptive immune responses. Adv
Immunol 97:177-250.
100. Detre, C., M. Keszei, X. Romero, G. C. Tsokos, and C. Terhorst. SLAM family
receptors and the SLAM-associated protein (SAP) modulate T cell functions. Semin
Immunopathol 32:157-171.
101. Vinuesa, C. G., M. A. Linterman, C. C. Goodnow, and K. L. Randall. T cells and
follicular dendritic cells in germinal center B-cell formation and selection. Immunol Rev
237:72-89.
102. Davis, S. J., and P. A. van der Merwe. 1996. The structure and ligand interactions of
CD2: implications for T-cell function. Immunol Today 17:177-187.
103. Engel, P., M. J. Eck, and C. Terhorst. 2003. The SAP and SLAM families in immune
responses and X-linked lymphoproliferative disease. Nat Rev Immunol 3:813-821.
104. Veillette, A. 2006. Immune regulation by SLAM family receptors and SAP-related
adaptors. Nat Rev Immunol 6:56-66.
105. Ma, C. S., K. E. Nichols, and S. G. Tangye. 2007. Regulation of cellular and humoral
immune responses by the SLAM and SAP families of molecules. Annu Rev Immunol
25:337-379.
106. Martin, M., X. Romero, M. A. de la Fuente, V. Tovar, N. Zapater, E. Esplugues, P.
Pizcueta, J. Bosch, and P. Engel. 2001. CD84 functions as a homophilic adhesion
molecule and enhances IFN-gamma secretion: adhesion is mediated by Ig-like domain 1.
J Immunol 167:3668-3676.
141
107. Flaig, R. M., S. Stark, and C. Watzl. 2004. Cutting edge: NTB-A activates NK cells via
homophilic interaction. J Immunol 172:6524-6527.
108. Cao, E., U. A. Ramagopal, A. Fedorov, E. Fedorov, Q. Yan, J. W. Lary, J. L. Cole, S. G.
Nathenson, and S. C. Almo. 2006. NTB-A receptor crystal structure: insights into
homophilic interactions in the signaling lymphocytic activation molecule receptor
family. Immunity 25:559-570.
109. Falco, M., E. Marcenaro, E. Romeo, F. Bellora, D. Marras, F. Vely, G. Ferracci, L.
Moretta, A. Moretta, and C. Bottino. 2004. Homophilic interaction of NTBA, a member
of the CD2 molecular family: induction of cytotoxicity and cytokine release in human
NK cells. Eur J Immunol 34:1663-1672.
110. Kumaresan, P. R., W. C. Lai, S. S. Chuang, M. Bennett, and P. A. Mathew. 2002. CS1, a
novel member of the CD2 family, is homophilic and regulates NK cell function. Mol
Immunol 39:1-8.
111. Mavaddat, N., D. W. Mason, P. D. Atkinson, E. J. Evans, R. J. Gilbert, D. I. Stuart, J. A.
Fennelly, A. N. Barclay, S. J. Davis, and M. H. Brown. 2000. Signaling lymphocytic
activation molecule (CDw150) is homophilic but self-associates with very low affinity. J
Biol Chem 275:28100-28109.
112. Veillette, A., Z. Dong, L. A. Perez-Quintero, M. C. Zhong, and M. E. Cruz-Munoz.
2009. Importance and mechanism of 'switch' function of SAP family adapters. Immunol
Rev 232:229-239.
113. Wang, A., F. Batteux, and E. K. Wakeland. The role of SLAM/CD2 polymorphisms in
systemic autoimmunity. Curr Opin Immunol 22:706-714.
114. Peck, S. R., and H. E. Ruley. 2000. Ly108: a new member of the mouse CD2 family of
cell surface proteins. Immunogenetics 52:63-72.
115. Zhong, M. C., and A. Veillette. 2008. Control of T lymphocyte signaling by Ly108, a
signaling lymphocytic activation molecule family receptor implicated in autoimmunity.
J Biol Chem 283:19255-19264.
116. Jining, L., I. Makagiansar, H. Yusuf-Makagiansar, V. T. Chow, T. J. Siahaan, and S. D.
Jois. 2004. Design, structure and biological activity of beta-turn peptides of CD2 protein
for inhibition of T-cell adhesion. Eur J Biochem 271:2873-2886.
117. Veillette, A. SLAM-family receptors: immune regulators with or without SAP-family
adaptors. Cold Spring Harb Perspect Biol 2:a002469.
118. Schwartzberg, P. L., K. L. Mueller, H. Qi, and J. L. Cannons. 2009. SLAM receptors
and SAP influence lymphocyte interactions, development and function. Nat Rev
Immunol 9:39-46.
119. Wu, C., J. Sayos, N. Wang, D. Howie, A. Coyle, and C. Terhorst. 2000. Genomic
organization and characterization of mouse SAP, the gene that is altered in X-linked
lymphoproliferative disease. Immunogenetics 51:805-815.
120. Nagy, N., C. Cerboni, K. Mattsson, A. Maeda, P. Gogolak, J. Sumegi, A. Lanyi, L.
Szekely, E. Carbone, G. Klein, and E. Klein. 2000. SH2D1A and SLAM protein
expression in human lymphocytes and derived cell lines. Int J Cancer 88:439-447.
121. Tangye, S. G., S. Lazetic, E. Woollatt, G. R. Sutherland, L. L. Lanier, and J. H. Phillips.
1999. Cutting edge: human 2B4, an activating NK cell receptor, recruits the protein
tyrosine phosphatase SHP-2 and the adaptor signaling protein SAP. J Immunol
162:6981-6985.
142
122. Latour, S., G. Gish, C. D. Helgason, R. K. Humphries, T. Pawson, and A. Veillette.
2001. Regulation of SLAM-mediated signal transduction by SAP, the X-linked
lymphoproliferative gene product. Nat Immunol 2:681-690.
123. Cannons, J. L., J. Z. Wu, J. Gomez-Rodriguez, J. Zhang, B. Dong, Y. Liu, S. Shaw, K.
A. Siminovitch, and P. L. Schwartzberg. Biochemical and genetic evidence for a SAP-
PKC-theta interaction contributing to IL-4 regulation. J Immunol 185:2819-2827.
124. Coffey, A. J., R. A. Brooksbank, O. Brandau, T. Oohashi, G. R. Howell, J. M. Bye, A.
P. Cahn, J. Durham, P. Heath, P. Wray, R. Pavitt, J. Wilkinson, M. Leversha, E. Huckle,
C. J. Shaw-Smith, A. Dunham, S. Rhodes, V. Schuster, G. Porta, L. Yin, P. Serafini, B.
Sylla, M. Zollo, B. Franco, A. Bolino, M. Seri, A. Lanyi, J. R. Davis, D. Webster, A.
Harris, G. Lenoir, G. de St Basile, A. Jones, B. H. Behloradsky, H. Achatz, J. Murken,
R. Fassler, J. Sumegi, G. Romeo, M. Vaudin, M. T. Ross, A. Meindl, and D. R. Bentley.
1998. Host response to EBV infection in X-linked lymphoproliferative disease results
from mutations in an SH2-domain encoding gene. Nat Genet 20:129-135.
125. Wu, C., K. B. Nguyen, G. C. Pien, N. Wang, C. Gullo, D. Howie, M. R. Sosa, M. J.
Edwards, P. Borrow, A. R. Satoskar, A. H. Sharpe, C. A. Biron, and C. Terhorst. 2001.
SAP controls T cell responses to virus and terminal differentiation of TH2 cells. Nat
Immunol 2:410-414.
126. Czar, M. J., E. N. Kersh, L. A. Mijares, G. Lanier, J. Lewis, G. Yap, A. Chen, A. Sher,
C. S. Duckett, R. Ahmed, and P. L. Schwartzberg. 2001. Altered lymphocyte responses
and cytokine production in mice deficient in the X-linked lymphoproliferative disease
gene SH2D1A/DSHP/SAP. Proc Natl Acad Sci U S A 98:7449-7454.
127. Roncagalli, R., J. E. Taylor, S. Zhang, X. Shi, R. Chen, M. E. Cruz-Munoz, L. Yin, S.
Latour, and A. Veillette. 2005. Negative regulation of natural killer cell function by
EAT-2, a SAP-related adaptor. Nat Immunol 6:1002-1010.
128. Guselnikov, S. V., P. P. Laktionov, A. M. Najakshin, K. O. Baranov, and A. V. Taranin.
Expansion and diversification of the signaling capabilities of the CD2/SLAM family in
Xenopodinae amphibians. Immunogenetics 63:679-689.
129. Mathew, S. O., P. R. Kumaresan, J. K. Lee, V. T. Huynh, and P. A. Mathew. 2005.
Mutational analysis of the human 2B4 (CD244)/CD48 interaction: Lys68 and Glu70 in
the V domain of 2B4 are critical for CD48 binding and functional activation of NK cells.
J Immunol 175:1005-1013.
130. Cruz-Munoz, M. E., Z. Dong, X. Shi, S. Zhang, and A. Veillette. 2009. Influence of
CRACC, a SLAM family receptor coupled to the adaptor EAT-2, on natural killer cell
function. Nat Immunol 10:297-305.
131. Banchereau, J., F. Briere, C. Caux, J. Davoust, S. Lebecque, Y. J. Liu, B. Pulendran, and
K. Palucka. 2000. Immunobiology of dendritic cells. Annu Rev Immunol 18:767-811.
132. Banchereau, J., and R. M. Steinman. 1998. Dendritic cells and the control of immunity.
Nature 392:245-252.
133. Palucka, A. K., J. Banchereau, P. Blanco, and V. Pascual. 2002. The interplay of
dendritic cell subsets in systemic lupus erythematosus. Immunol Cell Biol 80:484-488.
134. Heath, W. R., and F. R. Carbone. 2001. Cross-presentation, dendritic cells, tolerance and
immunity. Annu Rev Immunol 19:47-64.
135. Huang, F. P., N. Platt, M. Wykes, J. R. Major, T. J. Powell, C. D. Jenkins, and G. G.
MacPherson. 2000. A discrete subpopulation of dendritic cells transports apoptotic
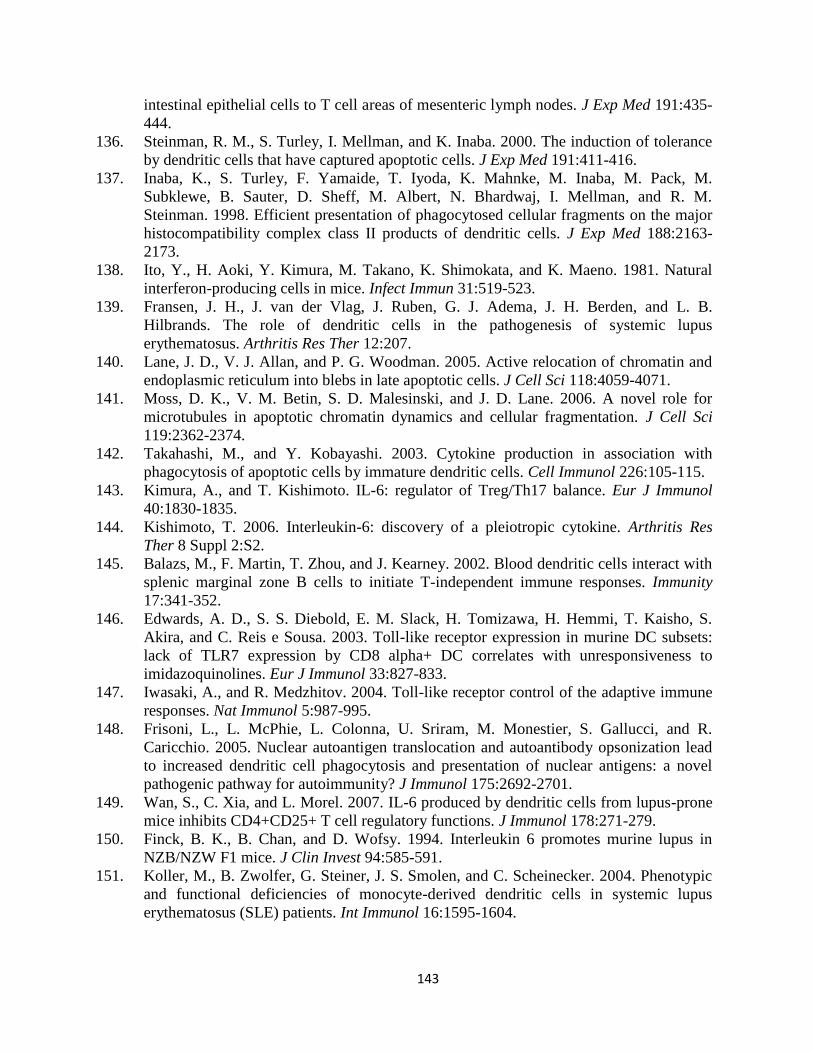
143
intestinal epithelial cells to T cell areas of mesenteric lymph nodes. J Exp Med 191:435-
444.
136. Steinman, R. M., S. Turley, I. Mellman, and K. Inaba. 2000. The induction of tolerance
by dendritic cells that have captured apoptotic cells. J Exp Med 191:411-416.
137. Inaba, K., S. Turley, F. Yamaide, T. Iyoda, K. Mahnke, M. Inaba, M. Pack, M.
Subklewe, B. Sauter, D. Sheff, M. Albert, N. Bhardwaj, I. Mellman, and R. M.
Steinman. 1998. Efficient presentation of phagocytosed cellular fragments on the major
histocompatibility complex class II products of dendritic cells. J Exp Med 188:2163-
2173.
138. Ito, Y., H. Aoki, Y. Kimura, M. Takano, K. Shimokata, and K. Maeno. 1981. Natural
interferon-producing cells in mice. Infect Immun 31:519-523.
139. Fransen, J. H., J. van der Vlag, J. Ruben, G. J. Adema, J. H. Berden, and L. B.
Hilbrands. The role of dendritic cells in the pathogenesis of systemic lupus
erythematosus. Arthritis Res Ther 12:207.
140. Lane, J. D., V. J. Allan, and P. G. Woodman. 2005. Active relocation of chromatin and
endoplasmic reticulum into blebs in late apoptotic cells. J Cell Sci 118:4059-4071.
141. Moss, D. K., V. M. Betin, S. D. Malesinski, and J. D. Lane. 2006. A novel role for
microtubules in apoptotic chromatin dynamics and cellular fragmentation. J Cell Sci
119:2362-2374.
142. Takahashi, M., and Y. Kobayashi. 2003. Cytokine production in association with
phagocytosis of apoptotic cells by immature dendritic cells. Cell Immunol 226:105-115.
143. Kimura, A., and T. Kishimoto. IL-6: regulator of Treg/Th17 balance. Eur J Immunol
40:1830-1835.
144. Kishimoto, T. 2006. Interleukin-6: discovery of a pleiotropic cytokine. Arthritis Res
Ther 8 Suppl 2:S2.
145. Balazs, M., F. Martin, T. Zhou, and J. Kearney. 2002. Blood dendritic cells interact with
splenic marginal zone B cells to initiate T-independent immune responses. Immunity
17:341-352.
146. Edwards, A. D., S. S. Diebold, E. M. Slack, H. Tomizawa, H. Hemmi, T. Kaisho, S.
Akira, and C. Reis e Sousa. 2003. Toll-like receptor expression in murine DC subsets:
lack of TLR7 expression by CD8 alpha+ DC correlates with unresponsiveness to
imidazoquinolines. Eur J Immunol 33:827-833.
147. Iwasaki, A., and R. Medzhitov. 2004. Toll-like receptor control of the adaptive immune
responses. Nat Immunol 5:987-995.
148. Frisoni, L., L. McPhie, L. Colonna, U. Sriram, M. Monestier, S. Gallucci, and R.
Caricchio. 2005. Nuclear autoantigen translocation and autoantibody opsonization lead
to increased dendritic cell phagocytosis and presentation of nuclear antigens: a novel
pathogenic pathway for autoimmunity? J Immunol 175:2692-2701.
149. Wan, S., C. Xia, and L. Morel. 2007. IL-6 produced by dendritic cells from lupus-prone
mice inhibits CD4+CD25+ T cell regulatory functions. J Immunol 178:271-279.
150. Finck, B. K., B. Chan, and D. Wofsy. 1994. Interleukin 6 promotes murine lupus in
NZB/NZW F1 mice. J Clin Invest 94:585-591.
151. Koller, M., B. Zwolfer, G. Steiner, J. S. Smolen, and C. Scheinecker. 2004. Phenotypic
and functional deficiencies of monocyte-derived dendritic cells in systemic lupus
erythematosus (SLE) patients. Int Immunol 16:1595-1604.
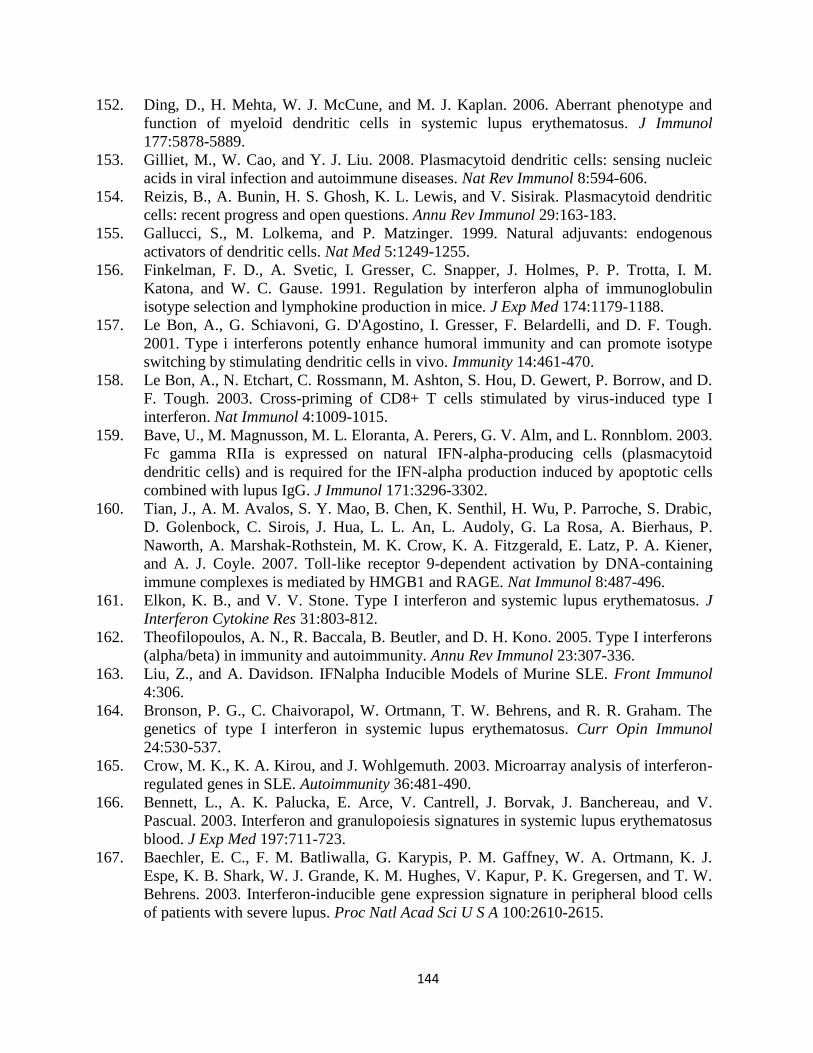
144
152. Ding, D., H. Mehta, W. J. McCune, and M. J. Kaplan. 2006. Aberrant phenotype and
function of myeloid dendritic cells in systemic lupus erythematosus. J Immunol
177:5878-5889.
153. Gilliet, M., W. Cao, and Y. J. Liu. 2008. Plasmacytoid dendritic cells: sensing nucleic
acids in viral infection and autoimmune diseases. Nat Rev Immunol 8:594-606.
154. Reizis, B., A. Bunin, H. S. Ghosh, K. L. Lewis, and V. Sisirak. Plasmacytoid dendritic
cells: recent progress and open questions. Annu Rev Immunol 29:163-183.
155. Gallucci, S., M. Lolkema, and P. Matzinger. 1999. Natural adjuvants: endogenous
activators of dendritic cells. Nat Med 5:1249-1255.
156. Finkelman, F. D., A. Svetic, I. Gresser, C. Snapper, J. Holmes, P. P. Trotta, I. M.
Katona, and W. C. Gause. 1991. Regulation by interferon alpha of immunoglobulin
isotype selection and lymphokine production in mice. J Exp Med 174:1179-1188.
157. Le Bon, A., G. Schiavoni, G. D'Agostino, I. Gresser, F. Belardelli, and D. F. Tough.
2001. Type i interferons potently enhance humoral immunity and can promote isotype
switching by stimulating dendritic cells in vivo. Immunity 14:461-470.
158. Le Bon, A., N. Etchart, C. Rossmann, M. Ashton, S. Hou, D. Gewert, P. Borrow, and D.
F. Tough. 2003. Cross-priming of CD8+ T cells stimulated by virus-induced type I
interferon. Nat Immunol 4:1009-1015.
159. Bave, U., M. Magnusson, M. L. Eloranta, A. Perers, G. V. Alm, and L. Ronnblom. 2003.
Fc gamma RIIa is expressed on natural IFN-alpha-producing cells (plasmacytoid
dendritic cells) and is required for the IFN-alpha production induced by apoptotic cells
combined with lupus IgG. J Immunol 171:3296-3302.
160. Tian, J., A. M. Avalos, S. Y. Mao, B. Chen, K. Senthil, H. Wu, P. Parroche, S. Drabic,
D. Golenbock, C. Sirois, J. Hua, L. L. An, L. Audoly, G. La Rosa, A. Bierhaus, P.
Naworth, A. Marshak-Rothstein, M. K. Crow, K. A. Fitzgerald, E. Latz, P. A. Kiener,
and A. J. Coyle. 2007. Toll-like receptor 9-dependent activation by DNA-containing
immune complexes is mediated by HMGB1 and RAGE. Nat Immunol 8:487-496.
161. Elkon, K. B., and V. V. Stone. Type I interferon and systemic lupus erythematosus. J
Interferon Cytokine Res 31:803-812.
162. Theofilopoulos, A. N., R. Baccala, B. Beutler, and D. H. Kono. 2005. Type I interferons
(alpha/beta) in immunity and autoimmunity. Annu Rev Immunol 23:307-336.
163. Liu, Z., and A. Davidson. IFNalpha Inducible Models of Murine SLE. Front Immunol
4:306.
164. Bronson, P. G., C. Chaivorapol, W. Ortmann, T. W. Behrens, and R. R. Graham. The
genetics of type I interferon in systemic lupus erythematosus. Curr Opin Immunol
24:530-537.
165. Crow, M. K., K. A. Kirou, and J. Wohlgemuth. 2003. Microarray analysis of interferon-
regulated genes in SLE. Autoimmunity 36:481-490.
166. Bennett, L., A. K. Palucka, E. Arce, V. Cantrell, J. Borvak, J. Banchereau, and V.
Pascual. 2003. Interferon and granulopoiesis signatures in systemic lupus erythematosus
blood. J Exp Med 197:711-723.
167. Baechler, E. C., F. M. Batliwalla, G. Karypis, P. M. Gaffney, W. A. Ortmann, K. J.
Espe, K. B. Shark, W. J. Grande, K. M. Hughes, V. Kapur, P. K. Gregersen, and T. W.
Behrens. 2003. Interferon-inducible gene expression signature in peripheral blood cells
of patients with severe lupus. Proc Natl Acad Sci U S A 100:2610-2615.
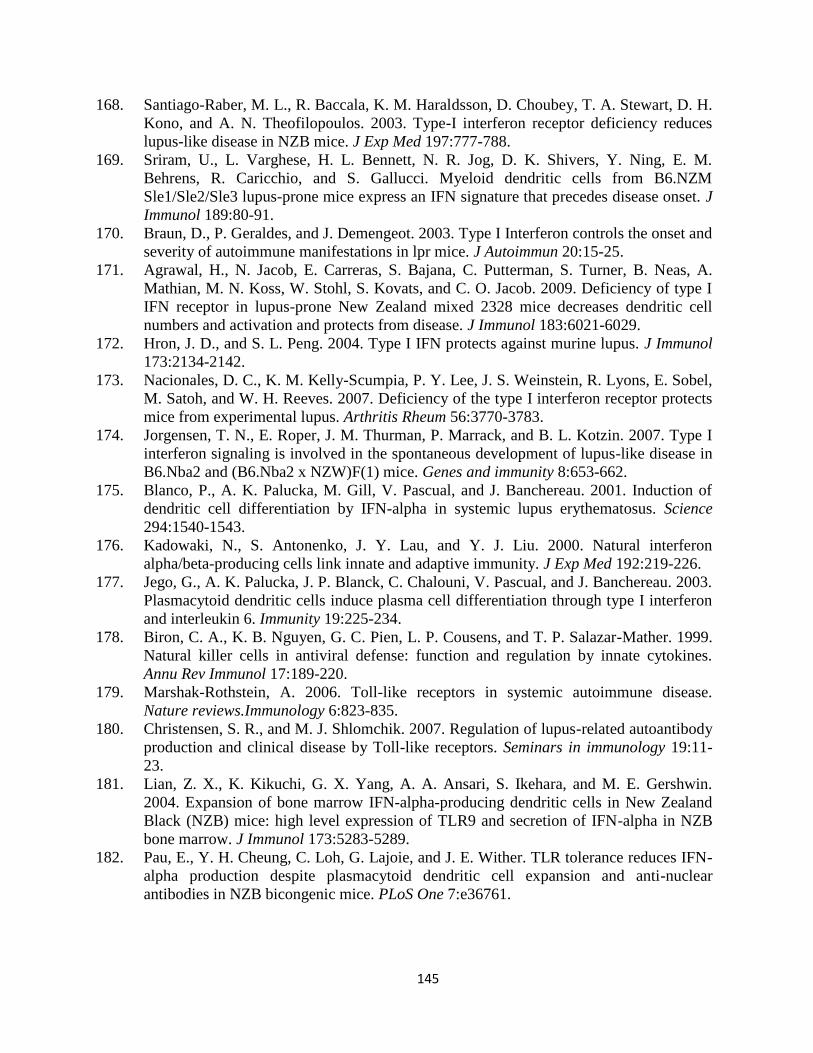
145
168. Santiago-Raber, M. L., R. Baccala, K. M. Haraldsson, D. Choubey, T. A. Stewart, D. H.
Kono, and A. N. Theofilopoulos. 2003. Type-I interferon receptor deficiency reduces
lupus-like disease in NZB mice. J Exp Med 197:777-788.
169. Sriram, U., L. Varghese, H. L. Bennett, N. R. Jog, D. K. Shivers, Y. Ning, E. M.
Behrens, R. Caricchio, and S. Gallucci. Myeloid dendritic cells from B6.NZM
Sle1/Sle2/Sle3 lupus-prone mice express an IFN signature that precedes disease onset. J
Immunol 189:80-91.
170. Braun, D., P. Geraldes, and J. Demengeot. 2003. Type I Interferon controls the onset and
severity of autoimmune manifestations in lpr mice. J Autoimmun 20:15-25.
171. Agrawal, H., N. Jacob, E. Carreras, S. Bajana, C. Putterman, S. Turner, B. Neas, A.
Mathian, M. N. Koss, W. Stohl, S. Kovats, and C. O. Jacob. 2009. Deficiency of type I
IFN receptor in lupus-prone New Zealand mixed 2328 mice decreases dendritic cell
numbers and activation and protects from disease. J Immunol 183:6021-6029.
172. Hron, J. D., and S. L. Peng. 2004. Type I IFN protects against murine lupus. J Immunol
173:2134-2142.
173. Nacionales, D. C., K. M. Kelly-Scumpia, P. Y. Lee, J. S. Weinstein, R. Lyons, E. Sobel,
M. Satoh, and W. H. Reeves. 2007. Deficiency of the type I interferon receptor protects
mice from experimental lupus. Arthritis Rheum 56:3770-3783.
174. Jorgensen, T. N., E. Roper, J. M. Thurman, P. Marrack, and B. L. Kotzin. 2007. Type I
interferon signaling is involved in the spontaneous development of lupus-like disease in
B6.Nba2 and (B6.Nba2 x NZW)F(1) mice. Genes and immunity 8:653-662.
175. Blanco, P., A. K. Palucka, M. Gill, V. Pascual, and J. Banchereau. 2001. Induction of
dendritic cell differentiation by IFN-alpha in systemic lupus erythematosus. Science
294:1540-1543.
176. Kadowaki, N., S. Antonenko, J. Y. Lau, and Y. J. Liu. 2000. Natural interferon
alpha/beta-producing cells link innate and adaptive immunity. J Exp Med 192:219-226.
177. Jego, G., A. K. Palucka, J. P. Blanck, C. Chalouni, V. Pascual, and J. Banchereau. 2003.
Plasmacytoid dendritic cells induce plasma cell differentiation through type I interferon
and interleukin 6. Immunity 19:225-234.
178. Biron, C. A., K. B. Nguyen, G. C. Pien, L. P. Cousens, and T. P. Salazar-Mather. 1999.
Natural killer cells in antiviral defense: function and regulation by innate cytokines.
Annu Rev Immunol 17:189-220.
179. Marshak-Rothstein, A. 2006. Toll-like receptors in systemic autoimmune disease.
Nature reviews.Immunology 6:823-835.
180. Christensen, S. R., and M. J. Shlomchik. 2007. Regulation of lupus-related autoantibody
production and clinical disease by Toll-like receptors. Seminars in immunology 19:11-
23.
181. Lian, Z. X., K. Kikuchi, G. X. Yang, A. A. Ansari, S. Ikehara, and M. E. Gershwin.
2004. Expansion of bone marrow IFN-alpha-producing dendritic cells in New Zealand
Black (NZB) mice: high level expression of TLR9 and secretion of IFN-alpha in NZB
bone marrow. J Immunol 173:5283-5289.
182. Pau, E., Y. H. Cheung, C. Loh, G. Lajoie, and J. E. Wither. TLR tolerance reduces IFN-
alpha production despite plasmacytoid dendritic cell expansion and anti-nuclear
antibodies in NZB bicongenic mice. PLoS One 7:e36761.
146
183. Pau, E., C. Loh, G. E. Minty, N. H. Chang, and J. E. Wither. 2013. Identification of a
lupus-susceptibility locus leading to impaired clearance of apoptotic debris on New
Zealand Black chromosome 13. Genes Immun.
184. Sang, A., Y. Y. Zheng, Y. Yin, I. Dozmorov, H. Li, H. C. Hsu, J. D. Mountz, and L.
Morel. Dysregulated cytokine production by dendritic cells modulates B cell responses
in the NZM2410 mouse model of lupus. PLoS One 9:e102151.
185. Teichmann, L. L., M. L. Ols, M. Kashgarian, B. Reizis, D. H. Kaplan, and M. J.
Shlomchik. Dendritic cells in lupus are not required for activation of T and B cells but
promote their expansion, resulting in tissue damage. Immunity 33:967-978.
186. Craft, J., S. Peng, T. Fujii, M. Okada, and S. Fatenejad. 1999. Autoreactive T cells in
murine lupus: origins and roles in autoantibody production. Immunol Res 19:245-257.
187. Hahn, B. H., R. R. Singh, B. P. Tsao, and F. M. Ebling. 1997. Peptides from Vh regions
of antibodies to DNA activate T cell help to upregulate autoantibody synthesis. Lupus
6:330-332.
188. Hoffman, R. W. 2004. T cells in the pathogenesis of systemic lupus erythematosus. Clin
Immunol 113:4-13.
189. Goodnow, C. C. 2007. Multistep pathogenesis of autoimmune disease. Cell 130:25-35.
190. Liblau, R. S., S. M. Singer, and H. O. McDevitt. 1995. Th1 and Th2 CD4+ T cells in the
pathogenesis of organ-specific autoimmune diseases. Immunol Today 16:34-38.
191. Nalbandian, A., J. C. Crispin, and G. C. Tsokos. 2009. Interleukin-17 and systemic lupus
erythematosus: current concepts. Clin Exp Immunol 157:209-215.
192. Hasegawa, K., T. Hayashi, and K. Maeda. 2002. Promotion of lupus in NZB x NZWF1
mice by plasmids encoding interferon (IFN)-gamma but not by those encoding
interleukin (IL)-4. J Comp Pathol 127:1-6.
193. Ozmen, L., D. Roman, M. Fountoulakis, G. Schmid, B. Ryffel, and G. Garotta. 1995.
Experimental therapy of systemic lupus erythematosus: the treatment of NZB/W mice
with mouse soluble interferon-gamma receptor inhibits the onset of glomerulonephritis.
Eur J Immunol 25:6-12.
194. Haas, C., B. Ryffel, and M. Le Hir. 1998. IFN-gamma receptor deletion prevents
autoantibody production and glomerulonephritis in lupus-prone (NZB x NZW)F1 mice.
J Immunol 160:3713-3718.
195. Schwarting, A., T. Wada, K. Kinoshita, G. Tesch, and V. R. Kelley. 1998. IFN-gamma
receptor signaling is essential for the initiation, acceleration, and destruction of
autoimmune kidney disease in MRL-Fas(lpr) mice. J Immunol 161:494-503.
196. Schwarting, A., K. Moore, T. Wada, G. Tesch, H. J. Yoon, and V. R. Kelley. 1998. IFN-
gamma limits macrophage expansion in MRL-Fas(lpr) autoimmune interstitial nephritis:
a negative regulatory pathway. J Immunol 160:4074-4081.
197. Lawson, B. R., G. J. Prud'homme, Y. Chang, H. A. Gardner, J. Kuan, D. H. Kono, and
A. N. Theofilopoulos. 2000. Treatment of murine lupus with cDNA encoding IFN-
gammaR/Fc. J Clin Invest 106:207-215.
198. Peng, S. L., S. J. Szabo, and L. H. Glimcher. 2002. T-bet regulates IgG class switching
and pathogenic autoantibody production. Proc Natl Acad Sci U S A 99:5545-5550.
199. Theofilopoulos, A. N., S. Koundouris, D. H. Kono, and B. R. Lawson. 2001. The role of
IFN-gamma in systemic lupus erythematosus: a challenge to the Th1/Th2 paradigm in
autoimmunity. Arthritis Res 3:136-141.
147
200. Kim, K., S. K. Cho, A. Sestak, B. Namjou, C. Kang, and S. C. Bae. Interferon-gamma
gene polymorphisms associated with susceptibility to systemic lupus erythematosus.
Ann Rheum Dis 69:1247-1250.
201. Baudino, L., S. Azeredo da Silveira, M. Nakata, and S. Izui. 2006. Molecular and
cellular basis for pathogenicity of autoantibodies: lessons from murine monoclonal
autoantibodies. Springer Semin Immunopathol 28:175-184.
202. Snapper, C. M., and W. E. Paul. 1987. Interferon-gamma and B cell stimulatory factor-1
reciprocally regulate Ig isotype production. Science 236:944-947.
203. Morita, R., N. Schmitt, S. E. Bentebibel, R. Ranganathan, L. Bourdery, G. Zurawski, E.
Foucat, M. Dullaers, S. Oh, N. Sabzghabaei, E. M. Lavecchio, M. Punaro, V. Pascual, J.
Banchereau, and H. Ueno. Human blood CXCR5(+)CD4(+) T cells are counterparts of
T follicular cells and contain specific subsets that differentially support antibody
secretion. Immunity 34:108-121.
204. Harigai, M., M. Kawamoto, M. Hara, T. Kubota, N. Kamatani, and N. Miyasaka. 2008.
Excessive production of IFN-gamma in patients with systemic lupus erythematosus and
its contribution to induction of B lymphocyte stimulator/B cell-activating factor/TNF
ligand superfamily-13B. J Immunol 181:2211-2219.
205. Scapini, P., Y. Hu, C. L. Chu, T. S. Migone, A. L. Defranco, M. A. Cassatella, and C. A.
Lowell. Myeloid cells, BAFF, and IFN-gamma establish an inflammatory loop that
exacerbates autoimmunity in Lyn-deficient mice. J Exp Med 207:1757-1773.
206. Lee, S. K., D. G. Silva, J. L. Martin, A. Pratama, X. Hu, P. P. Chang, G. Walters, and C.
G. Vinuesa. Interferon-gamma excess leads to pathogenic accumulation of follicular
helper T cells and germinal centers. Immunity 37:880-892.
207. Vinuesa, C. G., S. G. Tangye, B. Moser, and C. R. Mackay. 2005. Follicular B helper T
cells in antibody responses and autoimmunity. Nat Rev Immunol 5:853-865.
208. Liu, Y. J., D. E. Joshua, G. T. Williams, C. A. Smith, J. Gordon, and I. C. MacLennan.
1989. Mechanism of antigen-driven selection in germinal centres. Nature 342:929-931.
209. Nurieva, R. I., Y. Chung, G. J. Martinez, X. O. Yang, S. Tanaka, T. D. Matskevitch, Y.
H. Wang, and C. Dong. 2009. Bcl6 mediates the development of T follicular helper
cells. Science 325:1001-1005.
210. Yu, D., S. Rao, L. M. Tsai, S. K. Lee, Y. He, E. L. Sutcliffe, M. Srivastava, M.
Linterman, L. Zheng, N. Simpson, J. I. Ellyard, I. A. Parish, C. S. Ma, Q. J. Li, C. R.
Parish, C. R. Mackay, and C. G. Vinuesa. 2009. The transcriptional repressor Bcl-6
directs T follicular helper cell lineage commitment. Immunity 31:457-468.
211. Nurieva, R. I., Y. Chung, D. Hwang, X. O. Yang, H. S. Kang, L. Ma, Y. H. Wang, S. S.
Watowich, A. M. Jetten, Q. Tian, and C. Dong. 2008. Generation of T follicular helper
cells is mediated by interleukin-21 but independent of T helper 1, 2, or 17 cell lineages.
Immunity 29:138-149.
212. Casamayor-Palleja, M., M. Khan, and I. C. MacLennan. 1995. A subset of CD4+
memory T cells contains preformed CD40 ligand that is rapidly but transiently expressed
on their surface after activation through the T cell receptor complex. J Exp Med
181:1293-1301.
213. Breitfeld, D., L. Ohl, E. Kremmer, J. Ellwart, F. Sallusto, M. Lipp, and R. Forster. 2000.
Follicular B helper T cells express CXC chemokine receptor 5, localize to B cell
follicles, and support immunoglobulin production. J Exp Med 192:1545-1552.

148
214. Schaerli, P., K. Willimann, A. B. Lang, M. Lipp, P. Loetscher, and B. Moser. 2000.
CXC chemokine receptor 5 expression defines follicular homing T cells with B cell
helper function. J Exp Med 192:1553-1562.
215. Linterman, M. A., L. Beaton, D. Yu, R. R. Ramiscal, M. Srivastava, J. J. Hogan, N. K.
Verma, M. J. Smyth, R. J. Rigby, and C. G. Vinuesa. IL-21 acts directly on B cells to
regulate Bcl-6 expression and germinal center responses. J Exp Med 207:353-363.
216. Vinuesa, C. G., M. C. Cook, C. Angelucci, V. Athanasopoulos, L. Rui, K. M. Hill, D.
Yu, H. Domaschenz, B. Whittle, T. Lambe, I. S. Roberts, R. R. Copley, J. I. Bell, R. J.
Cornall, and C. C. Goodnow. 2005. A RING-type ubiquitin ligase family member
required to repress follicular helper T cells and autoimmunity. Nature 435:452-458.
217. Linterman, M. A., R. J. Rigby, R. K. Wong, D. Yu, R. Brink, J. L. Cannons, P. L.
Schwartzberg, M. C. Cook, G. D. Walters, and C. G. Vinuesa. 2009. Follicular helper T
cells are required for systemic autoimmunity. J Exp Med 206:561-576.
218. Bubier, J. A., T. J. Sproule, O. Foreman, R. Spolski, D. J. Shaffer, H. C. Morse, 3rd, W.
J. Leonard, and D. C. Roopenian. 2009. A critical role for IL-21 receptor signaling in the
pathogenesis of systemic lupus erythematosus in BXSB-Yaa mice. Proc Natl Acad Sci U
S A 106:1518-1523.
219. Herber, D., T. P. Brown, S. Liang, D. A. Young, M. Collins, and K. Dunussi-
Joannopoulos. 2007. IL-21 has a pathogenic role in a lupus-prone mouse model and its
blockade with IL-21R.Fc reduces disease progression. J Immunol 178:3822-3830.
220. Simpson, N., P. A. Gatenby, A. Wilson, S. Malik, D. A. Fulcher, S. G. Tangye, H.
Manku, T. J. Vyse, G. Roncador, G. A. Huttley, C. C. Goodnow, C. G. Vinuesa, and M.
C. Cook. Expansion of circulating T cells resembling follicular helper T cells is a fixed
phenotype that identifies a subset of severe systemic lupus erythematosus. Arthritis
Rheum 62:234-244.
221. Sawalha, A. H., K. M. Kaufman, J. A. Kelly, A. J. Adler, T. Aberle, J. Kilpatrick, E. K.
Wakeland, Q. Z. Li, A. E. Wandstrat, D. R. Karp, J. A. James, J. T. Merrill, P. Lipsky,
and J. B. Harley. 2008. Genetic association of interleukin-21 polymorphisms with
systemic lupus erythematosus. Ann Rheum Dis 67:458-461.
222. Ivanov, II, B. S. McKenzie, L. Zhou, C. E. Tadokoro, A. Lepelley, J. J. Lafaille, D. J.
Cua, and D. R. Littman. 2006. The orphan nuclear receptor RORgammat directs the
differentiation program of proinflammatory IL-17+ T helper cells. Cell 126:1121-1133.
223. Yang, X. O., B. P. Pappu, R. Nurieva, A. Akimzhanov, H. S. Kang, Y. Chung, L. Ma, B.
Shah, A. D. Panopoulos, K. S. Schluns, S. S. Watowich, Q. Tian, A. M. Jetten, and C.
Dong. 2008. T helper 17 lineage differentiation is programmed by orphan nuclear
receptors ROR alpha and ROR gamma. Immunity 28:29-39.
224. Veldhoen, M., R. J. Hocking, C. J. Atkins, R. M. Locksley, and B. Stockinger. 2006.
TGFbeta in the context of an inflammatory cytokine milieu supports de novo
differentiation of IL-17-producing T cells. Immunity 24:179-189.
225. Zhou, L., Ivanov, II, R. Spolski, R. Min, K. Shenderov, T. Egawa, D. E. Levy, W. J.
Leonard, and D. R. Littman. 2007. IL-6 programs T(H)-17 cell differentiation by
promoting sequential engagement of the IL-21 and IL-23 pathways. Nat Immunol 8:967-
974.
226. Korn, T., E. Bettelli, W. Gao, A. Awasthi, A. Jager, T. B. Strom, M. Oukka, and V. K.
Kuchroo. 2007. IL-21 initiates an alternative pathway to induce proinflammatory
T(H)17 cells. Nature 448:484-487.
149
227. Xu, S., and X. Cao. Interleukin-17 and its expanding biological functions. Cell Mol
Immunol 7:164-174.
228. Nurieva, R., X. O. Yang, G. Martinez, Y. Zhang, A. D. Panopoulos, L. Ma, K. Schluns,
Q. Tian, S. S. Watowich, A. M. Jetten, and C. Dong. 2007. Essential autocrine
regulation by IL-21 in the generation of inflammatory T cells. Nature 448:480-483.
229. Nowak, E. C., C. T. Weaver, H. Turner, S. Begum-Haque, B. Becher, B. Schreiner, A. J.
Coyle, L. H. Kasper, and R. J. Noelle. 2009. IL-9 as a mediator of Th17-driven
inflammatory disease. J Exp Med 206:1653-1660.
230. Kang, H. K., D. Ecklund, M. Liu, and S. K. Datta. 2009. Apigenin, a non-mutagenic
dietary flavonoid, suppresses lupus by inhibiting autoantigen presentation for expansion
of autoreactive Th1 and Th17 cells. Arthritis Res Ther 11:R59.
231. Jacob, N., H. Yang, L. Pricop, Y. Liu, X. Gao, S. G. Zheng, J. Wang, H. X. Gao, C.
Putterman, M. N. Koss, W. Stohl, and C. O. Jacob. 2009. Accelerated pathological and
clinical nephritis in systemic lupus erythematosus-prone New Zealand Mixed 2328 mice
doubly deficient in TNF receptor 1 and TNF receptor 2 via a Th17-associated pathway. J
Immunol 182:2532-2541.
232. Hsu, H. C., P. Yang, J. Wang, Q. Wu, R. Myers, J. Chen, J. Yi, T. Guentert, A. Tousson,
A. L. Stanus, T. V. Le, R. G. Lorenz, H. Xu, J. K. Kolls, R. H. Carter, D. D. Chaplin, R.
W. Williams, and J. D. Mountz. 2008. Interleukin 17-producing T helper cells and
interleukin 17 orchestrate autoreactive germinal center development in autoimmune
BXD2 mice. Nat Immunol 9:166-175.
233. Bettelli, E., M. Oukka, and V. K. Kuchroo. 2007. T(H)-17 cells in the circle of immunity
and autoimmunity. Nat Immunol 8:345-350.
234. Wong, C. K., L. C. Lit, L. S. Tam, E. K. Li, P. T. Wong, and C. W. Lam. 2008.
Hyperproduction of IL-23 and IL-17 in patients with systemic lupus erythematosus:
implications for Th17-mediated inflammation in auto-immunity. Clin Immunol 127:385-
393.
235. Edgerton, C., J. C. Crispin, C. M. Moratz, E. Bettelli, M. Oukka, M. Simovic, A.
Zacharia, R. Egan, J. Chen, J. J. Dalle Lucca, Y. T. Juang, and G. C. Tsokos. 2009. IL-
17 producing CD4+ T cells mediate accelerated ischemia/reperfusion-induced injury in
autoimmunity-prone mice. Clin Immunol 130:313-321.
236. Yang, J., Y. Chu, X. Yang, D. Gao, L. Zhu, L. Wan, and M. Li. 2009. Th17 and natural
Treg cell population dynamics in systemic lupus erythematosus. Arthritis Rheum
60:1472-1483.
237. Shin, M. S., N. Lee, and I. Kang. Effector T-cell subsets in systemic lupus
erythematosus: update focusing on Th17 cells. Curr Opin Rheumatol 23:444-448.
238. Linterman, M. A., and C. G. Vinuesa. T follicular helper cells during immunity and
tolerance. Prog Mol Biol Transl Sci 92:207-248.
239. Korn, T., E. Bettelli, M. Oukka, and V. K. Kuchroo. 2009. IL-17 and Th17 Cells. Annu
Rev Immunol 27:485-517.
240. Suto, A., D. Kashiwakuma, S. Kagami, K. Hirose, N. Watanabe, K. Yokote, Y. Saito, T.
Nakayama, M. J. Grusby, I. Iwamoto, and H. Nakajima. 2008. Development and
characterization of IL-21-producing CD4+ T cells. J Exp Med 205:1369-1379.
241. Pau, E., N. H. Chang, C. Loh, G. Lajoie, and J. E. Wither. Abrogation of pathogenic IgG
autoantibody production in CD40L gene-deleted lupus-prone New Zealand Black mice.
Clin Immunol 139:215-227.
150
242. Bottino, C., M. Falco, S. Parolini, E. Marcenaro, R. Augugliaro, S. Sivori, E. Landi, R.
Biassoni, L. D. Notarangelo, L. Moretta, and A. Moretta. 2001. NTB-A [correction of
GNTB-A], a novel SH2D1A-associated surface molecule contributing to the inability of
natural killer cells to kill Epstein-Barr virus-infected B cells in X-linked
lymphoproliferative disease. J Exp Med 194:235-246.
243. Valdez, P. A., H. Wang, D. Seshasayee, M. van Lookeren Campagne, A. Gurney, W. P.
Lee, and I. S. Grewal. 2004. NTB-A, a new activating receptor in T cells that regulates
autoimmune disease. J Biol Chem 279:18662-18669.
244. Keszei, M., C. Detre, W. Castro, E. Magelky, M. O'Keeffe, K. Kis-Toth, G. C. Tsokos,
N. Wang, and C. Terhorst. Expansion of an osteopontin-expressing T follicular helper
cell subset correlates with autoimmunity in B6.Sle1b mice and is suppressed by the H1-
isoform of the Slamf6 receptor. FASEB J.
245. Du, X., K. Tabeta, N. Mann, K. Crozat, S. Mudd, and B. Beutler. 2005. An essential role
for Rxr alpha in the development of Th2 responses. Eur J Immunol 35:3414-3423.
246. Spilianakis, C. G., G. R. Lee, and R. A. Flavell. 2005. Twisting the Th1/Th2 immune
response via the retinoid X receptor: lessons from a genetic approach. Eur J Immunol
35:3400-3404.
247. Kim, C. H. 2008. Regulation of FoxP3 regulatory T cells and Th17 cells by retinoids.
Clin Dev Immunol 2008:416910.
248. Macatonia, S. E., N. A. Hosken, M. Litton, P. Vieira, C. S. Hsieh, J. A. Culpepper, M.
Wysocka, G. Trinchieri, K. M. Murphy, and A. O'Garra. 1995. Dendritic cells produce
IL-12 and direct the development of Th1 cells from naive CD4+ T cells. J Immunol
154:5071-5079.
249. Ma, C. S., S. Suryani, D. T. Avery, A. Chan, R. Nanan, B. Santner-Nanan, E. K.
Deenick, and S. G. Tangye. 2009. Early commitment of naive human CD4(+) T cells to
the T follicular helper (T(FH)) cell lineage is induced by IL-12. Immunol Cell Biol
87:590-600.
250. Heufler, C., F. Koch, U. Stanzl, G. Topar, M. Wysocka, G. Trinchieri, A. Enk, R. M.
Steinman, N. Romani, and G. Schuler. 1996. Interleukin-12 is produced by dendritic
cells and mediates T helper 1 development as well as interferon-gamma production by T
helper 1 cells. Eur J Immunol 26:659-668.
251. Eto, D., C. Lao, D. DiToro, B. Barnett, T. C. Escobar, R. Kageyama, I. Yusuf, and S.
Crotty. IL-21 and IL-6 are critical for different aspects of B cell immunity and
redundantly induce optimal follicular helper CD4 T cell (Tfh) differentiation. PLoS One
6:e17739.
252. Nishihara, M., H. Ogura, N. Ueda, M. Tsuruoka, C. Kitabayashi, F. Tsuji, H. Aono, K.
Ishihara, E. Huseby, U. A. Betz, M. Murakami, and T. Hirano. 2007. IL-6-gp130-
STAT3 in T cells directs the development of IL-17+ Th with a minimum effect on that
of Treg in the steady state. Int Immunol 19:695-702.
253. Chen, Z., A. Laurence, and J. J. O'Shea. 2007. Signal transduction pathways and
transcriptional regulation in the control of Th17 differentiation. Semin Immunol 19:400-
408.
254. Loh, C., E. Pau, G. Lajoie, T. T. Li, Y. Baglaenko, Y. H. Cheung, N. H. Chang, and J. E.
Wither. Epistatic suppression of fatal autoimmunity in New Zealand black bicongenic
mice. J Immunol 186:5845-5853.
151
255. Mohan, C., L. Morel, P. Yang, H. Watanabe, B. Croker, G. Gilkeson, and E. K.
Wakeland. 1999. Genetic dissection of lupus pathogenesis: a recipe for nephrophilic
autoantibodies. J Clin Invest 103:1685-1695.
256. Morel, L., B. P. Croker, K. R. Blenman, C. Mohan, G. Huang, G. Gilkeson, and E. K.
Wakeland. 2000. Genetic reconstitution of systemic lupus erythematosus
immunopathology with polycongenic murine strains. Proc Natl Acad Sci U S A 97:6670-
6675.
257. Rullo, O. J., and B. P. Tsao. Recent insights into the genetic basis of systemic lupus
erythematosus. Ann Rheum Dis 72 Suppl 2:ii56-61.
258. Talaei, N., Y. H. Cheung, C. Landolt-Marticorena, B. Noamani, T. Li, and J. E. Wither.
T cell and dendritic cell abnormalities synergize to expand pro-inflammatory T cell
subsets leading to fatal autoimmunity in B6.NZBc1 lupus-prone mice. PLoS One
8:e75166.
259. Liu, R., H. Liu, X. Chen, M. Kirby, P. O. Brown, and K. Zhao. 2001. Regulation of
CSF1 promoter by the SWI/SNF-like BAF complex. Cell 106:309-318.
260. Calpe, S., E. Erdos, G. Liao, N. Wang, S. Rietdijk, M. Simarro, B. Scholtz, J. Mooney,
C. H. Lee, M. S. Shin, E. Rajnavolgyi, J. Schatzle, H. C. Morse, 3rd, C. Terhorst, and A.
Lanyi. 2006. Identification and characterization of two related murine genes, Eat2a and
Eat2b, encoding single SH2-domain adapters. Immunogenetics 58:15-25.
261. Rethi, B., P. Gogolak, I. Szatmari, A. Veres, E. Erdos, L. Nagy, E. Rajnavolgyi, C.
Terhorst, and A. Lanyi. 2006. SLAM/SLAM interactions inhibit CD40-induced
production of inflammatory cytokines in monocyte-derived dendritic cells. Blood
107:2821-2829.
262. Morra, M., J. Lu, F. Poy, M. Martin, J. Sayos, S. Calpe, C. Gullo, D. Howie, S. Rietdijk,
A. Thompson, A. J. Coyle, C. Denny, M. B. Yaffe, P. Engel, M. J. Eck, and C. Terhorst.
2001. Structural basis for the interaction of the free SH2 domain EAT-2 with SLAM
receptors in hematopoietic cells. EMBO J 20:5840-5852.
263. Cannons, J. L., S. G. Tangye, and P. L. Schwartzberg. SLAM family receptors and SAP
adaptors in immunity. Annu Rev Immunol 29:665-705.
264. Ma, D. Y., and E. A. Clark. 2009. The role of CD40 and CD154/CD40L in dendritic
cells. Semin Immunol 21:265-272.
265. Alvarez-Errico, D., I. Oliver-Vila, E. Ainsua-Enrich, A. M. Gilfillan, C. Picado, J.
Sayos, and M. Martin. CD84 negatively regulates IgE high-affinity receptor signaling in
human mast cells. J Immunol 187:5577-5586.
266. Fukao, T., M. Tanabe, Y. Terauchi, T. Ota, S. Matsuda, T. Asano, T. Kadowaki, T.
Takeuchi, and S. Koyasu. 2002. PI3K-mediated negative feedback regulation of IL-12
production in DCs. Nat Immunol 3:875-881.
267. Tassi, I., and M. Colonna. 2005. The cytotoxicity receptor CRACC (CS-1) recruits
EAT-2 and activates the PI3K and phospholipase Cgamma signaling pathways in human
NK cells. J Immunol 175:7996-8002.
268. Downward, J. 2004. PI 3-kinase, Akt and cell survival. Semin Cell Dev Biol 15:177-182.
269. Veillette, A. 2006. NK cell regulation by SLAM family receptors and SAP-related
adapters. Immunol Rev 214:22-34.
270. Wang, N., S. Calpe, J. Westcott, W. Castro, C. Ma, P. Engel, J. D. Schatzle, and C.
Terhorst. Cutting edge: The adapters EAT-2A and -2B are positive regulators of CD244-
152
and CD84-dependent NK cell functions in the C57BL/6 mouse. J Immunol 185:5683-
5687.
271. Clarkson, N. G., and M. H. Brown. 2009. Inhibition and activation by CD244 depends
on CD2 and phospholipase C-gamma1. J Biol Chem 284:24725-24734.
272. Sanceau, J., T. Kaisho, T. Hirano, and J. Wietzerbin. 1995. Triggering of the human
interleukin-6 gene by interferon-gamma and tumor necrosis factor-alpha in monocytic
cells involves cooperation between interferon regulatory factor-1, NF kappa B, and Sp1
transcription factors. J Biol Chem 270:27920-27931.
273. McLoughlin, R. M., J. Witowski, R. L. Robson, T. S. Wilkinson, S. M. Hurst, A. S.
Williams, J. D. Williams, S. Rose-John, S. A. Jones, and N. Topley. 2003. Interplay
between IFN-gamma and IL-6 signaling governs neutrophil trafficking and apoptosis
during acute inflammation. J Clin Invest 112:598-607.
274. Wang, N., A. Satoskar, W. Faubion, D. Howie, S. Okamoto, S. Feske, C. Gullo, K.
Clarke, M. R. Sosa, A. H. Sharpe, and C. Terhorst. 2004. The cell surface receptor
SLAM controls T cell and macrophage functions. J Exp Med 199:1255-1264.
275. Lu, H. T., D. D. Yang, M. Wysk, E. Gatti, I. Mellman, R. J. Davis, and R. A. Flavell.
1999. Defective IL-12 production in mitogen-activated protein (MAP) kinase kinase 3
(Mkk3)-deficient mice. EMBO J 18:1845-1857.
276. Hacker, H., H. Mischak, T. Miethke, S. Liptay, R. Schmid, T. Sparwasser, K. Heeg, G.
B. Lipford, and H. Wagner. 1998. CpG-DNA-specific activation of antigen-presenting
cells requires stress kinase activity and is preceded by non-specific endocytosis and
endosomal maturation. EMBO J 17:6230-6240.
277. Aicher, A., G. L. Shu, D. Magaletti, T. Mulvania, A. Pezzutto, A. Craxton, and E. A.
Clark. 1999. Differential role for p38 mitogen-activated protein kinase in regulating
CD40-induced gene expression in dendritic cells and B cells. J Immunol 163:5786-5795.
278. Pullen, S. S., T. T. Dang, J. J. Crute, and M. R. Kehry. 1999. CD40 signaling through
tumor necrosis factor receptor-associated factors (TRAFs). Binding site specificity and
activation of downstream pathways by distinct TRAFs. J Biol Chem 274:14246-14254.
279. Yurchenko, M., L. M. Shlapatska, O. L. Romanets, D. Ganshevskiy, E. Kashuba, A.
Zamoshnikova, Y. V. Ushenin, B. A. Snopok, and S. P. Sidorenko. CD150-mediated
Akt signalling pathway in normal and malignant B cells. Exp Oncol 33:9-18.
280. Howie, D., S. Okamoto, S. Rietdijk, K. Clarke, N. Wang, C. Gullo, J. P. Bruggeman, S.
Manning, A. J. Coyle, E. Greenfield, V. Kuchroo, and C. Terhorst. 2002. The role of
SAP in murine CD150 (SLAM)-mediated T-cell proliferation and interferon gamma
production. Blood 100:2899-2907.
281. Sidorenko, S. P., and E. A. Clark. 2003. The dual-function CD150 receptor subfamily:
the viral attraction. Nat Immunol 4:19-24.
282. Howie, D., F. S. Laroux, M. Morra, A. R. Satoskar, L. E. Rosas, W. A. Faubion, A.
Julien, S. Rietdijk, A. J. Coyle, C. Fraser, and C. Terhorst. 2005. Cutting edge: the
SLAM family receptor Ly108 controls T cell and neutrophil functions. J Immunol
174:5931-5935.
283. Qi, H. From SAP-less T cells to helpless B cells and back: dynamic T-B cell interactions
underlie germinal center development and function. Immunol Rev 247:24-35.
284. Menard, L., T. Cantaert, N. Chamberlain, S. G. Tangye, S. Riminton, J. A. Church, A.
Klion, C. Cunningham-Rundles, K. E. Nichols, and E. Meffre. Signaling lymphocytic
153
activation molecule (SLAM)/SLAM-associated protein pathway regulates human B-cell
tolerance. J Allergy Clin Immunol 133:1149-1161.
285. Wong, E. B., T. N. Khan, C. Mohan, and Z. S. Rahman. The lupus-prone
NZM2410/NZW strain-derived Sle1b sublocus alters the germinal center checkpoint in
female mice in a B cell-intrinsic manner. J Immunol 189:5667-5681.
286. Keszei, M., C. Detre, W. Castro, E. Magelky, M. O'Keeffe, K. Kis-Toth, G. C. Tsokos,
N. Wang, and C. Terhorst. Expansion of an osteopontin-expressing T follicular helper
cell subset correlates with autoimmunity in B6.Sle1b mice and is suppressed by the H1-
isoform of the Slamf6 receptor. FASEB J 27:3123-3131.
287. Hagberg, N., J. Theorell, H. Schlums, M. L. Eloranta, Y. T. Bryceson, and L. Ronnblom.
Systemic lupus erythematosus immune complexes increase the expression of SLAM
family members CD319 (CRACC) and CD229 (LY-9) on plasmacytoid dendritic cells
and CD319 on CD56(dim) NK cells. J Immunol 191:2989-2998.
288. Chatterjee, M., T. Rauen, K. Kis-Toth, V. C. Kyttaris, C. M. Hedrich, C. Terhorst, and
G. C. Tsokos. Increased expression of SLAM receptors SLAMF3 and SLAMF6 in
systemic lupus erythematosus T lymphocytes promotes Th17 differentiation. J Immunol
188:1206-1212.
289. Kim, J. R., S. O. Mathew, R. K. Patel, R. M. Pertusi, and P. A. Mathew. Altered
expression of signalling lymphocyte activation molecule (SLAM) family receptors CS1
(CD319) and 2B4 (CD244) in patients with systemic lupus erythematosus. Clin Exp
Immunol 160:348-358.
290. Chatterjee, M., K. Kis-Toth, T. H. Thai, C. Terhorst, and G. C. Tsokos. SLAMF6-driven
co-stimulation of human peripheral T cells is defective in SLE T cells. Autoimmunity
44:211-218.
291. Cunninghame Graham, D. S., T. J. Vyse, P. R. Fortin, A. Montpetit, Y. C. Cai, S. Lim,
T. McKenzie, L. Farwell, B. Rhodes, L. Chad, T. J. Hudson, A. Sharpe, C. Terhorst, C.
M. Greenwood, J. Wither, and J. D. Rioux. 2008. Association of LY9 in UK and
Canadian SLE families. Genes Immun 9:93-102.
292. Moser, K. L., B. R. Neas, J. E. Salmon, H. Yu, C. Gray-McGuire, N. Asundi, G. R.
Bruner, J. Fox, J. Kelly, S. Henshall, D. Bacino, M. Dietz, R. Hogue, G. Koelsch, L.
Nightingale, T. Shaver, N. I. Abdou, D. A. Albert, C. Carson, M. Petri, E. L. Treadwell,
J. A. James, and J. B. Harley. 1998. Genome scan of human systemic lupus
erythematosus: evidence for linkage on chromosome 1q in African-American pedigrees.
Proc Natl Acad Sci U S A 95:14869-14874.
293. Benson, M. J., K. Pino-Lagos, M. Rosemblatt, and R. J. Noelle. 2007. All-trans retinoic
acid mediates enhanced T reg cell growth, differentiation, and gut homing in the face of
high levels of co-stimulation. J Exp Med 204:1765-1774.
294. Coombes, J. L., K. R. Siddiqui, C. V. Arancibia-Carcamo, J. Hall, C. M. Sun, Y.
Belkaid, and F. Powrie. 2007. A functionally specialized population of mucosal CD103+
DCs induces Foxp3+ regulatory T cells via a TGF-beta and retinoic acid-dependent
mechanism. J Exp Med 204:1757-1764.
295. Mucida, D., Y. Park, G. Kim, O. Turovskaya, I. Scott, M. Kronenberg, and H.
Cheroutre. 2007. Reciprocal TH17 and regulatory T cell differentiation mediated by
retinoic acid. Science 317:256-260.
154
296. Wang, J., T. W. Huizinga, and R. E. Toes. 2009. De novo generation and enhanced
suppression of human CD4+CD25+ regulatory T cells by retinoic acid. J Immunol
183:4119-4126.
297. Kang, S. G., H. W. Lim, O. M. Andrisani, H. E. Broxmeyer, and C. H. Kim. 2007.
Vitamin A metabolites induce gut-homing FoxP3+ regulatory T cells. J Immunol
179:3724-3733.
298. Xiao, S., H. Jin, T. Korn, S. M. Liu, M. Oukka, B. Lim, and V. K. Kuchroo. 2008.
Retinoic acid increases Foxp3+ regulatory T cells and inhibits development of Th17
cells by enhancing TGF-beta-driven Smad3 signaling and inhibiting IL-6 and IL-23
receptor expression. J Immunol 181:2277-2284.
299. Choi, J. M., and A. L. Bothwell. The nuclear receptor PPARs as important regulators of
T-cell functions and autoimmune diseases. Mol Cells 33:217-222.
300. Klotz, L., S. Burgdorf, I. Dani, K. Saijo, J. Flossdorf, S. Hucke, J. Alferink, N. Nowak,
M. Beyer, G. Mayer, B. Langhans, T. Klockgether, A. Waisman, G. Eberl, J. Schultze,
M. Famulok, W. Kolanus, C. Glass, C. Kurts, and P. A. Knolle. 2009. The nuclear
receptor PPAR gamma selectively inhibits Th17 differentiation in a T cell-intrinsic
fashion and suppresses CNS autoimmunity. J Exp Med 206:2079-2089.
301. Croft, M. Control of immunity by the TNFR-related molecule OX40 (CD134). Annu Rev
Immunol 28:57-78.
302. Patschan, S., S. Dolff, A. Kribben, J. Durig, D. Patschan, B. Wilde, C. Specker, T.
Philipp, and O. Witzke. 2006. CD134 expression on CD4+ T cells is associated with
nephritis and disease activity in patients with systemic lupus erythematosus. Clin Exp
Immunol 145:235-242.
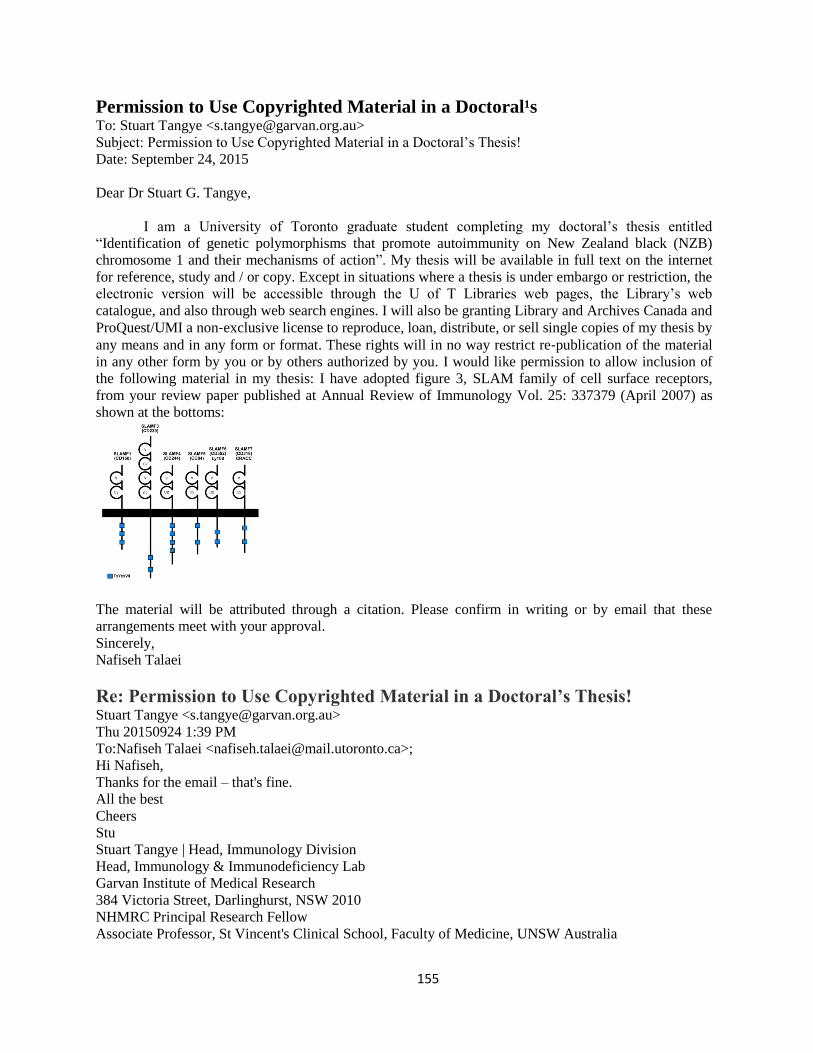
155
Permission to Use Copyrighted Material in a Doctoral¹s
To: Stuart Tangye <[email protected]>
Subject: Permission to Use Copyrighted Material in a Doctoral’s Thesis!
Date: September 24, 2015
Dear Dr Stuart G. Tangye,
I am a University of Toronto graduate student completing my doctoral’s thesis entitled
“Identification of genetic polymorphisms that promote autoimmunity on New Zealand black (NZB)
chromosome 1 and their mechanisms of action”. My thesis will be available in full text on the internet
for reference, study and / or copy. Except in situations where a thesis is under embargo or restriction, the
electronic version will be accessible through the U of T Libraries web pages, the Library’s web
catalogue, and also through web search engines. I will also be granting Library and Archives Canada and
ProQuest/UMI a non‐exclusive license to reproduce, loan, distribute, or sell single copies of my thesis by
any means and in any form or format. These rights will in no way restrict re‐publication of the material
in any other form by you or by others authorized by you. I would like permission to allow inclusion of
the following material in my thesis: I have adopted figure 3, SLAM family of cell surface receptors,
from your review paper published at Annual Review of Immunology Vol. 25: 337379 (April 2007) as
shown at the bottoms:
The material will be attributed through a citation. Please confirm in writing or by email that these
arrangements meet with your approval.
Sincerely,
Nafiseh Talaei
Re: Permission to Use Copyrighted Material in a Doctoral’s Thesis! Stuart Tangye <[email protected]>
Thu 20150924 1:39 PM
To:Nafiseh Talaei <[email protected]>;
Hi Nafiseh,
Thanks for the email – that's fine.
All the best
Cheers
Stu
Stuart Tangye | Head, Immunology Division
Head, Immunology & Immunodeficiency Lab
Garvan Institute of Medical Research
384 Victoria Street, Darlinghurst, NSW 2010
NHMRC Principal Research Fellow
Associate Professor, St Vincent's Clinical School, Faculty of Medicine, UNSW Australia