identification of human triple-negative breast cancer ...€¦ · identification of human...
TRANSCRIPT

Identification of human triple-negative breast cancer subtypesand preclinical models for selection of targeted therapies
Brian D. Lehmann, … , Yu Shyr, Jennifer A. Pietenpol
J Clin Invest. 2011;121(7):2750-2767. https://doi.org/10.1172/JCI45014.
Triple-negative breast cancer (TNBC) is a highly diverse group of cancers, and subtyping is necessary to better identifymolecular-based therapies. In this study, we analyzed gene expression (GE) profiles from 21 breast cancer data sets andidentified 587 TNBC cases. Cluster analysis identified 6 TNBC subtypes displaying unique GE and ontologies, including 2basal-like (BL1 and BL2), an immunomodulatory (IM), a mesenchymal (M), a mesenchymal stem–like (MSL), and aluminal androgen receptor (LAR) subtype. Further, GE analysis allowed us to identify TNBC cell line modelsrepresentative of these subtypes. Predicted “driver” signaling pathways were pharmacologically targeted in these cell linemodels as proof of concept that analysis of distinct GE signatures can inform therapy selection. BL1 and BL2 subtypeshad higher expression of cell cycle and DNA damage response genes, and representative cell lines preferentiallyresponded to cisplatin. M and MSL subtypes were enriched in GE for epithelial-mesenchymal transition, and growth factorpathways and cell models responded to NVP-BEZ235 (a PI3K/mTOR inhibitor) and dasatinib (an abl/src inhibitor). TheLAR subtype includes patients with decreased relapse-free survival and was characterized by androgen receptor (AR)signaling. LAR cell lines were uniquely sensitive to bicalutamide (an AR antagonist). These data may be useful inbiomarker selection, drug discovery, and clinical trial design that will enable alignment of TNBC patients to appropriatetargeted therapies.
Research Article
Find the latest version:
https://jci.me/45014/pdf

Research article
2750 TheJournalofClinicalInvestigation http://www.jci.org Volume 121 Number 7 July 2011
Identification of human triple-negative breast cancer subtypes and preclinical
models for selection of targeted therapiesBrian D. Lehmann,1 Joshua A. Bauer,1 Xi Chen,2 Melinda E. Sanders,3
A. Bapsi Chakravarthy,4 Yu Shyr,2 and Jennifer A. Pietenpol1
1Department of Biochemistry, 2Department of Biostatistics, 3Department of Pathology, and 4Department of Radiation Oncology, Vanderbilt-Ingram Cancer Center, Vanderbilt University School of Medicine, Nashville, Tennessee, USA.
Triple-negativebreastcancer(TNBC)isahighlydiversegroupofcancers,andsubtypingisnecessarytobetteridentifymolecular-basedtherapies.Inthisstudy,weanalyzedgeneexpression(GE)profilesfrom21breastcancerdatasetsandidentified587TNBCcases.Clusteranalysisidentified6TNBCsubtypesdisplayinguniqueGEandontologies,including2basal-like(BL1andBL2),animmunomodulatory(IM),amesenchymal(M),amesenchymalstem–like(MSL),andaluminalandrogenreceptor(LAR)subtype.Further,GEanalysisallowedustoidentifyTNBCcelllinemodelsrepresentativeofthesesubtypes.Predicted“driver”signalingpathwayswerepharmacologicallytargetedinthesecelllinemodelsasproofofconceptthatanalysisofdis-tinctGEsignaturescaninformtherapyselection.BL1andBL2subtypeshadhigherexpressionofcellcycleandDNAdamageresponsegenes,andrepresentativecelllinespreferentiallyrespondedtocisplatin.MandMSLsubtypeswereenrichedinGEforepithelial-mesenchymaltransition,andgrowthfactorpathwaysandcellmodelsrespondedtoNVP-BEZ235(aPI3K/mTORinhibitor)anddasatinib(anabl/srcinhibitor).TheLARsubtypeincludespatientswithdecreasedrelapse-freesurvivalandwascharacterizedbyandrogenrecep-tor(AR)signaling.LARcelllineswereuniquelysensitivetobicalutamide(anARantagonist).Thesedatamaybeusefulinbiomarkerselection,drugdiscovery,andclinicaltrialdesignthatwillenablealignmentofTNBCpatientstoappropriatetargetedtherapies.
IntroductionTreatment of patients with triple-negative breast cancer (TNBC), lacking estrogen receptor (ER) and progesterone receptor (PR) expression as well as human epidermal growth factor receptor 2 (HER2) amplification, has been challenging due to the heterogene-ity of the disease and the absence of well-defined molecular targets (1–3). TNBCs constitute 10%–20% of all breast cancers, more fre-quently affect younger patients, and are more prevalent in African-American women (4). TNBC tumors are generally larger in size, are of higher grade, have lymph node involvement at diagnosis, and are biologically more aggressive (5). Despite having higher rates of clinical response to presurgical (neoadjuvant) chemotherapy, TNBC patients have a higher rate of distant recurrence and a poor-er prognosis than women with other breast cancer subtypes (5, 6). Less than 30% of women with metastatic TNBC survive 5 years, and almost all die of their disease despite adjuvant chemotherapy, which is the mainstay of treatment (6).
One of the first molecular insights into TNBCs was the observa-tion that they are likely to arise in BRCA1 mutation carriers and have gene expression (GE) profiles similar to those of BRCA1-deficient tumors (5). BRCA1 plays an important role in DNA double-strand break repair, contributing to the maintenance of DNA stability (7). Poly ADP-ribose polymerase (PARP) enzymes are critical for appro-priate processing and repair of DNA breaks (8). Tumor cell lines lack-ing functional BRCA1 or BRCA2 are sensitive to PARP inhibitors in
preclinical studies (9). Clinical trials using both PARP inhibitors and DNA-damaging agents (e.g., cisplatin) in TNBC are currently underway and show promise in BRCA1/2-mutant tumors (10). Other studies identifying molecular markers of TNBC, such as VEGF (11), EGFR (12), Src (13), and mTOR (14) have been important for the design of clinical trials investigating targeted treatments.
Clearly, there is a major need to better understand the molecular basis of TNBC and to develop effective treatments for this aggres-sive type of breast cancer. More extensive genomic, molecular, and biological analyses of TNBCs are required to understand the com-plexity of the disease and to identify molecular drivers that can be therapeutically targeted. We compiled an extensive number of TNBC GE profiles with the intent of molecularly subtyping the dis-ease. We identified 6 TNBC subtypes. Further, using GE signatures derived from each TNBC subtype, we aligned representative TNBC cell lines that serve as models for the different subtypes of the dis-ease. Using the panel of cell lines, we pharmacologically targeted prominent signaling pathways revealed by GE signatures and found that the cell lines representing the various subtypes had different sensitivities to targeted therapies currently under laboratory and clinical investigation. The identification of diverse TNBC subtypes and the molecular drivers in corresponding cell line models pro-vides great insight to the heterogeneity of this disease and provides preclinical platforms for the development of effective treatment.
ResultsAnalysis of human tumor GE profiles identifies TNBC subtypes. GE profiles were obtained from 21 publicly available data sets that contained 3,247 primary human breast cancers and processed according to the flow chart in Figure 1A. To allow for robust analysis, these data
Authorshipnote: Brian D. Lehmann and Joshua A. Bauer contributed equally to this work.
Conflictofinterest:The authors have declared that no conflict of interest exists.
Citationforthisarticle: J Clin Invest. 2011;121(7):2750–2767. doi:10.1172/JCI45014.

research article
TheJournalofClinicalInvestigation http://www.jci.org Volume 121 Number 7 July 2011 2751
sets were further divided into training (Table 1; 14 data sets, cases n = 2353) and validation data sets (Table 2; 7 data sets, cases n = 894). Since the majority of these tumors lacked sufficient molecular analy-sis of ER, PR, and HER2, we filtered each data set for ER, PR, and HER2 mRNA expression to identify triple-negative status (see Methods for bimodal filter description and Supplemental Table 1; supple-mental material available online with this article; doi:10.1172/JCI45014DS1). Previous studies have shown that ER and HER2 mRNA expression correlates with immunohistochemistry (IHC) and FISH analyses, respectively (15, 16). Using a bimodal filter on the GE data (Figure 1B), we identified 386 and 201 TNBC tumor samples in the training and validation sets, respectively (Supple-mental Table 2). The 386 TNBC GE profiles of the training set were robust multiarray average (RMA) normalized, summarized, trans-formed, and corrected for “batch effect,” resulting in 13,060 identi-
cal probes representing unique genes across all platforms. The tri-ple-negative GE pattern is shown compared with 5 positive controls for each parameter (ER, PR, and HER2) from data sets that were confirmed IHC positive and expressed mRNA near the center of the positive bimodal peak (Figure 1C). Of the 14 data sets in the train-ing set, 4 (GSE-7904, E-TABM-158, MDA133, GSE-22513, GSE-28821, and GSE-28796) included IHC data for all 3 markers, while others lacked information on ER, PR, or HER2 status (Table 1). The IHC data provided were used to calculate false-positive rates for each study, defined as tumors that were predicted negative for ER, PR, or HER2 by bimodal filtering of mRNA expression, but were positive by IHC. The overall false-positive rates were 1.7%, 1.7%, and 0.9% for ER, PR, and HER2, respectively, demonstrating that bimodal filtering of data sets by mRNA expression is a reliable method for identifying TNBC tumors from data sets lacking IHC
Figure 1Filtering GE data sets to identify TNBCs. (A) Flow chart of analysis. Human breast cancer GE profiles (training = 2353, validation = 894) were normalized within individual data sets and a bimodal filter was applied to select ER, PR, and HER2 negative samples by GE, resulting in 386 samples in the training set and 201 samples in the validation set with a triple-negative phenotype. k-means clustering was performed on the training set, and a GE signature representing the TNBC subtypes from the training set was used to predict the best-fit subtype for each TNBC profile in an independent validation set. GSE-A was performed on the training and validation sets to identify enriched canonical pathways for each TNBC subtype. (B) Histograms show the distribution and frequency of tumors using relative ER, PR, and HER2 GE levels (log2) and bimodal fit to identify TN tumor samples. Dashed line indicates the expression value at the center of the positive expression peak used to select controls for C. (C) Heat map representation of GE for 386 TNBCs relative to 5 IHC-validated controls for each ER, PR, and HER2.

research article
2752 TheJournalofClinicalInvestigation http://www.jci.org Volume 121 Number 7 July 2011
information (Table 1). The overall frequency of TNBC across the training data set was 16% and is consistent with the prevalence of TNBC previously reported in 2 other large studies performed on 3,744 cases (17%) (17) and 1,726 cases (16%) (18).
k-means and consensus clustering reveal 6 TNBC subtypes. To identify global differences in GE between TNBC subtypes, we performed k-means clustering on the most differentially expressed genes (SD>0.8). Using the silhouette width (s[i]) as a measure of relative closeness of individual samples to their clusters, k-means cluster-
ing classified 337 of the 386 TNBC tumors into 6 stable clusters (s[i] > 0) and 49 tumors into 1 unstable cluster (s[i] > 0) (Figure 2A). Clustering resulted in a distribution of samples in all 7 clusters independent of each data set, n = 14, indicating that confound-ing factors such as batch effect, RNA amplification, and sample quality did not influence cluster distribution (Supplemental Figure 1). Sample classification robustness was analyzed by con-sensus clustering, which involves k-means clustering by resampling (1,000 iterations) randomly selected tumor profiles. The consen-
Table 1Breast cancer GE data sets used to derive the TNBC training set
Data set Country Case definition BC cases IHC n False positive (%) Refs. (% TN) ER PR HER2GSE-3494A Sweden Breast cancers from patients treated in Uppsala 251 ER, PR 25 (10) 3.6 2.8 66 County, Sweden, between 1987 and 1989GSE-7904A USA Frozen tissue samples from primary, 43 ER, PR, 17 (40) 0.0 0.0 0.0 67 sporadic and 4 BRCA1-mutant breast obtained HER2 through the Harvard Breast SPOREGSE-2109A,B USA The international genomics consortium 351 VariableC 60 (17) collection of breast cancer tissue samples processed by the expO biospecimen repository,B obtained from community hospitalsGSE-7390A,D Europe Lymph node–negative breast cancer patients, 198 ER 29 (15) 2.5 68 systemically untreated, performed at the Bordet Institute and part of the TRANSBIG consortiumE-TABM-158E USA Frozen tumors collected from patients that received 100 ER, PR, 30 (23) 0.8 2.3 2.3 69 adjuvant chemotherapy (typically adriamycin and HER2 CTX) at UC San Francisco and the California Pacific Medical Center between 1989 and 1997GSE-2034A Netherlands Lymph node–negative relapse-free patients 286 ER 53 (19) 3.1 70 (80) and lymph node–negative patients that developed a distant metastasis (106) treated at Erasmus Medical CenterGSE-2990A Sweden, Invasive breast cancer from Uppsala, Sweden 189 ER 11 (6) 1.1 71 United Kingdom (88), of which 64 received tamoxifen only, or from John Radcliffe, Oxford, United Kingdom (101) of which all received mixed hormone and chemotherapyGSE-1456A Sweden Breast cancer patients receiving surgery at 159 NA 22 (14) 72 Karolinska Hospital between 1994 and 1996GSE-22513A, USA Invasive breast cancer pretreatment biopsies taken 112 ER, PR, 25 (22) 0.0 0.0 0.0 GSE-28821 from patients at the Vanderbilt-Ingram Cancer Center HER2GSE-28796GSE-11121A Germany Lymph node–negative breast cancer patients 200 NA 19 (10) 73 treated at the Johannes Gutenberg University Mainz between 1988 and 1998. Patients were all treated with surgery without adjuvant therapyGSE-2603A USA Primary breast cancers surgically resected 99 ER, PR 32 (32) 0.0 0.0 74 at the Memorial Sloan-Kettering Cancer CenterMDA133F USA Tumors from preoperative paclitaxel and 5-FU, 133 ER, PR, 21 (16) 0.0 3.0 0.8 25 doxorubicin, and CTX performed at the HER2 University of Texas MD Anderson Cancer CenterGSE-5364A Singapore Tumors from the National Cancer Centre of Singapore 183 N/A 31 (17) 75GSE-1561A Belgium Tumors from patients with invasive or inflammatory 49 ER, PR 16 (33) 0.0 0.0 29 breast cancers treated with 5-FU, epirubicin, and CTX obtained by the European Organization for Research and Treatment, Brussels, BelgiumTotal 2353 386 (16) 1.7 1.7 0.9
ASource: GEO. BSource: expO (https://expo.intgen.org/geo/). CInformation on ER, PR, HER2 status varied across samples. DSource: Breast International Group (http://www.breastinternationalgroup.org/Research/TRANSBIG.aspx). ESource: Array Express. FSource: MD Anderson Cancer Center (http://bioinformatics. mdanderson.org/pubdata.html). BC, breast cancer; TN, triple negative; n, number of samples; 5-FU, 5- fluorouracil; CTX, cyclophosphamide.

research article
TheJournalofClinicalInvestigation http://www.jci.org Volume 121 Number 7 July 2011 2753
sus matrix is a visual representation of the proportion of times in which 2 samples are clustered together across the resampling itera-tions (Figure 2B). Groups of samples that frequently cluster with one another are pictorially represented by darker shades of red. To determine the number of clusters present in the data, we exam-ined the area under the curve of the consensus distribution func-tion (CDF) plot (Figure 2C). The point at which the area under the curve ceases to show marked increases with additional cluster number (k) indicates the ideal number of clusters (Figure 2D and ref. 19). Therefore, the optimal number of clusters is 7, as defined by the consensus plots consistent with the k-means clustering (6 stable, 1 unstable). Unsupervised dimension reduction by prin-cipal component analysis demonstrated fundamental differences in GE between tumor subtypes identified by k-means and consen-sus clustering (Figure 2E).
To assess whether similar TNBC subtypes could be generated from an independent TNBC cohort, 201 TNBC samples were com-piled from bimodal filtering (Supplemental Table 1) of 7 additional publicly available data sets (Table 2). A GE signature was derived from the most differentially expressed genes found in the TNBC training set (see Methods and Supplemental Table 3) and used to predict which TNBC subtype was best-fit for each of the tumors in the validation set (Supplemental Table 4). Each sample from the
validation set was assigned to 1 of the TNBC subtypes derived from the training data set based on the highest Pearson correlation and lowest P value (Supplemental Table 4). Samples with correlations differing by P < 0.05 were considered unclassifiable. The validation set resulted in proportioned subtypes similar to those of the initial k-means clustering of the training set. After the analysis was com-pleted, we performed an ad hoc analysis by combining the training and validation data sets (587 tumors), which resulted in 7 subtypes identified by consensus clustering (Supplemental Figure 2), with similar enrichment in gene ontologies. This further validates the stability of the subtypes and shows that increasing sample size does not change optimal cluster number. Evaluation of GE profiles of RNA obtained from laser-capture microdissection of tumor cells from 2 data sets (GSE-22513; GSE-28821; GES-28796, Table 1; GSE-5847, Table 2) showed a similar pattern of distribution across all 7 subtypes, suggesting that these subtypes are indeed represen-tative primarily of GE resulting from epithelial tumor cells rather than stromal components surrounding the tumor (i.e., inflamma-tory cells, myofibroblasts, etc.) (Supplemental Figure 3).
Distinct gene ontologies are associated with each TNBC subtype. As an independent method to analyze TNBC subtypes, Gene Set Enrich-ment Analysis (GSE-A) (20) was performed on all genes from both the training (Supplemental Table 5) and validation sets (Supple-
Table 2Breast cancer GE data sets used to derive the TNBC validation set
Data set Country Case definition BC cases IHC n False positive (%) Ref. (%TN) ER PR HER2GSE-5327A,B Netherlands Tumors from patients with lymph node–negative 58 N/A 17 (30) 74 breast cancer, who did not receive systemic neoadjuvant or adjuvant therapy (EMC-344) at Erasmus Medical Center, Rotterdam, Netherlands treated between 1980 and 1995GSE-5847A USA Primary breast cancers between 1993 and 2003 95 ER, HER2 17 (35) 8.3 0.0 76 from patients receiving neoadjuvant chemotherapy collected at Baltimore hospitalsGSE-12276A Netherlands Lymph node–negative breast cancers from 204 N/A 46 (24) 77 patients with metastatic disease (114) following relapse after chemotherapy (EMC-192) and patients (48) without adjuvant systemic therapy (EMC-286) at Erasmus Medical Center, Rotterdam, NetherlandsGSE-16446A,B Europe Tumors from patients with ER-negative primary 120 HER 46 (38) 2.5 78 breast cancers treated with single-agent neoadjuvant epirubicin at European hospitals and coordinated at the Institut Jules Borde, Brussels, BelgiumGSE-18864A,C USA Tumors from patients with stage II or III 24 ER, PR, HER2 24 (100) 78 TNBCs treated with cisplatin at the Dana-Farber/Harvard CancerGSE-19615A USA Breast cancers from patients and treated with 115 ER, PR, HER2 30 (26) 0.0 0.9 3.5 78 adjuvant chemotherapy obtained from the Harvard Breast SPORE, Boston, Massachusetts, diagnosed between 2000 and 2003GSE-20194A USA Pretreatment tumors obtained from stage I-III 278 ER, PR, HER2 27 (23) 2.6 4.3 0.0 23 breast cancers at the University of Texas M. D. Anderson Cancer CenterTotal 894 201 (22) 1.7 2.6 1.7
ASource: GEO. BGSE-5327 and GSE-16446 data sets are derived from ER-negative tumors by IHC. CGSE-18864 data set includes only ER, PR and HER2 negative tumors by IHC.

research article
2754 TheJournalofClinicalInvestigation http://www.jci.org Volume 121 Number 7 July 2011
mental Table 6) to determine the top canonical pathways associ-ated with each TNBC subtype. The top enriched genes (P < 0.05), identified from the training set used to predict the validation set, are displayed in a heat map in Figure 3. The top canonical pathways substantially overlapped between the training and validation sets for each subtype, indicating that the subtypes were reproducibly enriched in unique pathways (Supplemental Table 7). Our 7 TNBC subtypes were characterized on the basis of gene ontologies and dif-ferential GE and subsequently labeled as follows: basal-like 1 (BL1);
basal-like 2 (BL2); immunomodulatory (IM); mesenchymal (M); mesenchymal stem–like (MSL); luminal androgen receptor (LAR); and unstable (UNS) (Figure 3). Independent analysis of 5 data sets based on TNBCs identified by IHC staining (n = 183) resulted in 4 clusters with GE similar to that of basal-like, IM, mesenchymal-like, and LAR subtypes (Supplemental Figures 4 and 5).
BL1 and BL2 subtypes. The top gene ontologies for the BL1 subtype are heavily enriched in cell cycle and cell division com-ponents and pathways (cell cycle, DNA replication reactome,
Figure 2Identification of TNBC subtypes. (A) Silhouette plot showing the composition (n = number of tumors) and stability (AVG width) of k-means clus-tering on the TNBC training set. Clusters with s(I) > 0 were considered stable. (B) Consensus clustering displaying the robustness of sample classification using multiple iterations (×1000) of k-means clustering. (C) The CDF depicting the cumulative distribution from consensus matrices at a given cluster number (k). (D) The optimal cluster number is 7 at the point in which the relative change in area (Δ) under the CDF plot does not change with increasing k. (E) Principal component analysis graphically depicting fundamental differences in GE between the TNBC clusters. The cluster (subtypes) are named as shown.

research article
TheJournalofClinicalInvestigation http://www.jci.org Volume 121 Number 7 July 2011 2755
Figure 3GE patterns within TNBC subtypes are reproducible. Heat maps showing the relative GE (log2, –3 to 3) of the top differentially expressed genes (P < 0.05) in each subtype in the training set (left) and the same differentially expressed genes used to predict the best-fit TNBC subtype of the validation set (right). Overlapping gene ontology (GO) terms for top canonical pathways in both the training and validation sets as determined by GSE-A are shown to the right of the heat maps.

research article
2756 TheJournalofClinicalInvestigation http://www.jci.org Volume 121 Number 7 July 2011
G2 cell-cycle pathway, RNA polymerase, and G1 to S cell cycle) (Figure 3). The annotations are supported by the expression of genes associated with proliferation, such as AURKA, AURKB, CENPA, CENPF, BUB1, TTK, CCNA2, PRC1, MYC, NRAS, PLK1, and BIRC5 (Supplemental Figure 6). Elevated DNA damage response (ATR/BRCA) pathways accompany the proliferation pathways in the BL1 subtype (Figure 3). Increased proliferation and cell-cycle checkpoint loss are consistent with the elevated expression of the DNA damage response genes observed (CHEK1, FANCA, FANCG, RAD54BP, RAD51, NBN, EXO1, MSH2, MCM10, RAD21, and MDC1) (Supplemental Figure 6).
The highly proliferative nature of this subtype is further sup-ported by the finding of high Ki-67 mRNA expression (MKI67) (Supplemental Figure 6) and nuclear Ki-67 staining as assessed by IHC analysis (BL1 + BL2 = 70% vs. other subtypes = 42%; P < 0.05) (Supplemental Figure 7). Enrichment of proliferation genes and increased Ki-67 expression in basal-like TNBC tumors suggest that
this subtype would preferentially respond to antimitotic agents such as taxanes (paclitaxel or docetaxel) (21, 22). This is indeed the case when comparing the percentage of patients achieving a pathologic complete response (pCR) in 42 TNBC patients treated with neoad-juvant taxane in 2 studies (22, 23). In these combined studies, TNBC patients whose tumors correlated to the basal-like (BL1 and BL2) subtype had a significantly higher pCR (63%; P = 0.042) when treat-ed with taxane-based therapies as compared with mesenchymal-like (31%) or LAR (14%) subtypes (Supplemental Figure 8).
The BL2 subtype displays unique gene ontologies involving growth factor signaling (EGF pathway, NGF pathway, MET path-way, Wnt/β-catenin, and IGF1R pathway) as well as glycolysis and gluconeogenesis (Figure 3). Likewise, the BL2 subtype is uniquely enriched in growth factor receptor GE such as EGFR, MET, and EPHA2 (Supplemental Figure 6). This subtype has features sugges-tive of basal/myoepithelial origin as demonstrated by higher expres-sion levels of TP63 and MME (CD10) (Supplemental Figure 6).
Table 3Assignment of TNBC cell lines to subtypes
TNBC subtype Cell line Subtype correlation Histology MutationsA Intrinsic Basal (P value) subtypeB subtypeC
Basal-likeBL1 HCC2157 0.66 (0.00) DC BRCA1; STAT4; UTX Basal Basal A HCC1599 0.62 (0.00) DC BRCA2; TP53; CTNND1; TOP2B; CAMK1G Basal Basal A HCC1937 0.28 (0.00) DC BRCA1; TP53; MAPK13; MDC1 HER2 Basal A HCC1143 0.26 (0.00) IDC TP53 Basal Basal A HCC3153 0.24 (0.00) BRCA1 Basal Basal A MDA-MB-468 0.19 (0.06) DC PTEN; RB1; SMAD4; TP53 Basal Basal A HCC38 0.19 (0.01) DC CDKN2A; TP53 Unclassified Basal BBL2 SUM149PT 0.30 (0.00) INF BRCA1 Unclassified Basal B CAL-851 0.25 (0.00) IGA RB1; TP53 Basal HCC70 0.24 (0.04) DC PTEN; TP53 Basal Basal A HCC1806 0.22 (0.00) ASCC CDKN2A; TP53; UTX Unclassified Basal A HDQ-P1 0.18 (0.17) IDC TP53 Unclassified IM HCC1187 0.22 (0.00) DC TP53; CTNNA1; DDX18; HUWE1; NFKBIA Basal Basal A DU4475 0.17 (0.00) DC APC; BRAF; MAP2K4; RB1 Unclassified
Mesenchymal-likeM BT-549 0.21 (0.00) IDC PTEN; RB1; TP53 Unclassified Basal B CAL-51 0.17 (0.00) AC PIK3CA Unclassified CAL-120 0.09 (0.00) AC TP53 Luminal B MSL HS578T 0.29 (0.00) CS CDKN2A; HRAS; TP53 Unclassified Basal B MDA-MB-157 0.25 (0.00) MBC NF1; TP53 Unclassified Basal B SUM159PT 0.14 (0.00) ANC PIK3CA; TP53 HRAS Unclassified Basal B MDA-MB-436 0.13 (0.00) IDC BRCA1; TP53 Unclassified Basal B MDA-MB-231 0.12 (0.00) IDC BRAF; CDKN2A; KRAS; NF2; TP53; PDGFRA Unclassified Basal B
LARLAR MDA-MB-453 0.53 (0.00) AC PIK3CA; CDH1; PTEN Luminal A Luminal SUM185PE 0.39 (0.00) DC PIK3CA Luminal A Luminal HCC2185 0.34 (0.00) PIK3CA Luminal A Luminal CAL-148 0.32 (0.00) AC PIK3CA; RB1; TP53; PTEN Luminal A MFM-223 0.31 (0.00) AC PIK3CA; TP53 Luminal A/B Unclassified HCC1395 DC ATR; BRCA2; CDKN2A; PTEN; Basal FGFR1; PDGFRB; TP53 BT20 IDC CDKN2A; PIK3CA; TP53 HER2 Basal A SW527 Luminal B
ASource: mutations taken from COSMIC database (www.sanger.ac.uk/genetics/CGP/cosmic/). BMolecular subtype determined by correlation with UNC/intrinsic breast centroids (29). CBasal subtype obtained from Neve RM et al. (32). AC, adenocarcinoma; ANC, anaplastic carcinoma; ASCC, acantholytic squamous cell carcinoma; C, carcinoma; CS, carcinosarcoma; DC, ductal carcinoma; IDC, invasive ductal carcinoma; IGA, invasive galactophoric adeno-carcinoma; INF, inflammatory ductal carcinoma; MC, metaplastic carcinoma and MBC, medullary breast cancer.

research article
TheJournalofClinicalInvestigation http://www.jci.org Volume 121 Number 7 July 2011 2757
IM subtype. The IM subtype is enriched for gene ontologies in immune cell processes. These processes include immune cell signaling (TH1/TH2 pathway, NK cell pathway, B cell receptor [BCR] signaling pathway, DC pathway, and T cell receptor sig-naling), cytokine signaling (cytokine pathway, IL-12 pathway, and IL-7 pathway), antigen processing and presentation, and signaling through core immune signal transduction pathways (NFKB, TNF, and JAK/STAT signaling) (Figure 3). The IM sig-
naling is evidenced by immune signal transduction GE (Supple-mental Figure 6), in addition to immune cell-surface antigens, cytokine signaling, complement cascade, chemokine receptors and ligands, and antigen presentation (Supplemental Figure 9). Since a similar proportion of samples that were microdissected fell into the IM subtype, it is likely that the IM characteristics are unique to the tumor cells themselves and not a reflection of immune cell infiltrate (Supplemental Figure 3). Immune signal-
Figure 4Basal-like TNBC subtypes have differential sensitivity to DNA-damaging agents. IC50 values for TNBC cell lines treated with PARP inhibitors (A) veliparib, (C) olaparib, or (E) cisplatin for 72 hours. Error bars reflect SEM for 3 independent experiments. Black horizontal lines above various bars in the plots indicate cell lines that failed to achieve an IC50 at the highest dose of veliparib (30 μM), olaparib (100 μM), or cisplatin (30 μM). Cell lines that carry BRCA1 or BRCA2 mutations (pink) are displayed below the graph. Dot plot shows the log distribution of drug sensitiv-ity to PARP inhibitors (B) veliparib, (D) olaparib, or (F) cisplatin in the basal-like subtypes (BL = BL1 + BL2), the mesenchymal-like subtypes (ML = M + MSL), and the LAR subtype. Black horizontal bars in the dot plot indicate the mean IC50 for each of the subtypes. *Statistically signifi-cant differences in IC50 values of BL compared with ML (P = 0.017) and LAR (P = 0.032), as determined by Mann-Whitney U test.

research article
2758 TheJournalofClinicalInvestigation http://www.jci.org Volume 121 Number 7 July 2011
ing genes within the IM subtype substantially overlap with a gene signature for medullary breast cancer, a rare, histologically distinct form of TNBC that despite its high-grade histology is associated with a favorable prognosis (24).
M and MSL subtypes. The M subtype displays a variety of unique gene ontologies that are heavily enriched in components and pathways involved in cell motility (regulation of actin by Rho), ECM receptor interaction, and cell differentiation pathways (Wnt pathway, anaplastic lymphoma kinase [ALK] pathway, and TGF-β signaling) (Figure 3). The MSL subtype shares enrich-ment of genes for similar biological processes with the M sub-type, including cell motility (Rho pathway), cellular differentia-tion, and growth pathways (ALK pathway, TGF-β signaling and Wnt/β-catenin pathway). However, unique to the MSL are genes representing components and processes linked to growth factor signaling pathways that include inositol phosphate metabolism, EGFR, PDGF, calcium signaling, G-protein coupled receptor, and ERK1/2 signaling as well as ABC transporter and adipocy-tokine signaling (Figure 3).
The prevalence of cell differentiation and growth factor sig-naling pathways is illustrated by expression of TGF-β signaling pathway components (TGFB1L1, BGN SMAD6, SMAD7, NOTCH1,
TGFB1, TGFB2, TGFB3, TGFBR1, TGFBR2, and TGFBR3), epithe-lial-mesenchymal transition–associated (EMT-associated) genes (MMP2, ACTA2, SNAI2, SPARC, TAGLN, TCF4, TWIST1, ZEB1, COL3A1, COL5A2, GNG11, ZEB2, and decreased E-cadherin [CDH1] expression), growth factors (FGF, IGF, and PDGF pathways), and Wnt/β-catenin signaling (CTNNB1, DKK2, DKK3, SFRP4, TCF4, TCF7L2, FZD4, CAV1, CAV2, and CCND2) (Supplemental Figure 6). The MSL subtype is also uniquely enriched in genes involved in angiogenesis, including VEGFR2 (KDR), TEK, TIE1, and EPAS1 as well as immune signaling evidenced by an overlap in GE unique to the IM subtype (Supplemental Figure 9).
One interesting difference between the M and MSL subtypes is that the MSL subtype expresses low levels of proliferation genes (Supplemental Figure 6). This decreased proliferation is accom-panied by enrichment in the expression of genes associated with stem cells (ABCA8, PROCR, ENG, ALDHA1, PER1, ABCB1, TERF2IP BCL2, BMP2, and THY1), numerous HOX genes (HOXA5, HOXA10, MEIS1, MEIS2, MEOX1, MEOX2, and MSX1), and mesenchymal stem cell–specific markers (BMP2, ENG, ITGAV, KDR, NGFR, NT5E, PDGFRB, THY1, and VCAM1) (Supplemental Figure 6 and data not shown). The signaling pathway components differentially expressed in the M and MSL groups share similar features with
Figure 5Differential sensitivity of the LAR TNBC subtype to AR and Hsp90 inhibitors. IC50 values for each TNBC cell line after treatment with (A) bicalu-tamide or (C) the Hsp90 inhibitor 17-DMAG for 72 hours. Black bar above bicalutamide indicates cell lines that failed to achieve an IC50. Heat map displays relative AR expression (log2) across TNBC cell lines. Dot plot shows log distribution of drug sensitivity to (B) bicalutamide or (D) 17-DMAG in the basal-like (BL = BL1 + BL2), mesenchymal-like (ML = M + MSL), and LAR subtypes. Black horizontal bars in the dot plot indicate the mean IC50 for each of the subtypes. *Statistically significant differences in IC50 values of LAR versus BL (P = 0.007) or ML (P = 0.038) after bicalutamide and LAR versus BL and ML (P = 0.05) after 17-DMAG treatments, as determined by Mann-Whitney U test.

research article
TheJournalofClinicalInvestigation http://www.jci.org Volume 121 Number 7 July 2011 2759
a highly dedifferentiated type of breast cancer called metaplastic breast cancer, which is characterized by mesenchymal/sarcoma-toid or squamous features and is chemoresistant (25).
The MSL subtype also displays low expression of claudins 3, 4, and 7, consistent with a recently identified claudin-low subtype of breast cancer (Supplemental Figures 6 and 10, and ref. 26). Hierarchical clustering of TNBC GE profiles using the claudin-low gene predictor set (n = 770) segregated a portion of the M and MSL subtypes with low claudin (3, 4, and 7), cytokeratin (KRT7, KRT8, KRT18, and KRT19), and CD24 expression (Supplemental Figure 10 and ref. 26). This population of claudin-low–expressing tumors also had high expression of genes associated with EMT (FBN1, MMP2, PDGFRB, THY1, SPARC, TGFBR2, PDGFRA, TWIST, CAV1, CAV2, and SERPINE1).
LAR subtype. GE in the LAR group was the most differential among TNBC subtypes. This subtype is ER negative, but gene ontologies are heavily enriched in hormonally regulated pathways including steroid synthesis, porphyrin metabolism, and andro-gen/estrogen metabolism (Figure 3). We therefore investigated whether other hormone-regulated pathways such as androgen receptor (AR) signaling, previously reported in ER-negative breast cancer (27), could be responsible for the GE patterns in this LAR
subtype. Indeed, we found that AR mRNA was highly expressed, on average at 9-fold greater than all other subtypes (Supplemental Figure 6). Tumors within the LAR group also expressed numerous downstream AR targets and coactivators (DHCR24, ALCAM, FASN, FKBP5, APOD, PIP, SPDEF, and CLDN8) (Supplemental Figure 6). In addition to AR mRNA expression, we investigated AR protein expression by IHC across all TNBC tumors from the Vanderbilt cohort (n = 20). The percentage of tumor cells scored with nuclear AR staining and the intensity of staining were significantly higher in the LAR subtype (>10-fold; P < 0.004) compared with all other TNBC subtypes (Supplemental Figure 11). We performed hierar-chical clustering using an AR-activated gene signature (28) on the training and validation TNBC tumor data sets. Hierarchical clus-tering with this signature segregated the majority of LAR tumor profiles from other subtypes (Supplemental Figure 12). Tumors in the LAR subtype display luminal GE patterns, with FOXA1, KRT18, and XBP1 among the most highly expressed genes (Supplemen-tal Figure 13A). Others have previously described a breast cancer subgroup expressing AR termed molecular apocrine (29). While we do not have detailed pathology reports for all of the LAR tumors in this study, we used the TNBC subgroup GE centroids to cor-relate the apocrine samples from GSE-1561 (ref. 29 and Table 1).
Figure 6Mesenchymal-like TNBC subtypes are sensitive to dasatinib and NVP-BEZ235. IC50 values for each TNBC cell lined treated with (A) dasatinib or (C) NVP-BEZ235 for 72 hours. Cell lines that have PIK3CA mutations (red) or are deficient in PTEN (blue, circle indicates mutated) are displayed below the NVP-BEZ235 graph. Dot plots show the log distribution of drug sensitivity to (B) dasatinib or (D) NVP-BEZ235 in the basal-like sub-types (BL = BL1 + BL2), mesenchymal-like subtypes (ML = M + MSL), and LAR. Black horizontal bars in the dot plots indicate the mean IC50 for each of the subtypes. *Statistically significant differences in IC50 values of BL versus ML (P = 0.020) when treated with dasatinib and ML versus BL (P = 0.001) and LAR versus BL (P = 0.01) when treated with NVP-BEZ235, as determined by Mann-Whitney U test.

research article
2760 TheJournalofClinicalInvestigation http://www.jci.org Volume 121 Number 7 July 2011
The GE profiles of all 6 apocrine tumors (GSM26883, GSM26878, GSM26886, GSM26887, GSM26903, and GSM26910) described in the study strongly correlate with LAR, suggesting that the LAR TNBC subtype is composed of AR-driven tumors that include the molecular apocrine subtype (Supplemental Table 8).
Intrinsic molecular breast cancer subtype classification of TNBC. Breast cancers can be classified as luminal or basal-like, dependent on their expression of different cytokeratins. TNBC tumor subtypes dis-
play differential expression of both basal-like cytokeratins (KRT5, KRT6A, KRT6B, KRT14, KRT16, KRT17, KRT23, and KRT81) and luminal cytokeratins (KRT7, KRT8, KRT18, and KRT19) across the subtypes (Supplemental Figure 13). The UNS, BL1, BL2, and M sub-types expressed higher levels of basal cytokeratin expression, while tumors within the LAR subtype lacked basal cytokeratin expression and expressed high levels of luminal cytokeratins and other luminal markers (FOXA1 and XBP1) (Supplemental Figure 13A).
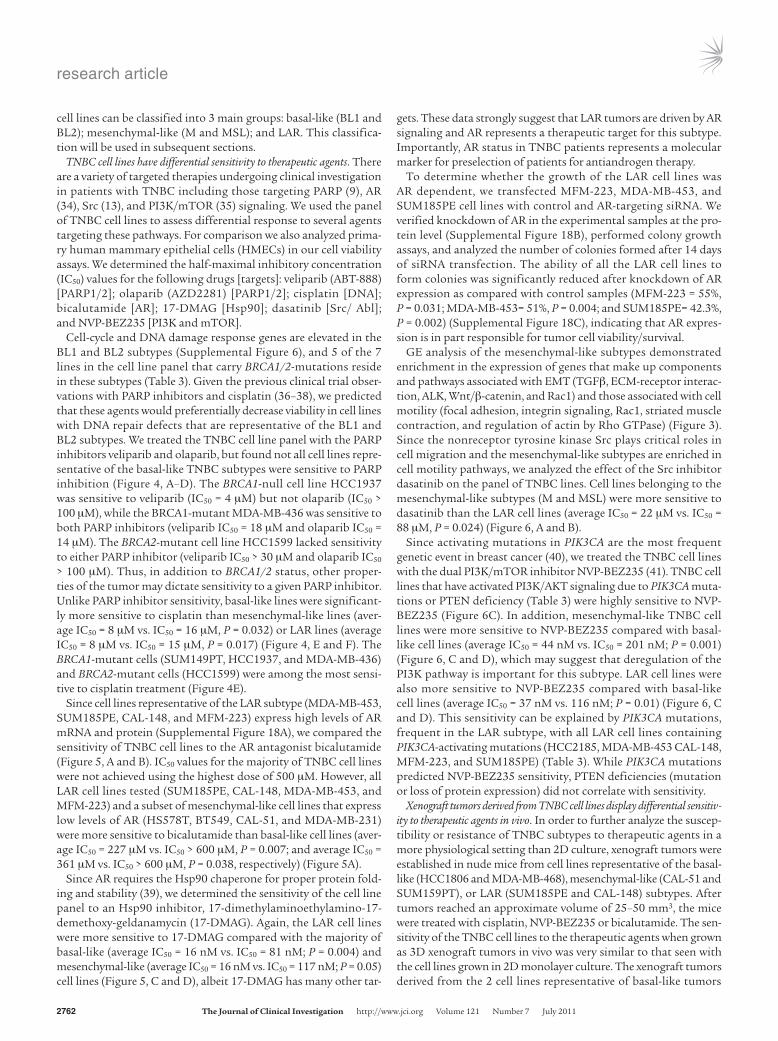
Figure 7Xenograft tumors established from TNBC subtypes display differential sensitivity to cisplatin, bicalutamide, and NVP-BEZ235. Nude mice bearing established tumors (25–50 mm3) from basal-like (HCC1806 and MDA-MB-468), LAR (SUM185PE and CAL-148), or mesenchymal-like (CAL-51 and SUM159PT) were treated with cisplatin (red), bicalutamide (purple), NVP-BEZ235 (green), or vehicle (blue) for approxi-mately 3 weeks. Serial tumor volumes (mm3) were measured at the indicated days. Each data point represents the mean tumor volume of 16 tumors; error bars represent SEM.

research article
TheJournalofClinicalInvestigation http://www.jci.org Volume 121 Number 7 July 2011 2761
In addition to cytokeratin expression, breast cancers can be clas-sified by an “intrinsic/UNC” 306-gene set into 5 major subtypes (basal-like, HER2-like, normal breast–like, luminal A, and luminal B) (30). Since TNBCs are largely considered basal-like, we correlated each of the 386 TNBC tumor profiles to the intrinsic gene set cen-troids of the 5 molecular subtypes, as previously described (30). Tumors were assigned to 1 of the molecular subtypes based on the highest correlation coefficient between each TNBC expression pro-file and the 5 molecular subtype centroids. This analysis resulted in 49% (n = 188) of our TNBC training set classified as basal-like, 14% (n = 54) as luminal A, 11% (n = 42) as normal breast–like, 8% (n = 31) as luminal B, 5% (n = 19) as HER2, and 13% (n = 52) as unclas-sifiable (Supplemental Figure 13B and Supplemental Table 9). This confirms that most TNBCs classify to the basal-like molecu-lar subtype. Both the unstable tumors and BL1 tumors correlated strongly to the basal-like intrinsic molecular classification (76% and 85%, respectively). However, the BL2, IM, and M subtypes only moderately correlated to the basal-like molecular class (31%, 58%, and 47%, respectively), with a portion of tumors unclassified (22%, 17%, and 18%, respectively) (Supplemental Figure 13B). The M and MSL subtypes displayed the largest portion of tumors classified as normal breast–like (25%, and 46%, respectively). The BL2, M, and MSL subtypes were a mixture of classifications, suggesting the intrinsic classification system may not be suitable for character-izing these TNBC subtypes. The majority of TNBC tumors within the LAR subtype were classified as either luminal A or luminal B (82%), and none were classified as basal-like, further supporting the luminal origin of the LAR subtype (Supplemental Figure 13). While only 49% of the tumors were classified as basal-like accord-ing to the intrinsic gene set, IHC staining performed on the Van-derbilt subset of tumors (n = 25) showed that the majority (88%) of TNBCs stained positive for the basal cytokeratins CK5/6 (Sup-plemental Table 10). Additionally, 56% of the Vanderbilt tumors stained positive for EGFR, similar to a previous study that found 56% of n = 929 pooled from 34 studies that were positive for EGFR or CK5/6 (31). There were no statistical differences between CK5/6 and EGFR staining across TNBC subtypes. Thus, the majority of TNBCs display a basal-like phenotype by IHC, while only approxi-mately half correlate to the basal-like intrinsic gene set.
Patient relapse-free survival and distant-metastasis–free survival differs among TNBC subtypes. Relapse-free survival (RFS) between TNBC subtypes was significantly different (log-rank test; P = 0.0083) (Supplemental Figure 14A), despite variability of therapy and dura-tion of treatment. RFS was significantly decreased in the LAR sub-type compared with the BL1 (hazard ratio [Hr] = 2.9), IM (Hr = 3.2), and MSL (Hr = 10.5) subtypes (P < 0.05) (Supplemental Figure 14B). RFS was significantly decreased in the M subtype compared with BL1 (Hr = 2.6) and IM (Hr = 2.9), while the MSL subtype had higher RFS than the M subtype (Supplemental Figure 14B). Dis-tant-metastasis–free survival (DMFS) did not vary between TNBC subtypes (log-rank test; P = 0.2176), but the M subtype had a sig-nificantly higher Hr compared with the BL1 (Hr = 2.4, P < 0.05) and IM (Hr = 1.9, P < 0.06) subtypes (Supplemental Figure 14, C and D). The increased RFS in the absence of increased DMFS for patients in the LAR subtype suggests that recurrence is due to local relapse. Tumor size and grade were not significantly differ-ent among TNBC subtypes, but age at diagnosis was greater in the LAR subtype (P < 0.0001), potentially contributing to decreased RFS of this subtype compared with other subtypes (Supplemental Figure 15 and data not shown).
TNBC cell line models for TNBC subtypes. Cell line models would facilitate preclinical experiments to define differential drug sen-sitivity of the distinct subtypes within this heterogeneous disease. Using the bimodal filtering approach on ER, PR, and HER2 GE levels from 2 independent breast cancer cell line data sets (GSE-10890 and ETABM-157), we identified 24 and 25 triple-nega-tive cell lines in the GSE-10890 and ETABM-157 GE data sets, respectively (Supplemental Table 1). Of the cell lines present in both data sets, nearly all had similar predictions of triple-nega-tive status by bimodal filtering. Discrepancies in some cell lines (e.g., HCC1500 and HCC1937) may be the result of differences in culturing methods and/or loss of hormone receptor expression over time in culture. Analysis of these 2 data sets identified 30 nonoverlapping TNBC cell lines.
GE profiles from the cell lines were correlated to the centroids (Supplemental Table 3) for each of the 6 TNBC subtypes (Sup-plemental Table 11). The majority of cell lines (27 of 30) were assigned to TNBC subtypes (Table 3), except for BT20, HCC1395, and SW527, which had low correlations (<0.1) or were similar between multiple subtypes (P > 0.05). Of the 7 cell lines that con-tained known BRCA1 and BRCA2 mutations, 5 correlated with the BL1 or BL2 subtypes (HCC1937, HCC1599, HCC2157, HCC3153, and SUM149PT), consistent with this subtype containing tumors with defects in DNA repair pathways (Table 3) and gene ontolo-gies enriched for GE involved in cell cycle and DNA repair func-tions (Supplemental Figure 6). Additionally, cell lines in the BL1 and BL2 subtypes were more genomically unstable, displaying significantly more chromosomal rearrangements than those in the mesenchymal subtypes (M and MSL) (average translocations, inversions, deletions = 34 versus 14, respectively; P < 0.01), as determined by SKY-FISH (http://www.path.cam.ac.uk/~pawefish/index.html) (Supplemental Figure 16). All cell lines that correlated to the basal-like intrinsic molecular subtype were in the BL1, BL2, or IM subtypes (Table 3). Only 2 cell lines (HCC1187 and DU4475) were placed into the IM subtype, suggesting that the IM subtype is underrepresented in cell culture.
Cell lines in the M and MSL subtypes were generated from highly dedifferentiated tumors derived from unique pathologies (e.g., HS578T, carcinosarcoma; and SUM159PT, anaplastic carcinoma) and expressed both epithelial and mesenchymal components. All cell lines assigned to the M and MSL subtype have spindle-like morphol-ogy in 2D culture (CAL-120, CAL-51, MDA-MB-157, MDA-MB-231, MDA-MB-436, SUM159PT, HS578T, and BT549) or stellate-like morphology in 3D (32). Five cell lines matched to the LAR subtype (MDA-MB-453, SUM185PE, HCC2185, CAL-148, and MFM-223).
Two distinct basal groups (A and B) have been identified by GE profiling of breast cancer cell lines (33). Basal A cell lines display epithelial characteristics and are associated with BRCA1 gene signatures, while basal B cell lines are more invasive and display mesenchymal and stem/progenitor-like characteristics. Our GE analyses revealed that the majority of basal A cell lines belong to the BL1 and BL2 subtypes, while the majority of basal B cell lines fall into the M and MSL subtypes (Table 3). We used hierarchical clustering analysis on all TNBC cell lines using the most differ-entially expressed genes from the tumors to determine whether GE patterns of the cell lines are similar within TNBC subtypes (Supplemental Figure 17). Three clusters were identified: LAR, containing all 4 LAR lines; basal-like, containing lines in the BL1 and BL2 subtypes; and mesenchymal-like, containing lines in the M and MSL subtypes. This clustering analysis indicates that TNBC
research article
2762 TheJournalofClinicalInvestigation http://www.jci.org Volume 121 Number 7 July 2011
cell lines can be classified into 3 main groups: basal-like (BL1 and BL2); mesenchymal-like (M and MSL); and LAR. This classifica-tion will be used in subsequent sections.
TNBC cell lines have differential sensitivity to therapeutic agents. There are a variety of targeted therapies undergoing clinical investigation in patients with TNBC including those targeting PARP (9), AR (34), Src (13), and PI3K/mTOR (35) signaling. We used the panel of TNBC cell lines to assess differential response to several agents targeting these pathways. For comparison we also analyzed prima-ry human mammary epithelial cells (HMECs) in our cell viability assays. We determined the half-maximal inhibitory concentration (IC50) values for the following drugs [targets]: veliparib (ABT-888) [PARP1/2]; olaparib (AZD2281) [PARP1/2]; cisplatin [DNA]; bicalutamide [AR]; 17-DMAG [Hsp90]; dasatinib [Src/ Abl]; and NVP-BEZ235 [PI3K and mTOR].
Cell-cycle and DNA damage response genes are elevated in the BL1 and BL2 subtypes (Supplemental Figure 6), and 5 of the 7 lines in the cell line panel that carry BRCA1/2-mutations reside in these subtypes (Table 3). Given the previous clinical trial obser-vations with PARP inhibitors and cisplatin (36–38), we predicted that these agents would preferentially decrease viability in cell lines with DNA repair defects that are representative of the BL1 and BL2 subtypes. We treated the TNBC cell line panel with the PARP inhibitors veliparib and olaparib, but found not all cell lines repre-sentative of the basal-like TNBC subtypes were sensitive to PARP inhibition (Figure 4, A–D). The BRCA1-null cell line HCC1937 was sensitive to veliparib (IC50 = 4 μM) but not olaparib (IC50 > 100 μM), while the BRCA1-mutant MDA-MB-436 was sensitive to both PARP inhibitors (veliparib IC50 = 18 μM and olaparib IC50 = 14 μM). The BRCA2-mutant cell line HCC1599 lacked sensitivity to either PARP inhibitor (veliparib IC50 > 30 μM and olaparib IC50 > 100 μM). Thus, in addition to BRCA1/2 status, other proper-ties of the tumor may dictate sensitivity to a given PARP inhibitor. Unlike PARP inhibitor sensitivity, basal-like lines were significant-ly more sensitive to cisplatin than mesenchymal-like lines (aver-age IC50 = 8 μM vs. IC50 = 16 μM, P = 0.032) or LAR lines (average IC50 = 8 μM vs. IC50 = 15 μM, P = 0.017) (Figure 4, E and F). The BRCA1-mutant cells (SUM149PT, HCC1937, and MDA-MB-436) and BRCA2-mutant cells (HCC1599) were among the most sensi-tive to cisplatin treatment (Figure 4E).
Since cell lines representative of the LAR subtype (MDA-MB-453, SUM185PE, CAL-148, and MFM-223) express high levels of AR mRNA and protein (Supplemental Figure 18A), we compared the sensitivity of TNBC cell lines to the AR antagonist bicalutamide (Figure 5, A and B). IC50 values for the majority of TNBC cell lines were not achieved using the highest dose of 500 μM. However, all LAR cell lines tested (SUM185PE, CAL-148, MDA-MB-453, and MFM-223) and a subset of mesenchymal-like cell lines that express low levels of AR (HS578T, BT549, CAL-51, and MDA-MB-231) were more sensitive to bicalutamide than basal-like cell lines (aver-age IC50 = 227 μM vs. IC50 > 600 μM, P = 0.007; and average IC50 = 361 μM vs. IC50 > 600 μM, P = 0.038, respectively) (Figure 5A).
Since AR requires the Hsp90 chaperone for proper protein fold-ing and stability (39), we determined the sensitivity of the cell line panel to an Hsp90 inhibitor, 17-dimethylaminoethylamino-17-demethoxy-geldanamycin (17-DMAG). Again, the LAR cell lines were more sensitive to 17-DMAG compared with the majority of basal-like (average IC50 = 16 nM vs. IC50 = 81 nM; P = 0.004) and mesenchymal-like (average IC50 = 16 nM vs. IC50 = 117 nM; P = 0.05) cell lines (Figure 5, C and D), albeit 17-DMAG has many other tar-
gets. These data strongly suggest that LAR tumors are driven by AR signaling and AR represents a therapeutic target for this subtype. Importantly, AR status in TNBC patients represents a molecular marker for preselection of patients for antiandrogen therapy.
To determine whether the growth of the LAR cell lines was AR dependent, we transfected MFM-223, MDA-MB-453, and SUM185PE cell lines with control and AR-targeting siRNA. We verified knockdown of AR in the experimental samples at the pro-tein level (Supplemental Figure 18B), performed colony growth assays, and analyzed the number of colonies formed after 14 days of siRNA transfection. The ability of all the LAR cell lines to form colonies was significantly reduced after knockdown of AR expression as compared with control samples (MFM-223 = 55%, P = 0.031; MDA-MB-453= 51%, P = 0.004; and SUM185PE= 42.3%, P = 0.002) (Supplemental Figure 18C), indicating that AR expres-sion is in part responsible for tumor cell viability/survival.
GE analysis of the mesenchymal-like subtypes demonstrated enrichment in the expression of genes that make up components and pathways associated with EMT (TGFβ, ECM-receptor interac-tion, ALK, Wnt/β-catenin, and Rac1) and those associated with cell motility (focal adhesion, integrin signaling, Rac1, striated muscle contraction, and regulation of actin by Rho GTPase) (Figure 3). Since the nonreceptor tyrosine kinase Src plays critical roles in cell migration and the mesenchymal-like subtypes are enriched in cell motility pathways, we analyzed the effect of the Src inhibitor dasatinib on the panel of TNBC lines. Cell lines belonging to the mesenchymal-like subtypes (M and MSL) were more sensitive to dasatinib than the LAR cell lines (average IC50 = 22 μM vs. IC50 = 88 μM, P = 0.024) (Figure 6, A and B).
Since activating mutations in PIK3CA are the most frequent genetic event in breast cancer (40), we treated the TNBC cell lines with the dual PI3K/mTOR inhibitor NVP-BEZ235 (41). TNBC cell lines that have activated PI3K/AKT signaling due to PIK3CA muta-tions or PTEN deficiency (Table 3) were highly sensitive to NVP-BEZ235 (Figure 6C). In addition, mesenchymal-like TNBC cell lines were more sensitive to NVP-BEZ235 compared with basal-like cell lines (average IC50 = 44 nM vs. IC50 = 201 nM; P = 0.001) (Figure 6, C and D), which may suggest that deregulation of the PI3K pathway is important for this subtype. LAR cell lines were also more sensitive to NVP-BEZ235 compared with basal-like cell lines (average IC50 = 37 nM vs. 116 nM; P = 0.01) (Figure 6, C and D). This sensitivity can be explained by PIK3CA mutations, frequent in the LAR subtype, with all LAR cell lines containing PIK3CA-activating mutations (HCC2185, MDA-MB-453 CAL-148, MFM-223, and SUM185PE) (Table 3). While PIK3CA mutations predicted NVP-BEZ235 sensitivity, PTEN deficiencies (mutation or loss of protein expression) did not correlate with sensitivity.
Xenograft tumors derived from TNBC cell lines display differential sensitiv-ity to therapeutic agents in vivo. In order to further analyze the suscep-tibility or resistance of TNBC subtypes to therapeutic agents in a more physiological setting than 2D culture, xenograft tumors were established in nude mice from cell lines representative of the basal-like (HCC1806 and MDA-MB-468), mesenchymal-like (CAL-51 and SUM159PT), or LAR (SUM185PE and CAL-148) subtypes. After tumors reached an approximate volume of 25–50 mm3, the mice were treated with cisplatin, NVP-BEZ235 or bicalutamide. The sen-sitivity of the TNBC cell lines to the therapeutic agents when grown as 3D xenograft tumors in vivo was very similar to that seen with the cell lines grown in 2D monolayer culture. The xenograft tumors derived from the 2 cell lines representative of basal-like tumors

research article
TheJournalofClinicalInvestigation http://www.jci.org Volume 121 Number 7 July 2011 2763
(HCC1806 and MDA-MB-468) were highly and differentially sensi-tive to cisplatin and were significantly growth inhibited (P < 0.0001) relative to treatment with vehicle control or the other experimental treatments (bicalutamide and NVP-BEZ235) (Figure 7). The tumors derived from the LAR cell lines (SUM185PE and CAL-148) and the mesenchymal-like cell line that expresses low level AR protein (CAL-51) (Supplemental Figure 18) displayed significant sensitiv-ity to bicalutamide (Figure 7). The xenograft tumors derived from all the cell lines carrying activating PIK3CA mutations (SUM185PE, CAL-148, CAL-51, and SUM159PT) had partial response or com-plete compared with NVP-BEZ235 (Figure 7).
In summary, cell lines representative of the 6 TNBC subtypes display different sensitivities to a variety of agents, and important-ly, these differences can be attributed to distinct expression of cel-lular components and presence of mutations in key oncogenes and tumor suppressors. We propose our results have immediate clini-cal translation, as they provide a valuable platform and insights for ongoing and future clinical investigation. Our data suggest that patients with basal-like TNBC should be treated with agents that engage DNA damage signaling response pathways; those with tumors expressing AR should receive bicalutamide alone or in combination with PI3K inhibitors; and those with mesenchymal-like TNBC should be considered for trials exploring the activities of an Src antagonist in combination with a PI3K inhibitor.
DiscussionThrough GE analysis of 3247 breast cancers, we demonstrate that TNBCs can be reliably identified by filtering GE profiles for ER, PR, and HER2 mRNA levels. We compiled 587 TNBC GE profiles from 21 studies (training set = 386 and validation set = 201). We observed an 18% incidence rate of TNBC across the 21 independent studies (training and validation combined), similar to previously reported TNBC prevalence (17, 18). k-means and consensus clustering of tumor profiles revealed that TNBC is composed of 6 stable subtypes enriched in distinct gene ontologies and GE patterns. Furthermore, using a GE signature derived from TNBC patient tumors, we iden-tified cell-line models for each of the TNBC subtypes.
Previously, the majority (50%–90%) of TNBCs have been classified as basal-like either by IHC or by correlation to the intrinsic molec-ular breast cancer subtypes (17, 18, 42). A previous TNBC study identified 5 distinct hierarchical clusters in which 91% (88 of 97) of TNBCs identified by IHC correlated to the basal-like subtype (42). However, the study lacked molecular analysis of the tumors and conclusions were limited to clinical outcomes based on pathologi-cal markers. The relationship between TNBC and basal-like breast cancer remains controversial (43). The proportion of TNBCs with basal-like GE in our study was 47%, resulting in a higher propor-tion of TNBCs that correlate with other molecular subtypes: lumi-nal A (17%), normal breast–like (12%), luminal B (6%), HER2 (6%), or unclassified (12%). Our study indicates that TNBC is not limited to tumors with a basal-like phenotype; rather it is a heterogeneous collection of tumors with distinct phenotypes, as evidenced by the diverse GE patterns and varying sensitivity of representative cell lines to the targeted therapies assessed in this study.
The BL1 and BL2 subtypes express high levels of genes involved in cell proliferation and DNA damage response, suggesting patients with basal-like tumors would benefit from agents that preferentially target highly proliferative tumors (e.g., anti-mitot-ic and DNA-damaging agents). Consistent with this notion, patients with basal-like tumors had up to a 4-fold higher pCR
after taxane-based and radiation-based treatment as compared with patients with tumors that displayed characteristics of the ML or LAR subtypes (22, 23).
Nearly all of the cell lines with known mutations in BRCA1 and BRCA2 had GE patterns that correlated with the basal-like subtype, which is in agreement with the current view that BRCA-mutant tumors display a basal-like phenotype (44). A number of non–BRCA-mutant cell lines that correlated with the basal-like TNBC subtypes contained nearly 2-fold the number of chromosome rearrangements as all other subtypes. These findings suggest that a predominant characteristic of basal-like TNBC is genomic instability (45). Because of GE similarities between basal-like TNBC and BRCA1-mutation carriers, PARP inhibitors are currently being tested in clinical trials for TNBC (46). Despite success in BRCA-null cells, there is not suffi-cient evidence for PARP inhibitor efficacy in BRCA1/2-mutant breast cancer cells (9). PARP sensitivity across a panel of TNBC cell lines did not correlate with TNBC subtype alignment or BRCA1/2-status in our study using short-term cell viability assays (72 hours). How-ever, the synthetic lethal effects of PARP inhibition in homologous recombination-deficient cells may require multiple cell divisions and may be more appropriately tested in long-term survival assays. Other studies show that a subset of BRCA1-mutant tumors lack large-scale genomic alterations and these tumors represent a distinct disease entity and may not be susceptible to PARP inhibition (44). Previous analyses of PARP inhibitors in isogenic BRCA2+/+ and BRCA2–/– cell lines suggest that sensitivity to this targeted therapy is dependent on the molecular context of the DNA repair machinery and that DNA repair requiring homologous recombination involves multiple redun-dant pathways (9, 10). BRCA1 is a relatively large protein (1863 aa) that forms numerous complexes that may not be entirely disrupted when BRCA1 and BRCA2 are mutated, as opposed to BRCA-null cells. Despite an incomplete understanding of the molecular mechanism of the PARP inhibitors in vivo, these drugs have been proven to be highly effective in the clinical trial setting (41% objective response rate; 6.2 month progression-free survival) (47).
We also found that BRCA1-mutant and non–BRCA-mutant basal-like cell lines had relatively higher sensitivity to cisplatin treatment compared with all other TNBC subtypes. Our results are consistent with the observed 21% pCR in a clinical trial investigating neoad-juvant cisplatin as a single agent in a heterogeneous TNBC patient population (48, 49). These data collectively suggest that the use of proliferation biomarkers such as Ki-67 and development of markers identifying defects in DNA damage response signaling could pro-vide patient selection and tailored treatments for basal-like TNBC. Use of cisplatin as a “targeted” agent alone or in combination with antimitotics (taxanes) and/or radiation may benefit patients with this subtype and a current trial is underway with these agents (50).
The IM subtype is highly enriched in immune cell signaling. Other studies have described the presence of immune response gene signa-tures in ER-negative and medullary breast cancers (24, 51). Similar to these studies, we found elevated expression of T cell–associated genes, immune transcription factors, IFN regulatory factors, TNF, comple-ment pathway, and antigen processing. We cannot rule out that the possibility that the GE profile of the IM subtype comprises, at least in part, stromal components including immune cell infiltrate. How-ever, the finding that the same proportion of microdissected tumors belongs to this group argues against stromal contamination.
The M and MSL subtypes share similar gene ontologies and GE profiles involving TGF-β, mTOR, Rac1/Rho, Wnt/β-catenin, FGFR, PDGFR, and VEGF signaling pathways. These signaling

research article
2764 TheJournalofClinicalInvestigation http://www.jci.org Volume 121 Number 7 July 2011
pathways are prominent in processes of EMT and stem cell–like properties of a CD44+CD24– population of normal mammary cells (52, 53). Similarly, the MSL subtype is made up at least in part by the recently described claudin-low tumors, which lack luminal dif-ferentiation markers, high enrichment for EMT markers, immune response genes, and cancer stem cell–like features (26). Interest-ingly, the M and MSL subtypes differed clinically, with patients in the M subtype presenting with shorter RFS. This may be a reflec-tion of differences in proliferation, as the M subtype displayed higher expression of proliferation-associated genes, including Ki-67. Additionally, patients with the M and MSL subtypes had decreased 5-year DMFS, consistent with enrichment in pathways associated with metastasis and motility.
Tumors within the mesenchymal-like subtypes have GE profiles that are similar to those from mesenchymal cells and metaplastic breast cancers (54). Metaplastic breast cancers have lineage plastic-ity, including foci of spindle cell, as well as osseous or cartilaginous differentiation (25). A recent study found that 47% of metaplastic breast cancers sequenced have PIK3CA mutations and have higher phosho-AKT expression (54). We found that TNBC mesenchymal-like cell lines preferentially responded to the dual PI3K/mTOR inhibitor NVP-BEZ235. This response to NVP-BEZ235 was dem-onstrated in cell lines that carry PIK3CA mutations in xenografts in addition to an MSL cell line (SUM159PT) that lacks PIK3CA mutation or PTEN deficiencies, suggesting that the PI3K/mTOR pathway is important in the mesenchymal-like subtype.
The mesenchymal-like subtypes were enriched in pathways asso-ciated with EMT and cell motility. There is evidence of a promi-nent role for Src in tumor cells that are highly invasive, such as those that have undergone EMT (55). Accordingly, we found that mesenchymal-like TNBC cell lines had differential sensitivity to dasatinib. Markers of EMT may have clinical value for patient preselection for trials using dasatinib. In addition, Wnt-signaling pathways regulate EMT and may contribute to tumor cell inva-sion (56). Mutations in the Wnt/β-catenin pathway (CTNNB1, APC, and WISP3) occur frequently (52%) in metaplastic breast cancer, suggesting that deregulated Wnt/β-catenin pathway in these tumors may be a viable therapeutic target (27). Inhibitors of Wnt/β-catenin are of great interest and currently are in preclinical development (57). Drugs targeting this pathway could be of value for treating mesenchymal-like TNBC.
The LAR subtype was readily subclassified by an AR gene signa-ture and high levels of luminal cytokeratin expression. GE analysis of the LAR subtype is consistent with a prior report of a subset of ER-negative tumors expressing AR-regulated genes (58). In addi-tion, Farmer et al. described an apocrine tumor subtype based on GE profiling that was characterized by AR expression distinguish-ing this tumor subtype from other basal-like tumors (29). In our GE analysis of tumors from 21 studies, the prevalence of the LAR tumors was 11% (62 of 587) of TNBCs or 2% (62 of 3247) of all breast cancers. Analysis of clinical data demonstrated that patients in the LAR subtype had higher RFS but no difference in DMFS compared with all other TNBC subtypes, suggesting these patients have local relapse. The higher RFS could imply that this group of patients received ineffective therapies (standard chemotherapy); however, patients in the LAR group were significantly older at diagnosis and the extent of disease or age-associated comorbidities that affect the ability to deliver treatment as planned may have contributed to relapse. Older age at diagnosis has previously been reported in patients with AR-positive TNBC and is associated with postmeno-
pausal status (34). Whether this AR-driven subtype is arising from hormone-replacement therapy (HRT) merits further investigation; however, it is becoming clear that the risk of breast cancer increases with HRT, and synthetic progestins such as medroxyprogesterone acetate have been shown to bind and disrupt AR (59). We identified 5 cell lines that represent the LAR subtype and showed that they are sensitive to bicalutamide and 17-DMAG, suggesting that thera-pies targeting AR may be effective against tumors that express this hormone receptor. In fact, there is a clinical trial (NCT00468715) underway testing the effect of bicalutamide in preselected patients with ER/PR-negative AR-positive tumors (60). This further sup-ports using in silico–based approaches to provide leads for trials with other targeted therapies in TNBC subtypes.
In addition to agents that target AR function, LAR cell lines were also sensitive to PI3K inhibition. This sensitivity correlated with PIK3CA mutations. All 5 LAR cells lines have activating PIK3CA mutations and are sensitive to the PI3K inhibitor NVP-BEZ235, similar to ER-positive breast cancer in which PIK3CA mutations are common (61, 62). These findings suggest simultaneous target-ing of AR and the PI3K/mTOR pathway may be of clinical benefit for LAR TNBC patients, as this combination has been shown to be synergistic in AR-dependent prostate cancer cells (63).
Our GE analysis of TNBC demonstrates that with sufficient sample size, distinct subtypes of TNBC can be identified with putative molecular targets. Our analyses may provide biomark-ers that can be used for patient selection in the design of clinical trials for TNBC as well as identification of potential markers of response to treatment. The identification of cell lines representing TNBC tumor subtypes provides key models for preclinical studies with newly developed targeted agents. Further molecular charac-terization of these TNBC subtypes and cell lines through inte-grated genomic data analyses of DNA copy number, microRNA, epigenetic, and whole genome sequencing data sets together with RNAi loss-of-function screens will identify new components of the “driver” signaling pathways in each of these subtypes that can be targeted in future drug discovery efforts for TNBC.
MethodsLaser capture microdissection, RNA extraction, and GE profiling. Invasive tumor cells from serial sections of primary breast cancers (n = 112) were captured onto polymeric caps using the PixCell II lasercapture microdissection system (Arcturus) as previously described (22). Areas of ductal carcino-ma in situ and normal breast tissue were excluded and areas of inflam-mation and areas with tumor-associated fibroblasts were avoided. Total RNA was isolated from captured cells, quantified, and integrity analyzed, and microarray analyses were done using Affymetrix GeneChip Human Genome U133 Plus 2.0 arrays as previously described (22).
Data set collection and TNBC identification by bimodal filtering. We compiled 2353 human breast cancer GE profiles from 14 publicly available breast cancer microarray data sets (GEO, http://www.ncbi.nlm.nih.gov/gds; Array Express, http://www.ebi.ac.uk/microarray-as/ae/) including 112 primary breast cancer GE profiles from our institution (Vanderbilt University Medi-cal Center). All Vanderbilt tissue samples were taken from individuals treat-ed at Vanderbilt University with institutional review board approval, and all patients signed a protocol-specific consent. All GE profiles were generated on Affymetrix microarrays and collected for identification of TNBCs for the training data set (Table 1). An additional 894 breast cancer GE profiles from 7 data sets were collected for the identification of TNBCs for the validation data set (Table 2). Raw GE values for each data set (n = 21) were normalized independently using RMA procedure. The Affymetrix probes 205225_at,

research article
TheJournalofClinicalInvestigation http://www.jci.org Volume 121 Number 7 July 2011 2765
208305_at and 216836_s_at were chosen to represent ER, PR, and HER2 expression, respectively (64). For each data set, empirical expression distri-butions of ER, PR, and HER2 were analyzed using a 2-component Gaussian mixture distribution model and parameters were estimated by maximum likelihood optimization, using optim function (R statistical software, http://www.r-project.org). We then estimated the posterior probability of negative expression status for ER, PR, and HER2. A sample was classified as hav-ing negative expression if its posterior probability was less than 0.5. Upon initial hierarchical clustering, it was evident that some samples were from the same tumors, but in different data sets. These and additional outliers were removed after PCA. To ensure all ER/PR/HER2-positive tumors were removed, a secondary filter was performed on the combined samples iden-tified by bimodal filtering. TNBC tumors were renormalized along with 5 positive controls for each parameter (ER, PR, and HER2) from 4 data sets that were positive by IHC and expressed mRNA near the center of the posi-tive bimodal peak (Figure 1B). Only tumors that displayed a greater than 10-fold reduction in expression than the positive controls were considered negative in expression and used for further analysis, resulting in 386 TNBC tumors (training set) and 201 TNBC tumors (validation set).
Normalization, data reduction, and cross-platform batch effect removal. Training (n = 386) and validation (n = 201) TNBC data sets identified by the 2-com-ponent Gaussian distribution model were collectively RMA normalized, summarized and log-transformed using the combined raw GE from each data set. For genes containing multiple probes, the probe with the largest interquartile range across the samples was chosen to represent the gene. Batch effects were removed by fitting each gene to a linear model with 14 and 7 fixed effects for each data set, respectively. The residual genes from this model (n = 13,060) were used for subsequent clustering analysis.
GE-based identification of TNBC subtypes. k-means clustering and consensus clustering were used to determine the optimal number of stable TNBC subtypes. Cluster robustness was assessed by consensus clustering using agglomerative k-means clustering (1,000 iterations), with average linkage on the 386 TNBC profiles using the most differentially expressed genes (SD > 0.8; n = 1510 genes) (Gene Pattern version 3.2.1, GSE-A, http://www.broadinstitute.org/gsea/) (19). The optimal number of clusters was deter-mined from the CDF, which plots the corresponding empirical cumulative distribution, defined over the range [0,1], and from calculation of the pro-portion increase in the area under the CDF curve. The number of clusters is decided when any further increase in cluster number (k) does not lead to a corresponding marked increase in the CDF area. PCA and heat maps were generated using Genespring GX ver.10 software (Agilent).
Functional annotation. Each TNBC subtype was tested for gene enrich-ment compared with all other samples using GSE-A software (20). Genes were tested for enrichment in the C2 curated gene sets of canonical path-ways. Using the GSE-A algorithm (1,000 permutations), the top signifi-cantly enriched canonical pathways were selected based on a normalized enrichment score (NES) greater than 0.4 and false discovery rate (FDR) q value of less than 0.60. The FDR cutoff of 0.60 was chosen because of the lack of coherence in the data set collection spanning 21 studies, and more stringent FDR cutoffs resulted in fewer results, potentially overlooking significant pathways.
TNBC subtype gene signature derivation. The 20% of genes with the highest and lowest expression levels in at least 50% of the samples for each sub-type were chosen for further analysis. Within each cluster, for each selected gene, we applied the nonparametric Kruskal-Wallis test to identify genes significantly different from the median GE among all 6 groups. Significant genes with a Bonferroni’s adjusted P value of less than 0.05 were included in the combined gene signature (n = 2188) for the TNBC subtypes and used to predict an independent validation set as well as to classify TNBC cell lines. Each sample from the validation set was assigned to a TNBC
subtype based on highest Pearson correlation and lowest P value to one of the subtypes derived from the training data set (Supplemental Table 4). Samples with correlations differing by a P value of less than 0.05 were con-sidered unclassifiable.
TNBC cell-line classification. GE data for TNBC cell lines (GSE-10890 and E-TABM-157) were correlated (Spearman) to the centroids of the GE signa-tures for each TNBC subtype. GE data from both the TNBC tumors and cell lines were combined so that each gene was standardized to have mean = 0 and SD = 1. GE profiles from the cell lines were correlated to the centroids for each of the 6 TNBC subtypes (Supplemental Table 11). To remove size effects of the 6 gene signatures, we estimated the empirical P values for the correlations using a resampling (bootstrap, n = 1000) approach and esti-mating correlation coefficients for each resample. Cell lines were assigned to the TNBC subtype with the highest correlation (Table 3), and those that had low correlations (<0.1) or were similar between multiple subtypes (P > 0.05) were considered unclassified.
Cell proliferation/viability assays and IC50 determinations. All cell lines and cul-ture conditions used can be found in Supplemental Methods (Supplemen-tal Table 12). We performed short tandem repeat (STR) DNA fingerprinting analysis on all TNBC cell lines used in this study (Cell Line Genetics). All cell lines matched STR databases (ATCC, DSMZ, and Asterand), and their identity was confirmed by a certified process at Cell Line Genetics. Breast cancer cell lines and HMECs were seeded (3,000–10,000 cells) in quadrupli-cate wells in 96-well plates. Cells were incubated in the presence of alamar-Blue (Invitrogen), and baseline (predrug) fluorescence (Ex/Em: 560/590 nm) measurements were obtained following overnight attachment. Medium was then replaced with either fresh medium (control) or medi-um containing half-log serial dilutions of the following drugs: 0.3–30 μM olaparib (ChemieTek), 0.3-30 μM veliparib (ChemieTek), 1–100 μM bicalu-tamide (IPR Pharmaceutical), 0.3–30 μM cisplatin (APP Pharmaceutical), 3–300 nM NVP-BEZ235 (Chemdea), 10–1000 nM 17-DMAG (ChemieTek), and 0.1–10 μM dasatinib (LC Laboratories). Viability was determined from measuring fluorescent intensity after metabolic reduction of alamarBlue in the presence/absence of the drug after 72 hours. Viability assays were performed in triplicate, and replicates were normalized to untreated wells. Inhibitory concentration (IC50) values were determined after double-log transformation of dose response curves as previously described (65). For analysis of cell-line drug assays, data generated from the different cell lines representative of TNBC subtypes were compared using the nonparamet-ric Mann-Whitney U test. All analyses and graphic representations were performed using Prism software (version 4.0c; GraphPad Software), and values are represented as the mean ± SEM.
Kaplan-Meier survival analysis and Hr. Log-rank test was used to determine survival significance in TNBC subtypes from Kaplan-Meier survival curves, RFS, and DMFS. Cox proportional hazards model was used to calculate Hr, demonstrating differences in survival by pairwise comparison between TNBC subtypes (P < 0.05).
Xenograft tumor studies. Five-week-old female athymic nude-Foxn1nu mice (Harlan Sprague-Dawley) were injected (s.c.) with either approximately 5 × 10⁶ (CAL-51, HCC1806, MDA-MB-468, and SUM185PE) or approximately 10 × 106 (CAL-148 and SUM159PT) cells suspended in medium (200 μl) into each flank using a 22-gauge needle. The protocols describing the process of xenograft tumor formation in athymic mice were reviewed and approved by the Vanderbilt Institutional Review Board. Once tumors reached a volume of 25–50 mm3, mice were randomly allocated to treatment or vehicle arms. Treatments included bicalutamide per oral (100 mg/kg/d), cisplatin i.p. (8 mg/kg/wk), or NVP-BEZ235 per oral (50 mg/kg/d) in 1:9 N-methylpyrol-idone: PEG300. Tumor diameters were serially measured at the indicated times with digital calipers, and tumor volumes were calculated as width2 × length/2. Data points reflect the means and SEM for 16 tumors per treatment.

research article
2766 TheJournalofClinicalInvestigation http://www.jci.org Volume 121 Number 7 July 2011
Statistics. Description of the relevant statistical methods used and analyses performed are described in the relevant Methods sections above. Compari-sons between cell lines representative of TNBC subtypes were performed using the nonparametric Mann-Whitney U test. Statistical significance of drug effects on tumor growth in athymic mice was determined by 2-tailed unpaired t test.
AcknowledgmentsWe thank Carlos Arteaga and Harold Moses as well as members of the Pietenpol lab for critical review of the manuscript. This research was supported by NIH grants as follows: CA95131 (Specialized Program of Research Excellence in Breast Cancer);
CA148375; CA105436 and CA070856 (to J.A. Pietenpol); CA68485 (core services); CA009385 (to J.A. Bauer); American Cancer Society Grant #PF-10-226-01-TBG (to B.D. Lehmann); and Komen Foun-dation grant SAC110030 (to J.A. Pietenpol).
Received for publication September 6, 2010, and accepted in revised form April 6, 2011.
Address correspondence to: Jennifer A. Pietenpol, Vanderbilt-Ingram Cancer Center, 652 Preston Research Building, Nashville, Tennessee 37232, USA. Phone: 615.936.1512; Fax: 615.936.2294; E-mail: [email protected].
1. Pegram MD, et al. Phase II study of receptor-enhanced chemosensitivity using recombinant humanized anti-p185HER2/neu monoclonal antibody plus cisplatin in patients with HER2/neu-overexpressing metastatic breast cancer refractory to chemotherapy treatment. J Clin Oncol. 1998;16(8):2659–2671.
2. Wiggans RG, et al. Phase-II trial of tamoxifen in advanced breat cancer. Cancer Chemother Pharmacol. 1979;3(1):45–48.
3. Carey LA, et al. The triple negative paradox: primary tumor chemosensitivity of breast cancer subtypes. Clin Cancer Res. 2007;13(8):2329–2334.
4. Morris GJ, et al. Differences in breast carcinoma characteristics in newly diagnosed African-Ameri-can and Caucasian patients: a single-institution compilation compared with the National Cancer Institute’s Surveillance, Epidemiology, and End Results database. Cancer. 2007;110(4):876–884.
5. Haffty BG, et al. Locoregional relapse and dis-tant metastasis in conservatively managed triple negative early-stage breast cancer. J Clin Oncol. 2006;24(36):5652–5657.
6. Dent R, et al. Triple-negative breast cancer: clinical features and patterns of recurrence. Clin Cancer Res. 2007;13(15 pt 1):4429–4434.
7. D’Andrea AD, Grompe M. The Fanconi anaemia/BRCA pathway. Nat Rev Cancer. 2003;3(1):23–34.
8. Hoeijmakers JH. Genome maintenance mecha-nisms for preventing cancer. Nature. 2001; 411(6835):366–374.
9. Farmer H, et al. Targeting the DNA repair defect in BRCA mutant cells as a therapeutic strategy. Nature. 2005;434(7035):917–921.
10. Fong PC, et al. Inhibition of poly(ADP-ribose) poly-merase in tumors from BRCA mutation carriers. N Engl J Med. 2009;361(2):123–134.
11. Burstein HJ, et al. Phase II study of sunitinib malate, an oral multitargeted tyrosine kinase inhibitor, in patients with metastatic breast cancer previously treated with an anthracycline and a taxane. J Clin Oncol. 2008;26(11):1810–1816.
12. Nielsen TO, et al. Immunohistochemical and clinical characterization of the basal-like sub-type of invasive breast carcinoma. Clin Cancer Res. 2004;10(16):5367–5374.
13. Finn RS, et al. Dasatinib, an orally active small molecule inhibitor of both the src and abl kinases, selectively inhibits growth of basal-type/”triple-negative” breast cancer cell lines growing in vitro. Breast Cancer Res Treat. 2007;105(3):319–326.
14. Ellard SL, et al. Randomized phase II study com-paring two schedules of everolimus in patients with recurrent/metastatic breast cancer: NCIC Clinical Trials Group IND.163. J Clin Oncol. 2009; 27(27):4536–4541.
15. Carmeci C, deConinck EC, Lawton T, Bloch DA, Weigel RJ. Analysis of estrogen receptor messenger RNA in breast carcinomas from archival speci-mens is predictive of tumor biology. Am J Pathol. 1997;150(5):1563–1570.
16. Press MF, et al. HER-2 gene amplification, HER-2 and epidermal growth factor receptor mRNA and protein expression, and lapatinib efficacy in women with metastatic breast cancer. Clin Cancer Res. 2008;14(23):7861–7870.
17. Bertucci F, et al. How basal are triple-negative breast cancers? Int J Cancer. 2008;123(1):236–240.
18. Rakha EA, et al. Triple-negative breast cancer: dis-tinguishing between basal and nonbasal subtypes. Clin Cancer Res. 2009;15(7):2302–2310.
19. Monti S, Tamayo P, Mesirov J, Golub T. Con-sensus clustering: A resampling-baased method for class discovery and visualization of gene expression microarray data. Machine Learning. 2003;52(1–2):91–118.
20. Subramanian A, et al. Gene set enrichment analy-sis: a knowledge-based approach for interpreting genome-wide expression profiles. Proc Natl Acad Sci U S A. 2005;102(43):15545–15550.
21. Chakravarthy AB, et al. Neoadjuvant concurrent paclitaxel and radiation in stage II/III breast cancer. Clin Cancer Res. 2006;12(5):1570–1576.
22. Bauer JA, et al. Identification of markers of taxane sensitivity using proteomic and genomic analyses of breast tumors from patients receiving neoadju-vant paclitaxel and radiation. Clin Cancer Res. 2010; 16(2):681–690.
23. Juul N, et al. Assessment of an RNA interference screen-derived mitotic and ceramide pathway metagene as a predictor of response to neoadjuvant paclitaxel for primary triple-negative breast cancer: a retrospective analysis of five clinical trials. Lancet Oncol. 2010;11(4):358–365.
24. Bertucci F, et al. Gene expression profiling shows medullary breast cancer is a subgroup of basal breast cancers. Cancer Res. 2006;66(9):4636–4644.
25. Gibson GR, Qian D, Ku JK, Lai LL. Metaplastic breast cancer: clinical features and outcomes. Am Surg. 2005;71(9):725–730.
26. Prat A, et al. Phenotypic and molecular charac-terization of the claudin-low intrinsic subtype of breast cancer. Breast Cancer Res. 2010;12(5):R68.
27. Hayes MJ, Thomas D, Emmons A, Giordano TJ, Kleer CG. Genetic changes of Wnt pathway genes are common events in metaplastic carcinomas of the breast. Clin Cancer Res. 2008;14(13):4038–4044.
28. Chen CD, et al. Molecular determinants of resis-tance to antiandrogen therapy. Nat Med. 2004; 10(1):33–39.
29. Farmer P, et al. Identification of molecular apo-crine breast tumours by microarray analysis. Onco-gene. 2005;24(29):4660–4671.
30. Hu Z, et al. The molecular portraits of breast tumors are conserved across microarray platforms. BMC Genomics. 2006;7:96.
31. Yang XR, et al. Associations of breast cancer risk factors with tumor subtypes: a pooled analysis from the breast cancer association consortium studies. J Natl Cancer Inst. 2011;103(3):250–263.
32. Kenny PA, et al. The morphologies of breast can-cer cell lines in three-dimensional assays correlate
with their profiles of gene expression. Mol Oncol. 2007;1(1):84–96.
33. Neve RM, et al. A collection of breast cancer cell lines for the study of functionally distinct cancer subtypes. Cancer Cell. 2006;10(6):515–527.
34. Agoff NS, Swanson PE, Linden H, Hawes SE, Law-ton TJ. Androgen receptor expression in estrogen receptor–negative breast cancer. Am J Clin Pathol. 2003;120(5):725–731.
35. Marty B, et al. Frequent PTEN genomic alterations and activated phosphatidylinositol 3-kinase path-way in basal-like breast cancer cells. Breast Cancer Res. 2008;10(6):R101.
36. Bhattacharyya A, Ear US, Koller BH, Weichselbaum RR, Bishop DK. The breast cancer susceptibility gene BRCA1 is required for subnuclear assembly of Rad51 and survival following treatment with the DNA cross-linking agent cisplatin. J Biol Chem. 2000;275(31):23899–23903.
37. Jones P, et al. Discovery of 2-{4-[(3S)-piperidin-3-yl]phenyl}-2H-indazole-7-carboxamide (MK-4827): a novel oral poly(ADP-ribose)polymerase (PARP) inhibitor efficacious in BRCA-1 and -2 mutant tumors. J Med Chem. 2009;52(22):7170–7185.
38. Evers B, et al. Selective inhibition of BRCA2-defi-cient mammary tumor cell growth by AZD2281 and cisplatin. Clin Cancer Res. 2008;14(12):3916–3925.
39. Solit DB, et al. 17-Allylamino-17-demethoxygel-danamycin induces the degradation of androgen receptor and HER-2/neu and inhibits the growth of prostate cancer xenografts. Clin Cancer Res. 2002; 8(5):986–993.
40. Samuels Y, et al. High frequency of mutations of the PIK3CA gene in human cancers. Science. 2004;304(5670):554.
41. Maira SM, et al. Identification and characterization of NVP-BEZ235, a new orally available dual phos-phatidylinositol 3-kinase/mammalian target of rapamycin inhibitor with potent in vivo antitumor activity. Mol Cancer Ther. 2008;7(7):1851–1863.
42. Kreike B, et al. Gene expression profiling and histopathological characterization of triple-nega-tive/basal-like breast carcinomas. Breast Cancer Res. 2007;9(5):R65.
43. Rakha E, Ellis I, Reis-Filho J. Are triple–negative and basal–like breast cancer synonymous? Clin Cancer Res. 2008;14(2):618.
44. Stefansson OA, et al. Genomic profiling of breast tumours in relation to BRCA abnormalities and phenotypes. Breast Cancer Res. 2009;11(4):R47.
45. Kwei KA, Kung Y, Salari K, Holcomb IN, Pollack JR. Genomic instability in breast cancer: pathogenesis and clinical implications. Mol Oncol. 2010;4(3):255–266.
46. Silver DP, et al. Efficacy of neoadjuvant Cispla-tin in triple-negative breast cancer. J Clin Oncol. 2010;28(7):1145–1153.
47. Audeh MW, et al. Phase II trial of the oral PARP inhibitor olaparib (AZD2281) in BRCA-defi-cient advanced ovarian cancer. J Clin Oncol. 2009;27:5500.
48. Garber JE, et al. Neo-adjuvant cisplatin (CDDP)

research article
TheJournalofClinicalInvestigation http://www.jci.org Volume 121 Number 7 July 2011 2767
in triple-negative” breast cancer. Breast Cancer Res Treat. 2006;105:S149.
49. Telli ML, Ford JM. Novel treatment approaches for triple-negative breast cancer. Clin Breast Cancer. 2010;10 suppl 1:E16–E22.
50. Mayer IA, et al. A phase II newoadjuvant negative (TN) locally advanced breast cancer (BC). J Clin Oncol. 2010;28(1):15.
51. Teschendorff AE, Miremadi A, Pinder SE, Ellis IO, Caldas C. An immune response gene expression module identifies a good prognosis subtype in estrogen receptor negative breast cancer. Genome Biol. 2007;8(8):R157.
52. Mani SA, et al. The epithelial-mesenchymal transi-tion generates cells with properties of stem cells. Cell. 2008;133(4):704–715.
53. Shipitsin M, et al. Molecular definition of breast tumor heterogeneity. Cancer Cell. 2007;11(3):259–273.
54. Hennessy BT, et al. Characterization of a naturally occurring breast cancer subset enriched in epithe-lial-to-mesenchymal transition and stem cell char-acteristics. Cancer Res. 2009;69(10):4116–4124.
55. Guarino M. Src signaling in cancer invasion. J Cell Physiol. 2010;223(1):14–26.
56. Shin SY, et al. Functional roles of multiple feed-back loops in extracellular signal-regulated kinase and Wnt signaling pathways that regulate epithelial-mesenchymal transition. Cancer Res. 2010;70(17):6715–6724.
57. MacDonald BT, Tamai K, He X. Wnt/beta-catenin signaling: components, mechanisms, and diseases. Dev Cell. 2009;17(1):9–26.
58. Doane AS, et al. An estrogen receptor-negative breast cancer subset characterized by a hormonally regulated transcriptional program and response to androgen. Oncogene. 2006;25(28):3994–4008.
59. Birrell SN, Butler LM, Harris JM, Buchanan G, Tilley
WD. Disruption of androgen receptor signaling by synthetic progestins may increase risk of developing breast cancer. FASEB J. 2007;21(10):2285–2293.
60. Memorial Sloan-Kettering Cancer Center and National Cancer Institute (NCI). Bicalutamide in treating patients with metastatic breast cancer. NIH Web site. http://clinicaltrials.gov/ct2/show/NCT00468715. Accessed April 14, 2011.
61. Gonzalez-Angulo AM, et al. Androgen receptor levels and association with PIK3CA mutations and prognosis in breast cancer. Clin Cancer Res. 2009;15(7):2472–2478.
62. Stemke-Hale K, et al. An integrative genomic and proteomic analysis of PIK3CA, PTEN, and AKT mutations in breast cancer. Cancer Res. 2008; 68(15):6084–6091.
63. Liu X, Gomez-Pinillos A, Ferrari AC. Simulta-neous targeting of the androgen receptor and PI3K/mTOR pathway in androgen-dependent and androgen-independent prostate cancer cells. J Clin Oncol. 2010;28:(suppl; abstr e15049).
64. Karn T, et al. Data driven derivation of cutoffs from a pool of 3,030 Affymetrix arrays to stratify distinct clinical types of breast cancer. Breast Cancer Res Treat. 2010;120(3):567–579.
65. Bauer JA, et al. RNA interference (RNAi) screening approach identifies agents that enhance paclitaxel activity in breast cancer cells. Breast Cancer Res. 2010;12(3):R41.
66. Miller LD, et al. An expression signature for p53 sta-tus in human breast cancer predicts mutation sta-tus, transcriptional effects, and patient survival. Proc Natl Acad Sci U S A. 2005;102(38):13550–13555.
67. Richardson AL, et al. X chromosomal abnormali-ties in basal-like human breast cancer. Cancer Cell. 2006;9(2):121–132.
68. Desmedt C, et al. Strong time dependence of the
76-gene prognostic signature for node-negative breast cancer patients in the TRANSBIG multi-center independent validation series. Clin Cancer Res. 2007;13(11):3207–3214.
69. Chin K, et al. Genomic and transcriptional aber-rations linked to breast cancer pathophysiologies. Cancer Cell. 2006;10(6):529–541.
70. Wang Y, et al. Gene-expression profiles to predict distant metastasis of lymph-node-negative primary breast cancer. Lancet. 2005;365(9460):671–679.
71. Sotiriou C, et al. Gene expression profiling in breast cancer: understanding the molecular basis of histo-logic grade to improve prognosis. J Natl Cancer Inst. 2006;98(4):262–272.
72. Pawitan Y, et al. Gene expression profiling spares early breast cancer patients from adjuvant therapy: derived and validated in two population-based cohorts. Breast Cancer Res. 2005;7(6):R953–R964.
73. Schmidt M, et al. The humoral immune system has a key prognostic impact in node-negative breast cancer. Cancer Res. 2008;68(13):5405–5413.
74. Minn AJ, et al. Genes that mediate breast cancer metastasis to lung. Nature. 2005;436(7050):518–524.
75. Yu K, et al. A precisely regulated gene expres-sion cassette potently modulates metastasis and survival in multiple solid cancers. PLoS Genet. 2008;4(7):e1000129.
76. Boersma BJ, et al. A stromal gene signature associ-ated with inflammatory breast cancer. Int J Cancer. 2008;122(6):1324–1332.
77. Bos PD, et al. Genes that mediate breast can-cer metastasis to the brain. Nature. 2009; 459(7249):1005–1009.
78. Li Y, et al. Amplification of LAPTM4B and YWHAZ contributes to chemotherapy resistance and recurrence of breast cancer. Nat Med. 2010; 16(2):214–218.