identification of preferred sources for the …
TRANSCRIPT

University of Nebraska - Lincoln University of Nebraska - Lincoln
DigitalCommons@University of Nebraska - Lincoln DigitalCommons@University of Nebraska - Lincoln
Library Philosophy and Practice (e-journal) Libraries at University of Nebraska-Lincoln
Summer 5-1-2021
IDENTIFICATION OF PREFERRED SOURCES FOR THE SCHOLARLY IDENTIFICATION OF PREFERRED SOURCES FOR THE SCHOLARLY
COMMUNICATIONS OF THE INDIAN CORPORATE MEDICAL COMMUNICATIONS OF THE INDIAN CORPORATE MEDICAL
INSTITUTIONS USING BRADFORD’S LAW OF SCATTERING INSTITUTIONS USING BRADFORD’S LAW OF SCATTERING
Susama Nanda [email protected]
Kamal Lochan Jena [email protected]
Manoj Mishra [email protected]
Dola Babu Ramesh [email protected]
Follow this and additional works at: https://digitalcommons.unl.edu/libphilprac
Part of the Library and Information Science Commons
Nanda, Susama; Jena, Kamal Lochan; Mishra, Manoj; and Ramesh, Dola Babu, "IDENTIFICATION OF PREFERRED SOURCES FOR THE SCHOLARLY COMMUNICATIONS OF THE INDIAN CORPORATE MEDICAL INSTITUTIONS USING BRADFORD’S LAW OF SCATTERING" (2021). Library Philosophy and Practice (e-journal). 5596. https://digitalcommons.unl.edu/libphilprac/5596

IDENTIFICATION OF PREFERRED SOURCES FOR THE SCHOLARLY
COMMUNICATIONS OF THE INDIAN CORPORATE MEDICAL
INSTITUTIONS USING BRADFORD’S LAW OF SCATTERING
Susama Nanda1, Kamal Lochan Jena2, Manoj Mishra1*, D B Ramesh3
Introduction: Health science research focuses to generate new knowledge through new
techniques, research design and organizational interventions to serve the whole community. The
number of documents published during a stipulated time is measured as the research strength of
the concerned institutions to judge their performance.
Objective: The prime aim of this study is to find the prominent Indian corporate medical
institutions and analyze their scholarly outputs with justification of Bradford’s law.
Method: The authors choose 50 Indian corporate medical institutions to analyze their scholarly
outputs during the studied period.
Discussion: The publication count, citations, h-index and citation per paper of the top 50 Indian
corporate medical institutions are discussed with the help of textual and graphical formulation of
Bradford’s law of scattering.
Conclusion: As the error percentage is very negligible, the Bradford’s law fits in this data set.
The analysis identified 10 journals as the nucleus journals which are mostly referred by the
researchers at Indian corporate medical institutions.
Key Words: h-index, Bradford’s law, Corporate Medical Institutions, Leimkuhler model,
Bradford multiplier
1Assistant Librarian, IMS & SUM Hospital, SIKSHA ‘O’ ANUSANDHAN University,
Bhubaneswar
2Librarian, College of Engineering and Technology, Bhubaneswar
3Chief Librarian, SIKSHA ‘O’ ANUSANDHAN University, Bhubaneswar
1*Corresponding Author: [email protected]

Introduction:
The corporate Medical institutions were emerged in India during last three decades. Before that
the institutions funded by government only provides the health care education. As per the
website of Medical Council of India (MCI), it is found that there are 226 corporate Medical
institutions provide health care education throughout India in every regions like: south, north,
east and western territories of Indian sub-continent. There are 35 corporate Medical institutions
in Karnataka, which is highest in the country and the southern region and 27 corporate Medical
institutions in Maharashtra of Western region and Uttar Pradesh has 21 of such institutions in
Northern part of India, whereas only 4 corporate medical institutions are situated in Odisha in the
Eastern India1, 2, 3.
The outcome of research satisfies the need of one segment whilst the other one satisfies different
segments as per need. Good health is essential for all due to which Health management is
essential. So, research in healthcare becomes the social need. The importance of Healthcare
management can be envisaged as it emerged from the primitive time and gradually upgraded
through continuous research works and combination of technologies in form of poison and
therapeutics. So many discoveries / inventions are the outcome of these researches in various
fields. The general practitioners are determined to improve the quality of life which is directly
related to the new research of medical sciences in their concerned field. Health science research
focuses to generate new knowledge through new technique, research design and organizational
interventions to serve the whole community.
The number of documents published during a stipulated time is measured as the research strength
of the concerned institution on a particular subject and reflected in various sources. The research
outputs can be analyzed by various bibliometrics parameters, where Bradford’s law of scattering
is used to analyze the sources where the documents are published and the core journals are find
out. S. C. Bradford first discussed on the thought of core journals in 1934 and it is accepted by
the researchers as Bradford’s law later on4. The core journal concept helps the researchers to
identify and select the scholarly information sources5.
There are many studies formulated on Bradford’s law of scattering in different aspects. Many
researchers from various field also examined, contributed and re-verified the law with different
mathematical models as they felt there is some discrepancies in it’s verbal and graphical
presentation. Vickery is the first man who modified the Bradford’s law of scattering with his
algebraic interpretation6. Some other researchers also interpret the verbal formulation of this law
where as some of them also demonstrate the graphical design7, 8, 9, 10, 11, 12.
The Bradford’s law of scattering is applied in many research activities and published over a long
time. In a study, Sengupta13 put a remarkable statement that expansion of knowledge in the
subject helps the authors to publish their research papers in some sources which are not related to
the concerned field. Gupta14 has make a study about Bradford’s law of scattering on reference
cite in Ethiopian medical journal where Everett and Pecotich15 have made their research on
citation pattern of “The Journal of Psychology” which is a product of American Psychological
Association (APA). In the citation analysis pattern, zone one show a clear idea of the citation
pattern on the particular subject during a studied period. Smith16 indicates about some cited
articles published in journals during their period of research. Smith also found in another study
that a single research paper is cited more than 50% in 10 years, which is the maximum
occurrence between 10 and 15 years17. In another interesting study, Lariviere et al. found the
decreasing citation pattern in certain period and mentioned that 33% of journal articles in health
science received 80% of citations in 2005 whereas only 24% was in 199018. As disease
outbreaks, the citation analysis varies from time to time. It is observed from the previous studies
that the 1 to 5 years old articles have received half of all citation in public health, where as 10 or
fewer year old research documents received 75% of all citations19, 20, 21, 22, 23. In the year 2001,
another study by Maher et al24 identified 49 core journals out of 519 in the subject of evidence
based physical therapy. The Bradford’s law of scattering identifies the core journals which are
accountable for a disproportionate number of literatures in any subject and publish highest
articles on that topic25, 26.
Objective of the study:
The prime aim of this study is –
• To find the prominent Indian corporate medical institutions and their publications thereof.
• To critically analyze the scholarly outputs of Indian corporate medical institutions and its
applicability to the Bradford’s law.

Methods used:
The data for this study is retrieved from SCOPUS database with a limitation to the year 2007 –
2016 and different tables are drawn accordingly. The authors have chosen only 50 corporate
medical institutions with more than 250 publications to their credit during 10 years of study.
Discussion:
The research output of any academic organizations helps the institutions to establish themselves
among their competitors. The performance and the comparison analysis can be judged with the
published articles taken into consideration. The overall ranking of the institutions are measured
with many variable where research activity cannot be ignored.
The collected data is tabulated here for a better understanding about the scholarly outputs of the
Indian corporate medical institutions during the period of study and analyzed carefully the
published sources with the help of Bradford’s law of scattering. The detail analysis is given
below.
Table - 1: Publication details of top 50 Indian Corporate Medical Institutions
SL. No Name of the Institute Publication Citation h-index C/P
1 Christian Medical College, Vellore 4080 49765 79 12.20
2
Kasturba Medical College,
Manipal 3239 18594 42 5.74
3 Tata Memorial Hospital, Mumbai 3011 48573 72 16.13
4
Kasturba Medical College,
Mangalore 1845 12469 40 6.76
5
L. V. Prasad Eye Institute,
Hederabad 1593 17345 49 10.89
6
Amrita Institute of Medical science,
Kochi 1536 31653 77 20.61
7
Pandit Bhagawat Dayal Sharma
Postgraduate Institute, Rohtak 1522 6964 31 4.58
8
Jamia Hamdard Faculty of
Pharmacy, New Delhi 1516 27497 73 18.14
9
Sir Ganga Ram Hospital, New
Delhi 1228 9989 41 8.13
10 Sri Rama Chandra University, 1173 26351 44 22.46
11
BYL Naire Charitable Hospital &
TN medical college, 881 4252 27 4.83

12
Christian Medical College,
Ludhiana 834 16519 33 19.81
13
PD Hinduja National Hospital &
Medical Research Centre, Mumbai 801 9413 40 11.75
14
Shree Balaji Medical College and
Hospital, Chennai 781 1526 18 1.95
15 Manipal College of Dental Science, 770 2983 25 3.87
16
Regional Institute of Medical
Science, Manipur 711 1262 14 1.77
17
Bharati Vidyapitha University,
Pune 708 7189 37 10.15
18 SRM University, Tamilnadu 693 3804 29 5.49
19
Jawaharlal Medical College,
Belgaum 691 5004 29 7.24
20
M.S. Ramiah Medical College,
Bangalore 682 2902 23 4.26
21
Indraprastha Appollo Hospitals,
New Delhi 669 5723 32 8.55
22 Fortis Healthcare, New Delhi 667 27012 54 40.50
23 JSS Medical College, Mysore 663 6629 27 10.00
24
School of Medical Sciences and
Research Centre (Sharada
University), Noida 651 4888 33 7.51
25 Jagatguru University, Bangalore 634 7139 27 11.26
26
Dayananda Medical College &
Hospital, Ludhiana 628 6736 33 10.73
27
Mahatma Gandhi Medical College
& Research Institute, Pondicherry 594 2084 20 3.51
28
Fr. Muller Medical College &
Hospital, Mangalore 540 3053 28 5.65
29
K.S. Hegede Medical Academy,
Mangalore 536 4383 31 8.18
30
St. John's Medical College,
Mangalore 521 4988 31 9.57
31 Arabind Eye Hospital, Madurai 515 5917 36 11.49
32
Siksha O Anusandhan University,
Bhubaneswar 508 2254 22 4.44
33
Himalayan Institute of Medical
Science, Dehradun 472 3838 18 8.13
34
Jaslok Hospital & Research Centre,
Mumbai 448 7921 41 17.68
35
Bombay Hospital & Medical
Research Centre, Mumbai 445 5343 32 12.01
36 Bharatidarsan University, Trichy 436 4078 30 9.35
37 Krishna Institute of Medical 433 2109 21 4.87

Sciences, Karad (Maharastra)
38
Madras Diabetes Research
Foundation, Chennai 432 15834 56 36.65
39 Amity University, Uttarpradesh 394 3274 28 8.31
40
Vision Research Foundation,
Chennai 389 5774 35 14.84
41 SASTRA University, Tamilnadu 380 2890 25 7.61
42
SBKS Medical Institute and
Research Centre, Vadodara 375 1623 19 4.33
43 Manipal Hospital, Bangaluru 374 4733 33 12.66
44
PSG Institute of Medical Science
and Research, Coimbatore 366 1899 19 5.19
45 J.J.M. Medical College, Karnataka 340 1057 14 3.11
46
Kalawati Saran Children's Hospital,
New Delhi 324 2315 21 7.15
47
Escorts Heart Research Institute,
New Delhi 317 5700 23 17.98
48
Sikkim Manipal Institute of
Medical Science, Gangtok 278 1403 18 5.05
49 Narayan Medical College, Nellore 260 1065 17 4.10
50
Kempegowda Institute of Medical
Sciences, Karnataka 257 1231 15 4.79
The complete information about the publication, citation, h-index and citation per paper of the
top 50 Indian corporate medical institutions are tabulated in table -1. This study reveals that
Christian Medical College, Vellore has received highest h-index of 79 and J J M Medical
College, Mysore has the h-index of 14, which is the lowest among all. Table - 1 indicates the
highest citation per paper goes for Fortis Healthcare, New Delhi and the lowest is for Regional
Institute for Medical Science, Manipur.
Application of Bradford’s law:
Bradford’s law of scattering helps to rank the cited core sources which are shown in the table
given below.
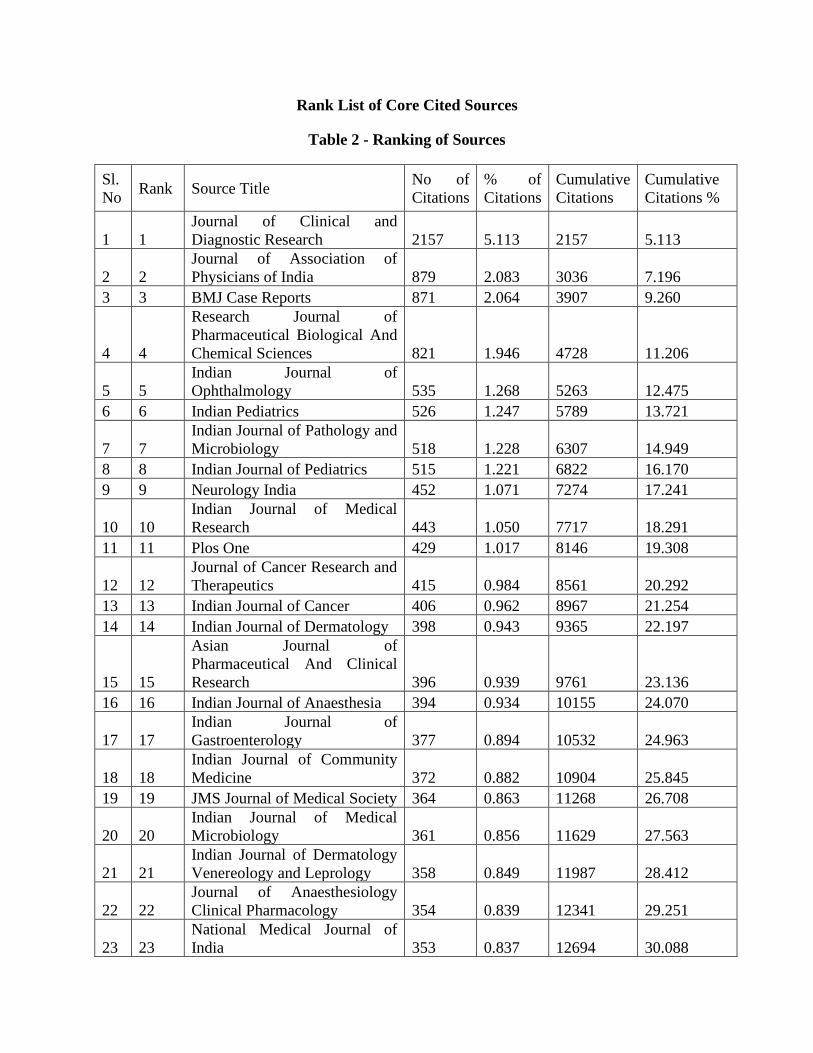
Rank List of Core Cited Sources
Table 2 - Ranking of Sources
Sl.
No Rank Source Title
No of
Citations
% of
Citations
Cumulative
Citations
Cumulative
Citations %
1 1
Journal of Clinical and
Diagnostic Research 2157 5.113 2157 5.113
2 2
Journal of Association of
Physicians of India 879 2.083 3036 7.196
3 3 BMJ Case Reports 871 2.064 3907 9.260
4 4
Research Journal of
Pharmaceutical Biological And
Chemical Sciences 821 1.946 4728 11.206
5 5
Indian Journal of
Ophthalmology 535 1.268 5263 12.475
6 6 Indian Pediatrics 526 1.247 5789 13.721
7 7
Indian Journal of Pathology and
Microbiology 518 1.228 6307 14.949
8 8 Indian Journal of Pediatrics 515 1.221 6822 16.170
9 9 Neurology India 452 1.071 7274 17.241
10 10
Indian Journal of Medical
Research 443 1.050 7717 18.291
11 11 Plos One 429 1.017 8146 19.308
12 12
Journal of Cancer Research and
Therapeutics 415 0.984 8561 20.292
13 13 Indian Journal of Cancer 406 0.962 8967 21.254
14 14 Indian Journal of Dermatology 398 0.943 9365 22.197
15 15
Asian Journal of
Pharmaceutical And Clinical
Research 396 0.939 9761 23.136
16 16 Indian Journal of Anaesthesia 394 0.934 10155 24.070
17 17
Indian Journal of
Gastroenterology 377 0.894 10532 24.963
18 18
Indian Journal of Community
Medicine 372 0.882 10904 25.845
19 19 JMS Journal of Medical Society 364 0.863 11268 26.708
20 20
Indian Journal of Medical
Microbiology 361 0.856 11629 27.563
21 21
Indian Journal of Dermatology
Venereology and Leprology 358 0.849 11987 28.412
22 22
Journal of Anaesthesiology
Clinical Pharmacology 354 0.839 12341 29.251
23 23
National Medical Journal of
India 353 0.837 12694 30.088

24 24
International Journal of Pharma
and Bio Sciences 348 0.825 13042 30.913
25 25 Indian Heart Journal 344 0.815 13386 31.728
26 26
Journal Indian Academy of
Clinical Medicine 324 0.768 13710 32.496
27 27 Indian Journal of Psychiatry 312 0.740 14022 33.235
28 28 Australasian Medical Journal 305 0.723 14327 33.958
29 29 Indian Journal of Urology 300 0.711 14627 34.669
30 30
Indian Journal of Public Health
Research and Development 279 0.661 14906 35.331
31 31
Journal of Postgraduate
Medicine 278 0.659 15184 35.990
32 32
Indian Journal of Critical Care
Medicine 276 0.654 15460 36.644
33 33
Journal of Forensic and Legal
Medicine 259 0.614 15719 37.258
34 34 Indian Journal of Surgery 258 0.612 15977 37.869
35 35
Indian Journal of Medical and
Paediatric Oncology 244 0.578 16221 38.447
36 36
International Journal of
Pharmacy and Pharmaceutical
Sciences 241 0.571 16462 39.019
37 37
Indian Journal of Surgical
Oncology 232 0.550 16694 39.569
38 38
Online Journal of Health and
Allied Sciences 230 0.545 16924 40.114
39 39 Lung India 223 0.529 17147 40.642
40 40 Indian Journal of Pharmacology 211 0.500 17358 41.142
41 41
International Journal of
Biological Macromolecules 210 0.498 17568 41.640
42 42 Tropical Doctor 197 0.467 17765 42.107
43 43
Indian Journal of
Otolaryngology And Head And
Neck Surgery 193 0.457 17958 42.565
44 44
Annals of Indian Academy of
Neurology 188 0.446 18146 43.010
45 45
Indian Journal of Nuclear
Medicine 186 0.441 18332 43.451
46 46 Biomedicine India 183 0.434 18515 43.885
47 47
International Journal of
Pharmaceutical Sciences
Review And Research 180 0.427 18695 44.311
48 48 Medico Legal Journal 178 0.422 18873 44.733
49 49
Journal International Medical
Sciences Academy 177 0.420 19050 45.153

50 50
Indian Journal of Palliative
Care 176 0.417 19226 45.570
51 51
Asian Pacific Journal of Cancer
Prevention 173 0.410 19399 45.980
52 52
Journal of Indian Academy of
Forensic Medicine 172 0.408 19571 46.388
53 53 Indian Journal of Orthopedics 167 0.396 19738 46.784
54 54 Clinical Nuclear Medicine 164 0.389 19902 47.172
55 55 Annals of Pediatric Cardiology 158 0.374 20060 47.547
56 =55 Carbohydrate Polymers 158 0.374 20218 47.921
57 56 Lancet 148 0.351 20366 48.272
58 57
Asian Pacific Journal of
Tropical Disease 146 0.346 20512 48.618
59 58
Indian Journal of Radiology
and Imaging 143 0.339 20655 48.957
60 59
Journal of Biomedical
Nanotechnology 140 0.332 20795 49.289
61 60
Indian Journal of Physiology
and Pharmacology 138 0.327 20933 49.616
62 =60
Nuclear Medicine
Communications 138 0.327 21071 49.943
63 61 Haemophilia 137 0.325 21208 50.268
64 62
European Journal of Nuclear
Medicine and Molecular
Imaging 136 0.322 21344 50.590
65 =62
Indian Journal of Plastic
Surgery 136 0.322 21480 50.913
66 =62
Journal of Clinical and
Experimental Hepatology 136 0.322 21616 51.235
67 63
Indian Journal of Clinical
Biochemistry 133 0.315 21749 51.550
68 64
Cochrane Database of
Systematic Reviews 130 0.308 21879 51.858
69 65
Indian Journal of
Endocrinology and Metabolism 127 0.301 22006 52.159
70 66 Biomedicine 126 0.299 22132 52.458
71 67
British Journal of
Ophthalmology 123 0.292 22255 52.749
72 68
Journal of The Indian Medical
Association 119 0.282 22374 53.032
73 =68 Singapore Dental Journal 119 0.282 22493 53.314
74 69 Indian Journal of Nephrology 114 0.270 22607 53.584
75 70
Journal of Pharmacy and
Bioallied Sciences 109 0.258 22716 53.842
76 71 Journal of South India 108 0.256 22824 54.098

Medicolegal Association
77 72
Indian Journal of Forensic
Medicine and Toxicology 107 0.254 22931 54.352
78 =72
Ophthalmic Plastic and
Reconstructive Surgery 107 0.254 23038 54.605
79 73 Annals of Cardiac Anaesthesia 104 0.247 23142 54.852
80 74
New England Journal of
Medicine 103 0.244 23245 55.096
81 75
Indian Journal of Practical
Pediatrics 102 0.242 23347 55.338
82 76
Journal of Obstetrics and
Gynecology of India 101 0.239 23448 55.577
83 Others (2490 Journals ) 18742 44.423 42190 100.00
Citation Trend of Journal Literature in Health Science
The decreasing citation of journals are arranged and analyzed in table - 3.
Table 3 – Citation Trend of Journals
Sl.
No
No of
Citations
No of
Journals
Cumulative
Journals
Cumulative
Journals %
Total No of
Citations of
equal Rank
Cumulative
Citations
Cumulative
Citations
%
1 2157 1 1 0.039 2157 2157 5.113
2 879 1 2 0.078 879 3036 7.196
3 871 1 3 0.117 871 3907 9.260
4 821 1 4 0.156 821 4728 11.206
5 535 1 5 0.194 535 5263 12.475
6 526 1 6 0.233 526 5789 13.721
7 518 1 7 0.272 518 6307 14.949
8 515 1 8 0.311 515 6822 16.170
9 452 1 9 0.350 452 7274 17.241
10 443 1 10 0.389 443 7717 18.291
11 429 1 11 0.428 429 8146 19.308
12 415 1 12 0.467 415 8561 20.292
13 406 1 13 0.505 406 8967 21.254
14 398 1 14 0.544 398 9365 22.197
15 396 1 15 0.583 396 9761 23.136
16 394 1 16 0.622 394 10155 24.070
17 377 1 17 0.661 377 10532 24.963
18 372 1 18 0.700 372 10904 25.845
19 364 1 19 0.739 364 11268 26.708

20 361 1 20 0.778 361 11629 27.563
21 358 1 21 0.816 358 11987 28.412
22 354 1 22 0.855 354 12341 29.251
23 353 1 23 0.894 353 12694 30.088
24 348 1 24 0.933 348 13042 30.913
25 344 1 25 0.972 344 13386 31.728
26 324 1 26 1.011 324 13710 32.496
27 312 1 27 1.050 312 14022 33.235
28 305 1 28 1.089 305 14327 33.958
29 300 1 29 1.128 300 14627 34.669
30 279 1 30 1.166 279 14906 35.331
31 278 1 31 1.205 278 15184 35.990
32 276 1 32 1.244 276 15460 36.644
33 259 1 33 1.283 259 15719 37.258
34 258 1 34 1.322 258 15977 37.869
35 244 1 35 1.361 244 16221 38.447
36 241 1 36 1.400 241 16462 39.019
37 232 1 37 1.439 232 16694 39.569
38 230 1 38 1.477 230 16924 40.114
39 223 1 39 1.516 223 17147 40.642
40 211 1 40 1.555 211 17358 41.142
41 210 1 41 1.594 210 17568 41.640
42 197 1 42 1.633 197 17765 42.107
43 193 1 43 1.672 193 17958 42.565
44 188 1 44 1.711 188 18146 43.010
45 186 1 45 1.750 186 18332 43.451
46 183 1 46 1.788 183 18515 43.885
47 180 1 47 1.827 180 18695 44.311
48 178 1 48 1.866 178 18873 44.733
49 177 1 49 1.905 177 19050 45.153
50 176 1 50 1.944 176 19226 45.570
51 173 1 51 1.983 173 19399 45.980
52 172 1 52 2.022 172 19571 46.388
53 167 1 53 2.061 167 19738 46.784
54 164 1 54 2.100 164 19902 47.172
55 158 2 56 2.177 316 20218 47.921
56 148 1 57 2.216 148 20366 48.272
57 146 1 58 2.255 146 20512 48.618
58 143 1 59 2.294 143 20655 48.957
59 140 1 60 2.333 140 20795 49.289
60 138 2 62 2.411 276 21071 49.943

61 137 1 63 2.449 137 21208 50.268
62 136 3 66 2.566 408 21616 51.235
63 133 1 67 2.605 133 21749 51.550
64 130 1 68 2.644 130 21879 51.858
65 127 1 69 2.683 127 22006 52.159
66 126 1 70 2.722 126 22132 52.458
67 123 1 71 2.760 123 22255 52.749
68 119 2 73 2.838 238 22493 53.314
69 114 1 74 2.877 114 22607 53.584
70 109 1 75 2.916 109 22716 53.842
71 108 1 76 2.955 108 22824 54.098
72 107 2 78 3.033 214 23038 54.605
73 104 1 79 3.072 104 23142 54.852
74 103 1 80 3.110 103 23245 55.096
75 102 1 81 3.149 102 23347 55.338
76 101 1 82 3.188 101 23448 55.577
77 2490 2572 100.00 18742 42190 100.00
Implementation of Bradford’s Law:
Using the verbal formulation of Bradford’s Law, the appropriateness of distribution of journals
could be observed and the following explanations are made. The data consisting of whole journal
references arranged in descending order of frequency is dealt with verbal formulation and the
graphical formulation based on the same data is dealt in application of Leimkuhler Model.
Verbal Formulation:
The number of cited journals is arranged in the descending order of citations. The rank number
of journals, number of citations, cumulative number of citations is given to test the applicability
of Bradford’ law verbal formulation.
The total 2572 journals are divided into three zones to test the algebraic interpretation of
Bradford’s law. By dividing the journals of a zone by its preceding zone the Bradford’s
multiplier factor is found. The ratio of the number of journals in any group to the number of
journals in any immediately preceding group is known as Bradford’s multiplier. The percentage
error in distribution of citations, among the three zones should be minimum which the basis for
selection of three zones is.

The value of Bradford’s multipliers, the distribution of journals and the corresponding number of
citations are calculated as follows
Total Citations are = 42190
Zone =3
Approximate citations should be = 42190 / 3= 14063.33
Table – 4: Scattering of Journals and Citations in Bradford’s Zone (Verbal Formulation)
Zone No of Journals % of Journals No of Citations
1 28 1.089 14327
2 127 4.938 14069
3 2417 93.974 13794
Total 2572 100 42190
According to Bradford the zones that are identified forms an approximately geometric series in
the form 1: n: n2. In the present study the relationship of each zone is 28: 127: 2417, which does
not fit with the Bradford’s distribution.
In the failure of above distribution, the Leimkuhler model is tested for the suitability of
Bradford;s Law of Scattering.
Application of Leimkuhler Model:
Bradford did not suggest any mathematical model for his law. The different models were
suggested by Brookes, Vickery and Leimkuhler. Different models of Bradford’s law were
formulated by different authors during their explanation of scattering of articles in journals.
However Leimkuhler had developed the following model on the basis of verbal formulation.
R( r) = alog (1+br)......................eq1
Where r = 1, 2, 3
During analysis of Leimkuhler’s Law, Egghe found that
A = y0 / logk
B = k -1 / r0

Where, rO is the number of sources in the first Bradford’s group, YO is the number of items in
every Bradford group (all these group of item being of equal sizes) and k is the Bradford’s
multiplier.
R(r) is the cumulative number of items produced by the sources of rank 1, 2, 3……. r and a and
b are constants appearing in Leimkuhler law. In Bradford groups, it is exhibited that the number
of group p is a parameter which can be preferred.
Egghe had exhibited the mathematical formula for calculating the Bradford Multiplier k as
k = (eg ym) 1/p ……………eq 2
Where g is Euler’s number (eg = 1.781)
While the sources are ranked in decreasing order of productivity then ym is the number of items in
the most productivity sources.
Then ym and r0 are
Y0= ym2 log k
r0 = (k-1) ym
Once p is chosen, the value of k can be calculated as
k= (eg ym)1/p
and y0= A/P
Where A denotes the total number of articles, Let denote the total number of journals in Bradford
group is r0ki-1 where (i=1, 2, 3…p)
T= r0+ r0k + r0k2 + r0k
p-2
So, rO = __________T_______________
= T (k-1)
1+ k + k2 + … … …. . + kp–1 (kp-1)
Since, A and T could be derived from the data set rO and yO are calculated, once p is determined
by the eq 2
For the application of Bradford’s Law the citation distribution were divided into three
zones (p = 3 where ‘p’ denotes the Number of Zones). By applying the mathematical formula

k= (eg ym) 1/p
Where k= (1.781 x ym) 1/p
eg= 1.781 ( Constant)
ym = number of items in the most productive source
p=3 where p denote the Number of Zones
In the present instance yN= numbers of items in the preferred productive source = 2157
Therefore, the value of Bradford’s multiplier ‘k’ is determined as follows:
k= (1.781 x 2157)1/3
K=15.66
Y0= A/P
Where A= refers the total number of articles = 42190
P= total number of Zones = 03
Yo= 42190 /3 = 14063.33
R0= T (k-1) / (kp-1) = 2572 (15.66 – 1) = 9.821
(15.663-1)
a= Yo / log k = 11768.477
b=k-1 / r0 = 1.493
So the nucleus = r0= 9.82
1: n: n2
9. 82: (9.82 x 15.66): (9.82 x (15.66)2)
9. 82: 153.78: 2408.21 =2571.814 (approx. 2572)
% of error is negative and very negligible. Suggest very high scattering.
Scattering of Journals and Citations over Bradford’s Zones according to Bradford’s law is
depicted in the table given below.

Table – 5: Scattering of Journals and Citations in Bradford’s Zone (Leimkuhler Model)
Zone No of Journals % of Journals No of Citations
1 10 0.389 7717
2 154 5.99 21123
3 2408 93.624 13350
Total 2572 100 42190
The table - 5 depicted that the number of journals in the nucleus is 9.82 and the mean value of
the Bradford multiplier is 15.66. Therefore, the Bradford’s distribution is written as: 1: n: n2
i.e. 9. 82: (9.82 x 15.66): (9.82 x (15.66)2)
9. 82: 153.78: 2408.21 =2571.81 (approx. 2572)
% of error is negative and very negligible. Suggest very high scattering.
Fig 1 – Graphical presentation of Bradford’s law of scattering
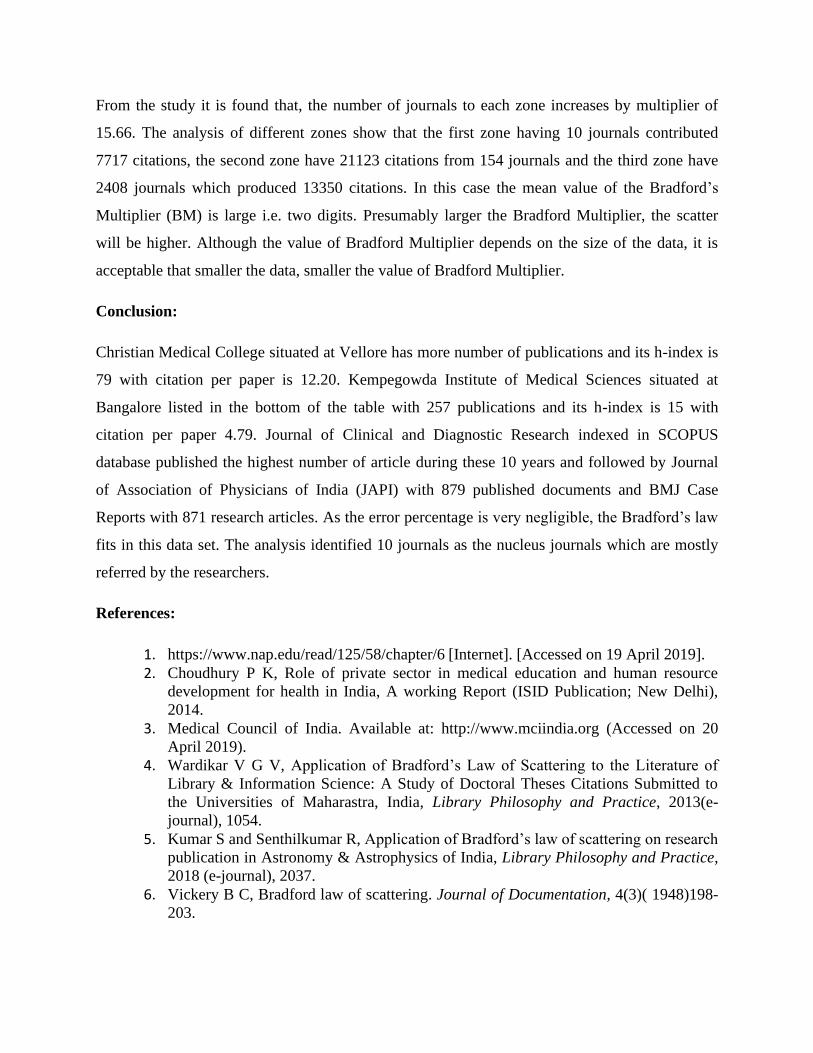
From the study it is found that, the number of journals to each zone increases by multiplier of
15.66. The analysis of different zones show that the first zone having 10 journals contributed
7717 citations, the second zone have 21123 citations from 154 journals and the third zone have
2408 journals which produced 13350 citations. In this case the mean value of the Bradford’s
Multiplier (BM) is large i.e. two digits. Presumably larger the Bradford Multiplier, the scatter
will be higher. Although the value of Bradford Multiplier depends on the size of the data, it is
acceptable that smaller the data, smaller the value of Bradford Multiplier.
Conclusion:
Christian Medical College situated at Vellore has more number of publications and its h-index is
79 with citation per paper is 12.20. Kempegowda Institute of Medical Sciences situated at
Bangalore listed in the bottom of the table with 257 publications and its h-index is 15 with
citation per paper 4.79. Journal of Clinical and Diagnostic Research indexed in SCOPUS
database published the highest number of article during these 10 years and followed by Journal
of Association of Physicians of India (JAPI) with 879 published documents and BMJ Case
Reports with 871 research articles. As the error percentage is very negligible, the Bradford’s law
fits in this data set. The analysis identified 10 journals as the nucleus journals which are mostly
referred by the researchers.
References:
1. https://www.nap.edu/read/125/58/chapter/6 [Internet]. [Accessed on 19 April 2019].
2. Choudhury P K, Role of private sector in medical education and human resource
development for health in India, A working Report (ISID Publication; New Delhi),
2014.
3. Medical Council of India. Available at: http://www.mciindia.org (Accessed on 20
April 2019).
4. Wardikar V G V, Application of Bradford’s Law of Scattering to the Literature of
Library & Information Science: A Study of Doctoral Theses Citations Submitted to
the Universities of Maharastra, India, Library Philosophy and Practice, 2013(e-
journal), 1054.
5. Kumar S and Senthilkumar R, Application of Bradford’s law of scattering on research
publication in Astronomy & Astrophysics of India, Library Philosophy and Practice,
2018 (e-journal), 2037.
6. Vickery B C, Bradford law of scattering. Journal of Documentation, 4(3)( 1948)198-
203.

7. Leimkuhler F F, The Bradford distribution, Journal of Documentation, 23(3)(
1967)197-207.
8. Goffman W and Warren K S, Dispersion of papers among journals based on a
mathematical analysis of two diverse medical literatures, Nature, 221(1969)1205-
1207.
9. Kendall M G, The bibliography of operations research, Operation Research
Quarterly, 11(1960)31-36.
10. Cole P F, A new look at reference scattering, Journal of Documentation, 18(2)(
1962)58-64.
11. Brookes B C, Bradford’s law and the bibliography of science, Nature, 224(1969)953-
956.
12. Brookes B C, Numerical methods of bibliographic analysis, Library Trends, 22(1)(
1973)18-43.
13. Sengupta I N, Recent growth of the literature of Biochemistry and change in ranking
of periodicals, Journal of Documentation, 29(2)( 1973)210-211.
14. Gupta D K, Application of Bradford’s Law to Citation data of Ethiopian Medical
Journal, Annals of Library Science and Documentation, 38(3)( 1991)85-98.
15. Everett J E and Pecotich A, Citation analysis mapping of journals in applied and
clinical psychology, Journal of Applied Sociology and Psychology, 23(9)( 1993)750-
766.
16. Smith D R, A 30-year citation analysis of bibliometric trends at the Archives of
Environmental Health, 1975-2004, Archives of Environmental and Occupational
Health, 64(supl. 1)( 2009)43-54. DOI:
http://dx.doi.org/10.1080/19338240903293004.
17. Smith D R, Highly cited articles in environmental and occupational health, 1961-
1974, Archives of Environmental and Occupational Health, 65(2)( 2009)112-115,
DOI: http://dx.doi.org/10.1080/19338241003761585.
18. Lariviere V, Gingras Y and Archambault E, The decline in the concentration of
citations, 1990-2007, Journal of American Society of Information Science and
Technology, 60(4)( 2009)858-862, DOI: http://dx.doi.org/10.1002/asi.21011.
19. Rethlefsen M L and Wallis L C, Public health citation patterns: an analysis of the
American Journal of Public Health, 2003-2007, Journal of Medical Library
Association, 95(4)( 2007)408-415, DOI: http://dx.doi.org/10.3163/1536-
5050.95.4.408.
20. Alpi K M and Adams M G, Mapping the literature of public health and community
nursing, Journal of Medical Library Association, 95(1)( 2007)e6-9.
21. Rethlefsen M L, Citation analysis of Minnesota Department of Health official
publications and journal articles: a needs assessment for the RN Barr Library, Journal
of Medical Library Association, 95(3)( 2007)260-266, DOI:
http://dx.doi.org/10.3163/1536-5050.95.3.260.
22. Rethlefsen M L and Aldrich A M, Environmental health citation patterns: mapping
the literature 2008-2010, Journal of Medical Library Association, 101(1)( 2013)47-
54, DOI: http://dx.doi.org/10.3163/1536-5050.100.1.008.
23. Schloman B F, Mapping the literature of health education, Bulletin of Medical
Library Association, 85(3)( 1997)278-283.

24. Maher C, Moseley A, Sherrington C and Herbert R, Core journals of evidence-based
physiotherapy practice, Physiotherapy Theory Practice, 17(3)(2001)143-151, DOI:
10.1080/095939801317077605.
25. Bradford S C, Documentation, (Public Affairs Press; Washington D C) 1950.
26. Bensman S, Bradford’s law and fuzzy sets: statistical implications for library
analyses, IFLA Journal, 24(4)( 2001)238-246. DOI: 10.1177/034003520102700406.