identification of reference genes in blood before and ...pcrefficiencydeterminationandselectionofthe...
TRANSCRIPT
Submitted 13 April 2017Accepted 1 August 2017Published 27 September 2017
Corresponding authorCuiying Li, [email protected],[email protected]
Academic editorKlaus Metzeler
Additional Information andDeclarations can be found onpage 10
DOI 10.7717/peerj.3726
Copyright2017 Xiao et al.
Distributed underCreative Commons CC-BY 4.0
OPEN ACCESS
Identification of reference genes in bloodbefore and after entering the plateau forSYBR green RT-qPCR studiesJun Xiao, Xiaowei Li, Juan Liu, Xiu Fan, Huifen Lei and Cuiying LiDepartment of Blood Transfusion, General Hospital of Air Force, PLA, Beijing, China
ABSTRACTBackground. Tibetans have lived at high altitudes for thousands of years, and theyhave unique physiological traits that enable them to tolerate this hypoxic environment.However, the genetic basis of these traits is still unknown. As a sensitive and highlyefficient technique, RT-qPCR is widely used in gene expression analyses to provideinsight into the molecular mechanisms underlying environmental changes. However,the quantitative analysis of gene expression in blood is limited by a shortage of stablereference genes for the normalization of mRNA levels. Thus, systematic approacheswere used to identify potential reference genes.Results. The expression levels of eight candidate human reference genes (GAPDH,ACTB, 18S RNA, β2-MG, PPIA, RPL13A, TBP and SDHA) were assessed in bloodfrom hypoxic environments. The expression stability of these selected reference geneswas evaluated using the geNorm, NormFinder and BestKeeper programs. Interestingly,RPL13Awas identified as the ideal reference gene for normalizing target gene expressionin human blood before and after exposure to high-altitude conditions.Conclusion. These results indicate that different reference genes should be selected forthe normalization of gene expression in blood from different environmental settings.
Subjects Molecular Biology, HematologyKeywords Plateau, Hypoxia, Gene expression, Expression stability, Reference gene
INTRODUCTIONHypoxia is a major biological feature of high-altitude regions (Beall, 2000). In hypoxicenvironments, transcription of various genes, such as endothelial PAS domain-containingprotein 1 (EPAS1) and prolyl hydroxylase domain-containing protein 2 (PHD2), isinitiated by hypoxia-related pathways. An increasing number of studies show that thehypoxia-inducible factor (HIF) signaling pathway plays a vital role in the adaptation tohypoxia (Ji et al., 2012). The human EPAS1 gene encodes the alpha subunit of HIF-2(HIF-2α), which acts as a key regulator of chronic hypoxia by regulating a large number ofgenes (Beall et al., 2010).
To examine the molecular mechanisms involved in these processes, quantitative geneexpression analysis is indispensable. Quantitative real-time PCR (RT-qPCR) is a highlysensitive, precise and reproducible method for the detection of gene expression levels(Bustin, 2002; Bustin & Nolan, 2004; Vandesompele et al., 2002). However, to produceoptimal results from RT-qPCR analysis, minimum requirements must be met, including
How to cite this article Xiao et al. (2017), Identification of reference genes in blood before and after entering the plateau for SYBR greenRT-qPCR studies. PeerJ 5:e3726; DOI 10.7717/peerj.3726
quality control of themRNA and primers, PCR efficiency determination and selection of theappropriate reference genes (Nolan, Hands & Bustin, 2006). The obtained gene expressionprofile varies based on the use of different housekeeping genes as internal references genes(Sellars et al., 2007). Therefore, proper reference gene selection guarantees the accuracy ofthe analysis data obtained from RT-qPCR (Vandesompele et al., 2002).
Researchers have always empirically determined reference genes, such as GAPDH andβ-actin, during quantitative gene expression analyses. However, recent studies have shownthat housekeeping gene (HKG) expression levels vary between cell types (Gentile et al.,2016; Ofinran et al., 2016; Wang et al., 2015) and experimental conditions (Tricarico et al.,2002; Zhang, Ding & Sandford, 2005). Thus, a stable and suitable reference gene must beselected for the normalization of target gene expression.
In the present study, three algorithms (geNorm, NormFinder and BestKeeper) wereutilized to analyze the stability of selected candidate reference genes (glyceraldehyde-3-phosphate dehydrogenase (GAPDH),β-actin (ACTB), 18S RNA,β2-microglobulin (β2-MG),peptidylprolyl isomerase A (PPIA), ribosomal protein L13 (RPL13A), TATA-Box bindingprotein (TBP) and succinate dehydrogenase complex, subunit A (SDHA)) in human bloodbefore and after exposure to high-altitude conditions using RT-qPCR with SYBR green.
MATERIALS AND METHODSSample informationSix healthy male Han Chinese volunteers (21.3 ± 1.3 years old) who have in the plains(altitude 500 m) for at least 20 years were enrolled. Blood samples were collected when theylived in the plains and 3 days after they moved onto the plateau (altitude 4,700 m). Theydid not show any clinical signs of hypoxia at the time of the examination. This study wasapproved by the Institutional Review Board of the General Hospital of the Air Force, PLA(afgh-IRB-16-03). Each of the six volunteers provided written informed consent.
RNA samples and cDNA synthesisMononuclear cells were isolated from 5 ml of peripheral blood (before and after movingto the plateau, 3,700 m) by using lymphocyte separation medium (Solarbio, Beijing,China), as previously described (Chen et al., 2016). Total RNA was extracted from 107
mononuclear cells using TRIzol Reagent (Invitrogen, Carlsbad, CA, USA) according tothe manufacturer’s protocol and then quantified using a UV-2550 spectrophotometer(Shimadzu, Kyoto, Japan). cDNA was synthetized from approximately 0.5 µg of total RNAusing a ReverTra Ace R©qPCR RT kit with gDNA Remover (TOYOBO, Osaka, Japan).
Candidate genes and primers for RT-qPCREight candidate human reference genes,GAPDH, ACTB, 18S RNA, β2-MG, PPIA, RPL13A,TBP and SDHA, were selected for evaluation based on the Minimum Information forPublication of Quantitative Real-Time PCR Experiments (MIQE) guidelines (Bustin et al.,2009) (Table 1). BLAST software was used to design the specific primers and to confirmthe specificity of the primer sequences for the indicated gene. All primers, except for 18SRNA and β2-MG, spanned one intron to exclude the contamination of genomic DNA intotal RNA.
Xiao et al. (2017), PeerJ, DOI 10.7717/peerj.3726 2/13
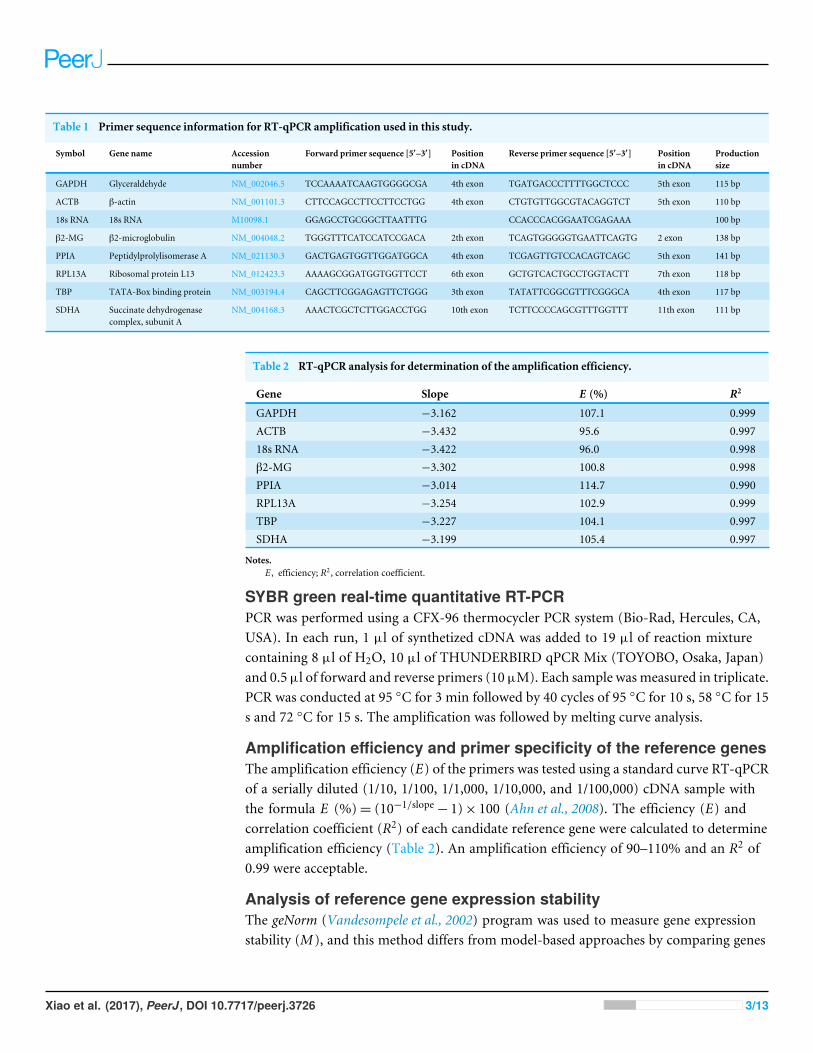
Table 1 Primer sequence information for RT-qPCR amplification used in this study.
Symbol Gene name Accessionnumber
Forward primer sequence [5′–3′] Positionin cDNA
Reverse primer sequence [5′–3′] Positionin cDNA
Productionsize
GAPDH Glyceraldehyde NM_002046.5 TCCAAAATCAAGTGGGGCGA 4th exon TGATGACCCTTTTGGCTCCC 5th exon 115 bp
ACTB β-actin NM_001101.3 CTTCCAGCCTTCCTTCCTGG 4th exon CTGTGTTGGCGTACAGGTCT 5th exon 110 bp
18s RNA 18s RNA M10098.1 GGAGCCTGCGGCTTAATTTG CCACCCACGGAATCGAGAAA 100 bp
β2-MG β2-microglobulin NM_004048.2 TGGGTTTCATCCATCCGACA 2th exon TCAGTGGGGGTGAATTCAGTG 2 exon 138 bp
PPIA Peptidylprolylisomerase A NM_021130.3 GACTGAGTGGTTGGATGGCA 4th exon TCGAGTTGTCCACAGTCAGC 5th exon 141 bp
RPL13A Ribosomal protein L13 NM_012423.3 AAAAGCGGATGGTGGTTCCT 6th exon GCTGTCACTGCCTGGTACTT 7th exon 118 bp
TBP TATA-Box binding protein NM_003194.4 CAGCTTCGGAGAGTTCTGGG 3th exon TATATTCGGCGTTTCGGGCA 4th exon 117 bp
SDHA Succinate dehydrogenasecomplex, subunit A
NM_004168.3 AAACTCGCTCTTGGACCTGG 10th exon TCTTCCCCAGCGTTTGGTTT 11th exon 111 bp
Table 2 RT-qPCR analysis for determination of the amplification efficiency.
Gene Slope E (%) R2
GAPDH −3.162 107.1 0.999ACTB −3.432 95.6 0.99718s RNA −3.422 96.0 0.998β2-MG −3.302 100.8 0.998PPIA −3.014 114.7 0.990RPL13A −3.254 102.9 0.999TBP −3.227 104.1 0.997SDHA −3.199 105.4 0.997
Notes.E , efficiency; R2, correlation coefficient.
SYBR green real-time quantitative RT-PCRPCR was performed using a CFX-96 thermocycler PCR system (Bio-Rad, Hercules, CA,USA). In each run, 1 µl of synthetized cDNA was added to 19 µl of reaction mixturecontaining 8 µl of H2O, 10 µl of THUNDERBIRD qPCR Mix (TOYOBO, Osaka, Japan)and 0.5 µl of forward and reverse primers (10 µM). Each sample was measured in triplicate.PCR was conducted at 95 ◦C for 3 min followed by 40 cycles of 95 ◦C for 10 s, 58 ◦C for 15s and 72 ◦C for 15 s. The amplification was followed by melting curve analysis.
Amplification efficiency and primer specificity of the reference genesThe amplification efficiency (E) of the primers was tested using a standard curve RT-qPCRof a serially diluted (1/10, 1/100, 1/1,000, 1/10,000, and 1/100,000) cDNA sample withthe formula E (%)= (10−1/slope− 1)× 100 (Ahn et al., 2008). The efficiency (E) andcorrelation coefficient (R2) of each candidate reference gene were calculated to determineamplification efficiency (Table 2). An amplification efficiency of 90–110% and an R2 of0.99 were acceptable.
Analysis of reference gene expression stabilityThe geNorm (Vandesompele et al., 2002) program was used to measure gene expressionstability (M ), and this method differs from model-based approaches by comparing genes
Xiao et al. (2017), PeerJ, DOI 10.7717/peerj.3726 3/13
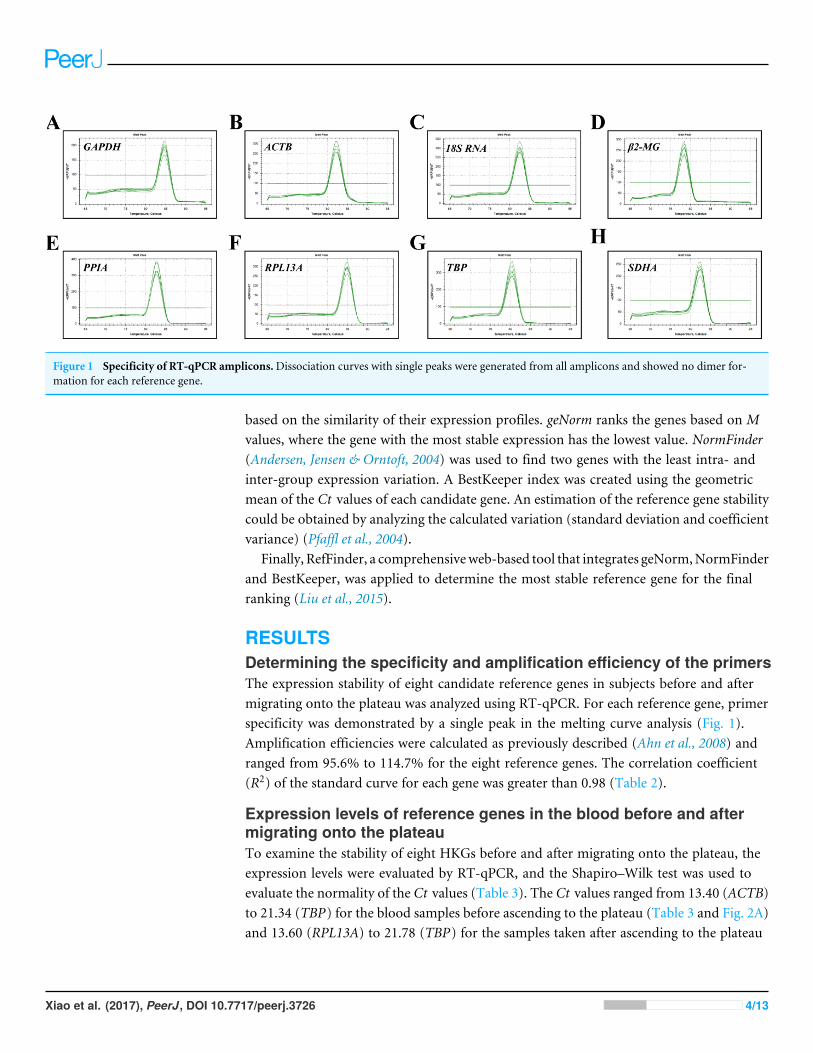
Figure 1 Specificity of RT-qPCR amplicons.Dissociation curves with single peaks were generated from all amplicons and showed no dimer for-mation for each reference gene.
based on the similarity of their expression profiles. geNorm ranks the genes based on Mvalues, where the gene with the most stable expression has the lowest value. NormFinder(Andersen, Jensen & Orntoft, 2004) was used to find two genes with the least intra- andinter-group expression variation. A BestKeeper index was created using the geometricmean of the Ct values of each candidate gene. An estimation of the reference gene stabilitycould be obtained by analyzing the calculated variation (standard deviation and coefficientvariance) (Pfaffl et al., 2004).
Finally, RefFinder, a comprehensiveweb-based tool that integrates geNorm,NormFinderand BestKeeper, was applied to determine the most stable reference gene for the finalranking (Liu et al., 2015).
RESULTSDetermining the specificity and amplification efficiency of the primersThe expression stability of eight candidate reference genes in subjects before and aftermigrating onto the plateau was analyzed using RT-qPCR. For each reference gene, primerspecificity was demonstrated by a single peak in the melting curve analysis (Fig. 1).Amplification efficiencies were calculated as previously described (Ahn et al., 2008) andranged from 95.6% to 114.7% for the eight reference genes. The correlation coefficient(R2) of the standard curve for each gene was greater than 0.98 (Table 2).
Expression levels of reference genes in the blood before and aftermigrating onto the plateauTo examine the stability of eight HKGs before and after migrating onto the plateau, theexpression levels were evaluated by RT-qPCR, and the Shapiro–Wilk test was used toevaluate the normality of the Ct values (Table 3). The Ct values ranged from 13.40 (ACTB)to 21.34 (TBP) for the blood samples before ascending to the plateau (Table 3 and Fig. 2A)and 13.60 (RPL13A) to 21.78 (TBP) for the samples taken after ascending to the plateau
Xiao et al. (2017), PeerJ, DOI 10.7717/peerj.3726 4/13
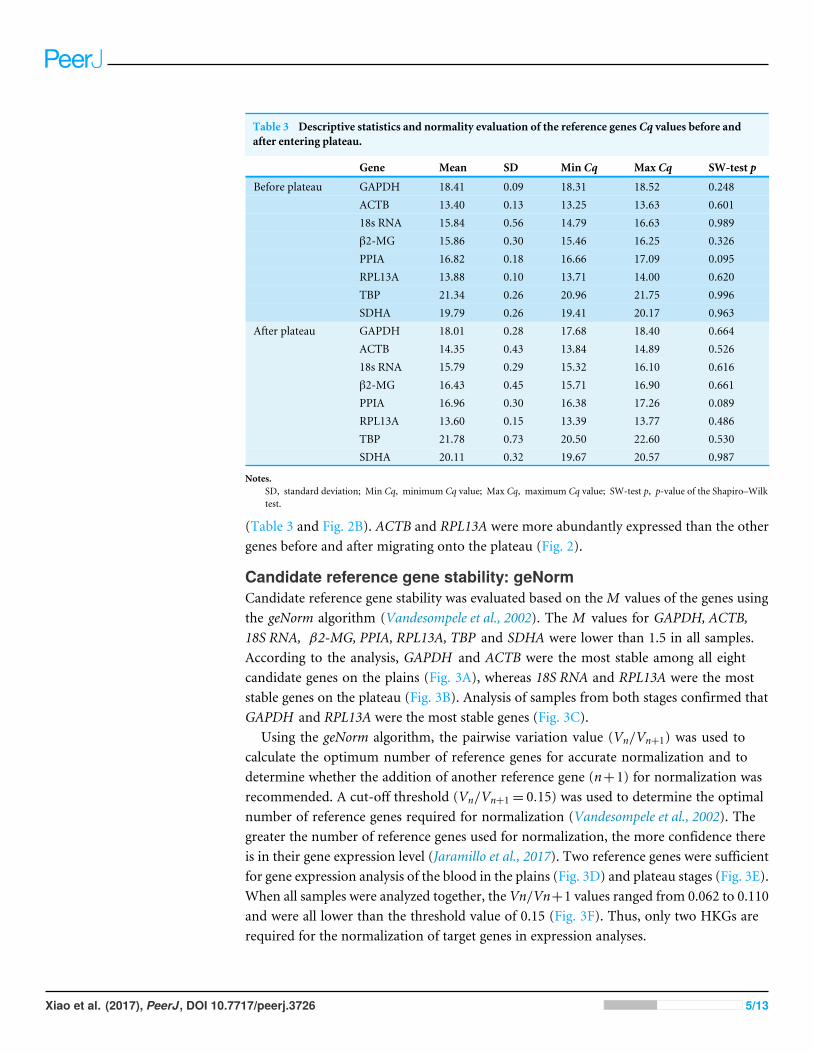
Table 3 Descriptive statistics and normality evaluation of the reference genes Cq values before andafter entering plateau.
Gene Mean SD Min Cq Max Cq SW-test p
Before plateau GAPDH 18.41 0.09 18.31 18.52 0.248ACTB 13.40 0.13 13.25 13.63 0.60118s RNA 15.84 0.56 14.79 16.63 0.989β2-MG 15.86 0.30 15.46 16.25 0.326PPIA 16.82 0.18 16.66 17.09 0.095RPL13A 13.88 0.10 13.71 14.00 0.620TBP 21.34 0.26 20.96 21.75 0.996SDHA 19.79 0.26 19.41 20.17 0.963
After plateau GAPDH 18.01 0.28 17.68 18.40 0.664ACTB 14.35 0.43 13.84 14.89 0.52618s RNA 15.79 0.29 15.32 16.10 0.616β2-MG 16.43 0.45 15.71 16.90 0.661PPIA 16.96 0.30 16.38 17.26 0.089RPL13A 13.60 0.15 13.39 13.77 0.486TBP 21.78 0.73 20.50 22.60 0.530SDHA 20.11 0.32 19.67 20.57 0.987
Notes.SD, standard deviation; Min Cq, minimum Cq value; Max Cq, maximum Cq value; SW-test p, p-value of the Shapiro–Wilktest.
(Table 3 and Fig. 2B). ACTB and RPL13A were more abundantly expressed than the othergenes before and after migrating onto the plateau (Fig. 2).
Candidate reference gene stability: geNormCandidate reference gene stability was evaluated based on the M values of the genes usingthe geNorm algorithm (Vandesompele et al., 2002). The M values for GAPDH, ACTB,18S RNA, β2-MG, PPIA, RPL13A, TBP and SDHA were lower than 1.5 in all samples.According to the analysis, GAPDH and ACTB were the most stable among all eightcandidate genes on the plains (Fig. 3A), whereas 18S RNA and RPL13A were the moststable genes on the plateau (Fig. 3B). Analysis of samples from both stages confirmed thatGAPDH and RPL13A were the most stable genes (Fig. 3C).
Using the geNorm algorithm, the pairwise variation value (Vn/Vn+1) was used tocalculate the optimum number of reference genes for accurate normalization and todetermine whether the addition of another reference gene (n+1) for normalization wasrecommended. A cut-off threshold (Vn/Vn+1= 0.15) was used to determine the optimalnumber of reference genes required for normalization (Vandesompele et al., 2002). Thegreater the number of reference genes used for normalization, the more confidence thereis in their gene expression level (Jaramillo et al., 2017). Two reference genes were sufficientfor gene expression analysis of the blood in the plains (Fig. 3D) and plateau stages (Fig. 3E).When all samples were analyzed together, the Vn/Vn+1 values ranged from 0.062 to 0.110and were all lower than the threshold value of 0.15 (Fig. 3F). Thus, only two HKGs arerequired for the normalization of target genes in expression analyses.
Xiao et al. (2017), PeerJ, DOI 10.7717/peerj.3726 5/13
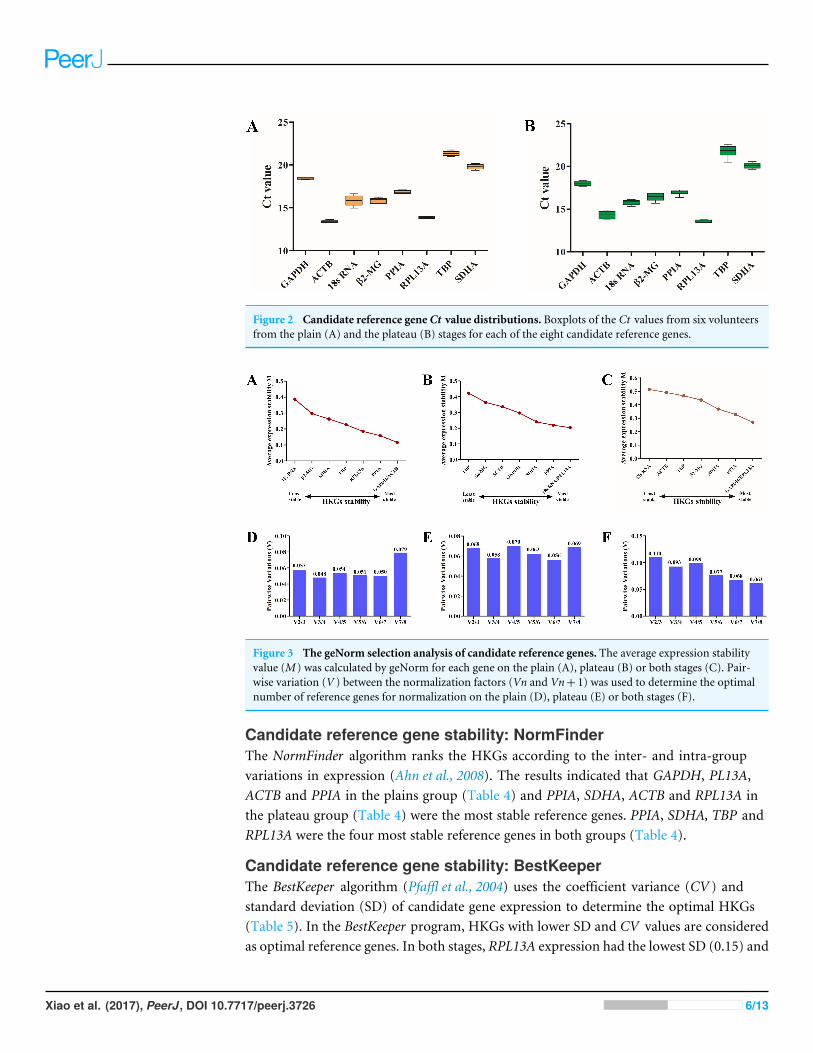
Figure 2 Candidate reference gene Ct value distributions. Boxplots of the Ct values from six volunteersfrom the plain (A) and the plateau (B) stages for each of the eight candidate reference genes.
Figure 3 The geNorm selection analysis of candidate reference genes. The average expression stabilityvalue (M ) was calculated by geNorm for each gene on the plain (A), plateau (B) or both stages (C). Pair-wise variation (V ) between the normalization factors (Vn and Vn+ 1) was used to determine the optimalnumber of reference genes for normalization on the plain (D), plateau (E) or both stages (F).
Candidate reference gene stability: NormFinderThe NormFinder algorithm ranks the HKGs according to the inter- and intra-groupvariations in expression (Ahn et al., 2008). The results indicated that GAPDH, PL13A,ACTB and PPIA in the plains group (Table 4) and PPIA, SDHA, ACTB and RPL13A inthe plateau group (Table 4) were the most stable reference genes. PPIA, SDHA, TBP andRPL13A were the four most stable reference genes in both groups (Table 4).
Candidate reference gene stability: BestKeeperThe BestKeeper algorithm (Pfaffl et al., 2004) uses the coefficient variance (CV ) andstandard deviation (SD) of candidate gene expression to determine the optimal HKGs(Table 5). In the BestKeeper program, HKGs with lower SD and CV values are consideredas optimal reference genes. In both stages, RPL13A expression had the lowest SD (0.15) and
Xiao et al. (2017), PeerJ, DOI 10.7717/peerj.3726 6/13
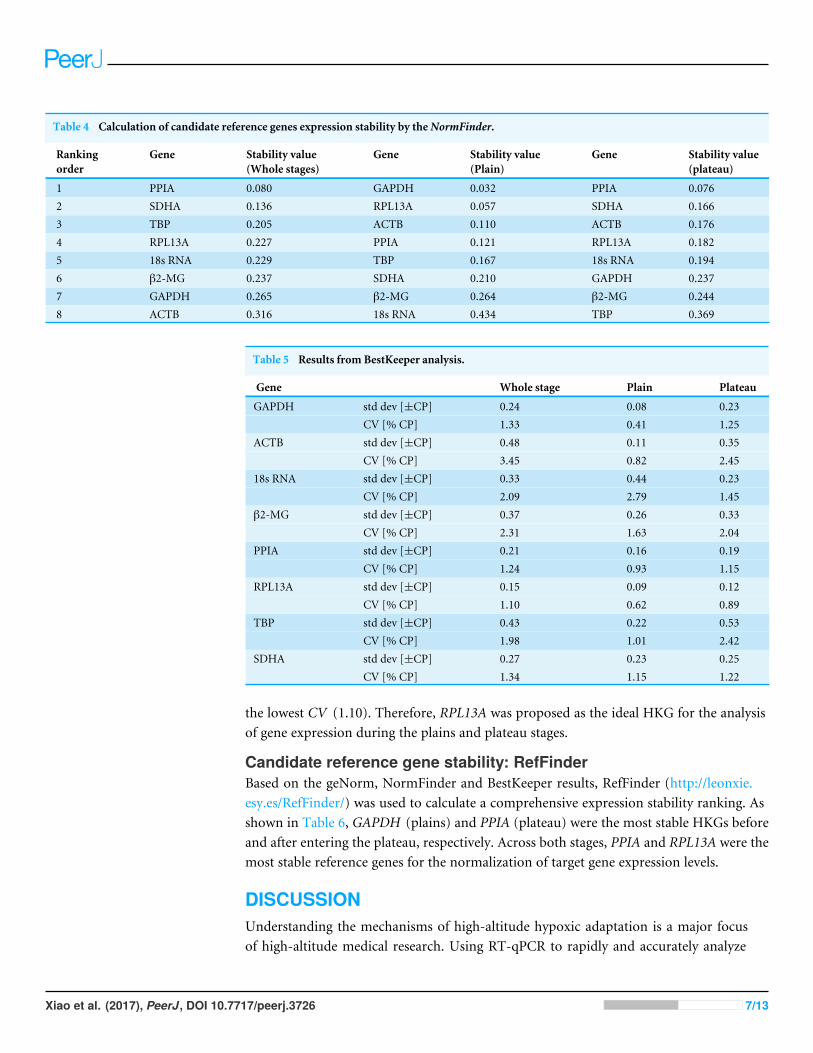
Table 4 Calculation of candidate reference genes expression stability by theNormFinder.
Rankingorder
Gene Stability value(Whole stages)
Gene Stability value(Plain)
Gene Stability value(plateau)
1 PPIA 0.080 GAPDH 0.032 PPIA 0.0762 SDHA 0.136 RPL13A 0.057 SDHA 0.1663 TBP 0.205 ACTB 0.110 ACTB 0.1764 RPL13A 0.227 PPIA 0.121 RPL13A 0.1825 18s RNA 0.229 TBP 0.167 18s RNA 0.1946 β2-MG 0.237 SDHA 0.210 GAPDH 0.2377 GAPDH 0.265 β2-MG 0.264 β2-MG 0.2448 ACTB 0.316 18s RNA 0.434 TBP 0.369
Table 5 Results from BestKeeper analysis.
Gene Whole stage Plain Plateau
GAPDH std dev [±CP] 0.24 0.08 0.23CV [% CP] 1.33 0.41 1.25
ACTB std dev [±CP] 0.48 0.11 0.35CV [% CP] 3.45 0.82 2.45
18s RNA std dev [±CP] 0.33 0.44 0.23CV [% CP] 2.09 2.79 1.45
β2-MG std dev [±CP] 0.37 0.26 0.33CV [% CP] 2.31 1.63 2.04
PPIA std dev [±CP] 0.21 0.16 0.19CV [% CP] 1.24 0.93 1.15
RPL13A std dev [±CP] 0.15 0.09 0.12CV [% CP] 1.10 0.62 0.89
TBP std dev [±CP] 0.43 0.22 0.53CV [% CP] 1.98 1.01 2.42
SDHA std dev [±CP] 0.27 0.23 0.25CV [% CP] 1.34 1.15 1.22
the lowest CV (1.10). Therefore, RPL13A was proposed as the ideal HKG for the analysisof gene expression during the plains and plateau stages.
Candidate reference gene stability: RefFinderBased on the geNorm, NormFinder and BestKeeper results, RefFinder (http://leonxie.esy.es/RefFinder/) was used to calculate a comprehensive expression stability ranking. Asshown in Table 6, GAPDH (plains) and PPIA (plateau) were the most stable HKGs beforeand after entering the plateau, respectively. Across both stages, PPIA and RPL13A were themost stable reference genes for the normalization of target gene expression levels.
DISCUSSIONUnderstanding the mechanisms of high-altitude hypoxic adaptation is a major focusof high-altitude medical research. Using RT-qPCR to rapidly and accurately analyze
Xiao et al. (2017), PeerJ, DOI 10.7717/peerj.3726 7/13
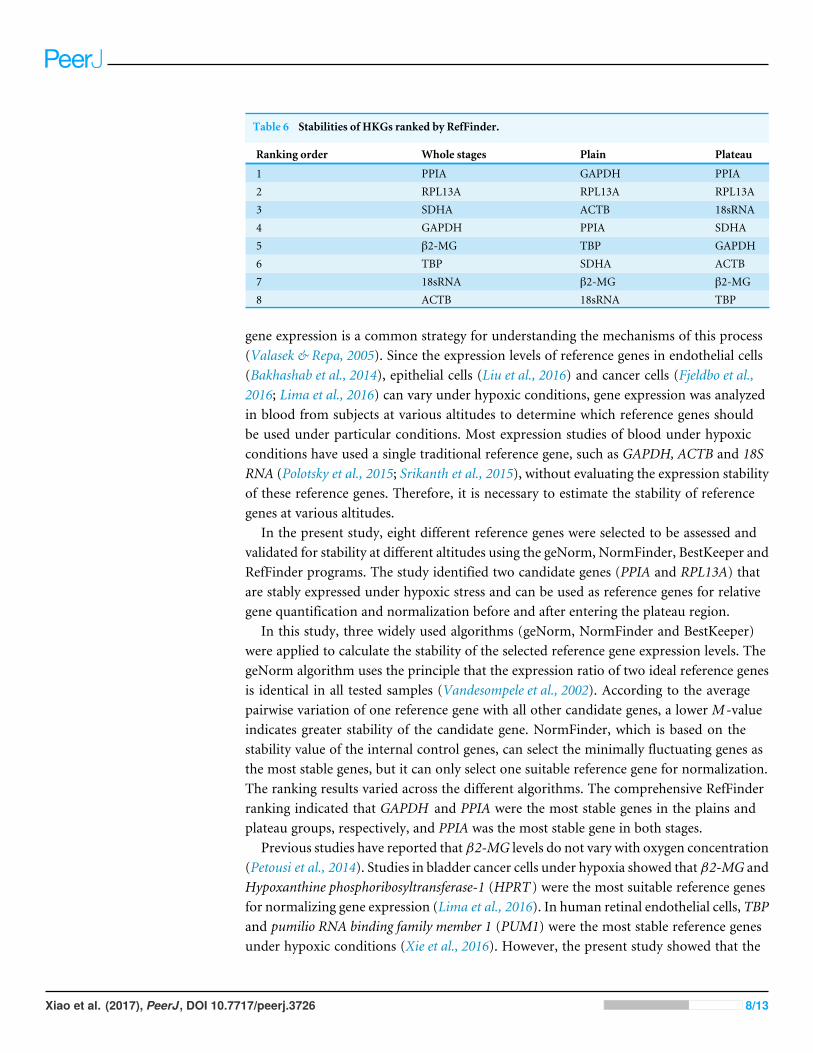
Table 6 Stabilities of HKGs ranked by RefFinder.
Ranking order Whole stages Plain Plateau
1 PPIA GAPDH PPIA2 RPL13A RPL13A RPL13A3 SDHA ACTB 18sRNA4 GAPDH PPIA SDHA5 β2-MG TBP GAPDH6 TBP SDHA ACTB7 18sRNA β2-MG β2-MG8 ACTB 18sRNA TBP
gene expression is a common strategy for understanding the mechanisms of this process(Valasek & Repa, 2005). Since the expression levels of reference genes in endothelial cells(Bakhashab et al., 2014), epithelial cells (Liu et al., 2016) and cancer cells (Fjeldbo et al.,2016; Lima et al., 2016) can vary under hypoxic conditions, gene expression was analyzedin blood from subjects at various altitudes to determine which reference genes shouldbe used under particular conditions. Most expression studies of blood under hypoxicconditions have used a single traditional reference gene, such as GAPDH, ACTB and 18SRNA (Polotsky et al., 2015; Srikanth et al., 2015), without evaluating the expression stabilityof these reference genes. Therefore, it is necessary to estimate the stability of referencegenes at various altitudes.
In the present study, eight different reference genes were selected to be assessed andvalidated for stability at different altitudes using the geNorm, NormFinder, BestKeeper andRefFinder programs. The study identified two candidate genes (PPIA and RPL13A) thatare stably expressed under hypoxic stress and can be used as reference genes for relativegene quantification and normalization before and after entering the plateau region.
In this study, three widely used algorithms (geNorm, NormFinder and BestKeeper)were applied to calculate the stability of the selected reference gene expression levels. ThegeNorm algorithm uses the principle that the expression ratio of two ideal reference genesis identical in all tested samples (Vandesompele et al., 2002). According to the averagepairwise variation of one reference gene with all other candidate genes, a lower M -valueindicates greater stability of the candidate gene. NormFinder, which is based on thestability value of the internal control genes, can select the minimally fluctuating genes asthe most stable genes, but it can only select one suitable reference gene for normalization.The ranking results varied across the different algorithms. The comprehensive RefFinderranking indicated that GAPDH and PPIA were the most stable genes in the plains andplateau groups, respectively, and PPIA was the most stable gene in both stages.
Previous studies have reported that β2-MG levels do not vary with oxygen concentration(Petousi et al., 2014). Studies in bladder cancer cells under hypoxia showed that β2-MG andHypoxanthine phosphoribosyltransferase-1 (HPRT ) were the most suitable reference genesfor normalizing gene expression (Lima et al., 2016). In human retinal endothelial cells, TBPand pumilio RNA binding family member 1 (PUM1) were the most stable reference genesunder hypoxic conditions (Xie et al., 2016). However, the present study showed that the
Xiao et al. (2017), PeerJ, DOI 10.7717/peerj.3726 8/13
stress-specific candidate genes β2-MG and TBP were not suitable for normalizing targetgene expression in blood under normoxic and hypoxic conditions.
Under normoxic conditions, GAPDH was the most stable gene in the blood, whereasunder hypoxic conditions, PPIA was the most stable candidate reference gene. RPL13Awas ranked as the second most stable reference gene in blood both under normoxic andhypoxic conditions. ACTBwas observed to be the most stable candidate gene in plain bloodusing the geNorm algorithm (Fig. 3B), but it was the least stable (Fig. 3A) in the combinedanalysis of tested samples. In the plateau stage but not in the plains stage, 18S RNA was oneof the most stable genes. The differences in the reference gene rankings could be associatedwith the algorithms used by each program.
Our study has some limitations. The identification of stable candidate genes for targetgene expression analysis in human blood between low- and high-altitude conditions wasa major challenge due to the difficulty involved in sample collection. This difficulty mayaccount for the limited number of volunteers enrolled in the present study and the limitednumber of gene expression studies of blood in the plateau environment. Thus, one of thelimitations of this study was that we could not collect enough blood samples to strengthenthe reliability of the present study. In addition, analyses of the stability of reference geneexpression should be verified at a cellular level in a hypoxic chamber. In the present study,however, the stability of candidate reference genes was reliably evaluated in blood undernormoxic and hypoxic stress conditions using algorithms. Previous studies on target geneexpression analyses of blood under hypoxic conditions used 18S RNA (Mishra et al., 2013)and β2-MG (Petousi et al., 2014) as reference genes for normalization. The present studyclearly showed that both PPIA and RPL13A are stable and suitable reference genes, but theamplification efficiency of PPIA was more than 1.05 (Table 2). Thus, RPL13A is the mostsuitable and stable reference gene for the normalization of target gene expression in bloodfrom the plains and plateau environments.
In conclusion, the present study determined that GAPDH and RPL13A in blood fromthe plains region and PPIA and RPL13A in blood from the plateau region were the moststable reference genes. Among the identified stably expressed reference genes in both theplains and plateau environments, RPL13A was shown to be most stable in blood fromboth the normoxic and hypoxic conditions. Additional studies should be conducted on thecellular level to verify the stability of the same reference genes.
CONCLUSIONSIn this study, the expression levels of eight candidate human reference genes (GAPDH,ACTB, 18S RNA, β2-MG, PPIA, RPL13A, TBP and SDHA) were assessed in blood fromhypoxic environments. We determined, for the first time, that RPL13A was the mostreliable reference gene for the normalization of target gene expression in human bloodfrom low- and high-altitude environments. However, to obtain reliable data, the use ofmore than one reference gene is strongly recommended.
Xiao et al. (2017), PeerJ, DOI 10.7717/peerj.3726 9/13
ACKNOWLEDGEMENTSThe authors thank Fengyan Fan for excellent technical assistance and we also thank themembers of the Department of Gene Detection in our hospital for helpful discussion.
ADDITIONAL INFORMATION AND DECLARATIONS
FundingThis work was supported by the Application Fundamental Research project foundationof China (No. AWS13J004). The funders had no role in study design, data collection andanalysis, decision to publish, or preparation of the manuscript.
Grant DisclosuresThe following grant information was disclosed by the authors:Application Fundamental Research project foundation of China: AWS13J004.
Competing InterestsThe authors declare there are no competing interests.
Author Contributions• Jun Xiao conceived and designed the experiments, performed the experiments, analyzedthe data, contributed reagents/materials/analysis tools, wrote the paper, prepared figuresand/or tables, reviewed drafts of the paper.• Xiaowei Li conceived and designed the experiments, performed the experiments,analyzed the data, contributed reagents/materials/analysis tools, prepared figures and/ortables, reviewed drafts of the paper.• Juan Liu performed the experiments, contributed reagents/materials/analysis tools,reviewed drafts of the paper.• Xiu Fan and Huifen Lei performed the experiments, reviewed drafts of the paper.• Cuiying Li performed the experiments, analyzed the data, reviewed drafts of the paper.
Human EthicsThe following information was supplied relating to ethical approvals (i.e., approving bodyand any reference numbers):
The General Hospital of the Air Force, PLA granted ethical approval to carry out thestudy within its facilities.
Data AvailabilityThe following information was supplied regarding data availability:
The raw data has been supplied as a Supplemental File.
Supplemental InformationSupplemental information for this article can be found online at http://dx.doi.org/10.7717/peerj.3726#supplemental-information.
Xiao et al. (2017), PeerJ, DOI 10.7717/peerj.3726 10/13
REFERENCESAhn K, Huh JW, Park SJ, KimDS, Ha HS, Kim YJ, Lee JR, Chang KT, KimHS.
2008. Selection of internal reference genes for SYBR green qRT-PCR stud-ies of rhesus monkey (Macaca mulatta) tissues. BMCMolecular Biology 9:78DOI 10.1186/1471-2199-9-78.
Andersen CL, Jensen JL, Orntoft TF. 2004. Normalization of real-time quantitativereverse transcription-PCR data: a model-based variance estimation approach toidentify genes suited for normalization, applied to bladder and colon cancer datasets. Cancer Research 64:5245–5250 DOI 10.1158/0008-5472.CAN-04-0496.
Bakhashab S, Lary S, Ahmed F, Schulten HJ, Bashir A, Ahmed FW, Al-Malki AL,Jamal HS, Gari MA,Weaver JU. 2014. Reference genes for expression studies inhypoxia and hyperglycemia models in human umbilical vein endothelial cells. G34:2159–2165 DOI 10.1534/g3.114.013102.
Beall CM. 2000. Tibetan and Andean patterns of adaptation to high-altitude hypoxia.Human Biology 72:201–228.
Beall CM, Cavalleri GL, Deng L, Elston RC, Gao Y, Knight J, Li C, Li JC, Liang Y,McCormackM,Montgomery HE, Pan H, Robbins PA, Shianna KV, Tam SC,Tsering N, Veeramah KR,WangW,Wangdui P, Weale ME, Xu Y, Xu Z, Yang L,ZamanMJ, Zeng C, Zhang L, Zhang X, Zhaxi P, Zheng YT. 2010. Natural selectionon EPAS1 (HIF2alpha) associated with low hemoglobin concentration in Tibetanhighlanders. Proceedings of the National Academy of Sciences of the United States ofAmerica 107:11459–11464 DOI 10.1073/pnas.1002443107.
Bustin SA. 2002. Quantification of mRNA using real-time reverse transcription PCR(RT-PCR): trends and problems. Journal of Molecular Endocrinology 29:23–39DOI 10.1677/jme.0.0290023.
Bustin SA, Benes V, Garson JA, Hellemans J, Huggett J, Kubista M, Mueller R, Nolan T,Pfaffl MW, Shipley GL, Vandesompele J, Wittwer CT. 2009. The MIQE guidelines:minimum information for publication of quantitative real-time PCR experiments.Clinical Chemistry 55:611–622 DOI 10.1373/clinchem.2008.112797.
Bustin SA, Nolan T. 2004. Pitfalls of quantitative real-time reverse-transcriptionpolymerase chain reaction. Journal of Biomolecular Techniques 15:155–166.
Chen G, Yue A, Yu H, Ruan Z, Yin Y,Wang R, Ren Y, Zhu L. 2016.Mesenchymal stemcells and mononuclear cells from cord blood: cotransplantation provides a bettereffect in treating myocardial infarction. Stem Cells Translational Medicine 5:350–357DOI 10.5966/sctm.2015-0199.
Fjeldbo CS, Aarnes EK, Malinen E, Kristensen GB, Lyng H. 2016. Identification andvalidation of reference genes for RT-qPCR studies of hypoxia in squamous cervicalcancer patients. PLOS ONE 11:e0156259 DOI 10.1371/journal.pone.0156259.
Gentile AM, Lhamyani S, Coin-Araguez L, Oliva-OliveraW, Zayed H, Vega-Rioja A,Monteseirin J, Romero-Zerbo SY, Tinahones FJ, Bermudez-Silva FJ, El Bekay R.2016. RPL13A and EEF1A1 are suitable reference genes for qPCR during adipocyte
Xiao et al. (2017), PeerJ, DOI 10.7717/peerj.3726 11/13
differentiation of vascular stromal cells from patients with different BMI andHOMA-IR. PLOS ONE 11:e0157002 DOI 10.1371/journal.pone.0157002.
Jaramillo ML, Ammar D, Quispe RL, Guzman F, Margis R, Nazari EM,Muller YM.2017. Identification and evaluation of reference genes for expression studies byRT-qPCR during embryonic development of the emerging model organism,Macrobrachium olfersii. Gene 598:97–106 DOI 10.1016/j.gene.2016.11.001.
Ji LD, Qiu YQ, Xu J, Irwin DM, Tam SC, Tang NL, Zhang YP. 2012. Genetic adap-tation of the hypoxia-inducible factor pathway to oxygen pressure amongeurasian human populations.Molecular Biology and Evolution 29:3359–3370DOI 10.1093/molbev/mss144.
Lima L, Gaiteiro C, Peixoto A, Soares J, Neves M, Santos LL, Ferreira JA. 2016.Reference genes for addressing gene expression of bladder cancer cell modelsunder hypoxia: a step towards transcriptomic studies. PLOS ONE 11:e0166120DOI 10.1371/journal.pone.0166120.
Liu X, Xie J, Liu Z, Gong Q, Tian R, Su G. 2016. Identification and validation of referencegenes for quantitative RT-PCR analysis of retinal pigment epithelium cells underhypoxia and/or hyperglycemia. Gene 580:41–46 DOI 10.1016/j.gene.2016.01.001.
Liu LL, Zhao H, Ma TF, Ge F, Chen CS, Zhang YP. 2015. Identification of valid referencegenes for the normalization of RT-qPCR expression studies in human breast cancercell lines treated with and without transient transfection. PLOS ONE 10:e0117058DOI 10.1371/journal.pone.0117058.
Mishra A, Mohammad G, Thinlas T, PashaMA. 2013. EGLN1 variants influenceexpression and SaO2 levels to associate with high-altitude pulmonary oedema andadaptation. Clinical Science 124:479–489 DOI 10.1042/CS20120371.
Nolan T, Hands RE, Bustin SA. 2006. Quantification of mRNA using real-time RT-PCR.Nature Protocols 1:1559–1582 DOI 10.1038/nprot.2006.236.
Ofinran O, Bose U, Hay D, Abdul S, Tufatelli C, Khan R. 2016. Selection of suitable ref-erence genes for gene expression studies in normal human ovarian tissues, borderlineovarian tumours and ovarian cancer.Molecular Medicine Reports 14:5725–5731DOI 10.3892/mmr.2016.5933.
Petousi N, Croft QP, Cavalleri GL, Cheng HY, Formenti F, Ishida K, Lunn D, McCor-mackM, Shianna KV, Talbot NP, Ratcliffe PJ, Robbins PA. 2014. Tibetans livingat sea level have a hyporesponsive hypoxia-inducible factor system and bluntedphysiological responses to hypoxia. Journal of Applied Physiology 116:893–904DOI 10.1152/japplphysiol.00535.2013.
Pfaffl MW, Tichopad A, Prgomet C, Neuvians TP. 2004. Determination of stablehousekeeping genes, differentially regulated target genes and sample integrity:BestKeeper–Excel-based tool using pair-wise correlations. Biotechnology Letters26:509–515 DOI 10.1023/B:BILE.0000019559.84305.47.
Polotsky VY, Bevans-Fonti S, Grigoryev DN, Punjabi NM. 2015. Intermittent hypoxiaalters gene expression in peripheral blood mononuclear cells of healthy volunteers.PLOS ONE 10:e0144725 DOI 10.1371/journal.pone.0144725.
Xiao et al. (2017), PeerJ, DOI 10.7717/peerj.3726 12/13
Sellars MJ, Vuocolo T, Leeton LA, Coman GJ, Degnan BM, Preston NP. 2007. Real-time RT-PCR quantification of Kuruma shrimp transcripts: a comparison of relativeand absolute quantification procedures. Journal of Biotechnology 129:391–399DOI 10.1016/j.jbiotec.2007.01.029.
Srikanth L, SunithaMM, Venkatesh K, Kumar PS, Chandrasekhar C, Vengamma B,Sarma PV. 2015. Anaerobic glycolysis and HIF1alpha expression in haematopoieticstem cells explains its quiescence nature. Journal of Stem Cells 10:97–106.
Tricarico C, Pinzani P, Bianchi S, Paglierani M, Distante V, Pazzagli M, BustinSA, Orlando C. 2002. Quantitative real-time reverse transcription polymerasechain reaction: normalization to rRNA or single housekeeping genes is in-appropriate for human tissue biopsies. Analytical Biochemistry 309:293–300DOI 10.1016/S0003-2697(02)00311-1.
ValasekMA, Repa JJ. 2005. The power of real-time PCR. Advances in PhysiologyEducation 29:151–159 DOI 10.1152/advan.00019.2005.
Vandesompele J, De Preter K, Pattyn F, Poppe B, Van Roy N, De Paepe A, Speleman F.2002. Accurate normalization of real-time quantitative RT-PCR data by geometricaveraging of multiple internal control genes. Genome Biology 3:RESEARCH0034.
Wang H, Yang B, Geng T, Li B, Dai P, Chen C. 2015. Tissue-specific selection of optimalreference genes for expression analysis of anti-cancer drug-related genes in tumorsamples using quantitative real-time RT-PCR. Experimental and Molecular Pathology98:375–381 DOI 10.1016/j.yexmp.2014.10.014.
Xie J, Liu X, Li Y, Liu Y, Su G. 2016. Validation of RT-qPCR reference genes anddetermination of Robo4 expression levels in human retinal endothelial cells underhypoxia and/or hyperglycemia. Gene 585:135–142 DOI 10.1016/j.gene.2016.03.047.
Zhang X, Ding L, Sandford AJ. 2005. Selection of reference genes for gene expressionstudies in human neutrophils by real-time PCR. BMCMolecular Biology 6:4DOI 10.1186/1471-2199-6-4.
Xiao et al. (2017), PeerJ, DOI 10.7717/peerj.3726 13/13