identification of shale gas by vsp & well log data rajeeva ... · pdf fileorganically rich...
TRANSCRIPT

1
Identification of Shale Gas by VSP & Well Log Data*Dr. Rajeeva Kumar Jaiswal, Sanjiv Kumar Shrivastava & U S D Pandey#
Geophysical Services, Western Onshore Basin, ONGC, Vadodara-390 009# Ist Floor, Priyadarshini Building, ONGC, Sion, Mumbai-400022
*Email ID: [email protected]
Keywords
VSP, shale gas, well log, seismic, Cambay shale
Summary
An attempt has been made to identify shale gas zone with thehelp of VSP (Vertical Seismic Profiling) & well log data in aparametric well, Well-A drilled by ONGC in the Jambusararea of Cambay basin, Gujarat, India. The integrated study ofzero offset VSP data pertaining to Well-A in conjunctionwith surface seismic data and various well logs helped toidentify potential shale gas zones showed good correlation inCambay shale.
There are few zones where VSP, well log data and surfaceseismic data are giving the good correlation which indicateslikely to presence of shale gas in Well-A of Jambusar area.
Introduction
Shale gas is one of the important unconventional energysources. It is natural gas produced from shale. It has been agame changer of the world energy market. Shale gasdevelopment is biggest energy innovation of recent times. Ithas become an increasingly important source of natural gas inthe United States over the past decade, and interest has spreadto potential shale gas in Canada, Europe, Asia and Australia.In India, shale deposits are found across the Gangetic plain,Assam, Rajasthan and many coastal areas. Broadly fourbasins viz. Cambay, Krishna-Godavari, Cauvery and theDamodar Valley are estimated to have commercial shale gasreservoirs. Recently, Oil and Natural Gas Corporation Ltd.(ONGC) has taken up initiative to explore and harness theseresource potentials.
Shale formations act as the source as well as the reservoir forthe natural gas. Each shale gas reservoir has uniquecharacteristics. Shales ordinarily have very low permeabilityto allow significant fluid flow; most shales are notcommercial sources of natural gas. Due to low matrixpermeability, shale gas production in commercial quantitiesrequires fractures at large scale.
Mapping the distribution of shale gas sweet spots andidentifying their thermal maturity, organic carbon richnessand natural fracture network using seismic data are of criticalimportance for shale gas field exploration and development.
Study has been carried out on one of the well from Jambusararea (Broach-Jambusar Block) of Cambay basin. The zero
offset VSP data pertaining to the Well-A has been correlatedwith the set of other wire line log data and surface seismicdata to identify various shale zone encountered in the well.
The present paper describes efforts made to evaluate the shalegas potential in a super deep Well-A drilled by ONGC in theJamubsar area of Cambay Basin.
General Geology of Cambay Basin
Cambay Basin is an intracratonic rift graben located in thewestern part of India. The general basinal axis is NNW-SSE,but swings are noticed across major lineaments/ faults. Entirebasin is divisible into five tectonic blocks (Figure 1), basedon transverse fault system, and the associated depocentres aregoverned by rifted basement.
Figure 1: Map showing tectonic blocks of Cambay Basin(Mishra & Patel, 2011) and the study area.A thick column of fine grained clastic sediment termed as‘Cambay Shale’ is present in major depressions like
N
11th Biennial International Conference & Exposition

Identification of Shale Gas by VSP & Well Log Data
2
Broach,Tarapur and Patan etc. as shown in Figure 1. Itbelongs to Upper Paleocene to Middle Eocene age. Thisformation has been proved as an excellent source rock forgeneration of oil and gas in the basin. The study area falls inthe Broach-Jambusar Block is shown in Figure 1 as redcircle. This block has sediments up to 7 km at the depocenter.
Generation Potential of Cambay Shale
Isopach map of Cambay Shale is shown in Figure 2.Thickness of the Cambay shale varies widely from 50m to70m over structural highs like Mehsana horst, Ankaleswarhigh to more than 1000m in Broach, Tankari, Tarapur andPatan depressions. The temperature gradient has beenobserved to be varying from 3º - 6 º C/100m in different partsin the basin. This has provided a very favorable geologicalenvironment setting for hydrocarbon generation in the Shalein all depocentres (Mishra & Patel, 2011).
Figure 2: Isopach map of Cambay shale, DGH (2009)
Figure 3 shows the total organic carbon (TOC) content;organically rich source sequence and Kerogene type andsediments have mixed type II and III organic carbon matter.
It has been noticed in some places that organic content ofshales increases towards depocentres.
Figure 3: Map showing distribution of Kerogen type andTOC in Cambay Shale, DGH (2009)
According to Mishra & Patel (2011) the Cambay Shale hasundergone different phases of maturation at differentstratigraphic levels and depressions. After the expulsion of oiland gas from the shale in different depocenters, the remaininghydrocarbon generated has been trapped in pores, fracturesand in kerogen surfaces either in free state or adsorbed state.In context of the geological setting of the basin in general andwith special reference to Cambay Shale, there is likelypresence of excellent reservoir character like pores, fracturesand significant amount of kerogens. Also in many places, theshale shows good brittleness. Thus Cambay Shale holdstremendous potential for generation and storage of shale gas.
Cambay Shale comprises of two sections viz. YCS (YoungerCambay Shale) and OCS (Older Cambay Shale). OCScontains fewer sands and comprises of black shale. Innorthern part, YCS is thick and includes various prolificreservoirs whereas in southern part, it is not developed.Figure 4 shows the maturity map of middle part of CambayShale. Where green colour is showing oil window, blue onefor peak oil generation region and pink depicts wet gas.
N
N
11th Biennial International Conference & Exposition

Identification of Shale Gas by VSP & Well Log Data
3
Figure 4: Maturity map of middle part of Cambay Shale(DGH, 2009)
Evaluation of Shale Gas
According to Emsley et al. (2011) shale gas resources can beevaluated with the combined study of surface seismic, VSP,well log and FMI. There are few key factors for developmentof shale gas and these include identification of sweetspotsand distribution of brittle or plastic zone. Schematic of aworkflow that can be used in the evaluation of shale gasresources is shown in Figure 5.
Figure 5: Schematic of a workflow that can be used in theevaluation of shale gas resources (Source: Emsley et al.,2011).
About Well-A
Parametric well, Well-A was drilled to explore hydrocarbonsin Mesozoic sediments, Fractured Deccan Trap, Olpadformation, Cambay shale and the pinchout prospect ofAnkleswar formation. The well had to be terminated at thedepth of 5502m in weathered Deccan trap because oftechnical reason. It is one of the deepest well available inBroach-Jambusar block of Cambay Basin. Location of well-Ais shown in Figure 6.
Figure 6: Location of well-A
Stratigraphy & lithology encountered in the Well-A is shownin Table 1 & Table 2 respectively.
Table 1: Stratigraphy of the Well-A
Formation Top Depth (m) w.r.t. KBJhagadia 868Kand 1035Babaguru 1405Tarkeshwar 1720Dadhar 1822Telva 1970Ardol 1990Kanwa 2260Hazad 2292Cambay Shale 2330Olpad 2989Deccan Trap 5447+
(Source: Unpublished Well Completion Report of ONGC)
N
11th Biennial International Conference & Exposition
Identification of Shale Gas by VSP & Well Log Data
4
Table 2: Lithology in deeper part of Well-A
Depth (m) Lithology
1720-1827 Mainly shale with claystone and siltysand
1822-1970 Mainly coarse to medium grained sand1970-1990 Mainly shale
1990-2260 Mainly coarse grained sand withshale/clay
2260-2292 Mainly shale
2292-2330 Mainly sand, medium lime grain withsome amount of shale
2330-2989 Mainly shale with very small silty sand
2989-4090 Mainly shale with claystone and minoramt. of trap wash with calcite
4095-4365 Mainly claystone4365-4685 Mainly trapwash with claystone4685-4745 Mainly claystone4745-5410 Alternation of trap wacke and claystone5410-5502 Trap, trap wack and clay stone
(Source: Unpublished well completion report of ONGC)
VSP Data Analysis
Zero offset VSP was carried out in Well-A from 579 - 2949m(from MSL).
VSP Acquisition Parameter
(1) Recording instrument : DSS-10 Aa) Number of Channels : 2b) Format : SEG ‘B’c) Record length : 7 secd) K-gain : 36dbe) Sampling Interval : 2msf) Lo-Cut : 6Hzg) Hi-Cut : 125Hzh) Notch : IN
(2) Geophone Tool used : Geolock-H(3 Comp)
(3) Energy Source:a) Type : Airgun (single)b) Volume of Airgun : 129 cu. inchc) Operating pressure : 2000PSId) Offset : Approx. 56me) Pit depth : 3m
(4) GL & KBGround Elevation : 13.61mKelly Bushing (KB) : 21.23m
(5) Meterage window (From KB) : 2970-600mDepth interval2970m - 2340m : 30m2340m – 1400m : 20m1400m - 600m : 100m
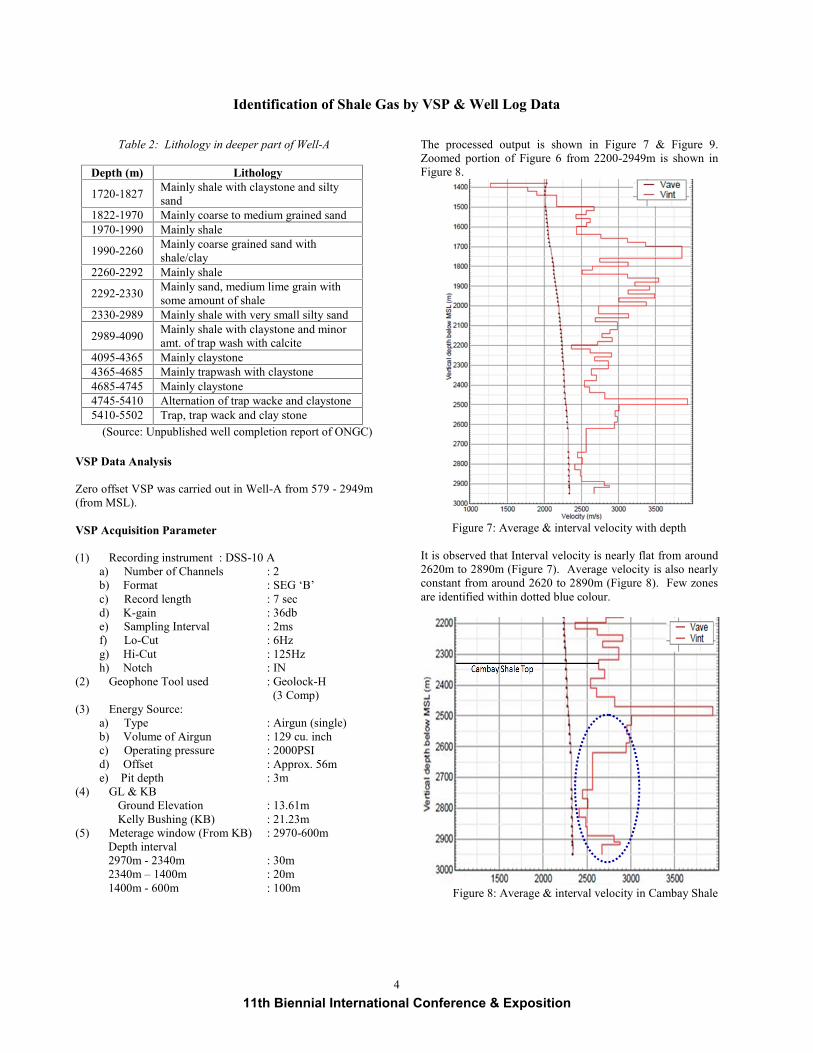
The processed output is shown in Figure 7 & Figure 9.Zoomed portion of Figure 6 from 2200-2949m is shown inFigure 8.
Figure 7: Average & interval velocity with depth
It is observed that Interval velocity is nearly flat from around2620m to 2890m (Figure 7). Average velocity is also nearlyconstant from around 2620 to 2890m (Figure 8). Few zonesare identified within dotted blue colour.
Figure 8: Average & interval velocity in Cambay Shale
11th Biennial International Conference & Exposition

Identification of Shale Gas by VSP & Well Log Data
5
Integrated correlation of well logs of Well-A, syntheticseismogram, corridor stack of VSP data and seismic sectionof 2D line are matching well as shown in Figure 9.
Figure 9: Integrated correlation of well logs of Well-A,synthetic seismogram, corridor stack of VSP data and seismicsection of 2D line. (Source: Unpublished Report of ONGC)
Petrophysical Data Analysis
The primary data used for petrophysical analysis of shaleformations are the same as those used for conventionalreservoir analysis – gamma ray, resistivity, porosity andacoustic – with the addition of neutron capture spectroscopydata.
Gaseous zones in particular formation are identified based onfollowing few observations:
Gamma Ray log: High gamma ray counts to identifyorganic rich shale formations
Resistivity log: The resistivity in gas-bearing shalesare usually higher than those surrounding shales
Sonic log: Lower interval velocity values Density log: Slight decrease or not much change Caliper log: Less caving, consistent values VSP data: Low & constant Interval velocity Surface seismic: Feable events, very low reflection
zones and constant stacking velocityVelocity (m/s), density (gm/cc), gamma (API) and Caliper(Inches) logs of Well-A are shown in Figure 10 and itszoomed portion is shown in Figure 11. Caliper log indicatesthat well condition was not disturbed from depth 2345 –
2989m as shown in Figure 10. Probable shale gas zones areidentified within red box (2345 – 2989m).
Observations
The data pertaining to Cambay Shale has been observed in 3zones in VSP, well log and surface seismic data. At the top ofCambay Shale, a zone is noticed in 2345-2412m. CuttingTOC data shows good TOC values in the range 2-2.5 wt% atthis depth (CEWELL report). VSP data shows that Intervalvelocity is low and surface seismic also showing lowreflection events at this interval.
Figure 10: Sonic, density, gamma & caliper log of Well-A
In the middle part of Cambay Shale, a high resistivity andlow gamma ray section without much change in porosity logshas been developed in the intervals: 2455-2480m. The zone ishaving TOC range from 1.5 to 2.5 wt% and shows somecharacter of conventional reservoir. However, VRo (VitriniteReflectance), data is negative (~0.6 Ro). VSP data shows thatInterval velocity is high in these depths. This zone requiresfurther scrutiny to find out its shale gas potentiality.
Entire bottom section of Cambay Shale appears interesting inwells Well-A (2532-2990m) with average TOC of the orderof 2.0 wt% (CEWELL report). In our analysis, VSP datashows that Interval velocity is very low and constant around2532-2949m and average velocity is also constant fromaround 2600-2949m also giving clue about potentiality ofshale gas. Surface seismic are also showing low reflectionevents and costant stacking velocity in this depth as shown inFigure 10 & 11.
WellA
Well
A
C.S. Top
C.S. Bottom
11th Biennial International Conference & Exposition
Identification of Shale Gas by VSP & Well Log Data
6
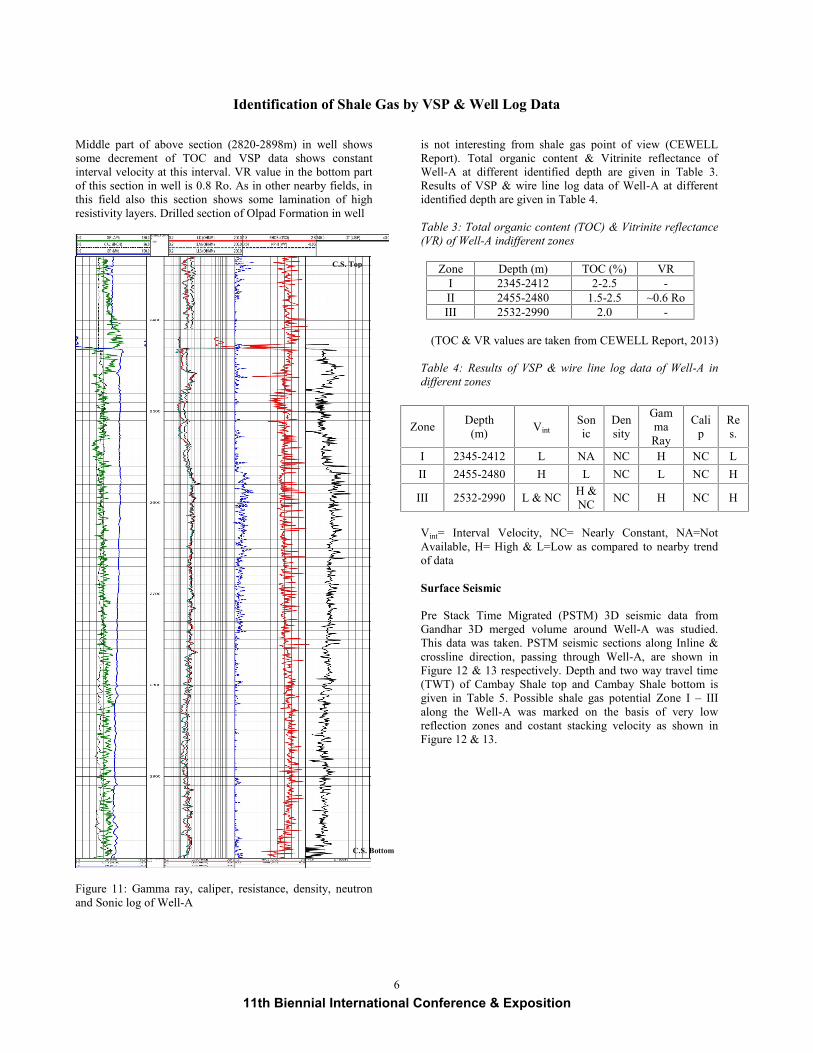
Middle part of above section (2820-2898m) in well showssome decrement of TOC and VSP data shows constantinterval velocity at this interval. VR value in the bottom partof this section in well is 0.8 Ro. As in other nearby fields, inthis field also this section shows some lamination of highresistivity layers. Drilled section of Olpad Formation in well
Figure 11: Gamma ray, caliper, resistance, density, neutronand Sonic log of Well-A
is not interesting from shale gas point of view (CEWELLReport). Total organic content & Vitrinite reflectance ofWell-A at different identified depth are given in Table 3.Results of VSP & wire line log data of Well-A at differentidentified depth are given in Table 4.
Table 3: Total organic content (TOC) & Vitrinite reflectance(VR) of Well-A indifferent zones
Zone Depth (m) TOC (%) VRI 2345-2412 2-2.5 -II 2455-2480 1.5-2.5 ~0.6 RoIII 2532-2990 2.0 -
(TOC & VR values are taken from CEWELL Report, 2013)
Table 4: Results of VSP & wire line log data of Well-A indifferent zones
Vint= Interval Velocity, NC= Nearly Constant, NA=NotAvailable, H= High & L=Low as compared to nearby trendof data
Surface Seismic
Pre Stack Time Migrated (PSTM) 3D seismic data fromGandhar 3D merged volume around Well-A was studied.This data was taken. PSTM seismic sections along Inline &crossline direction, passing through Well-A, are shown inFigure 12 & 13 respectively. Depth and two way travel time(TWT) of Cambay Shale top and Cambay Shale bottom isgiven in Table 5. Possible shale gas potential Zone I – IIIalong the Well-A was marked on the basis of very lowreflection zones and costant stacking velocity as shown inFigure 12 & 13.
Zone Depth(m) Vint
Sonic
Density
GammaRay
Calip
Res.
I 2345-2412 L NA NC H NC LII 2455-2480 H L NC L NC H
III 2532-2990 L & NC H &NC NC H NC H
C.S. Top
C.S. Bottom
11th Biennial International Conference & Exposition

Identification of Shale Gas by VSP & Well Log Data
7
Figure 12: PSTM seismic section along Inline passingthrough Well-A
Figure 13: PSTM seismic section along crossline passingthrough Well-A
Table 5: Depth and Two way travel time (TWT) of Cambayshale top & Cambay shale bottom
Formation Depth (m) TWT (ms)Cambay Shale Top 2330 2035Cambay Shale Bottom 2989 2540
Deliberations
Based on combined analysis of VSP data, well log data,surface seismic and TOC three zones are identified as shownin Table 4 for shale gas potential zones in Well-A. Out ofthree zones identified, zone III in depth interval 2532 -2990mseems to be more interesting for shale gas prospectivity asVSP data shows low/constant average and interval velocityand Surface seismic are also showing low reflection eventsand costant stacking velocity in this zone. Correlation of
various well logs viz. density, self-potential, resistivity &sonic logs of Well-A is shown in Figure 8. Integratedcorrelation of these well logs of Well-A, syntheticseismogram, corridor stack of VSP and seismic section of 2Dline passing through well are presented in Figure 9.
Conclusions
Nearly constant average and lower interval velocityin the deeper part of Well-A indicates shale gaspotential zones.
With the help of integration study of zero offset VSPdata, surface seismic, TOC and well-log data, threeprobable shale gas zones are identified. Out of abovethree zones Zone III (2532 -2990m) within CambayShale have seems to have better potential.
References
DGH (2009): Cambay basin Information document.Emsley, S., Zadeh, E. & Kemper, M., 2011, Integratedworkflow for the development of a calibrated coupledgeomechanical flow simulator for unconventional reservoirs,International Energy Outlook 2011, U.S. Department ofEnergy, Washington, DC 20585, DOE/EIA-0484(2011).Mishra, S. and Patel, B. K., 2011, Gas shale potential ofCambay formation, Cambay Basin, India; GEO-India, 2011.Surface Seismic, 2D Seismic data, SIG-235, ONGC.Surface Seismic, Gandhar merged 3D volume, ONGC.ONGC unpublished report on zero offset VSP survey ofWell-A, ONGC, September 1991.ONGC unpublished report on VSP operation of Well-A, May1989.ONGC unpublished report on Well Completion Report ofWell-A, May 1989.
Acknowledgements
Authors would like to acknowledge Shri A. V. Sathe, ED -Basin Manager, WON Basin, ONGC, Vadodara for hisinspiration and kind permission to publish this paper.
Sincere thanks to various geoscientists whose work is usedfor this study and their help and co-operation to complete thiswork. Authors would like to acknowledge ONGC forproviding necessary infrastructure for completing this study.
The view expressed here are solely of authors and do notnecessarily reflect the view of ONGC.
Zone I
Zone III
Zone II
Zone II
Zone I
Zone III
CS Top
CSBottom
CS Top
EW
N S
CSBottom
11th Biennial International Conference & Exposition