identification of sources from chemical characterization
TRANSCRIPT
Aerosol and Air Quality Research, 19: 118–128, 2019 Copyright © Taiwan Association for Aerosol Research ISSN: 1680-8584 print / 2071-1409 online doi: 10.4209/aaqr.2017.12.0604 Identification of Sources from Chemical Characterization of Fine Particulate Matter and Assessment of Ambient Air Quality in Dhaka, Bangladesh Bilkis A. Begum1, Philip K. Hopke2,3* 1 Chemistry Division, Atomic Energy Centre, Dhaka, Bangladesh 2 Department of Public Health Sciences, University of Rochester School of Medicine and Dentistry, Rochester, NY 14642, USA 3 Center for Air Resources Engineering and Science, Clarkson University, Potsdam, NY 13699, USA ABSTRACT
Air pollution in Dhaka has drawn the attention of the government and the public over the past several decades,
especially upon the discovery of Pb in the air. As a result, several policy interventions have been implemented to improve the air quality. Sampling for fine airborne particulate matter (PM2.5, PM with an aerodynamic diameter < 2.5 µm) has been conducted at a semi-residential site (AECD) in Dhaka since December 1996 using a GENT sampler. The retrieved samples were analyzed for their mass, black carbon (BC), and elemental compositions, and the resulting data set was analyzed for source identification via the Positive Matrix Factorization (PMF) technique. The identified sources are wood burning, soil dust, brick kilns, fugitive Pb, road dust, Zn sources, motor vehicles, and sea salt. The Government of Bangladesh is considering various interventions to reduce the emissions from these sources by promoting the replacement of diesel/petrol automobiles with CNG vehicles, increasing traffic speed in the city, and introducing green technologies for brick production. However, reducing the effect of transboundary contributions on the local air quality will necessitate regional measures as well. Keywords: PM; Positive Matrix Factorization, BC; Traffic; Compressed natural gas. INTRODUCTION
Prior to 1999, little effort was made to control vehicular and industrial emissions that degraded air quality in Bangladesh. At that time, there was no national air quality management system to monitor or regulate air pollution. Beginning in 1999, the government began to establish regulatory and institutional frameworks to address urban air quality problems (Khan et al., 1980; Khaliquzzaman et al., 1995; Khaliquzzaman et al., 1999). To improve air quality within Dhaka (Begum et al., 2004; Begum et al., 2005a; 2006a), capital of Bangladesh, and to ultimately attain U.S. EPA as well as the Bangladesh National Air Quality Standards, a number of control strategies have been developed and implemented (Begum et al., 2005b; Begum and Hopke, 2018). The government banned use of leaded gasoline in July 1999. As a result, airborne Pb concentrations were reduced (Biswas et al., 2003). The old two-stroke engine three-wheelers have been completely replaced by CNG-powered four-stroke three-wheelers from January * Corresponding author.
E-mail address: [email protected]
2003. New cars are now equipped with air pollution control devices, CNG-powered cars, buses, and trucks have been recently introduced, and industrial sources such as brick kiln emission are slowly being regulated. Because of these implemented control strategies, air quality in Dhaka has slowly, but steadily improved (Begum et al., 2005b). After the introduction of CNG and banning of two-stroke engines, contribution from vehicles has decreased, but the contribution from brick kilns increased (Begum et al., 2014). The government is also trying to improve brick production technology through the Clean Air and Sustainable Environment (CASE) project that was implemented by the Department of Environment, Ministry of Forestry, and Environment (MOFE).
Air quality monitoring data is a key component to understand extent of problem and to develop strategies for reducing air pollution. Ambient air quality monitoring data provides measurement of concentrations of pollutants in the air at a specific place over a specified time. These data provide valuable information about how much pollution is in the air, where the air is most polluted, and some information about understanding the extent of the problem. In this study, we will present the source identification and apportionment for PM2.5 using this long series of data (1997–2015).
Begum and Hopke, Aerosol and Air Quality Research, 19: 118–128, 2019 119
MATERIALS AND METHOD PM Sampling and Analysis
Sampling was performed at a semi-residential site in Dhaka using a “Gent” stacked filter sampler (Hopke et al., 1997) capable of collecting air particulate samples in coarse (2.5–10 µm) and fine (2.5 µm,) size fractions. Fig. 1 shows the location of the sampling site in Dhaka. The sampler was placed on the flat roof of the Atomic Energy Centre, Dhaka (AECD) campus building. The roof height was 5 m above ground and the intake nozzle of the sampler was located 1.8 m above the roof. The intake was about 80 m away from the nearest road. The sampler was placed so that the airflow around it was unobstructed. Samples were generally collected twice a week throughout the year.
The samples were collected on nuclepore filters with 8 µm pores for the coarse fraction and 0.4 µm pores for the fine fraction. After sampling, the sample holder (Stack Filter Unit) was brought in the AECD (Atomic Energy Centre, Dhaka) Laboratory for retrieval of the filters and the samples were kept in airtight petrislides and stored in air-conditioned room (temperature 22C and relative humidity of 50% approximately). The post weighing of the samples are usually done within one month of collection. Cross checking of the sampling method with AirMetrics MiniVol sampler shows that the GENT sampler has comparable sampling efficiency (Begum and Biswas, 2005).
PM Mass and BC Determination
Mass and BC were measured in the AECD laboratory.
The aerosol masses of both the coarse and fine fractions were determined by weighing the filters before and after exposure using a microbalance (METTLER Model MT5) and maintaining room temperature at 22C and relative humidity at 50%. The aerosol samples of fine (PM2.5) fractions were equilibrated at constant humidity and temperature of the balance room before every weighing. A U-shape electrostatic charge eliminator (STATICMASTER) was used to eliminate the static charge accumulated on the filters before each weighing. Quality control in filter weighing was assured by using appropriate laboratory and field blanks.
The PM2.5 samples were analyzed by an EEL-type Smoke Stain Reflectometer to measure BC. Secondary standards of known black carbon concentrations were used to calibrate the reflectometer (Biswas et al., 2003). The concentrations are defined based on the amount of reflected light that is absorbed by the filter sample and an assumed mass absorption coefficient. It is related to the concentration of light-absorbing carbon through standards of carbon with known areal density. Iron (Fe) has a moderate light absorption coefficient and can have some limited influence on the BC value measured by reflectance. The uncertainty associated with the BC measurement is rather high (4–9%). and therefore, the influence of variation in Fe concentration on BC measurement has been neglected. The extinction coefficient, 10 m2 g–1, was used for the BC calculation (Biswas et al., 2003). Multielemental Analysis
Multielemental analyses of the air particulate samples
Meteorological Station
SR Site
Fig. 1. Map of sampling location at Dhaka, Bangladesh.

Begum and Hopke, Aerosol and Air Quality Research, 19: 118–128, 2019 120
were made using Ion Beam Analysis (IBA) at the Institute of Geological and Nuclear Science (IGNS), New Zealand. The X-ray spectra obtained from IBA measurements were analyzed using the computer code GUPIX (Maxwell et al., 1989, 1995). Elemental analyses from F to Pb were performed on the nuclepore filters using IBA (Cohen et al., 1996). Landsberger et al. (1998) describe the method in detail. Of the twenty-five elements determined for all 1510 fine fraction samples, over 80% had eight elements: P, Sc, Ga, Ge, As, Se, Rb, and Sr with values that were missing or below the detection limits. Data on the concentrations of seventeen elements (Na, Al, Si, S, Cl, K, Ca, Ti, V, Cr, Mn, Fe, Ni, Cu, Zn, Br, and Pb), black carbon, and mass were available for data analysis. The data quality of the available elemental concentration together with mass, and BC were tested by examining the reconstructed mass (RCM) in which the computed RCM values are compared with the gravimetric value (Supplemental Fig. S1). A least square fit to the fine mass data resulted in RCM = 0.799 × Weight with an R2 = 0.723 (Begum et al., 2006b).
Positive Matrix Factorization
PMF is a source-receptor model that solves the equation:
1
p
ij ik kj iji
x g f e
(1)
where x is the matrix of ambient data collected at the receptor site, consisting of the species Na, Mg, Al, Si, S, Cl, K, Ca, Ti, Cr, Mn, Fe, Ni, Cu, Zn, Br, Pb, and BC (Paatero, 1997; Paatero et al., 2002; Paatero et al., 2005). PMF has now been widely used for source identification and apportionment (Hopke, 2016a, b). In this work, any missing data were replaced by the geometric mean of corresponding species. Half of the detection limit was used for any value below detection limit and its uncertainty was set to 5/6 of detection limit value (Polissar et al., 1998). The analysis was performed using the program PMF2 (Paatero, 1997). Conditional Probability Function
To explore the locations of local sources relative to the monitoring site, conditional probability function (CPF) values were calculated for each of the resolved factors (Ashbaugh et al., 1985; Kim et al., 2003). The CPF is defined by:
mCPF
n
(2)
where nΔθ is the number of samples where the wind direction falls within the Δθ interval and mΔθ is the number of samples where the wind direction falls within the Δθ interval and the contribution from that factor was greater than the 75th percentile value. METEOROLOGICAL CONDITIONS
In Bangladesh, the climate is characterized by high
temperatures, high humidity most of the year, and distinctly marked seasonal variations in precipitation. According to meteorological conditions, the year can be divided into four seasons, pre-monsoon (March–May), monsoon (June–September), post-monsoon (October–November), and winter (December–February) (Salam et al., 2003). Winter is characterized by dry soil conditions, low relative humidity, scanty rainfall and low northwesterly prevailing winds. The rainfall and wind speed become moderately strong and relative humidity increases in the pre-monsoon season when southwesterly (marine) winds prevail. During the monsoon season, the wind speed increases further and the air mass is purely marine in nature. In the post-monsoon season, the rainfall and relative humidity decrease as well as the wind speed. The direction starts shifting back to northeasterly. The meteorological data used in this study was obtained from a local meteorological station, located about 5 kilometers north of the semi-residential site. RESULTS AND DISCUSSION Concentrations
The time series of annual fine PM mass (PM2.5) distributions is presented in Fig. 2. The top and bottom of each box represent the 25th and 75th percentiles, respectively. The error bars denote the 5th and 95th percentiles, and values below or above these values are shown as points. Figs. 3 and 4 show the time series of the major climate-forcing aerosol species measured in this study, BC and S. The 24-hour and annual average Bangladesh National Ambient Air Quality Standards (NAAQS) of 65 µg m–3 and 15 µg m–3, respectively, are depicted with lines in Fig. 2. Table 1 shows the average mass, black carbon and elemental concentrations with standard deviations. PM and BC concentrations (Figs. 2 and 3) were generally higher prior to 2000 followed by a decline of a factor of ~2 in the median value for PM2.5 and ~2.5 for BC. Then relatively constant values were found from 2005 to 2015 with anomalously low values in 2012. The reason(s) for the lower values in 2012 are not known. During the period beginning in 2003, there was a substantial rise in vehicles on the roads (Begum et al., 2011a). However, the shift from gasoline to CNG appears to have compensated for the rise in the number of vehicles.
BC and S concentrations have largely varied in proportion to the PM2.5 concentrations. BC declined after 2000 that was likely due in part to the removal of lead from gasoline (Biswas et al., 2003). S shows a more complex pattern with a reduction from 2000 to 2004, a rise until 2008, constant values through 2011 and relatively low values from 2012 to 2015. The transition of heavy-duty vehicles to CNG is likely to have driven the decline in sulfate. Diesel fuel in Bangladesh as in much of southeastern Asia contained up to 5000 ppm sulfur and thus represented a source of primary sulfate (Santoso et al., 2008). There will be some primary sulfate emitted by diesel vehicles burning oil containing high concentrations of S and from the coal combustion used to produce bricks that can result in smoldering conditions (low temperature, < 630°C) combustion that would result in emission of SO3.

Begum and Hopke, Aerosol and Air Quality Research, 19: 118–128, 2019 121
Date
1995 2000 2005 2010 2015
Con
cent
rati
on ( g
/m3 )
0
50
100
150
200Annual NAAQS, 15 mg/m3
24-hour NAAQS, 65 g/m3
Fig. 2. Time series plot of the distributions (Box-whisker) of fine particulate matter concentration.
Fig. 3. Time series plot of the distributions (Box-whisker) of black carbon concentration.
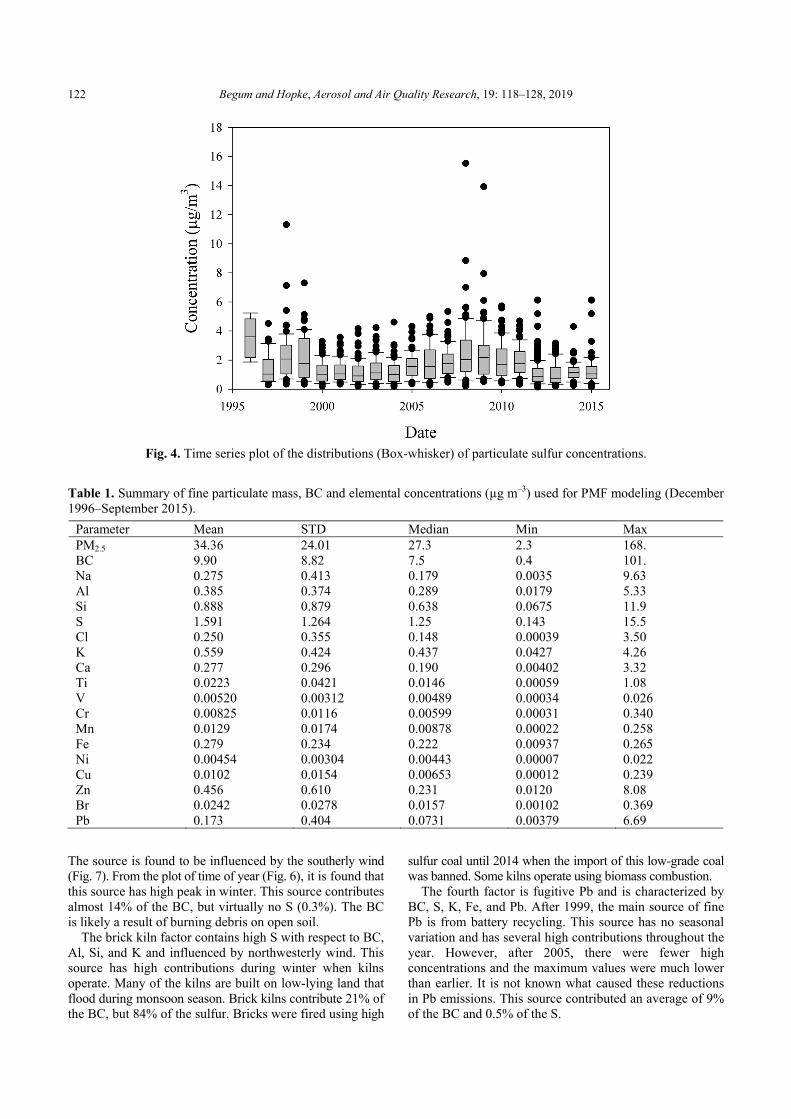
Source Identification and Apportionment Using PMF, the best solution included eight factors for
elemental compositions for fine particulate matter fraction at the SR site (Table 2) based on the examination of the scaled residuals and the interpretability of the resulting source profiles (Fig. 5). The identified source profiles are wood burning, soil dust, brick kiln, fugitive Pb, road dust, Zn source, motor vehicle and sea salt as presented in Fig. 5. Figs. 6 and 7 represent the time series plots of the estimated daily contribution from each of the sources and the relationship of source contribution with wind direction as depicted by the CPF plots, respectively.
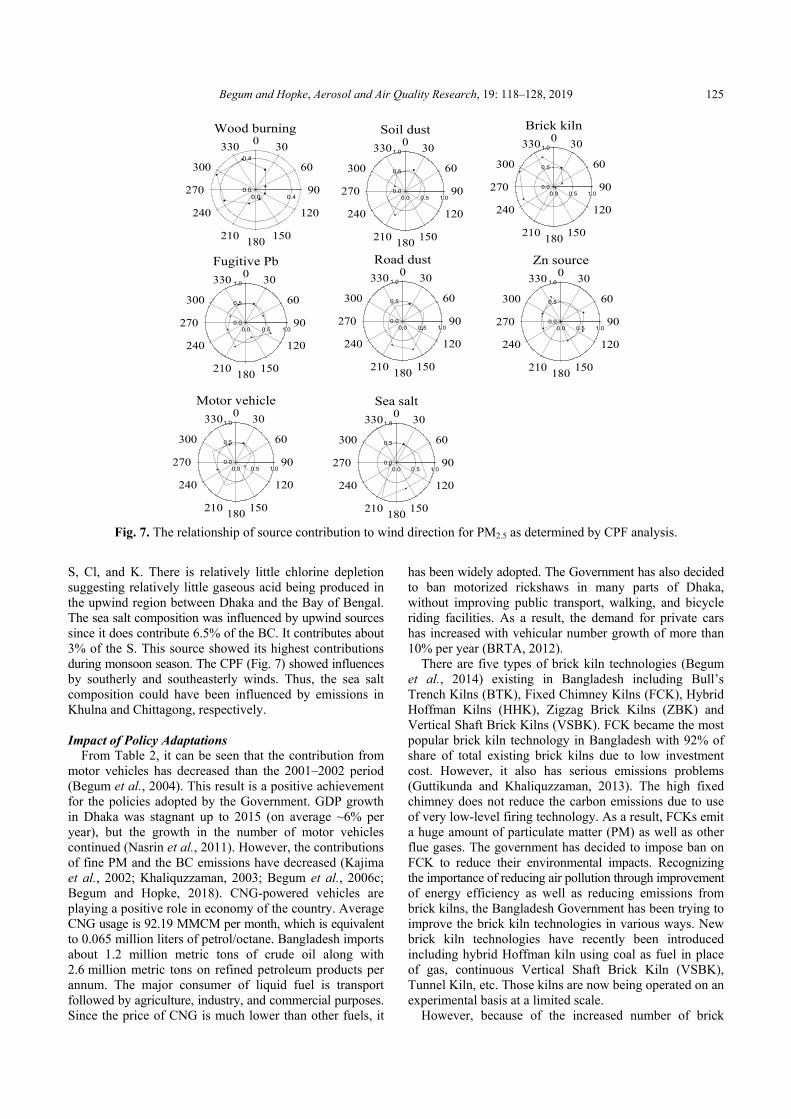
The first factor is biomass burning and is characterized by BC, Si, S, K, and Ca (Fig. 5). The source is found to be influenced by northwesterly winds (Fig. 7). From the plot
of time of year (Fig. 6), it is found that this source has high peak in wintertime. Prior work by Ommi et al. (2017) showed that Dhaka was influenced by biomass burning in India and Nepal, particularly the annual field burning that is conducted to prepare the land for the next planting. Biomass burning is responsible for an average contribution of 29.1% of the observed black carbon concentrations and 4.6% of the sulfate. Wood combustion is not a significant source of sulfur, but it is likely that some sulfate from upwind coal-fired power plants became intermixed while in transit to Dhaka. Further discussion of transported biomass burning aerosol is provided in the subsequent section.
Soil dust is characterized by BC, Al, Si, S, K, Ti, Fe, and Br (Fig. 5). This material may be derived from agricultural lands around the city as well as from construction activities.
Begum and Hopke, Aerosol and Air Quality Research, 19: 118–128, 2019 122
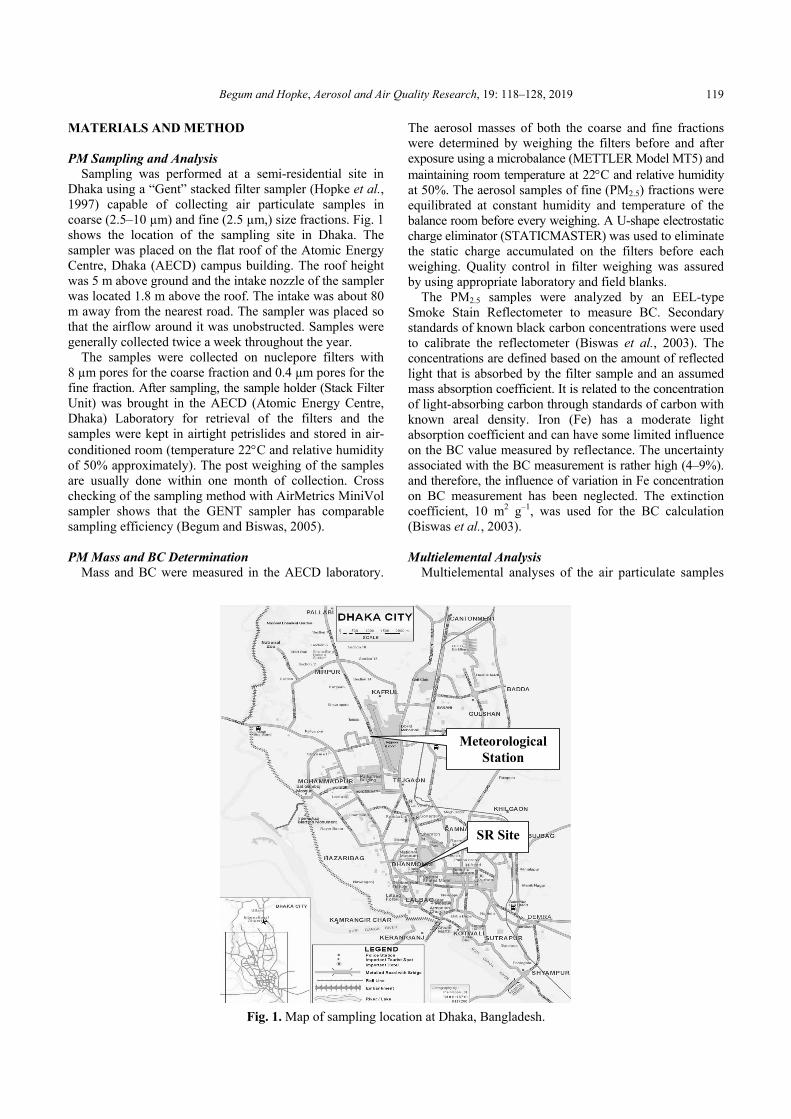
Fig. 4. Time series plot of the distributions (Box-whisker) of particulate sulfur concentrations.
Table 1. Summary of fine particulate mass, BC and elemental concentrations (µg m–3) used for PMF modeling (December 1996–September 2015).
Parameter Mean STD Median Min Max PM2.5 34.36 24.01 27.3 2.3 168. BC 9.90 8.82 7.5 0.4 101. Na 0.275 0.413 0.179 0.0035 9.63 Al 0.385 0.374 0.289 0.0179 5.33 Si 0.888 0.879 0.638 0.0675 11.9 S 1.591 1.264 1.25 0.143 15.5 Cl 0.250 0.355 0.148 0.00039 3.50 K 0.559 0.424 0.437 0.0427 4.26 Ca 0.277 0.296 0.190 0.00402 3.32 Ti 0.0223 0.0421 0.0146 0.00059 1.08 V 0.00520 0.00312 0.00489 0.00034 0.026 Cr 0.00825 0.0116 0.00599 0.00031 0.340 Mn 0.0129 0.0174 0.00878 0.00022 0.258 Fe 0.279 0.234 0.222 0.00937 0.265 Ni 0.00454 0.00304 0.00443 0.00007 0.022 Cu 0.0102 0.0154 0.00653 0.00012 0.239 Zn 0.456 0.610 0.231 0.0120 8.08 Br 0.0242 0.0278 0.0157 0.00102 0.369 Pb 0.173 0.404 0.0731 0.00379 6.69
The source is found to be influenced by the southerly wind (Fig. 7). From the plot of time of year (Fig. 6), it is found that this source has high peak in winter. This source contributes almost 14% of the BC, but virtually no S (0.3%). The BC is likely a result of burning debris on open soil.
The brick kiln factor contains high S with respect to BC, Al, Si, and K and influenced by northwesterly wind. This source has high contributions during winter when kilns operate. Many of the kilns are built on low-lying land that flood during monsoon season. Brick kilns contribute 21% of the BC, but 84% of the sulfur. Bricks were fired using high
sulfur coal until 2014 when the import of this low-grade coal was banned. Some kilns operate using biomass combustion.
The fourth factor is fugitive Pb and is characterized by BC, S, K, Fe, and Pb. After 1999, the main source of fine Pb is from battery recycling. This source has no seasonal variation and has several high contributions throughout the year. However, after 2005, there were fewer high concentrations and the maximum values were much lower than earlier. It is not known what caused these reductions in Pb emissions. This source contributed an average of 9% of the BC and 0.5% of the S.

Begum and Hopke, Aerosol and Air Quality Research, 19: 118–128, 2019 123
Table 2. Average source contributions to PM2.5 derived from the PMF modeling.
Source 2001–2002a 1997–2015
% contribution Mass BC
% contribution Mass BC
(µg m–3) (µg m–3) Motor vehicle 38.2 7.16 2.50 3.94 1.00 0.08 Brick kiln 11.9 2.23 1.37 20.8 5.29 0.13 Metal smelters 10.0 1.87 0.00 - - - Sea salt 1.00 0.19 0.00 6.47 1.65 0.24 Two Stroke/Zn 9.36 1.75 1.11 6.61 1.68 0.35 Soil dust 10.2 1.92 0.0 13.7 3.49 0.05 Road dust 19.4 3.63 1.63 9.96 2.53 0.03 Fugitive Pb - - - 9.39 2.39 0.50 Wood burning - - - 29.1 7.41 3.98 Reconstructed Mass 18.7 6.61 25.4 5.36 Measured Mass 22.1 7.90 34.4 9.90
a Begum et al. (2004).
Sea salt
BC Na Al Si S Cl K Ca Ti V CrMn Fe Ni Cu Zn Br Pb0.001
0.01
0.1
1
Motor Vehicle
0.001
0.01
0.1
1
Zn source
0.001
0.01
0.1
1
Road Dust
0.001
0.01
0.1
1
Fugitive Pb
Ele
men
tal c
once
ntra
tion
0.001
0.01
0.1
1
Brick kiln
0.001
0.01
0.1
1
Wood burning
BC Na Al Si S Cl K Ca Ti V Cr Mn Fe Ni Cu Zn Br Pb
0.001
0.01
0.1
1
Soil dust
0.001
0.01
0.1
1
Fig. 5. PM2.5 source compositions derived from the PMF analysis.
Begum and Hopke, Aerosol and Air Quality Research, 19: 118–128, 2019 124
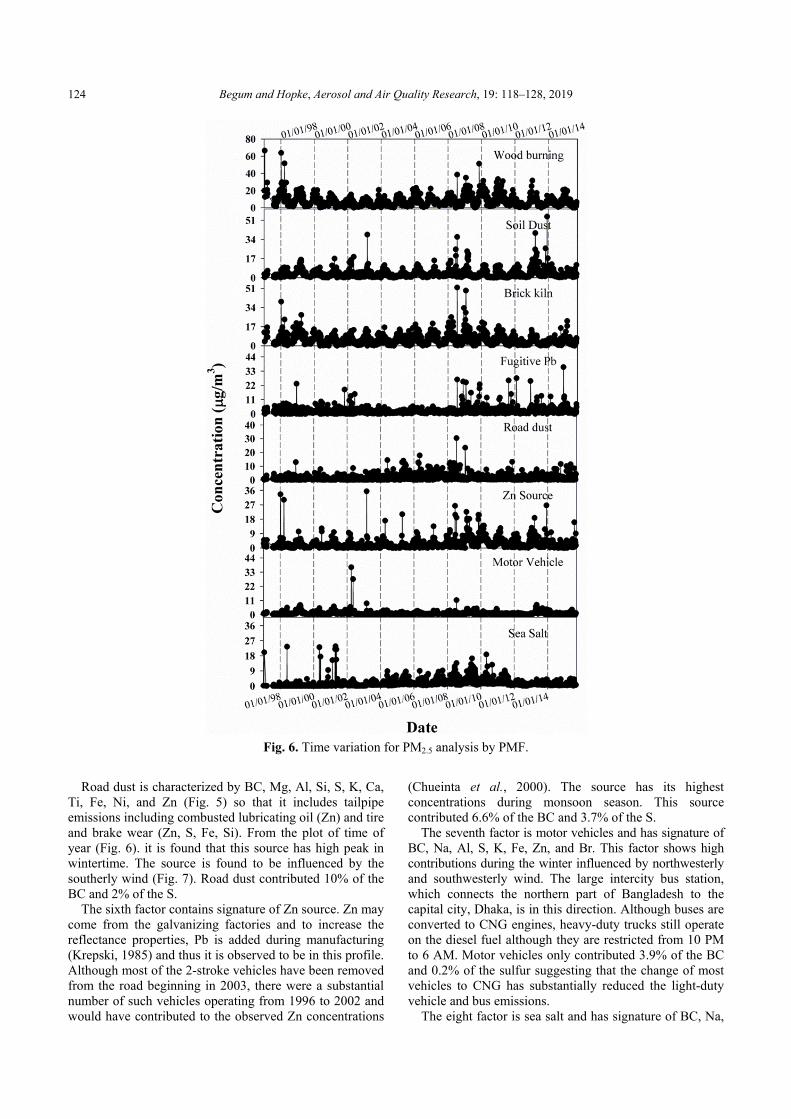
Fig. 6. Time variation for PM2.5 analysis by PMF.
Road dust is characterized by BC, Mg, Al, Si, S, K, Ca, Ti, Fe, Ni, and Zn (Fig. 5) so that it includes tailpipe emissions including combusted lubricating oil (Zn) and tire and brake wear (Zn, S, Fe, Si). From the plot of time of year (Fig. 6). it is found that this source has high peak in wintertime. The source is found to be influenced by the southerly wind (Fig. 7). Road dust contributed 10% of the BC and 2% of the S.
The sixth factor contains signature of Zn source. Zn may come from the galvanizing factories and to increase the reflectance properties, Pb is added during manufacturing (Krepski, 1985) and thus it is observed to be in this profile. Although most of the 2-stroke vehicles have been removed from the road beginning in 2003, there were a substantial number of such vehicles operating from 1996 to 2002 and would have contributed to the observed Zn concentrations
(Chueinta et al., 2000). The source has its highest concentrations during monsoon season. This source contributed 6.6% of the BC and 3.7% of the S.
The seventh factor is motor vehicles and has signature of BC, Na, Al, S, K, Fe, Zn, and Br. This factor shows high contributions during the winter influenced by northwesterly and southwesterly wind. The large intercity bus station, which connects the northern part of Bangladesh to the capital city, Dhaka, is in this direction. Although buses are converted to CNG engines, heavy-duty trucks still operate on the diesel fuel although they are restricted from 10 PM to 6 AM. Motor vehicles only contributed 3.9% of the BC and 0.2% of the sulfur suggesting that the change of most vehicles to CNG has substantially reduced the light-duty vehicle and bus emissions.
The eight factor is sea salt and has signature of BC, Na,
Begum and Hopke, Aerosol and Air Quality Research, 19: 118–128, 2019 125
Fig. 7. The relationship of source contribution to wind direction for PM2.5 as determined by CPF analysis.
S, Cl, and K. There is relatively little chlorine depletion suggesting relatively little gaseous acid being produced in the upwind region between Dhaka and the Bay of Bengal. The sea salt composition was influenced by upwind sources since it does contribute 6.5% of the BC. It contributes about 3% of the S. This source showed its highest contributions during monsoon season. The CPF (Fig. 7) showed influences by southerly and southeasterly winds. Thus, the sea salt composition could have been influenced by emissions in Khulna and Chittagong, respectively. Impact of Policy Adaptations
From Table 2, it can be seen that the contribution from motor vehicles has decreased than the 2001–2002 period (Begum et al., 2004). This result is a positive achievement for the policies adopted by the Government. GDP growth in Dhaka was stagnant up to 2015 (on average ~6% per year), but the growth in the number of motor vehicles continued (Nasrin et al., 2011). However, the contributions of fine PM and the BC emissions have decreased (Kajima et al., 2002; Khaliquzzaman, 2003; Begum et al., 2006c; Begum and Hopke, 2018). CNG-powered vehicles are playing a positive role in economy of the country. Average CNG usage is 92.19 MMCM per month, which is equivalent to 0.065 million liters of petrol/octane. Bangladesh imports about 1.2 million metric tons of crude oil along with 2.6 million metric tons on refined petroleum products per annum. The major consumer of liquid fuel is transport followed by agriculture, industry, and commercial purposes. Since the price of CNG is much lower than other fuels, it
has been widely adopted. The Government has also decided to ban motorized rickshaws in many parts of Dhaka, without improving public transport, walking, and bicycle riding facilities. As a result, the demand for private cars has increased with vehicular number growth of more than 10% per year (BRTA, 2012).
There are five types of brick kiln technologies (Begum et al., 2014) existing in Bangladesh including Bull’s Trench Kilns (BTK), Fixed Chimney Kilns (FCK), Hybrid Hoffman Kilns (HHK), Zigzag Brick Kilns (ZBK) and Vertical Shaft Brick Kilns (VSBK). FCK became the most popular brick kiln technology in Bangladesh with 92% of share of total existing brick kilns due to low investment cost. However, it also has serious emissions problems (Guttikunda and Khaliquzzaman, 2013). The high fixed chimney does not reduce the carbon emissions due to use of very low-level firing technology. As a result, FCKs emit a huge amount of particulate matter (PM) as well as other flue gases. The government has decided to impose ban on FCK to reduce their environmental impacts. Recognizing the importance of reducing air pollution through improvement of energy efficiency as well as reducing emissions from brick kilns, the Bangladesh Government has been trying to improve the brick kiln technologies in various ways. New brick kiln technologies have recently been introduced including hybrid Hoffman kiln using coal as fuel in place of gas, continuous Vertical Shaft Brick Kiln (VSBK), Tunnel Kiln, etc. Those kilns are now being operated on an experimental basis at a limited scale.
However, because of the increased number of brick
Wood burning
0.0 0.40.0
0.4
90
60
300
330
300
270
240
210180
150
120
Soil dust
0.0 0.5 1.00.0
0.5
1.0
90
60
300
330
300
270
240
210180
150
120
Brick kiln
0.0 0.5 1.00.0
0.5
1.0
90
60
300
330
300
270
240
210180
150
120
Fugitive Pb
0.0 0.5 1.00.0
0.5
1.0
90
60
300
330
300
270
240
210180
150
120
Road dust
0.0 0.5 1.00.0
0.5
1.0
90
60
300
330
300
270
240
210180
150
120
Motor vehicle
0.0 0.5 1.00.0
0.5
1.0
90
60
300
330
300
270
240
210180
150
120
Sea salt
0.0 0.5 1.00.0
0.5
1.0
90
60
300
330
300
270
240
210180
150
120
Zn source
0.0 0.5 1.00.0
0.5
1.0
90
60
300
330
300
270
240
210180
150
120

Begum and Hopke, Aerosol and Air Quality Research, 19: 118–128, 2019 126
production industries, emissions from brick kilns have become larger than any other PM source (Begum et al., 2013b). The 1997–2015 data show that emissions from motor vehicles have been reduced in recent years relative to the beginning of this period. Thus, the limited rise in fine PM concentrations indicates that the implemented control actions have helped to balance the increases in pollution that would have been anticipated to parallel the growth in population, economic activity, and vehicles.
Transboundary Impacts
During the winter, the prevailing low-level winds over the northern Indian Ocean are northeasterly while the prevailing low-level winds in the southern Indian Ocean are southerly. These wind patterns transport continental and anthropogenic particulate matter from India, Iraq, Iran, and the Arabian Peninsula across the northern Indian Ocean. To identify the possible source locations of atmospheric aerosols, particulate matter mass concentrations combined with air parcel back trajectories were used to estimate regional source impacts. Fig. 7 in Begum et al. (2011b) showed potential PM source areas in Pakistan, Bangladesh, India, and Sri Lanka. Fig. 2 in Begum et al. (2011b) showed the time series plot for the fine soil concentrations for all four countries during the study period. There was a high soil concentration of 38 µg m–3 on 5 March 2003 in Bangladesh (Fig. 6). Air masses could be traced through Iran, Afghanistan, and Pakistan. For Bangladesh and India, the air mass traversed the same route and then moved on to Sri Lanka.
In winter, it is common for a thick river of haze to cover the Indo-Gangetic Plain, including northern India and Bangladesh. The Moderate Resolution Imaging Spectroradiometer (MODIS) on NASA’s Aqua satellite captured this image of haze hugging the Himalayas and spilling out into the Ganges Delta and Bengal Sea in January 2013. This situation can be observed almost every year (Supplemental Figs. S2–S3). The haze represents a combination of urban and industrial pollution, and agricultural fires enhanced by regional temperature inversions. Alpert et al. (2012) found that levels of air pollution in large Indian cities increased at some of the fastest rates in the world between 2002 and 2010, even faster than the rapidly growing cities in China (https://earthobservatory.nasa.gov/ blogs/earthmatters/2017/02/08/the-crop-residue-fires-in-no rthern-india). Many Indian cities recorded double-digit increases in particulate pollution over the study period. Calcutta, the third-most populous city in India, saw an 11.5 percent increase in pollution; Bangalore had the largest increase of any Indian city: 34 percent. The Alpert study was based on information collected by MODIS and by the Multi-angle Imaging SpectroRadiameter (MISR) on NASA’s Terra satellite. The haze is seen from the southern edge of the Himalaya Mountains southward over the Bay of Bengal every year (Begum et al., 2013a). The duration of this haze varies from country to country, but it can often be observed from early December to early March. The haze, mostly a mixture of urban and industrial pollution (Begum et al., 2011b; Ommi et al., 2017) often collects at
the base of the mountains in winter. This cloud of haze that frequently lingers over parts of Asia from Pakistan to China and even the Indian and Pacific Oceans has been called the “Asian Brown Cloud.” The brownish haze consists of a 3 km thick mixture of anthropogenic sulfate, nitrate, organics, black carbon, dust and fly ash particles, and natural aerosols such as sea salt and mineral dust. The brownish color is due to the absorption and scattering of solar radiation by anthropogenic black carbon, fly ash, part of the soil dust and NO2 (Ramanathan et al., 2003). CONCLUSIONS
With the help of the International Atomic Energy Agency (IAEA), PM and BC monitoring started in Dhaka in December 1996. The Government of Bangladesh has implemented policies to improve air quality in Dhaka; however, the PM concentrations are still well above the globally accepted health-based guidelines and the Bangladesh NAAQS. Despite continuing efforts to reduce emissions, recent monthly average data available from the Clean Air and Sustainable Environment program of the Bangladesh Department of Environment (http://case.doe.gov.bd/index. php?option=com_wrapper&view=wrapper&Itemid=12) and the hourly PM2.5 values measured at the U.S. Embassy in Dhaka (www.airnow.gov/index.cfm?action=airnow.global _summary#Bangladesh$Dhaka) show that high PM2.5 concentrations continue to be observed during the pre-monsoon and winter seasons. During these periods, winds blow from the north and northwest such that local air pollution is enhanced by transboundary contributions. Both the PM and BC concentrations are low during the rainy season, when the wind blows from the south and southeast off the Bay of Bengal. Thus, meteorology coupled with local and transboundary transported pollutants are major driver of high PM2.5 concentrations in Dhaka, Bangladesh.
ACKNOWLEDGEMENT
The work is financially supported partly by the RCA/IAEA. The authors thankfully acknowledge this assistance. The sampling and analyses of Dhaka PM was initiated by Drs. Md. Khaliquzzaman and S.K. Biswas (ex-scientists of AECD, BAEC) and we want to thank them for starting this important monitoring program. SUPPLEMENTARY MATERIAL
Supplementary data associated with this article can be found in the online version at http://www.aaqr.org. REFERENCES Alpert, P., Shvainshtein, O. and Kishcha, P. (2012). AOD
trends over megacities based on space monitoring using MODIS and MISR. Clim. Change 1: 117–131.
Ashbaugh, L.L., Malm, W.C. and Sadeh, W.Z. (1985). A residence time probability analysis of sulfur concentrations at Ground Canyon National Park. Atmos. Environ. 19:
Begum and Hopke, Aerosol and Air Quality Research, 19: 118–128, 2019 127
1263–1270. Begum, B.A., Kim, E., Biswas, S.K. and Hopke, P.K.
(2004). Investigation of sources of atmospheric aerosol at urban and semi-urban areas in Bangladesh. Atmos. Environ. 38: 3025–3038.
Begum, B.A. and Biswas, S.K. (2005). Comparison of PM collection efficiency of Gent and AirMetrics MiniVol Portable Air Sampler. Nucl. Sci. Appl. 114: 79–83.
Begum, B.A., Biswas, S.K., Kim, E., Hopke, P.K. and Khaliquzzaman, M. (2005a). Investigation of sources of atmospheric aerosol at a hot spot area in Dhaka, Bangladesh. J. Air Waste Manage. Assoc. 55: 227–240.
Begum, B.A., Biswas, S.K. and Hopke, P.K. (2005b). Temporal variations and spatial distribution of ambient PM2.2 and PM2.2-10 concentrations in Dhaka, Bangladesh. Sci. Total Environ. 358: 36–45.
Begum, B.A., Jolly, Y.N. and Biswas, S.K. (2006a). Elemental analysis of air particulate matter and application to source fingerprinting. J. Bangladesh Acad. Sci. 30: 85–93.
Begum, B.A., Biswas, S.K., Hopke, P.K. and Cohen, D.D. (2006b). Multi-element analysis and characterization of atmospheric particulate pollution in Dhaka. Aerosol Air Qual. Res. 6: 334–359.
Begum, B.A., Biswas, S.K. and Hopke, P.K. (2006c). Impact of banning of two stroke engines on airborne particulate matter concentrations in Dhaka, Bangladesh. J. Air Waste Manage. Assoc. 56: 85–89.
Begum, B.A., Hossain, A., Saroar, G., Biswas, S.K., Nasiruddin, Md., Nahar, N., Chowdhury, Z. and Hopke, P.K. (2011a). Sources of Carbonaceous Materials in the Airborne Particulate Matter of Dhaka. Asian J. Atmos. Environ. 5: 237–246.
Begum, B.A., Biswas, S.K., Pandit, G.G., Saradhib, I.V., Waheed, S., Siddiquec, N., Seneviratne, M.C.S., Cohen, D.D., Markwics, A. and Hopke, P.K. (2011b). Long range transport of soil dust and smoke pollution in the south Asian region. Atmos. Pollut. Res. 2: 151–157.
Begum, B.A. and Hopke, P.K. (2013a). Identification of haze creating sources from fine particulate matter in Dhaka aerosol using carbon fractions data. J. Air Waste Manage. Assoc. 63: 1046–1057.
Begum, B.A., Hopke, P.K. and Markwitz, A. (2013b). Air pollution by fine particulate matter in Bangladesh. Atmos. Pollut. Res. 4: 75–86.
Begum, B.A., Nasiruddin, M., Randal, S., Sivertsen, B. and Hopke, P.K. (2014). Identification and apportionment of sources from air particulate matter at urban environments in Bangladesh. British J. Appl. Sci. Technol. 4: 3930–3955.
Begum, B.A. and Hopke, P.K. (2018). Ambient air quality in Dhaka Bangladesh over two decades: Impacts of policy on air quality Aerosol Air Qual. Res. 18: 1910–1920.
Biswas, S.K., Tarafdar, S.A., Islam, A., Khaliquzzaman, M., Tervahattu, H. and Kupiainen, K. (2003). Impact of unleaded gasoline introduction on the concentration of lead in the air of Dhaka, Bangladesh. J. Air Waste Manage. Assoc. 53: 1355–1362.
BRTA (Bangladesh Road Transport Authority) (2012).
www.brta.gov.bd. Chueinta, W., Hopke, P.K. and Paatero, P. (2000).
Investigation of source of atmospheric aerosol at urban and suburban residential areas in Thailand by Positive Matrix Factorization. Atmos. Environ. 34: 3319–3329.
Guttikunda, S.K. and Khaliquzzaman, M. (2013). Health benefits of adapting cleaner brick manufacturing technologies in Dhaka, Bangladesh. Air Qual. Atmos. Health 7: 103–112
Hopke, P.K., Xie, Y., Raunemaa, T., Biegalski, S., Landsberger, S., Maenhaut, W., Artaxo, P. and Cohen, D. (1997). Characterization of Gent stacked filter unit PM10 sampler. Aerosol Sci. Technol. 27: 726–735.
Hopke, P.K. (2016a). Case studies of source apportionment from north America. In Airborne particulate matter: Sources, atmospheric processes and health, Harrison, R.M., Hester, R.E. and Querol, X. (Eds.), The Royal Society of Chemistry, London, pp. 126–167.
Hopke, P.K. (2016b). Review of receptor modeling methods for source apportionment. J. Air Waste Manage. Assoc. 66: 237–259.
Kajima, M., Bacon, R.W., Shah, J., Mainkar, M.S., Chaudhari, M. K., Bhanot, B., Iyer, N.V., Smith, A. and Atkinson, W.D. (2002). Measurement of mass emissions from In-use two stroke engine three-wheelers in South Asia. SAE Technical Paper 2002-01-1681.
Khaliquzzaman, M. (2003). An assessment of the impact of removal of baby taxis on air quality in Dhaka. Personal Communication, Consultant, World Bank, Dhaka Office.
Khaliquzzaman, M., Biswas, S.K., Tarafdar, S.A., Islam, A. and Khan, A.H. (1995). Background air pollution studies in urban and rural areas in Bangladesh. Appendix 3, International Atomic Energy Agency (IAEA), p. 8.
Khaliquzzaman, M., Tarafdar, S.A., Biswas, S.K., Islam, A. and Khan, A.H. (1999). Nature and the extent of airborne particulate matter pollution in Urban and Rural areas of Bangladesh during 1993-98. Technical report. AECD/AFD-CH/9-50.
Khan, A. H., Khaliquzzaman, M., Zaman, M. B., Hussain, M., Abdullah, M. and Akhter, S. (1980). Trace element composition of blood in adult population in Bangladesh. J. Radioanal. Nucl. Chem. 56: 157–167.
Kim, E., Larson, T.V., Hopke, P.K., Slaughter, C., Sheppard, L.E. and Claiborne, C. (2003). Source identification of PM2.5 in an arid northwest U.S. city by positive matrix factorization. Atmos. Res. 66: 291–305.
Krepski, R.P. (1985). The influence of lead in after-fabrication hot dip galvanizing, 14th International Galvanizing Conference (Intergalva'85). Munich.
Landsberger, S. and Creatchmam, M. (1998). Elemental analysis of airborne particles, Boca Raton, CRC Press, Inc., FL.
Maxwell, J.A., Campbell, J.L. and Teesdale, W.J. (1989). The Guelph PIXE software package. Nucl. Instrum. Methods B 43: 218–230.
Maxwell, J.A., Teesdale, W.J. and Campbell, J.L. (1995). The Guelph PIXE software package II. Nucl. Instrum. Methods B 95: 407–421.
Nasrin, S., Bunker, J.M. and Miska, M. (2011). Factor
Begum and Hopke, Aerosol and Air Quality Research, 19: 118–128, 2019 128
effecting motor vehicle growth in Dhaka, 1st International Conference & Exhibition of Woman Engineer, 20–22 November, 2011, Bukit Gambang Resort City, Kuantan, Pahang.
Ommi, A., Emami, F., Zikova, N., Hopke, P.K. and Begum, B.A. (2017). Trajectory-based models and remote sensing for biomass burning assessment in Bangladesh. Aerosol Air Qual. Res. 17: 465–475.
Paatero, P. (1997). Least squares formulation of robust non-negative factor analysis. Chemom. Intell. Lab. Syst. 37: 23–35.
Paatero, P., Hopke, P.K., Begum, B.A. and Biswas, S.K. (2005). A graphical diagnostic method for assessing the rotation in factor analytical models of atmospheric pollution. Atmos. Environ. 39: 193–201.
Paatero, P., Hopke, P.K., Song, X.H. and Ramadan, Z. (2002). Understanding and controlling rotations in factor analytic models. Chemom. Intell. Lab. Syst. 60: 253–264.
Polissar, A.V., Hopke, P K., Paatero, P., Malm, W.C. and
Sisler, J.F. (1998). Atmospheric aerosol over Alaska 2. Elemental composition and sources. J. Geophys. Res. 103: 19045–19057.
Ramanathan, V. and Ramana, M.V. (2003). Atmospheric brown clouds: Long range transport and climate impacts. EM December 2003, pp. 28–33.
Salam, A., Bauer, H., Kassin, K., Ullah, S.M. and Puxbaum, H. (2003). Aerosol chemical characteristics of a mega-city in Southeast Asia (Dhaka, Bangladesh). Atmos. Environ. 37: 2517–2528.
Santoso, M., Hopke, P.K., Hidayat, A. and Dwiana, L.D. (2008). Sources identification of the atmospheric aerosol at urban and suburban sites in Indonesia by positive matrix factorization. Sci. Total Environ. 397: 229–238.
Received for review, December 28, 2017 Revised, June 18, 2018
Accepted, June 18, 2018