identification of susceptible areas for the … (manilkara zapota, achras zapota), star apple...
TRANSCRIPT
Identification of Susceptible Areas for the Establishment of Anastrepha spp. Fruit Flies in the United States and Analysis of Selected Pathways
Sequeira, R., Millar, L. and Bartels, D. 2001.
Identification of Susceptible Areas for the Establishment of Anastrepha spp. Fruit Flies in
the United States and Analysis of Selected Pathways
Index
I. Executive Summary II. Introduction II.A. Distribution of Anastrepha Fruit Flies in North America III. Approach and Methods IV. Analysis of Results IV.A. Epidemiological Analysis
IV.A.1.Description of the Resource at Risk Distribution of fruit Phenology of fruit IV.A.2. Analysis of Climatological Factors
temperature minima vs. maxima
IV.A.3. Establishment of risk regions Generational potential (phenological models) IV.B. Pathway Analysis IV.B.1. Sampling Analysis IV.B.2. Maximum Pest Limit Approach V. Discussion
VI. Conclusions and Recommendations VII. Acknowledgements and External Peer Review VIII. References IX. Contacts
1
Identification of Susceptible Areas for the Establishment of Anastrepha spp. Fruit Flies in
the United States and Analysis of Selected Pathways
I. Executive Summary
This document reviews the risk associated with Anastrepha spp., especially in relation to these pests as they occur in United States fruit imports from Mexico. It focuses on the likelihood that Anastrepha ludens (“Mexfly”), A. serpentina, A. striata and A. fraterculus become established in the United States due to the avocado pathway. The study is motivated by U. S. grower concerns that existing and proposed changes in avocado import patterns will pose increased risks to American productivity and profitability.
Our approach was to examine the resource at risk (distribution of commercial fruit production), to characterize host susceptibility (timing and location of susceptible fruit), to characterize climatology, and to study pest reproduction potential as a function of the previous factors. This approach can be characterized as an epidemiological analysis where we investigated the correspondence between appropriate climate, appropriate hosts in susceptible conditions, existence of damaging Anastrepha spp. populations, and enough time for the key simultaneous interactions to take place.
Finally, we studied the avocado pathway as a case study for fruit imports. The analysis studied the risks associated with imports of this commodity. We used the evidence from ongoing observations (sampling) and those that have been recorded since the initiation of the avocado export program-one which includes a multi-tactic “systems approach”- to determine the probability that existing populations are getting through undetected along this pathway.
Epidemiologically, we show that a combination of a poor to inadequate host with marginal developmental conditions leads to low field densities, especially when associated with the much less preferred avocado crop (Hass cultivar). We note that Mexfly favors peaches, citrus, and other species. Statistically, we show that the probability that populations (even very low populations) are going undetected is close to nil. That is, the statistical evidence suggests that if populations were even as low as one Mexfly larva per one hundred thousand fruit, they would be detected with likelihood greater than 95%. Fruit samples (avocado dissections) to date have not detected Mexfly larvae and the data suggests that population densities in fruit shipments are on the order of one infested fruit per million.
The data, our analysis and conclusions about the avocado imports using different approaches all support past findings and the current regulatory expertise. That expertise suggests that the existing populations in Mexico and under the cropping and pest management practices currently in place are too low to be a threat to agriculture in states receiving Mexican avocado exports. However, in contrast to local expertise and heuristics our formal study is repeatable, transparent and will undergo peer review. It is hoped that the findings herein will be useful in better articulating our proposals to our stakeholders.
In summary, available data and our analysis about the potential spread of Mexfly in the United States indicate that the highest likelihood is concentrated in the southern portions of the southern states of Texas, Georgia, South Carolina, Arizona and Louisiana. Most of the production regions in California and Florida are located in areas where establishment is likely. The state of Hawaii showed the highest risk for the establishment of Anastrepha spp. A combination of limited host availability, a short period of climate conducive to Anastrepha spp.
2
development and lethal low temperatures for prolonged periods makes most of the continental United States outside of the Southern States be at low risk from these species. II. Introduction
The tephritid fruit flies of the genus Anastrepha are amongst the most destructive fruit pests in tropical and subtropical regions. Further, “Anastrepha is considered a major threat to the fruit growing industry in almost every country in the world” (Aluja, 1994). Anastrepha flies are endemic to the New World and are restricted to tropical and subtropical climates. They are widespread in Mexico, Central and South America. As Anastrepha spp. are endemic to tropical wet forest habitats, they represent a high risk to similar areas (CABI, 2000). There are seven economically important species: fraterculus, grandis, ludens, obliqua, serpentina, striata, and suspensa (Aluja, 1994). The following document reviews the risk associated with Anastrepha ludens, A. serpentina, A. striata and A. fraterculus as they occur in United States fruit imports from Mexico. It focuses on the likelihood that these four Anastrepha species become established in the United States due to the exported fruit pathway. Previous economic analysis that evaluated the potential impact of the widespread establishment of a single species, A. ludens, estimated the impact in the United States at 927.75 million dollars (Erickson et al., 2000).
The host preference of these fly species is for Sargentia spp., Prunus spp., grapefruit, mango and a number of other cultivated and ‘wild’ fruit (Leyva et al. 1991). Avocado is not a preferred host and some species (notably, the thicker-skinned “Hass” avocado) may be resistant. Oi and Mau (1989) have recorded resistance due to thicker-skinned fruit in the related Mediterranean and Oriental fruit flies.
“The basic life cycle is very similar among all Anastrepha species for which the biology is known” (Aluja, 1994), which includes A. ludens, A. serpentina, A. striata, and A. fraterculus. Anastrepha females lay their eggs below the skin of the host fruit (CABI, 2000). “In the majority of species, the females deposit their eggs in the epi- or mesocarp region of ripening host fruit” (Aluja, 1994). “Depending on the species, eggs are laid singly or in clutches” (Aluja, 1994). The larvae feed on the fruit and go through three instars, and then they leave the fruit to pupate in the soil (CABI, 2000; Aluja, 1994). Larvae can sometimes also pupate inside the host fruit (Aluja, 1994). After emergence and before becoming sexually active, adults go through a period of feeding on carbohydrates and water to survive and on protein sources to allow for gonad maturation (Christenson and Foote, 1960).
“The most important abiotic mortality factors regulating population dynamics are water and temperature. Too much or too little water causes both immatures and adults to die. Pupal desiccation in dried soil appears to be a major mortality factor” (Aluja, 1994).
Adult populations in commercial orchards exhibit strong fluctuations from year to year, and these fluctuations appear to be correlated with two factors: availability of host plants and climatic factors (especially rainfall) (see references in Aluja, 1994).
Means of Movement and Dispersal: “There is evidence that adults of Anastrepha spp. can fly for as far as 135 km” (Fletcher, 1989). A. ludens is reported to fly ~135 km from breeding sites in Mexico to arrive at citrus groves in southern Texas (McAlister and Clore, 1941; Christenson and Foote, 1960). Also, A. ludens was trapped up to 36 km from a release site (Shaw et al, 1967). Therefore natural movement can be an important means of spread. However, Aluja (1994) emphasizes that wind affects the displacement of the flies and that overall fly mobility is low. “In international trade, the major means of dispersal to previously uninfested areas is the transport of fruit containing live larvae. There is also a risk from the
3
transport of puparia in soil or packaging with plants which have already fruited.” (CABI, 2000). In 1941 McAlister and Clore wrote, “…there is little doubt that the Mexican fruitfly is capable and has definitely the fixed habit of moving over considerable distances from its primary host reservoirs, the problem of determining how and where the insect maintains itself during the late summer and fall months apparently applies both to the Sargentia in northeastern Mexico and to the citrus groves in the United States.” That comment is still applicable today. Anastrepha serpentina:
Anastrepha serpentina (dark fruit fly, sapodilla fruit fly, sapote fruit fly, black fruit fly) is an important pest in Mexico as its larvae infest sapote (Calocarpum spp.), sapodilla (Achras zapota), willowleaf lucuma (Lucuma salicifolia) and related fruits (Weems, 1969). The preferred food plants are members of the family Sapotaceae (Weems, 1969; Foote et al., 1993). A. serpentina was the dominant species in Sapotaceae in Costa Rica (Jiron and Hedstrom, 1988). According to a previous pest risk assessment, preferred hosts of A. serpentina are sapodilla (Manilkara zapota, Achras zapota), star apple (Chrysophyllum cainito), mamey (Calocarpum sapota), and Lucuma spp. (Lightfield, 1986). According to the 2000 CABI Compendium, the primary hosts of A. serpentina are Citrus, caimito (Chrysophyllum cainito), and sapodilla (Manilkara zapota). Avocado (Persea americana) is listed as a secondary host by CABI (2000). Plus, the USDA-ARS has reared A. serpentina in numbers from avocados collected in the field in Mexico (Miller, 1995).
“Females may oviposit up to 600 eggs in about 1 ½ months. Mature green fruits apparently are preferred. Females have been observed to continue oviposition over periods extending from 21 to 29 weeks under laboratory conditions.” (Weems, 1969)
In studies by Baker (1944), the optimum temperature for the longevity of A. serpentina adults was around 20 oC, and the optimum temperature for the number of eggs laid was 30 oC. These studies tested the following temperatures: 10, 15, 20, 25, 30, and 35 oC. The high (35 oC) and low (10 oC) temperatures were found to be “predominantly lethal factors.” The intermediate temperatures (15, 20, 25, and 30 oC) were temperatures to which normal activity was adjusted. In another study (Shaw, 1946) looking at the effect of temperature on the immature stages of A. serpentina, the temperatures of 20, 25, and 30 oC were considered to be optimal for larval survival. Eggs hatched at temperatures ranging from 15 to 32.5 oC, with the highest percent hatch occurring at 30 oC. The data indicated that the lower limit of development for both larvae and eggs is between 10 and 15 oC. No egg hatching occurred at 10 oC, and no first instars attained the second instar at 10 oC. As for the upper temperature limit, no egg hatching occurred at 35 oC and no larvae survived at 37.8 oC. Anastrepha striata: Anastrepha striata (the guava fruit fly) is “not considered to be of primary economic importance, although it often is abundant and may be highly destructive to dooryard plantings of some tropical fruits” (Weems, 1982).
It’s reported host range is not as large as that of A. serpentina, ludens, and fraterculus. Guava (Psidium guajava) is the preferred food host (Weems, 1982; CABI, 2000). Secondary hosts include, among others: other Psidium species, peach (Prunus persica), cassava (Manihot esculenta), mango (Mangifera indica), Citrus, rose apple (Syzygium jambos), Singapore almond (Terminalia catalpa), Spondias sp., and avocado (Persea americana) (CABI, 2000).
From Miller (1995): “This pest was reported to attack avocado fruit by Oakley (1950). Current papers (Wasbauer, 1972; Norrbom and Kim, 1988) do not list avocado as a host. Since
4
these current papers are considered comprehensive, the Oakley report may be questionable. The Oakley paper cited a 1936 publication by Ballou as his only source. This review discovered that Jiron and Hedstrom (1988) found that A. striata survives year round on the Caribbean slopes of Costa Rica by shifting among several hosts including avocado (Persea Americana). Thus, we can assume that avocado is a valid field host for this pest.” From CABI, 2000: “There is little specific information available on the biology and ecology of A. striata…Females of A. striata take about 15 days to mature (Ramirez-Cruz et al., 1996). Emergence is mostly in the morning and oviposition in the middle of the day. The mean clutch size is 1.5 (Aluja et al., 1993).”
Both cold temperature (18 oC) and high temperature (28 oC) caused significant effects on the surviving rate and the general activities of adult A. striata (Neilson, 1989).
Anastrepha fraterculus:
Anastrepha fraterculus is polyphagous (Aluja, 1994) and is an important pest of guavas (and locally significant Myrtaceae) and mangoes, and to some extent of Citrus and Prunus spp. (Hernandez-Ortiz, 1992; White and Elson Harris, 1992). “In most of South America it probably is the most important species of Anastrepha” (Weems, 1980). “Despite its importance it has no accepted common name” (Weems, 1980). A. fraterculus “exhibits greater morphological variation than related species.” (Aluja, 1994). “According to several authors, it represents an unresolved complex of cryptic species” (see references in Aluja, 1994). Specimens from Trinidad, Panama and northward have been noted as being morphologically different from specimens further south (Stone, 1942). Bush (1962) and Baker (1945) considered, the Mexican form a distinct species from the South American form based on differences in morphology and host utilization. In a recent study, isozyme analysis revealed sharp genetic discontinuities among different A. fraterculus populations (Steck, 1991). “For example, populations from northeastern Brazil, coastal Venezuela, Costa Rica, and Mexico were all very similar. In contrast, populations from southern Brazil, Andean Venezuela, and Peru were genetically distinct from the first group and possibly from each other as well. Steck concludes that there is strong evidence that a complex of cryptic species is included in the nominal species A. fraterculus” (quoted from Aluja, 1994). The Brazilian population is thought to be the true A. fraterculus described by Wiedemann (Weems, 1980).
The preferred hosts of A. fraterculus are Myrtaceae, especially the native American guava (Psidium guajava) (CABI, 2000). Other reported primary hosts are Citrus, Eugenia, stone fruit (Prunus), guava (Psidium guajava), and Syzygium. The Mexican “A. fraterculus” has been reared from peach, guava, and rose apple (Weems, 1980). “Populations of Mexican ‘A. fraterculus’ in northern Mexico occur commonly in the vicinity of Citrus, but no infestation in sour orange or other Citrus has been found in that region” (Weems, 1980). Although Spondias spp. is one of the common hosts of A. fraterculus in South America, attempts to rear the “Mexican” form (from Veracruz) from Spondias were unsuccessful (Baker et al., 1944). Avocado (Persea americana) is listed as one of many secondary hosts by CABI (2000). Miller (1995) reviewed several papers that reported A. fraterculus as a pest of avocado (e.g. Ebeling, 1959; Weems, 1969; Norrbom and Kim, 1988). According to his evaluation of the literature, no record of A. fraterculus from Mexico or Central America has been found associated with avocado fruit. Miller (1995) states, “When the authors reported a location of the infestation, it has been only for Argentina. In fact, Rust (1918) report of A. fraterculus larvae in fruit from northern Argentina may be the only primary host record for this pest attacking avocados and the direct or indirect source for all other reports.”
5
Miller (1995) also states the following: “Several recent projects in Mexico, Guatemala and Costa Rica concerned the collection of fruit and the recovery of fruit flies from that fruit have provided additional information about the host/pest relationship within this genus but no new report of A. fraterculus attacking avocados. In the mid-1950’s, the ARS unit located in Mexico conducted a survey of the avocado areas of Mexico. Although the complete results are not available (no publication has been located except an unpublished March 1956 monthly newsletter and Bush (1957) which gave preliminary results), the following can be said. Avocados were collected from at least 27 growing locations in eight Mexican States (Michoacan, Jalisco, Guanajuato, Queretaro, Veracruz, Hidalgo, Puebla and Chiapas). The numbers of fruit collected at each site varied: 6,743 fruit from one or more locations in Michoacan, 900 fruits from Jungapeo, Michoacan, and 145 fruit from Atlixco, Puebla. They found that the most ideal altitude for collecting infested avocados was between 4,000 and 5,500 ft. They found avocados infested with A. ludens (i.e., flies reared from Michoacan fruit in 1957) and A. serpentina (48 flies recovered in fruit from Tapachula).”
Anastrepha fraterculus have no winter diapause or quiescence in more temperate areas such as southern Brazil (Salles, 1993).
Machado et al. (1995) reports the following lower threshold temperatures for development for the different life stages of A. fraterculus: egg (9.25 oC), larva (10.27 oC), pupa (10.78 oC), and complete life cycle (10.72 oC). These authors report the following degree-days for development for the different life stages: egg (52.25), larva (161.45), pupa (227.79), and complete life cycle (430.58). In a laboratory study using test temperatures between 10 and 35 oC, A. fraterculus larvae did not survive at 10 oC and 35 oC (Salles et al., 1995). In another laboratory study using test temperatures between 5 oC and 45 oC, the life cycle was only completed at 20 oC and 25 oC, with the optimum temperature for fastest development at 25 oC (Salles, 1993). The minimum and maximum temperatures for oviposition were 15-19 oC and 31-35 oC respectively. Anastrepha ludens:
Anastrepha ludens (the Mexican fruit fly or Mexfly) is a serious pest in many regions where it occurs. From Murphy and Coronado (1986): “The [Mexfly] is an important agricultural pest in Mexico and Central America where it readily attacks citrus, mango, and a wide variety of other fruits including avocado. The [Mexfly] annually threatens the citrus plantings along the Rio Grande River in Southern Texas and its possible spread into other regions in the United States is of major concern.”
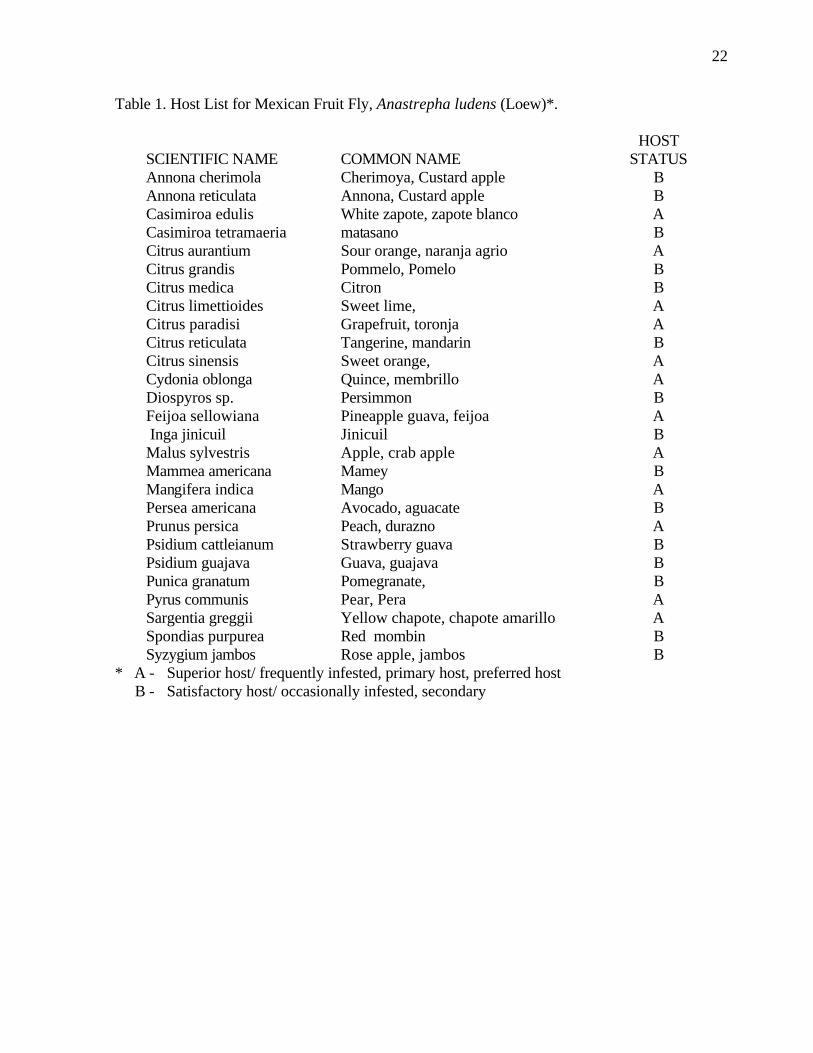
The complete list of hosts considered as key hosts for this study are shown in Table 1 and do not include hosts which have not been confirmed outside of laboratory conditions.
“This species is the only important member of the genus Anastrepha that is subtropical rather than tropical, occupying the northern portion of the range of the genus and extending southward only at the higher altitudes” (Weems, 1963). “A. ludens can withstand freezing weather well, whereas in hot areas it may be killed by the heat of the sun” (Weems, 1963).
The developmental threshold conditions reported for Mexfly include a wide range of temperatures, which allow it to survive even during brief periods of freezing. Leyva-Vazquez (1988) reports an effective lower developmental threshold of 10 oC and suggests that this threshold should be similar for A. striata and A. fraterculus. Hallman (1999) reports that temperatures of 1.1 oC over 11 days resulted in mortalities 99.32% of larvae. Temperatures of oC or below for periods longer than one week are lethal for most stages of Anastrepha occurring in Mexico. High temperature mortality is also reported above 37.7 oC (100 oF) by
6
Flitters and Messenger (1965) and Mangan et al. (1998) notes that temperatures of 45 oC or above are lethal to all stages. Relative humidity is another important factor with dry conditions increasing mortality, especially given dry soil conditions (Aluja, 1994). Optimal humidity is high (70-100%).
An important note is that the taxonomy of A. fraterculus (not known to be a pest in avocados) continues to be an unresolved issue at this time. The current knowledge suggests that the “Mexican A. fraterculus” poses considerably less risk than the more aggressive “South American A. fraterculus” (R. Mangan, pers. communication). II.A. Distribution of Anastrepha Fruit Flies in North America Anastrepha serpentina:
This species is reported to have widespread distribution in the following countries: Brazil, Costa Rica, El Salvador, Guatemala, Guyana, Honduras, Mexico, Netherlands Antilles, Nicaragua, Panama, Peru, Suriname, Trinidad and Tobago (CABI, 2000). It is also present in Argentina, Colombia, Dominica, Ecuador, and Venezuela (CABI, 2000). This fly was first trapped in the United States in 1933 in a grapefruit tree near Harlingen, Texas in the Lower Rio Grande Valley (Lightfield, 1986). It has subsequently been trapped with “annual regularity in varying numbers in the Lower Rio Grande Valley, offering ample opportunity to become established in the United States” (Lightfield, 1986). Lightfield (1986) considers it to have never been established in the United States, and the appearance and disappearance of adult populations in Texas remains unexplained (Weems, 1969). Anastrepha striata:
This species is reported to be present in the following countries: Bolivia, Brazil, Colombia, Costa Rica, Ecuador, Guatemala, Guyana, Honduras, Mexico, Netherlands Antilles, Nicaragua, Panama, Peru, Suriname, Trinidad and Tobago, and Venezuela (CABI, 2000). Anastrepha fraterculus:
This species is reported to have widespread distribution in Central America and South America, specifically Ecuador, Paraguay, Uruguay, Trinidad and Tobago (CABI 2000). It is also reported as present in: Argentina, Bolivia, Brazil, Colombia, Costa Rica, Guatemala, Guyana, Panama, Peru, Suriname, and Venezuela; and is reported to have been eradicated in Chile (CABI, 2000). It has restricted distribution in Mexico (CABI 2000; Weems, 1980). Anastrepha ludens:
A. ludens has widespread distribution in Mexico (CABI, 2000), where it is present in high numbers (Aluja et al., 1990). A. ludens is also reported as being present in: Argentina, Belize, Colombia, Costa Rica, El Salvador, Guatemala, Honduras, Nicaragua, and has a restricted distribution in Texas in the Lower Rio Grande Valley (CABI, 2000). Year round trapping in the Lower Rio Grande Valley by USDA APHIS PPQ routinely captures wild Mexfly. However, wild Mexfly captures only occur from November to April. USDA APHIS PPQ in cooperation with the Texas Department of Agriculture and the citrus industry also maintain a sterile release program in the region. Sterile Mexfly from the rearing facility are released over the region throughout the year to reduce the potential for the establishment of Mexfly in the region. Figure 4 (figures and tables located at end of text) describes the geographical distribution as reported by Hernandez-Ortiz (1992) which largely agrees with that
7
reported earlier by Flitters and Messenger (1965). In addition to the distribution in Mexico, figure 4 indicates locations in the United States where historical detections of Mexfly have occurred. Since 1980, A. ludens has been detected 5 times in California and eradicated. USDA and CDFA declared the latest eradication in June of 2000. A. ludens has also been captured in Florida (1934 in Monroe County (the ‘Keys’ and in 1972 in Sarasota County-source: Florida State Collection of Arthropods, Museum of Entomology, Gainesville, FL [curator: Dr. Michael C. Thomas; [email protected]] at http://fsca-dpi.org/). Trappings in Florida are only interceptions; therefore, A. ludens is not considered present in that state (CABI, 2000).
The distribution and taxonomy of other Anastrepha species is less well known as they have been generally considered of lesser risk than A. ludens. Other Anastrepha spp. are not however believed to have a distribution in Mexico beyond that shown for the more cold-tolerant A. ludens.
III. Approach and Methods
Formally, risk analysis implies assessing the likelihood of occurrence of a risk factor, managing this risk, and then communicating the information such that we can better justify our intended management activities.
The assessment of risk is the fundamental component of the overall risk analysis activity. Our study presents evidence related to the risk posed by Anastrepha spp. as they may occur in produce being imported into the United States, with special attention to the risk posed by the avocado pathway.
Note that likelihood of a hazard or risk factor is one component of risk assessment; expected outcome given the occurrence of this hazard is the other component. For the case of Anastrepha spp., the hazard or risk factor is obviously the pest proper. The potential hazard is the establishment of economically damaging Anastrepha spp. populations in the United States through import and other non-monitored pathways. Estimations of outcome given the instantaneous widespread occurrence of Mexfly in the United States have been examined in detail by Erickson et al. (2000). Epidemiological Approach to Assessing Likelihood of Establishment of Anastrepha spp. in the United States
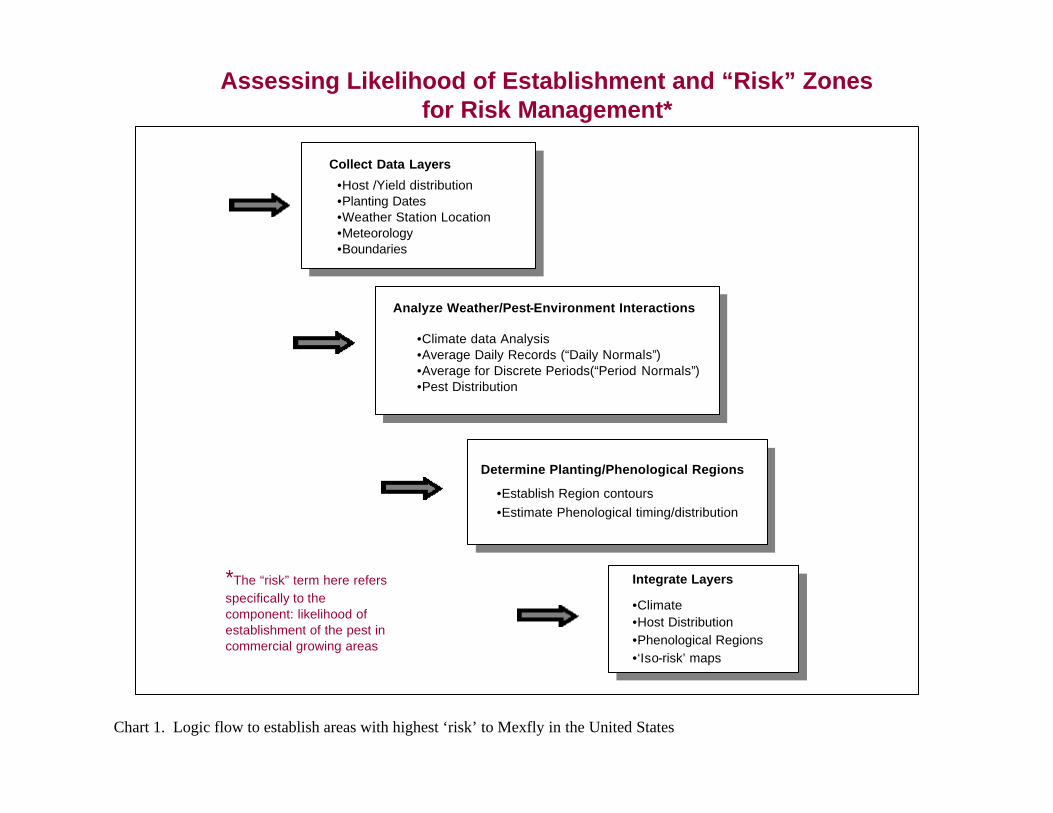
This approach to risk assessment requires consideration of the fundamental notions of epidemiology, which imply that outbreaks of a pest will occur, only when all the following are true: 1. the climatological and other environmental conditions are appropriate for the pest to develop; 2. the host must be present and in a susceptible stage; 3. the pest must be present and capable of damage; 4. there must be enough time to allow for the necessary interactions to take place. In this study we examine each of these components to better ascertain the likelihood that high levels of infestation (enough to cause population establishment in the United States) are associated with known pathways and in all fruit production regions. We assembled climatological, production, and fruit sampling data and used a geographic information systems (GIS) approach to present the different data layers and to investigate spatio-temporal correspondence (that is, the occurrence of all conditions necessary to result in an ‘epidemic’).
The end point of the epidemiological review is a qualitative statement on whether the conditions exist that would be conducive to pest establishment. The approach is summarized in Chart 1.
8
Pathway Analysis for Avocado Imports using a Statistical Approach (estimation of infestation densities and application of the Maximum Pest Limit concept)
When we conduct a risk assessment, sampling data are sometimes available that can help clarify the probability associated with a given component of the overall model. The appropriateness of an overall model or examination of the complete pathway is not the point here. Rather we simply study what is the best statistical distribution to describe the population being sampled for the component of interest. For our case, we are sampling for absence/presence of Anastrepha spp. in avocados, which are selected during post-harvest processing (Miller et al., 1995 and references therein). This kind of sampling distribution can be described with a binomial distribution. When you take repeated samples of presence/absence these are referred to as “Bernoulli” trials.
We now formally describe a binomial distribution and how it can be used to estimate the probability of finding ‘x’ number of insects. The binomial distribution is used in problems with a fixed number of tests or trials, when the outcomes of any trial are only success or failure, when trials are independent, and when the probability of success is constant throughout the experiment. For example, with the binomial distribution you can calculate the probability that two of the next three fruit sampled are infested. The values required to calculate estimates using the binomial distribution are: the number of successes in trials (x), the number of independent trials (n), and the probability of success on each trial (p).
The binomial probability mass function is:
(1)
The endpoint of this analysis includes: 1. an expression of the statistical probability that
the pest is present at different levels, and 2. a ‘maximum pest limit’ expression of acceptable risk.
9
IV. Analysis of Results IV.A. Epidemiological Analysis VI.A.1. Description of the Resource at Risk: distribution and phenology of fruit hosts We examined the epidemiological evidence by first examining the hosts at risk. Figures 1a to 1n (figures located at end of text) summarize our findings (information source: USDA-NASS, 1997 Census of Agriculture). We have included most of the known commercial fruit hosts as well as some cultivated and landscape species (cherries, persimmons, kumquats, loquats, etc) whose status is unknown. Figure 1n summarizes the locations (the smallest divisions represent counties) where commercial fruit production exists in the United States and Hawaii. All of the states in the United States report at least some production of fruit which is a host of Anastrepha spp., as is summarized in figure 1n. Our assessment was thus at a scale that evaluated the entire continental United States and Hawaii, a level of analysis not previously conducted using this approach.
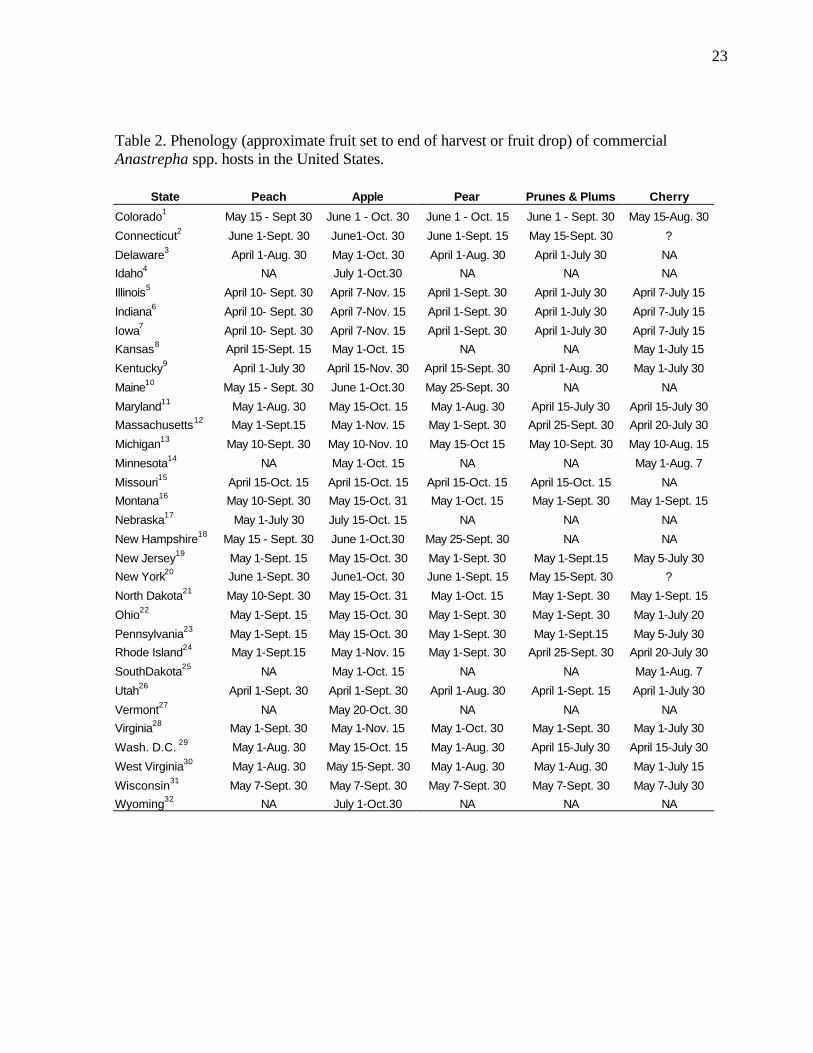
The distribution of hosts is only a partial indication of the resource at risk. However, Celedonio et al. (1995) have noted that for Anastrepha spp. in tropical orchards, fruit availability could be considered the most important environmental factor affecting adult populations. Anastrepha is only capable of attacking susceptible fruit; furthermore it is only able to increase its numbers in the presence of susceptible hosts. We therefore conducted an assessment of the phenological timing of the post-bloom fruit set through last harvest or fruit drop periods for all fruit considered. As is the case for all climate-driven phenomena, fruit tree phenology depends on temperature, moisture, and other abiotic driving variables. In order to incorporate the variability inherent in the fruiting behavior, we obtained estimates of historical phenological ‘windows’ (maximum duration of a given period) for the timing of the phenological stages of interest. The determination of fruit tree phenology was obtained from the sources indicated at the end of Table 2.
Examination of the fruiting patterns show that there are distinct differences in the presence and diversity of susceptible host material in the southern versus the rest of the states in the Union (Figure 2, Table 2). Most of the host diversity is concentrated in the states of Texas, Louisiana, California, Arizona, and Florida (Figure 1). Furthermore, it is only in some of the southern states that we were able to confirm the existence of at least some susceptible fruit year round. This observation is corroborated by expert heuristics: fruit fly scientists (J. Worley, G. Steck, J. Beckwith, J. Leyva-Vazquez) note that the occurrence of citrus species is a good indicator of whether year round fruit availability will enable permanent establishment of tephritids capable of attacking these species (most Anastrepha spp. attack citrus) since fruit that is not harvested (commonly the case in “backyard” citrus trees) often remains attached and exposed on the tree for prolonged periods. The fruiting patterns described in figure 2 were used to characterize the continental United States in two broad regions as shown in figure 3: areas in the south (California, Arizona, Texas, Louisiana, Mississippi, Alabama, Georgia, South Carolina, and Florida) where susceptible fruit may occur year round and the rest of the country where susceptible fruit may be found during the period April 15 to October 30.
This analysis acknowledges that there is a distinct difference in risk posed by different kinds of hosts and their related management regimes. Specifically, managed crops are commonly subjected to regular surveys and insecticidal treatments that keep populations of

10
most insects at low densities. Managed crops are thus likely to sustain low populations of a theoretical population of tephritids.
Another host type likely to harbor low populations is that represented by wild species and ornamental hosts. These hosts do not commonly produce fruit in the large quantities (as contrasted to commercial hosts bred for high productivity). They are also not abundant by the very nature of wild hosts. These kinds of wild hosts are thus considered to be able to harbor low population densities.
Finally, the host that represents some of the highest risk are ‘backyard’ or ‘dooryard’ fruit trees as well as abandoned groves and orchards. Those hosts that are left over from the urbanization of groves (it is common for urban areas to encroach into agricultural lands but retaining high production fruit trees as landscape items) and represent a high risk. They are high risk because they produce high numbers of fruit, are not managed, are not harvested, often present fruit year-round, and are hard to survey and inspect. These kinds of hosts are most common in the states of Florida and California. VI.A.2. Analysis of Climatological Factors
Current climatic trends show that long term historical weather may not be representative of current conditions (e.g., Casti 1991). Coakley and McDaniel (1988) have suggested a minimum of 8 years of historical weather data be used in pest forecasting.
For the characterization of climate for the risk analysis, United States weather records from 1986 to 1997 were summarized for 9,068 weather stations nationwide (these stations include locations in Alaska, Hawaii and Puerto Rico) (source: NOAA-NCDC Cooperative Summary of the Day, Period of Record through 1997). Mexico weather records for 1960 to 1995 were summarized for 5055 weather stations nationwide (source: Instituto Mexicano de Tecnologia del Agua, ERIC I,II). Canada weather records for 1960 to 1990 for some 650 stations were summarized (E. Dobesberger, pers. communication).
A metafile for each of the countries includes geographic reference information (latitude, longitude, and elevation) for all stations. Calculating the daily averages for each station over all years for which records were available produced the key data element used in climatological characterization. Where more than ten years of data were not available for a given station, the available data was used and the average adjusted to reflect available data. The average file was used in the analysis and categorizations described. Whether climatic conditions prevalent in a given region (represented by ten or more years of weather data) are conducive to pest development was determined by evaluating which regions had conditions appropriate for pest development throughout the year. Historical weather data was summarized and isothermic regions were developed for bi-weekly periods. The results of our climatological characterization are shown in figures 5 and figure 6 for temperature maxima and minima.
The weather conditions appropriate for Mexfly include a wide range of temperatures as noted in the introduction. However prolonged periods at very low or very high temperatures will result in mortality of all stages. The figures indicate that in most of the continental United States, prolonged low wintertime temperatures will inhibit permanent establishment. Exceptions to this include most of Florida, Texas, Louisiana, and the southern and/or coastal regions of California, Arizona, North Carolina, South Carolina, Georgia, Alabama, and Mississippi.
11
III.A.3. Establishment of risk regions Another indicator of establishment potential is the number of generations completed by
Mexfly at a given site during periods when fruit is available for continued reproduction. Degree-day models have been previously used to forecast phenological timing but these models have been repeatedly noted (e.g., Wagner et al., 1984, Hagstrum and Leach, 1973; Hagstrum and Milliken, 1991) to overestimate the number of generations for temperatures above a pest’s optimal and to underestimate development at cooler temperatures. One well-known cause for the disparity between degree-day modeling and actual development is the Kaufmann or rate summation effect (Worner 1992). The result is that under field conditions development is faster at lower temperatures and slower at high temperatures than that predicted by the models. In the case of Mexfly and given that fruit is present during the warmer parts of the year; the use of simple degree-day accumulations would result in an overestimation of the number of generations. However, Thomas (1997) cautions that accounting for temperature-driven corrections may not solve the discrepancy.
Thomas (1997) notes that in some Tephritids such as the Mexfly there is a tendency to remain in the fruit beyond the necessary developmental time and that subsequent egression may be spread over a period of weeks. Furthermore, Thomas (1997) did not find that delays observed in larval development were strictly temperature-dependent effects. Thomas states that “accumulated degree days were not a good predictor of larval egress” for Mexfly.
We used a modified approach that includes an intergenerational delay estimated empirically from the data presented by Flitters and Messenger (1965), which was used to calibrate developmental parameters. Specifically, we estimated that based on the 17 locations for which Flitters and Messenger simulated complete yearly cycles, the average generation required ca. 760 Degree days (1400 degree days F). The results of our model agree completely with the observations of Flitters and Messenger (1965) and we thus feel that this approximation is within the level of accuracy of the discussions reported in the original study. The results of our calculations of the number of generations that are possible for Mexfly are shown in figure 7a. Figure 7a shows some of the values for the number of generations possible at several locations (the total number of calculations cannot be displayed graphically without overlap).
The analysis summarized in figure 7a however represents agreement with data obtained from a single host (citrus). Mexfly is known to show very different reproductive behavior when developing in different hosts (Leyva et. al., 1991). In order to provide a broader indication of the potential for development of this species in any one area, we calculated the total degree days available for development of Mexfly over the entire United States. This calculation only takes into consideration the accumulation of total degree days over the year and provides a relative indicator of likelihood of establishment. Figure7b uses Kriging methods (an interpolation approach that derive intermediate values as a function of data that surrounds a given point) to provide a continuous map of total yearly accumulated degree days over the continental United States and Hawaii. It is noted that areas to the North (including all of Canada) would be considered of the lowest risk compared to the states that border Mexico as well as the Gulf coast states. The reason for this is that with total accumulations of less than 1000 degree-days in Northern areas, it would not be possible for a population to build up even if it were to become established (something not likely due to wintertime conditions as discussed elsewhere).
Figure 7c is a characterization of all areas of the United States into “risk” regions. These regions are a combination of the following features relative to how appropriate they are for the emergence of pest ‘epidemics’: availability of hosts, presence of hosts in susceptible
12
stage, and prevalence of climatic conditions supporting establishment of the pest. A ‘medium’ risk region indicates that year round hosts are not available and that freezing conditions during at least a three-week period in the winter would inhibit successful establishment. A ‘low’ risk region indicates that susceptible hosts are present during six months or less and that extended freezing conditions (more than three weeks) during the Winter make it highly unlikely that this pest would establish in this areas. Finally, a ‘high’ risk region indicates that susceptible hosts are likely to be available year-round, that the conditions are appropriate, that the number of generations that can be expected from Mexfly are high enough to induce important economic damage, and that Winter conditions may not completely remove Mexfly populations. This is particularly true of the southern portions of the are outlined as ‘high’ risk, as well as true for all of Hawaii and Puerto Rico (Puerto Rico not shown). It is assumed for all cases, that the resource at risk (fruit hosts) is of very high economic importance. IV.B. Pathway Analysis
In this section we examine some of the sampling data associated with avocados exports from Mexico into the United States. We focus only on the occurrence of Mexfly associated with these shipments as a case study for similar fruit imports and for other Anastrepha species. IV.B.1. Sampling Analysis
We have relative indicators as to the densities of Mexfly in Mexico coming mostly from trapping surveys (e.g., APHIS-PPQ and IS-Mexico surveys). It is clear from this evidence that significant populations of this pest exist in or around the regions that produce fruit for export. However, for the avocado pathway, which is the focus of this section, we know that a multi-tactic approach is in place (termed a “systems approach”) that uses a combination of pest control methodologies that produce sequential cumulative population reduction that presumably results in a mitigated risk to the extent that such risk may be considered acceptable. This management approach has been described in Miller (1995) and is also part of the regulation 7 CFR 319.56-2ff that describes the conditions under which the importation of this commodity may occur into the United States. There have been nearly one million avocados inspected (using visual examination of dissected fruit) during a single exporting year and information to date does not confirm any finds of Anastrepha spp. associated with this pathway. The occurrence of significant populations in alternate hosts does not provide direct information on the occurrence of this pest in avocado. The only direct evidence is obtained from the fruit dissection sampling noted before.
Given the sampling information, we constructed our scenarios following the descriptions in the methods section above. 10% was our upper threshold for testing different scenarios. For a lower threshold we used ‘one in a million’ because it is closely related to the probit 9-survivorship level.
The maximum number of samples (one million sampled fruit) and the number of ‘successful’ finds so far (none) provided us with information as to what to use for sample sizes or ‘number of trials’.
We posed the question as to what is the probability that, given that significant populations of Mexfly exist in association with this pathway, we are failing to find them. We tested different assumptions regarding the percentage of infested fruit and the number of fruits sampled to determine the likelihood that we are failing to detect what may actually be present.
13
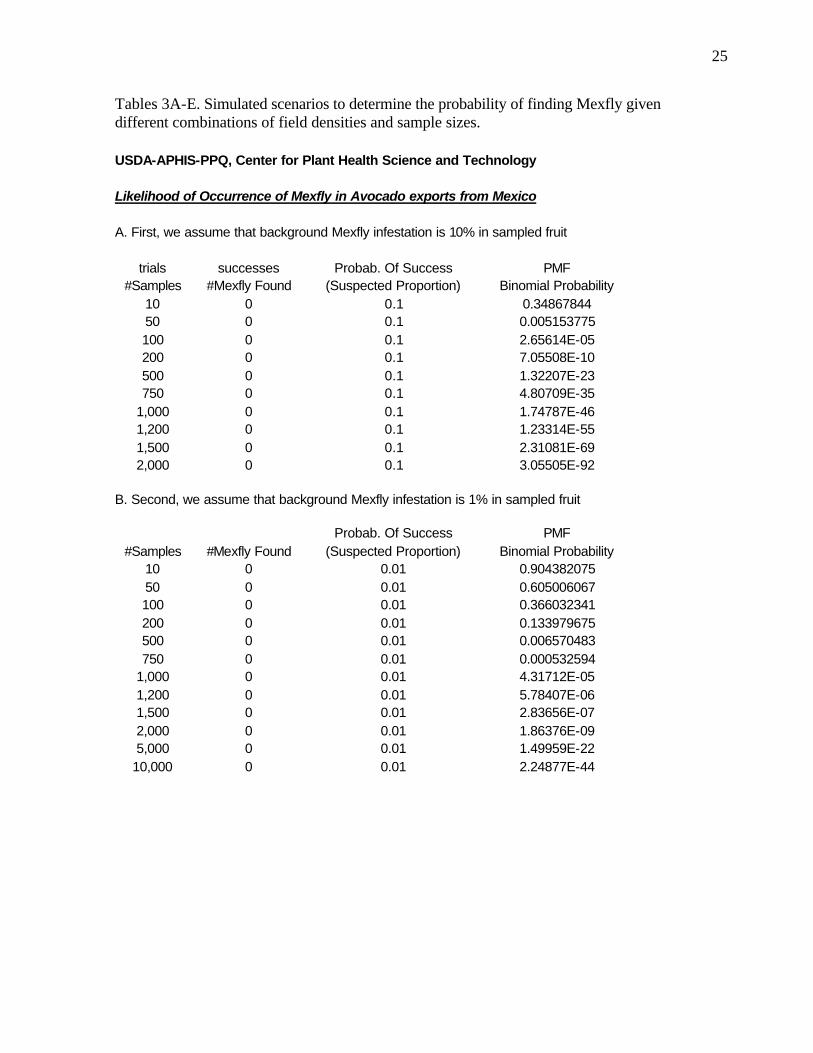
Table 3A-E (Tables are found at end of text) lists the probability that ‘zero’ Anastrepha larvae would be found given the different variable and parameter combinations as stated. The likelihood of actually finding one or more larvae can be calculated as:
Probability of finding one or more Anastrepha = 1-[probability of finding zero],
Where, the probability of zero is shown in Table 3A-D.
Table 3a shows the probability of finding zero larvae given a natural field density of
10% and sample sizes ranging from 10 to 1500 sampled fruit. The table shows that the likelihood of not finding larvae is indeed very low. For example, for a sample size of 1000 fruit, the likelihood of finding zero larvae is 1.7E-35. The probability of finding one or more larvae for that same sample size is 1-1.7E-35!
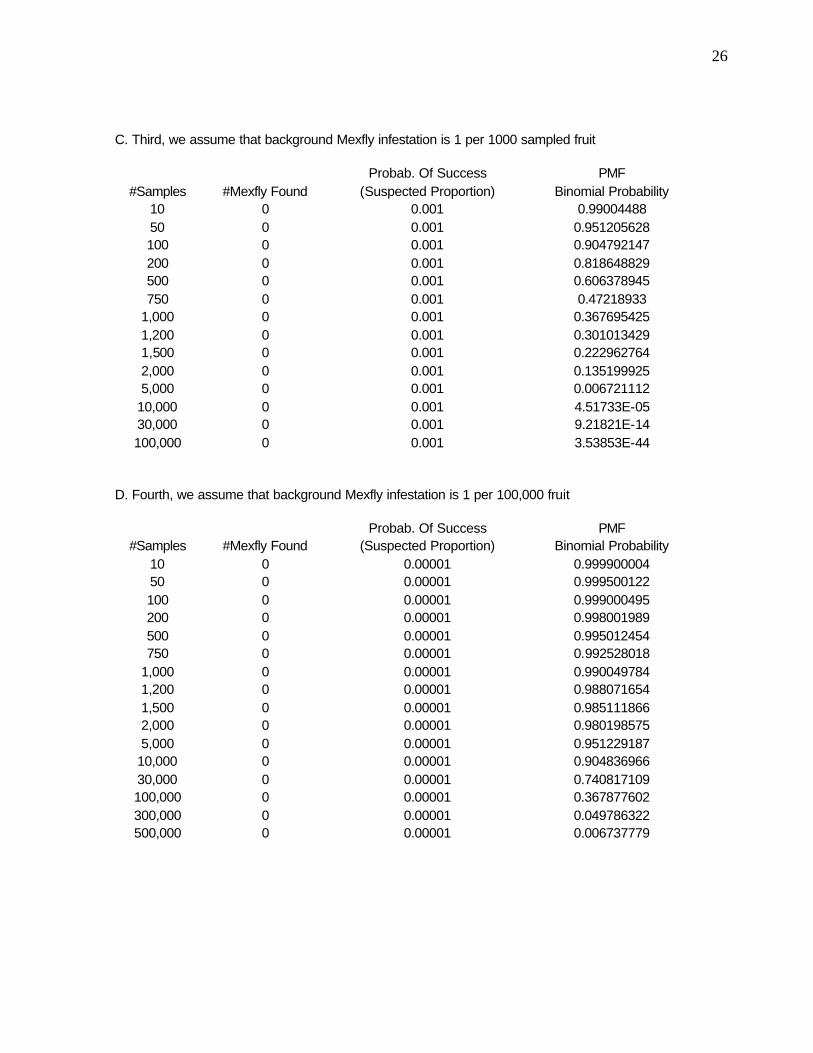
Table 3b-d similarly examines various scenarios and the results are analogous but, as expected, the likelihood of larvae going unnoticed does increase with a decrease in the assumed population density.
Table 3d shows the probability of finding no larvae given that we assume an actual density of 1 in every 100,000 fruit. For such low densities, we need to sample much larger sizes to assure that we are capturing a realistic estimation of the mean densities. Indeed, we need a sample size of 300,000 to have an ca. 0.05 probability of finding zero larvae (or 0.95 probability of finding 1 or more). With a sample size of 500,000 there is an ca. 0.01 probability of finding zero larvae (and ca. 0.99 probability of finding 1 or more).
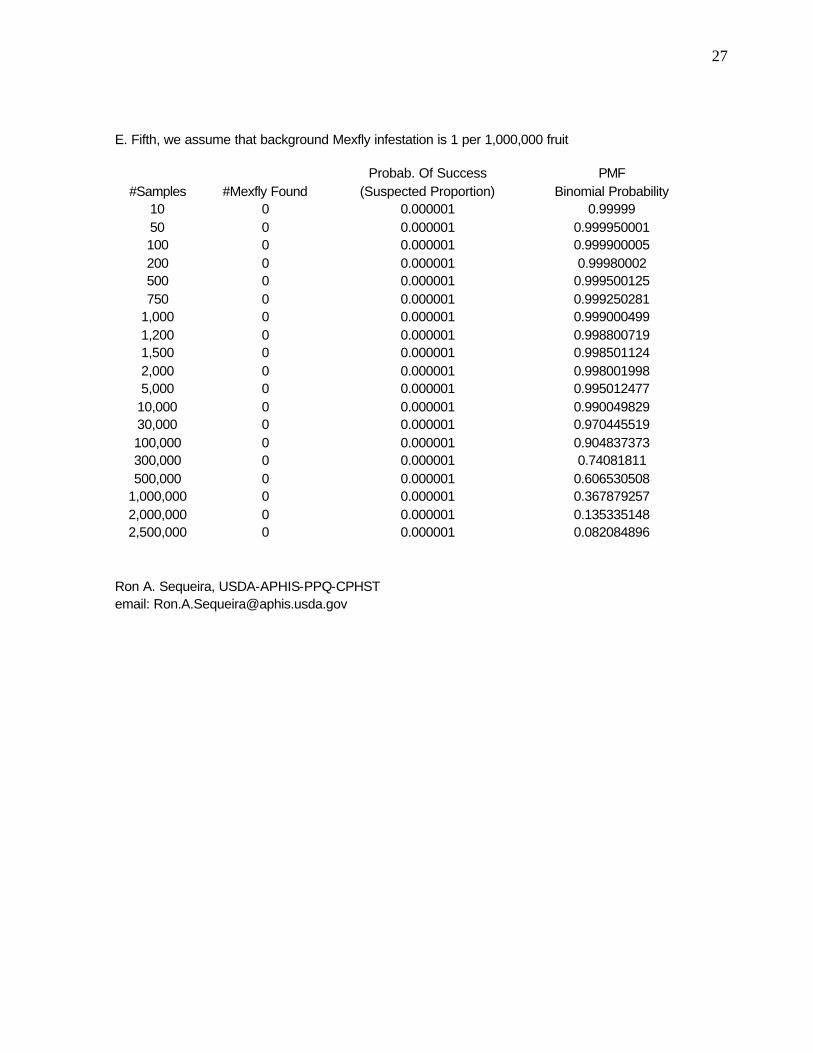
Table 3e shows that probability of finding no larvae given that we assume an actual density of 1 in every one million fruit. For such low densities, again we need to sample much larger sizes to assure that we are capturing a realistic estimation of the mean densities. Indeed, we need a sample size in the range of 3x10⁶ to have an ca. 0.05 probability of finding zero larvae (or 0.95 probability of finding 1 or more). However, if the actual densities are as low as would necessitate the noted sample sizes, the sampling becomes impractical and likely unnecessary (at this level) given that the densities are too low to estimate with this level of precision.
Given the actual sample sizes (in the vicinity of 106) and what we know about Anastrepha and its association with avocadoes, we can state that there is strong evidence to support the statement that it is highly likely that Anastrepha larva would be detected if they were present in significant numbers; or alternately it is highly unlikely that significant populations-such as would be necessary to establish populations-would go undetected.
VI.B.2. Maximum Pest Limit Approach
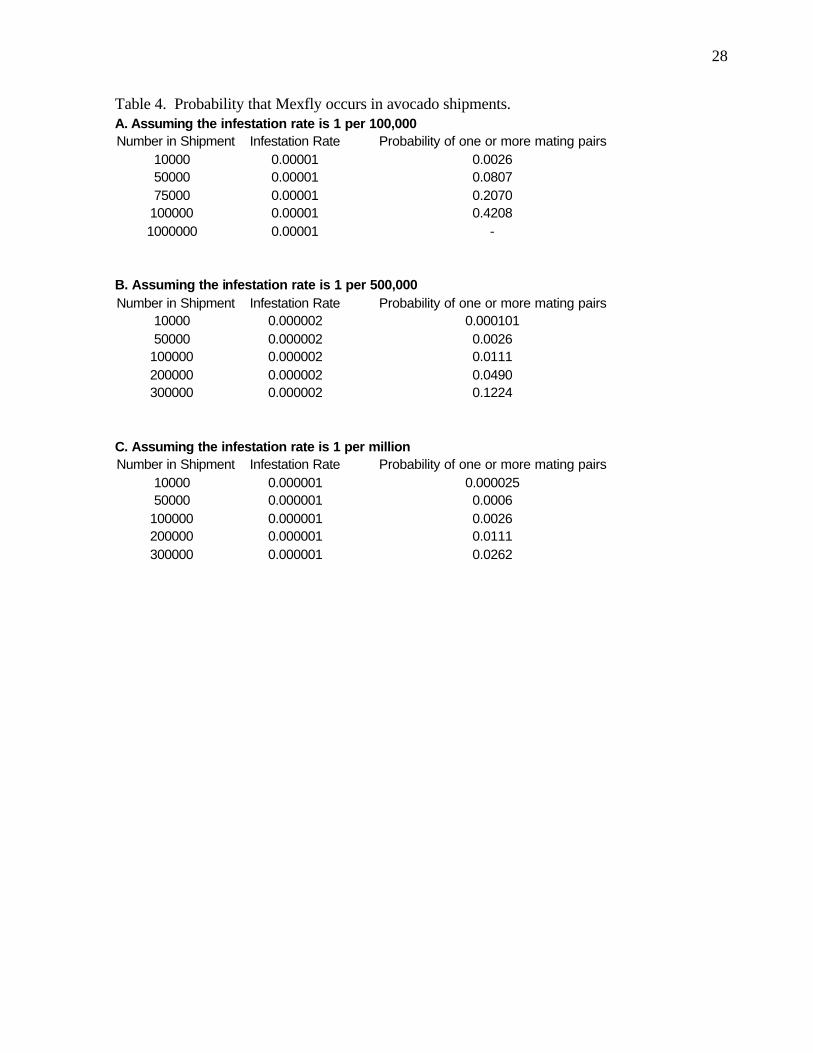
Our final analysis uses the derivations above as input to the maximum pest limit concept (Landolt et al., 1984; Baker et al., 1990; Mangan et al., 1997), which permits us to estimate an acceptable level of risk. Specifically, the occurrence of 1 or more reproductive pairs surviving in a single shipment can be estimated as:
x=∞
Pm=∑x=2
(e-NR
(NR)x/X!)•(1-0.5)
x-1, (Landolt et al., 1984) (2)
14
Where, Pm is the probability of 1 or more mating pairs occurring in a given shipment N is the number of fruit, R is the rate of infestation, e is the base of natural logarithms, and X is the number of flies Vail et al (1993) simplified the above as:
P=[1-e-NR/2]2 (3) Where, P is the probability of a surviving pair, and the other variables are as defined above.
We used the equation (3) above to estimate the probability of a mating pair being present in avocado shipments under different scenarios. The results are summarized in Table 4. Section 3A in the table assumes that the infestation rate is 1 per 100,000 fruit in a given shipment. The probability that one or more mating pairs exist depends on the total number of fruit in a shipment. For example, at this infestation rate the probability that a mating pair will occur in a shipment of 10,000 fruit is less that 0.005, whereas if the shipment size increases to 100,000 the probability of finding a mating pair of Mexfly increases to 0.42. Table 4B assumes that the density in a given shipment is lower (1 infested fruit per million) and examines the likelihood of a mating pair. For all shipment sizes up to one million fruit, the probability of a mating pair is negligible.
V. Discussion
The approach we used to assessing the likelihood that Anastrepha spp. (with special
emphasis on the Mexfly) could become established in the United States considered the interaction between hosts at risk, climatic influence, and the expected dynamics (reproduction potential) of this pest. We have identified discrete regions where the risk is similar in terms of the likelihood of establishment for Anastrepha spp.
Epidemiological evidence indicates that distribution potential of Mexfly is limited to the southern areas of the United States. This observation is in agreement with previous analysis by Flitters and Messenger (1965) and many others. The main limitations to its distribution to all areas of the United States include the absence of year-round hosts, long periods of freezing temperatures, and limited ability for this pest to build damaging populations during short fruiting periods ‘bracketed’ by long, cold winters. It is important to note however that such conditions do not exist in the southern portions of the southern states of Arizona, Texas, Louisiana, Mississippi, Alabama, Georgia, South Carolina; and in most of Florida and California. Our analysis indicates that Mexfly has a high likelihood of becoming established in significant portions of those states.
In terms of the specific pathway chosen as a case study, avocados, sampling evidence and statistical analysis show that the likelihood of introducing a mating pair in shipments of up to a million avocados is low. Densities occurring in avocado shipments are low and they appear to be on the order of one larva per million fruit. These low densities in avocado shipments are due largely to non-preference for the cultivated host and to the current management conditions that include multi-tactic treatments.
Current risk mitigation practices include regulations on the importation of potential Anastrepha hosts. These regulations include treatments, quarantines, and, in the case of several
15
fruit commodities, a complex systems approach that includes multiple tactics to achieve a desired level of security (e.g., Jang 1990, Jang and Moffit 1994, Moffit 1994, Liquido et al. 1996). Current management practices include continued improvements to the “systems approach” implemented by fruit exporters as well as monitoring for changes that occur in the production system.
The extent of permanent establishment possible for Anastrepha spp. in the United States can be clearly articulated with reference to the risk regions established in figure 7c. The limitations due to host availability and climatic conditions can be best explained with reference to figure 3 and figures 5a-5d, 5y. Tables 3 and 4 provide the strongest evidence regarding justification for avocado imports. The concept of acceptable level of risk (including ref: Shafer, 1998) is useful to illustrate that zero risk is unattainable. Uncertainty and Variability
This analysis is based on average conditions for most data analyzed (host phenology/susceptibility, climatic characterization). That is, on any given year, fruiting may be extremely early and temperatures may deviate wildly from the long-term averages. An important question is then how often will a given location deviate from the normal? A comprehensive treatment of this question is not developed here.
We note the following: host distribution and host phenology were expressed as maximum windows. That is, what was shown for phenology were the maximum periods from earliest fruit set to latest harvest or fruit drop as reported by experts. Thus, we expect that during the majority of years, the phenological patterns noted will be repeated. Further, because we use maximum periods (including fruit from its youngest age (post-bloom), and considering that Mexflies do not attack young fruit, we note that this analysis is a conservative approach to assessing the likelihood of establishment of this pest.
A key question is related to the variability of weather. We have not included formal climatological trend analysis as part of this study; however, it is noted here that most years and for most of the continental United States, deviations in temperature of plus or minus two degrees capture the majority (greater than 80%) of observed temperature deviations across the continental United States (e.g., http://www.usda.gov/oce/waob/jawf/national.htm) and that deviations in precipitation of plus or minus 30% of long term averages will capture more than 80% of all locations in the continental United States. It is thus not expected that changes in any one year changes will be observed that will dramatically change the results of this analysis. This statement applies in particular to the areas considered of high versus low risk.
The present study does not reflect long-term climatic warming trends nor does it treat ENSO (“El Nino/Southern Oscillation Index”) anomalies in detail. Whereas ENSO variability is included in the deviations as noted before, long term global warming will limit the applicability of these recommendations to the next 50 years where global warming is expected to be limited to average changes of less than 1 degree. We note that the inclusion of global warming trends is beyond the scope of the present study. VI. Conclusions and Recommendations
This analysis aimed to identify areas susceptible to establishment of Anastrepha spp. populations. Our studies suggest that there are marked differences in the continental United States in terms of likelihood of establishment of this pest. Areas of highest susceptibility coincide with the following three factors: year-round availability of susceptible hosts, periods of freezing temperatures not exceeding two weeks, and high likelihood that Anastrepha would
16
be transferred to fruit production or other areas where hosts are present. This analysis conservatively assumed that Anastrepha spp. were likely to reach all areas and concentrated on the climatological and host factors. This analysis and previous studies indicate strong likelihood that Mexfly could establish in the Southern United States. The regulatory safeguards and phytosanitary measures must continue to support the maintenance of Anastrepha-free areas in the entire United States. In a separate analysis (Erickson, et al. 2000), it has been clearly demonstrated that ongoing eradication and regulatory measures against transient populations in south Texas are justifiable in terms of cost/benefits. In terms of selected fruit pathways, at this time the densities of Anastrepha spp. associated with the avocado pathway (as well as other pathways that have similar patterns) appear to be very low. The regulatory actions that propose continued movement of selected fruit to low risk areas will likely result in low risk of pest establishment. This statement will be true with continued effective regulatory restrictions on movement of all host fruit originating in countries with endemic Anastrepha population to southern States. The findings herein assume that conditions occurring at the time of this writing, especially regarding the quality of the “systems approach,” will continue to be in effect. This assumption must be confirmed through monitoring for program changes and/or increases in population densities of Anastrepha spp. in the field. If such changes occur, the assumptions herein need to be revised. VII. Acknowledgements and External Peer Review The following provided data or comments that helped in the preparation of this document: -Larry Fowler, USDA-APHIS-PPQ -Scott Redlin, USDA-APHIS-PPQ -Dave Bartels, USDA-APHIS-PPQ -Robert Venette, USDA-APHIS-PPQ -Wilmer Snell, USDA APHIS PPQ -Wayne Burnett, USDA-APHIS-PPQ -Erhard Dobesberger, Canada Food and Agriculture (co-author of the NAPPO study) -Alejandra Elizalde, Sanidad Vegetal, Mexico (co-author of the NAPPO Study) -Jorge Leyva-Vazquez, Graduate College, Texcoco, Mexico -Guy Hallman, USDA-ARS -Robert Mangan, USDA-ARS
17
VIII. References Aluja, M. 1994. Bionomics and management of Anastrepha. Ann. Rev. Entomol. 39:155-178. Aluja, M., Guillen, J., Liedo, P., Cabrera, M., Rios, de la Rosa, G., Celedonio, H., and Mota, D.
1990. Fruit infesting tephritids (Diptera: Tephritidae) and associated parasitoids in Chiapas, Mexico. Entomophaga 35:39-48.
Aluja, M., Jacome, I., Birke, A., Lozada, N., Quintero, G. 1993. Basic patterns of behavior in wild Anastrepha striata (Diptera: Tephritidae) flies under field-cage conditions. Annals of the Entomological Society of America 86(6):776-793.
Anon. 1994. Pest Risk Assessment: Mexican Fruit Fly (Anastrepha ludens). Report of the Lynfield Plant Protection Centre to the Ministry of Agriculture and Forestry (MAF) Regulatory Authority. 13 p.
Baker, A., D.Cowley, D.Harte, and E.Frampton. 1990. Development of a maximum pest limit for fruit flies (Diptera: Tephritidae) in produce imported into New Zealand. J. Econ. Entomol. 83: 13-17.
Baker, A.C., Stone, W.E., Plummer, C.C., and McPhail, M. 1944. A review of studies on the Mexican fruit fly and related Mexican species. United States Department of Agriculture Misc. Publication 531:1-155, 82 fig., 10 pl.
Baker, E.W. 1944. Studies on the response of fruit flies to temperature. Journal of Economic Entomology 37(2):280-283.
Baker, E.W. 1945. Studies of the Mexican fruit fly known as Anastrepha fraterculus. J. Econ. Entomol. 38(1):95-100.
Bush, G.L. 1957. Some notes on the susceptibility of avocados in Mexico to attack by the Mexico fruit fly. pp. 75-79.
Bush, G.S. 1962. The cytotaxonomy of the larvae of some Mexican fruit flies in the genus Anastrepha (Tephritidae, Diptera). Psyche 69:87-101.
CAB International. 2000. Crop Protection Compendium, Global Module, 2nd Edition. CAB International, Wallingford, UK.
Casti, J. 1991. What scientists can know about the future. Morrow Pub., NY. Coakley, S.M., L.R. McDaniel. 1988. Quantifying how climatic factors affect variation in
plant disease severity: a general method using a new way to analyze meteorological data. Climate Change 12:57-75.
Celedonio-Hurtado, H., Aluja, M., Liedo, P. 1995. Adult population fluctuations of Anastrepha species (Diptera: Tephritidae) in tropical orchard habitats of Chiapas, Mexico. Environmental Entomology, 24(4):861-869.
Christenson, L.E., Foote, R.E. 1960. Biology of fruit flies. Annu. Rev. Entomol. 5:171-192. Ebeling, W. 1959. Subtropical fruit pests. Berkeley: Univ. of California, Division of
Agricultural Sciences. Erickson, L., Miller, C.E., and Stefan, M. 2000. Economic Analysis of Options for Eradicating
Mexican Fruit Fly (Anastrepha ludens) from the Lower Rio Grande Valley of Texas. Policy Analysis and Development Staff, APHIS, USDA. pp
Fletcher, B.S. 1989. Ecology: movements of tephritid fruit flies. In: Robinson, A.S., Hooper, G. eds. Fruit Flies: Their Biology, Natural Enemies and Control. World Crop Pests, 3(B). Amsterdam, Netherlands: Elsevier, 209-219.
Flitters, N.E. ad P.S. Messenger. 1965. Effect of temperature and humidity on development and potential distribution of the Mexican fruit fly in the United States. Tech. Bull. No. 1330. USDA-ARS. 35pp.
18
Foote, R.H., Blanc, F.L., Norrbom, A.L. 1993. Handbook of the Fruit Flies (Diptera: Tephritidae) of America North of Mexico. Ithaca, USA: Comstock.
Hagstrum, D.W. and G.A. Milliken. 1991. Modeling differences in insect developmental times between constant and fluctutating temperatures. Ann. Entomol. Soc. Am. 84(4): 369-379.
Hagstrum, D.W. and C.E. Leach. 1973. Role of constant and fluctuating temperatures in determining developmental time and fecundity of three species of stored-product Coleoptera. Ann. Entomol. Soc. Am. 66: 407-410.
Hallman, G., R.McGuire, E.Baldwin, and C. Campbell. 1995. Mortality of feral Caribbean fruit fly (Diptera: Tephritidae) immatures in coated guavas. J. Econ. Entomol 88(5): 1353-1355.
Hallman, G., R.. 1999. Lethality of cold to third instars, pupae, and pharate adults of the Mexican fruit fly (Diptera: Tephritidae). J. Econ. Entomol 92(2): 480-484.
Hernadez-Ortiz V. 1992. El genero Anastrepha en Mexico. Taxonomia, distribucion y sus plantas huespedes. Xalapa, Mexico: Instituto de Ecologia Publication. ISBN 968-7213-26-4.
Jang, E. 1996. Systems approach to quarantine security: postharvest application of sequential mortality in the Hawaiian grown ‘Sharwil’ avocado system. J. Econ. Entomol 89(4): 949-956.
Jang, E. and H. Moffit. 1994. Systems approaches to achieving quarantine security. In: Quarantine treatments for pests of food plants. Sharp, J. and G. Hallman (eds). Westview Press, Boulder, CO.
Jiron, L..F, and Hedstrom, I. 1988. Occurrence of fruit flies of the genera Anastrepha and Ceratitis (Diptera: Tephritidae), and their host plant availability in Costa Rica. Florida Entomologist, 71(1):62-73.
Landolt, P., D.Chambers, and V.Chew. 1984. Alternative to the use of probit 9 mortality as a criterion for quarantine treatments of fruit fly (Diptera:Tephritidae)-infested fruit. J. Econ. Entomol 77: 285-287.
Leyva-Vazquez, J. 1988. Temperatura umbral y unidades de calor requeridos por los estados inmaduros de Anastrepha ludens (Loew) (Diptera:Tephritidae). Folia Entomologica Mexicana No. 74:189-196.
Leyva-Vazquez, J. H.W. Browning, and F.E. Gilstrap. 1991. Development of Anastrepha ludens in several host fruit. Environ.Entomol. 20(4): 1160-1165.
Lightfield, J.W. 1986. Economic Importance of Anastrepha serpentina to U.S. Agriculture - Pest Analysis.
Liquido, N., K.Vick, and R.Griffin. 1996. Quarantine Security for Commodities. In: Bartlett, P, Chaplin, G. and R.van Velsen (eds). Plant Quarantine Statistics: a review. Horticultural Research and Dev. Corp. Sydney, Australia.
Machado, A.E., Salles, L.A.B., and Loeck, A.E. 1995. Exigencias termicas de Anastrepha fraterculus (Wied.) e estimativa do numero de geraoes anuais em Pelotas, RS. Anais da Sociedade Entomologica do Brasil 24(3):573-578.
Mangan, R., E. Frampton, D. Thomas, and D. Moreno. 1997. Application of the maximum pest limit concept to quarantine security standards for the Mexican fruit fly (Diptera: Tephritidae). J. Econ. Entomol. 90:1433-1440.
Mangan, R., K. Shellie, S. Ingle, M. Firko. 1998. High temperature forced air treatments with fixed time and temperature for Dancy tangerines, Valencia oranges, and rio star grapefruit. J. Econ. Entomol. 91(4);933-939.
19
McAllister, L.C. and J.K. Clore. 1941. Evidence on the theory of annual dispersal of the Mexican fruit fly from Northern Mexico to Citrus groves in the Rio Grande Valley of Texas. Summary report on line project No. 40, 1941-1941, USDA-Bureau of Entomology and Plant Quarantine. U.S. Gov. Printing Office S-9742.
Miller, C.E., Green, A.S., Harabin, V., and Stewart, R. 1995. Risk Management Analysis: A systems approach for Mexican Avocado. Mexican Hass Avocado Import Program Information, APHIS, USDA. Pp. v + 1-27.
Moffit, H. 1994. A systems approach to meeting quarantine requirements for apples and sweet cherries as an alternative to fumigation with methyl bromide. A report of the fruit and vegetable insect research. USDA-ARS. Yakima, WA
Murphy, B., and Coronado, R. 1986. Mexican Fruit Fly (Anastrepha ludens) Biology and Control. California Department of Food and Agriculture, Sacramento, California. Pp. 1-42.
Nielson, R.M. 1989. Notas preliminaries sobre el comportamiento de los adultos de la mosca de las frutas, Anastrepha striata Schiner, en condiciones de laboratorio. Brenesia 32:27-31.
Norrbom, A.L., and Kim, K.C. 1988. A list of the reported host plants of the species of Anastrepha (Diptera: Tephritidae). APHIS 81-52, USDA. pp. 1-113.
Oakley, R.G. 1950. Manual of foreign plant pests for fruit flies. Unpublished USDA. January 30 1950.
Oi, D.H. and R.F. Mau. 1989. Relationship of fruit ripeness to infestation in ‘Sharwil’ avocados by the Mediterranean fruit fly and the Oriental fruit fly. J. Econ. Entomol. 82: 556-560.
Ramirez-Cruz, A., Hernandez-Ortiz, V., and Martinez, MI. 1996. Maduracion ovarica en la ‘Mosca de la Guyaba’ Anastrepha striata Schiner (Diptera: Tephritidae). Acta Zoologica Mexicana 69:105-116.
Rust, E.W. 1918. Anastrepha fraterculus Wied. (Trypetidae) - a severe menace to the southern United States. Journal of Economic Entomology 11:457-467.
Salles, L.A.B. 1993. Emergence of adults of Anastrepha fraterculus (Wied., 1830) (Diptera: Tephritidae) during the autumn and winter in Pelotas - RS. Anais da Sociedade Entomologica do Brasil 22(1):63-69.
Salles, L.A.B. 1993. Efeito da temperatura constante na oviposicao e no ciclo de vida de Anastrepha fraterculus (Wied., 1830) (Diptera: Tephritidae). Anais da Sociedade Entomologica do Brasil 22(1):57-62.
Salles, L.A.B., Carvalho, F.L.C., and Junior, C.R. 1995. Efeito da temperatura e umidade do solo sobre pupas e emergencia de Anastrepha fraterculus (Wied). Anais da Sociedade Entomologica do Brasil 24(1):147-152.
Shafer, S.R. 1998. Consistency, Transparency, and "Acceptable Level of Risk" for Plant Pest Risk Management in International Trade. USDA-ORACBA Newsletter 3(4).
Shaw, J.G. 1946. Development of the immature stages of Anastrepha serpentina in relation to temperature. Journal of Agricultural Research 72(8): 265-276.
Shaw, J.G., Sanchez-Riviello, M., Spishakoff, L.M., Trujillo, P.G., López, F.D. 1967. Dispersal and migration of tepa-sterilized Mexican fruit flies. J. Econ. Entomol. 60:992-94.
Steck, G.J. 1991. Biochemical systematics and population genetic structure of Anastrepha fraterculus and related species (Diptera: Tephritidae). Ann. Entomol. Soc. Am. 84:10-28.
20
Stone, A. 1942. The fruitflies of the genus Anastrepha. U.S. Department of Agriculture Misc. Publication. 439:1-112, 22 text fig. + 23 pl. Washington, D.C.
Thomas, D. B. 1997. Degree day accumulations and seasonal duration of the pre-imaginal stages of the Mexican fruit fly. Florida Entomol. 80(1): 71-80.
Vail, P., J.Tebbets, B. Mackey, and C.Curtis. 1993. Quarantine treatments: a biological approach to decision-making for selected hosts of codling moth (Lepidoptera: Tortricidae). J. Econ. Entomol 86: 70-77.
Wagner, T. H.Wu, P.J.H. Sharpe, R. Schoolfield, and R. Coulson. 1984. Modeling insect developmental rates. Ann. Entomol. Soc. America 77:208-225.
Wasbauer, M.S. 1972. An annotated host catalog of the fruit flies of America north of Mexico (Diptera: Tephritidae). Occas. Pap. Calif. Dep. Agric. Bur. Entomol. 19:1-172.
Weems, H.V. 1963. Mexican fruit fly (Anastrepha ludens (Loew)) (Diptera: Tephritidae). Entomology Circular No. 16. Florida Department of Agriculture and Consumer Services, Division of Plant Industry.
Weems, H.V. 1969. Anastrepha serpentina (Wiedemann) (Diptera: Tephritidae). Entomology Circular No. 91. Florida Department of Agriculture and Consumer Services, Division of Plant Industry.
Weems, H.V. 1980. Anastrepha fraterculus (Wiedemann) (Diptera: Tephritidae). Entomology Circular No. 217. Florida Department of Agriculture and Consumer Services, Division of Plant Industry.
Weems, H.V. 1982. Anastrepha striata Schiner (Diptera: Tephritidae). Entomology Circular No. 245. Florida Department of Agriculture and Consumer Services, Division of Plant Industry.
White, I.M., and Elson-Harris, M.M. 1992. Fruit flies of economic significance; Their Identification and Bionomics. Wallingford, UK: CAB International, pp. xxi + 601.
Worner, S.P. 1992. Performance of phenological models under variable temperature regimes: consequences fo the Kaufmann or rate summation effect. Environ. Entomol. 21:689-699.
21
IX. Contacts The “Identification of Susceptible Areas for the Establishment of Anastrepha spp. Fruit Flies in the United States and Analysis of Selected Pathways” article was prepared by: Dr. Ron A. Sequeira , Leah Millar (USDA-APHIS-PPQ, The Center for Plant Health Science and Technology, Raleigh, NC); Dr. David Bartels (USDA-APHIS-PPQ, The Center for Plant Health Science and Technology, Mission, TX). This document is part of a broader effort to assess the establishment likelihood of Mexfly in all of North America, that document “Identification of Susceptible Areas for the Establishment of Anastrepha spp. Fruit Flies in North America” is part of an ongoing NAPPO initiative and is being submitted and will appear as NAPPO publication.
22
Table 1. Host List for Mexican Fruit Fly, Anastrepha ludens (Loew)*.
SCIENTIFIC NAME Annona cherimola Annona reticulata Casimiroa edulis Casimiroa tetramaeria Citrus aurantium Citrus grandis Citrus medica Citrus limettioides Citrus paradisi Citrus reticulata Citrus sinensis Cydonia oblonga Diospyros sp. Feijoa sellowiana Inga jinicuil Malus sylvestris Mammea americana Mangifera indica Persea americana Prunus persica Psidium cattleianum Psidium guajava Punica granatum Pyrus communis Sargentia greggii Spondias purpurea Syzygium jambos
COMMON NAME Cherimoya, Custard apple Annona, Custard apple White zapote, zapote blanco matasano Sour orange, naranja agrio Pommelo, Pomelo Citron Sweet lime, Grapefruit, toronja Tangerine, mandarin Sweet orange, Quince, membrillo Persimmon Pineapple guava, feijoa Jinicuil Apple, crab apple Mamey Mango Avocado, aguacate Peach, durazno Strawberry guava Guava, guajava Pomegranate, Pear, Pera Yellow chapote, chapote amarillo Red mombin Rose apple, jambos
HOST STATUS
B B A B A B B A A B A A B A B A B A B A B B B A A B B
* A - Superior host/ frequently infested, primary host, preferred host B - Satisfactory host/ occasionally infested, secondary
23
Table 2. Phenology (approximate fruit set to end of harvest or fruit drop) of commercial Anastrepha spp. hosts in the United States.
State Peach Apple Pear Prunes & Plums Cherry
Colorado1 May 15 - Sept 30 June 1 - Oct. 30 June 1 - Oct. 15 June 1 - Sept. 30 May 15-Aug. 30
Connecticut2 June 1-Sept. 30 June1-Oct. 30 June 1-Sept. 15 May 15-Sept. 30 ?
Delaware3 April 1-Aug. 30 May 1-Oct. 30 April 1-Aug. 30 April 1-July 30 NA
Idaho4 NA July 1-Oct.30 NA NA NA
Illinois5 April 10- Sept. 30 April 7-Nov. 15 April 1-Sept. 30 April 1-July 30 April 7-July 15
Indiana6 April 10- Sept. 30 April 7-Nov. 15 April 1-Sept. 30 April 1-July 30 April 7-July 15
Iowa7 April 10- Sept. 30 April 7-Nov. 15 April 1-Sept. 30 April 1-July 30 April 7-July 15
Kansas8 April 15-Sept. 15 May 1-Oct. 15 NA NA May 1-July 15
Kentucky9 April 1-July 30 April 15-Nov. 30 April 15-Sept. 30 April 1-Aug. 30 May 1-July 30
Maine10 May 15 - Sept. 30 June 1-Oct.30 May 25-Sept. 30 NA NA
Maryland11 May 1-Aug. 30 May 15-Oct. 15 May 1-Aug. 30 April 15-July 30 April 15-July 30
Massachusetts12 May 1-Sept.15 May 1-Nov. 15 May 1-Sept. 30 April 25-Sept. 30 April 20-July 30
Michigan13 May 10-Sept. 30 May 10-Nov. 10 May 15-Oct 15 May 10-Sept. 30 May 10-Aug. 15
Minnesota14 NA May 1-Oct. 15 NA NA May 1-Aug. 7
Missouri15 April 15-Oct. 15 April 15-Oct. 15 April 15-Oct. 15 April 15-Oct. 15 NA
Montana16 May 10-Sept. 30 May 15-Oct. 31 May 1-Oct. 15 May 1-Sept. 30 May 1-Sept. 15
Nebraska17 May 1-July 30 July 15-Oct. 15 NA NA NA
New Hampshire18 May 15 - Sept. 30 June 1-Oct.30 May 25-Sept. 30 NA NA
New Jersey19 May 1-Sept. 15 May 15-Oct. 30 May 1-Sept. 30 May 1-Sept.15 May 5-July 30
New York20 June 1-Sept. 30 June1-Oct. 30 June 1-Sept. 15 May 15-Sept. 30 ?
North Dakota21 May 10-Sept. 30 May 15-Oct. 31 May 1-Oct. 15 May 1-Sept. 30 May 1-Sept. 15
Ohio22 May 1-Sept. 15 May 15-Oct. 30 May 1-Sept. 30 May 1-Sept. 30 May 1-July 20
Pennsylvania23 May 1-Sept. 15 May 15-Oct. 30 May 1-Sept. 30 May 1-Sept.15 May 5-July 30
Rhode Island24 May 1-Sept.15 May 1-Nov. 15 May 1-Sept. 30 April 25-Sept. 30 April 20-July 30
SouthDakota25 NA May 1-Oct. 15 NA NA May 1-Aug. 7
Utah26 April 1-Sept. 30 April 1-Sept. 30 April 1-Aug. 30 April 1-Sept. 15 April 1-July 30
Vermont27 NA May 20-Oct. 30 NA NA NA
Virginia28 May 1-Sept. 30 May 1-Nov. 15 May 1-Oct. 30 May 1-Sept. 30 May 1-July 30
Wash. D.C. 29 May 1-Aug. 30 May 15-Oct. 15 May 1-Aug. 30 April 15-July 30 April 15-July 30
West Virginia30 May 1-Aug. 30 May 15-Sept. 30 May 1-Aug. 30 May 1-Aug. 30 May 1-July 15
Wisconsin31 May 7-Sept. 30 May 7-Sept. 30 May 7-Sept. 30 May 7-Sept. 30 May 7-July 30
Wyoming32 NA July 1-Oct.30 NA NA NA
24
REFERENCES
1. Harold Larson, Extension Fruit Pathology, Colorado State University
2. Dates approximated using New York data
3. Derby Walker, University of Delaware Extension Service
4. Dates approximated using Wyoming data
5. M. Babadoost, Department of Crop Science, University of Illinois.
6. Dates approximated using Illinois data
7. Dates approximated using Illinois data
8. Ted Carey, Horticulture, Kansas State Research and Extension Center at Olathe
9. Michael Madryga, USDA-APHIS-PPQ. Dates for cherry approximated using Virginia data.
10. Dates approximated using New Hampshire data
11. William Gimpel, Plant Protection and Weed Management, Maryland Department of Agriculture
12. Wesley Autio, Department of Plant and Soil Sciences, University of Massachusetts
13. Bill Shane, Michigan State University Extension
14. Dates approximated using South Dakota data
15. Dana DeWeese, USDA-APHIS-PPQ
16. Gary Adams, USDA-APHIS-PPQ
17. Gary Aldrige, USDA-APHIS-PPQ
18. Alan Eaton, University of New Hampshire
19. Dates approximated using Pennsylvania data
20. Art Agnello, New York State Experiment Station, Geneva, Cornell University
21. Dates approximated using Montana data
22. Dave Ferree, Ohio State University
23. Larry Hull, Pennsylvania State University Extension
24. Dates approximated using Mass. data
25. Amy Mesman, USDA-APHIS-PPQ
26. Michael Redling, Utah State University
27. Elena Garcia, Plant And Soil Science Department, University of Vermont
28. T. Michael Likins, Virginia Department of Agriculture
29. Data approximated using Maryland data
30. Wesley Drosselmeyer, USDA-APHIS-PPQ
31. Lee Lovett, Wisconsin Department of Agriculture, Trade, and Consumer Protection
32. John Larson, USDA-APHIS-PPQ
25
Tables 3A-E. Simulated scenarios to determine the probability of finding Mexfly given different combinations of field densities and sample sizes. USDA-APHIS-PPQ, Center for Plant Health Science and Technology Likelihood of Occurrence of Mexfly in Avocado exports from Mexico A. First, we assume that background Mexfly infestation is 10% in sampled fruit
trials successes Probab. Of Success PMF #Samples #Mexfly Found (Suspected Proportion) Binomial Probability
10 0 0.1 0.34867844 50 0 0.1 0.005153775 100 0 0.1 2.65614E-05 200 0 0.1 7.05508E-10 500 0 0.1 1.32207E-23 750 0 0.1 4.80709E-35
1,000 0 0.1 1.74787E-46 1,200 0 0.1 1.23314E-55 1,500 0 0.1 2.31081E-69 2,000 0 0.1 3.05505E-92
B. Second, we assume that background Mexfly infestation is 1% in sampled fruit Probab. Of Success PMF
#Samples #Mexfly Found (Suspected Proportion) Binomial Probability 10 0 0.01 0.904382075 50 0 0.01 0.605006067 100 0 0.01 0.366032341 200 0 0.01 0.133979675 500 0 0.01 0.006570483 750 0 0.01 0.000532594
1,000 0 0.01 4.31712E-05 1,200 0 0.01 5.78407E-06 1,500 0 0.01 2.83656E-07 2,000 0 0.01 1.86376E-09 5,000 0 0.01 1.49959E-22
10,000 0 0.01 2.24877E-44
26
C. Third, we assume that background Mexfly infestation is 1 per 1000 sampled fruit Probab. Of Success PMF
#Samples #Mexfly Found (Suspected Proportion) Binomial Probability 10 0 0.001 0.99004488 50 0 0.001 0.951205628 100 0 0.001 0.904792147 200 0 0.001 0.818648829 500 0 0.001 0.606378945 750 0 0.001 0.47218933
1,000 0 0.001 0.367695425 1,200 0 0.001 0.301013429 1,500 0 0.001 0.222962764 2,000 0 0.001 0.135199925 5,000 0 0.001 0.006721112
10,000 0 0.001 4.51733E-05 30,000 0 0.001 9.21821E-14 100,000 0 0.001 3.53853E-44
D. Fourth, we assume that background Mexfly infestation is 1 per 100,000 fruit Probab. Of Success PMF
#Samples #Mexfly Found (Suspected Proportion) Binomial Probability 10 0 0.00001 0.999900004 50 0 0.00001 0.999500122 100 0 0.00001 0.999000495 200 0 0.00001 0.998001989 500 0 0.00001 0.995012454 750 0 0.00001 0.992528018
1,000 0 0.00001 0.990049784 1,200 0 0.00001 0.988071654 1,500 0 0.00001 0.985111866 2,000 0 0.00001 0.980198575 5,000 0 0.00001 0.951229187
10,000 0 0.00001 0.904836966 30,000 0 0.00001 0.740817109 100,000 0 0.00001 0.367877602 300,000 0 0.00001 0.049786322 500,000 0 0.00001 0.006737779
27
E. Fifth, we assume that background Mexfly infestation is 1 per 1,000,000 fruit
Probab. Of Success PMF #Samples #Mexfly Found (Suspected Proportion) Binomial Probability
10 0 0.000001 0.99999 50 0 0.000001 0.999950001 100 0 0.000001 0.999900005 200 0 0.000001 0.99980002 500 0 0.000001 0.999500125 750 0 0.000001 0.999250281
1,000 0 0.000001 0.999000499 1,200 0 0.000001 0.998800719 1,500 0 0.000001 0.998501124 2,000 0 0.000001 0.998001998 5,000 0 0.000001 0.995012477
10,000 0 0.000001 0.990049829 30,000 0 0.000001 0.970445519 100,000 0 0.000001 0.904837373 300,000 0 0.000001 0.74081811 500,000 0 0.000001 0.606530508
1,000,000 0 0.000001 0.367879257 2,000,000 0 0.000001 0.135335148 2,500,000 0 0.000001 0.082084896
Ron A. Sequeira, USDA-APHIS-PPQ-CPHST email: [email protected]
28
Table 4. Probability that Mexfly occurs in avocado shipments. A. Assuming the infestation rate is 1 per 100,000 Number in Shipment Infestation Rate Probability of one or more mating pairs
10000 0.00001 0.0026 50000 0.00001 0.0807 75000 0.00001 0.2070
100000 0.00001 0.4208 1000000 0.00001 -
B. Assuming the infestation rate is 1 per 500,000 Number in Shipment Infestation Rate Probability of one or more mating pairs
10000 0.000002 0.000101 50000 0.000002 0.0026
100000 0.000002 0.0111 200000 0.000002 0.0490 300000 0.000002 0.1224
C. Assuming the infestation rate is 1 per million Number in Shipment Infestation Rate Probability of one or more mating pairs
10000 0.000001 0.000025 50000 0.000001 0.0006
100000 0.000001 0.0026 200000 0.000001 0.0111 300000 0.000001 0.0262
Assessing Likelihood of Establishment and “Risk” Zones for Risk Management*
Collect Data Layers
•Host /Yield distribution•Planting Dates•Weather Station Location•Meteorology•Boundaries
Analyze Weather/Pest-Environment Interactions
•Climate data Analysis•Average Daily Records (“Daily Normals”)•Average for Discrete Periods(“Period Normals”)•Pest Distribution
Determine Planting/Phenological Regions
•Establish Region contours
•Estimate Phenological timing/distribution
Integrate Layers
•Climate•Host Distribution•Phenological Regions•‘Iso-risk’ maps
*The “risk” term here refers specifically to the component: likelihood of establishment of the pest in commercial growing areas
Chart 1. Logic flow to establish areas with highest ‘risk’ to Mexfly in the United States
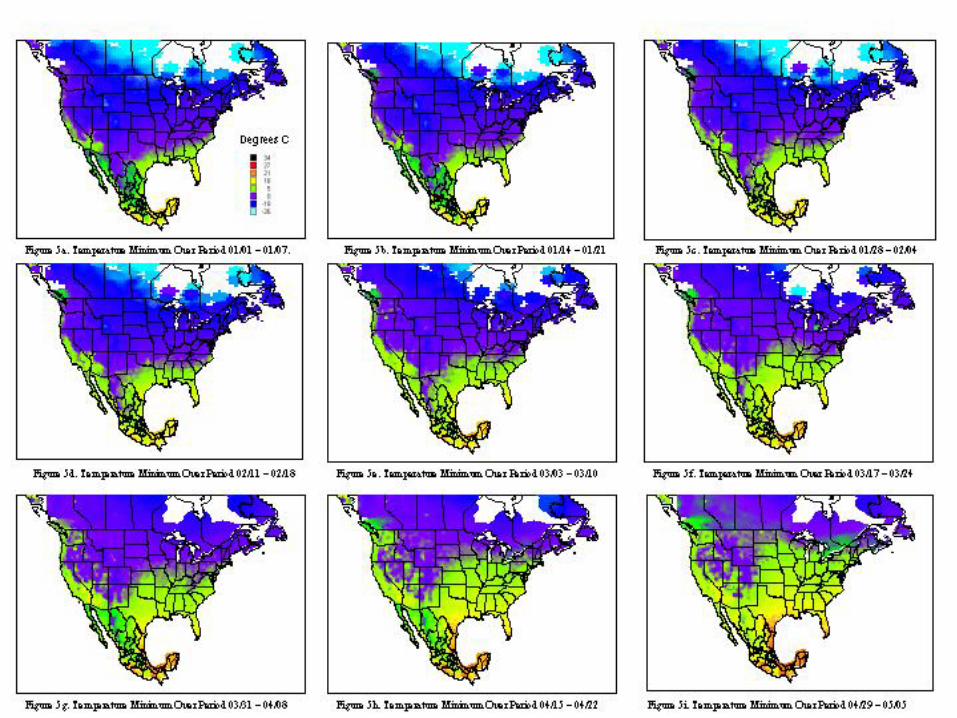
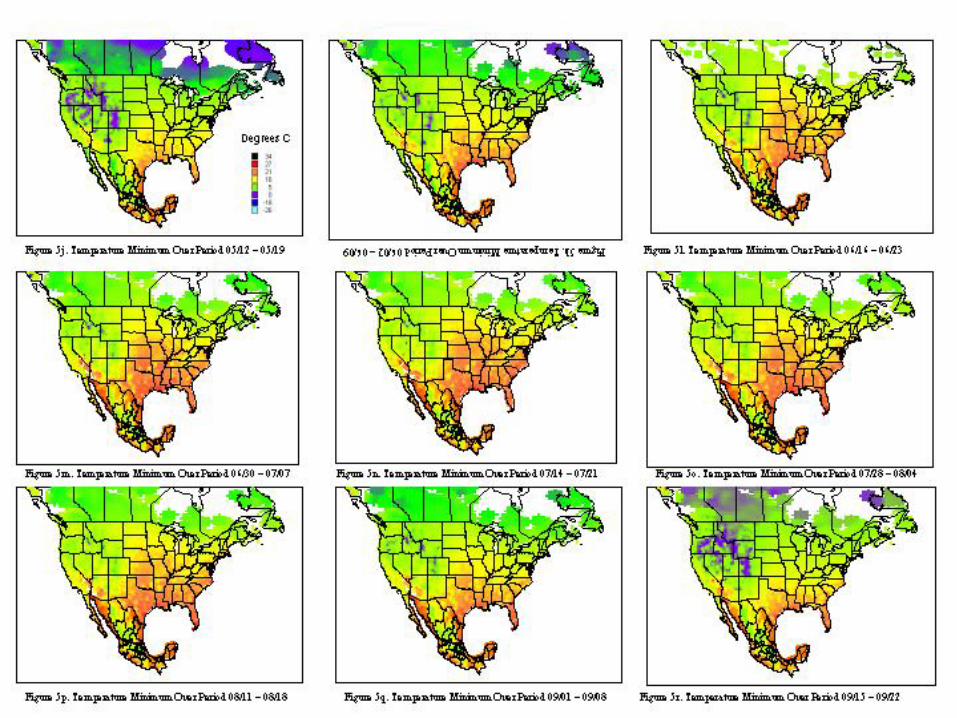
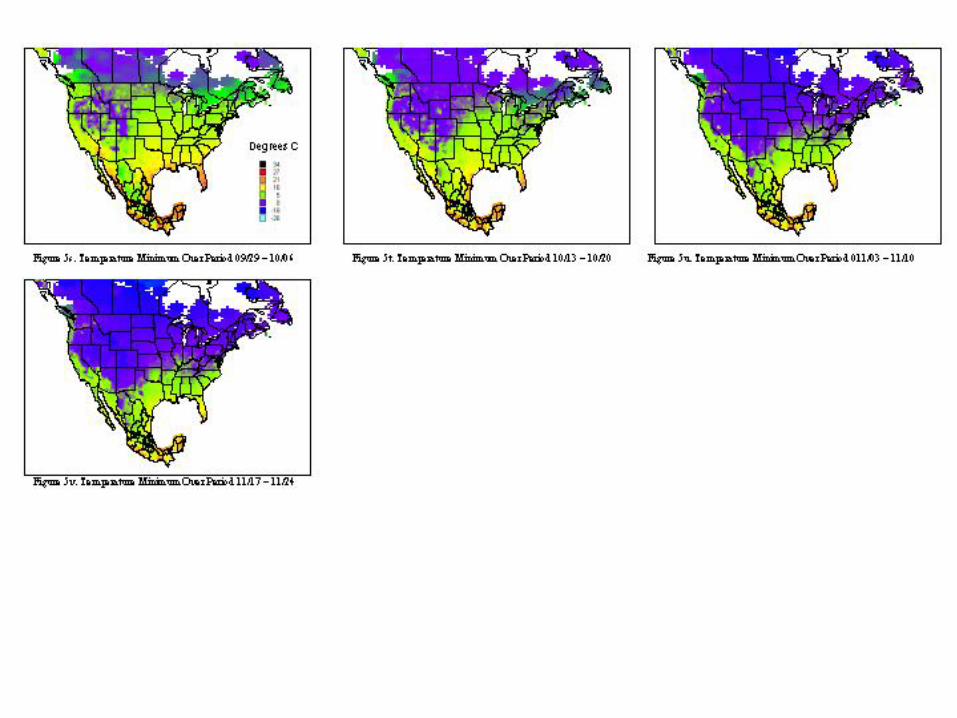
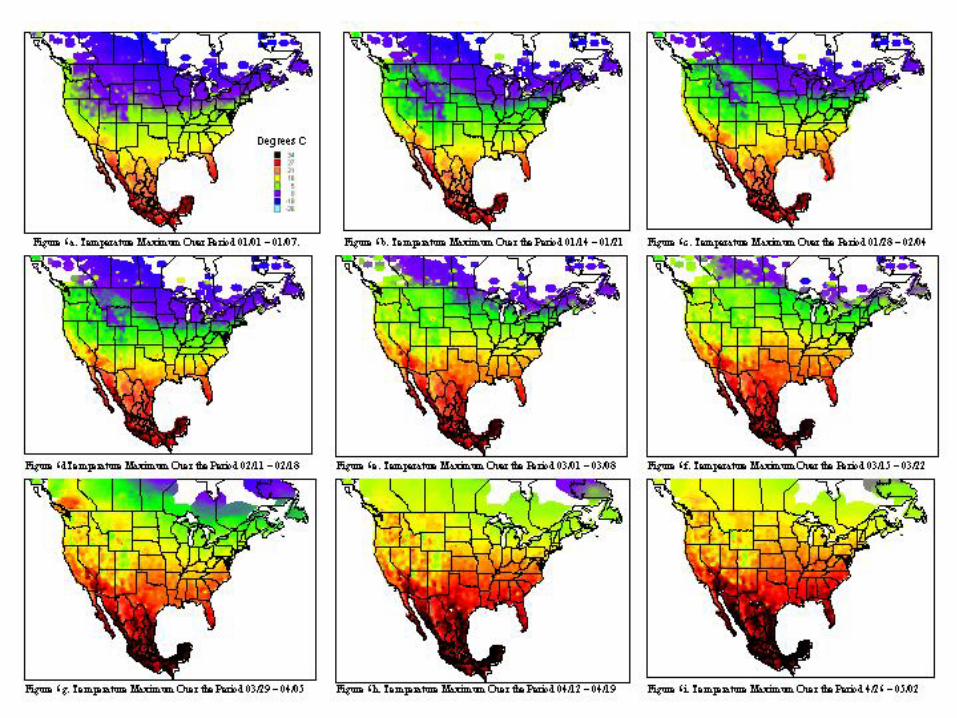
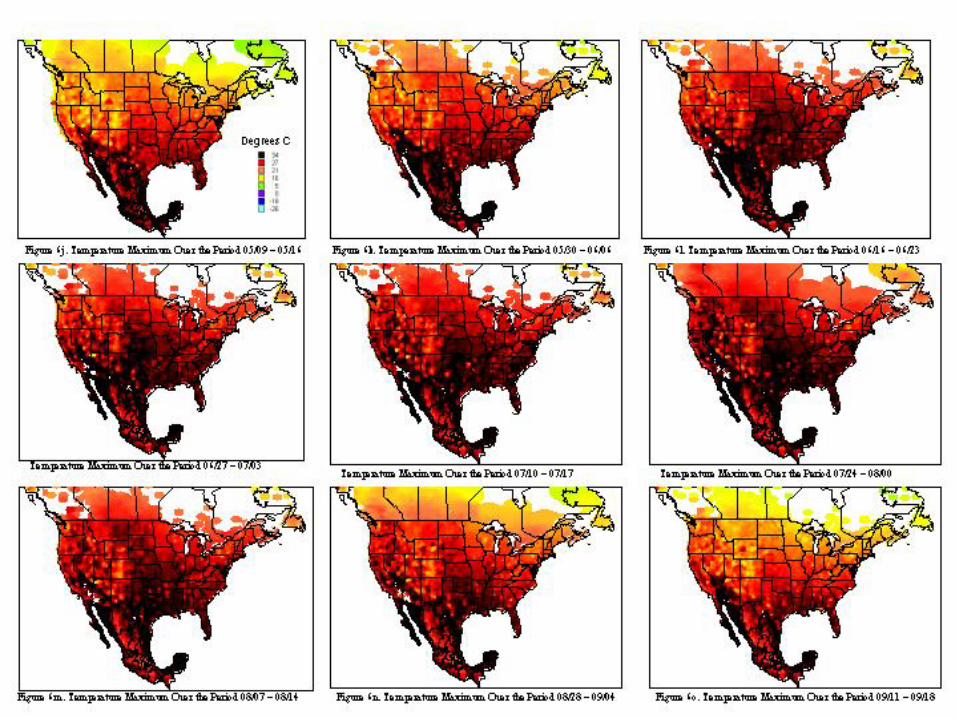
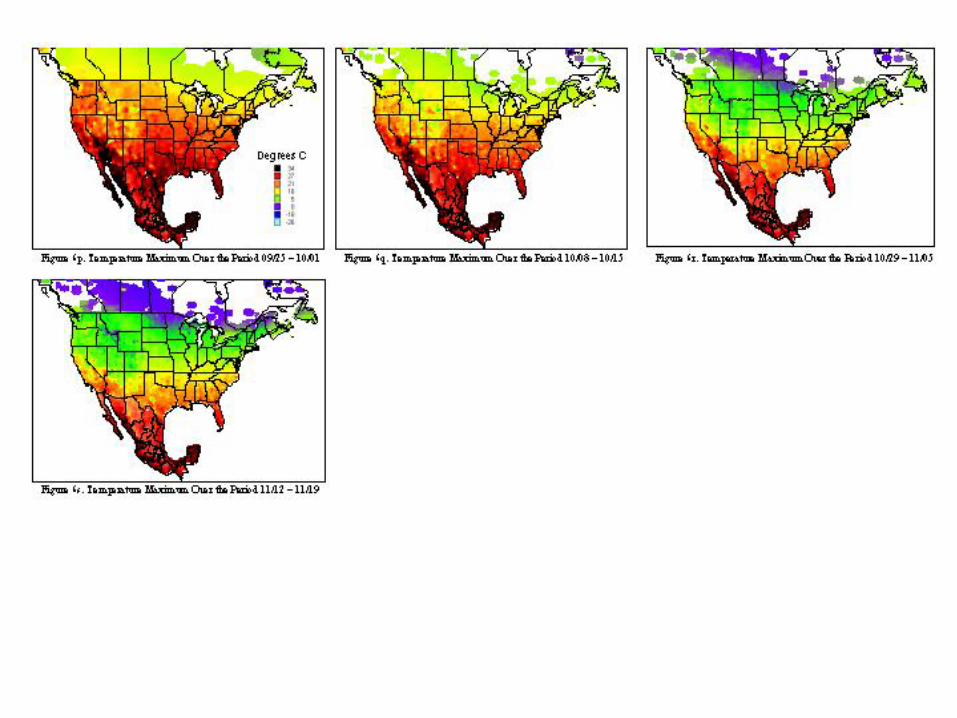
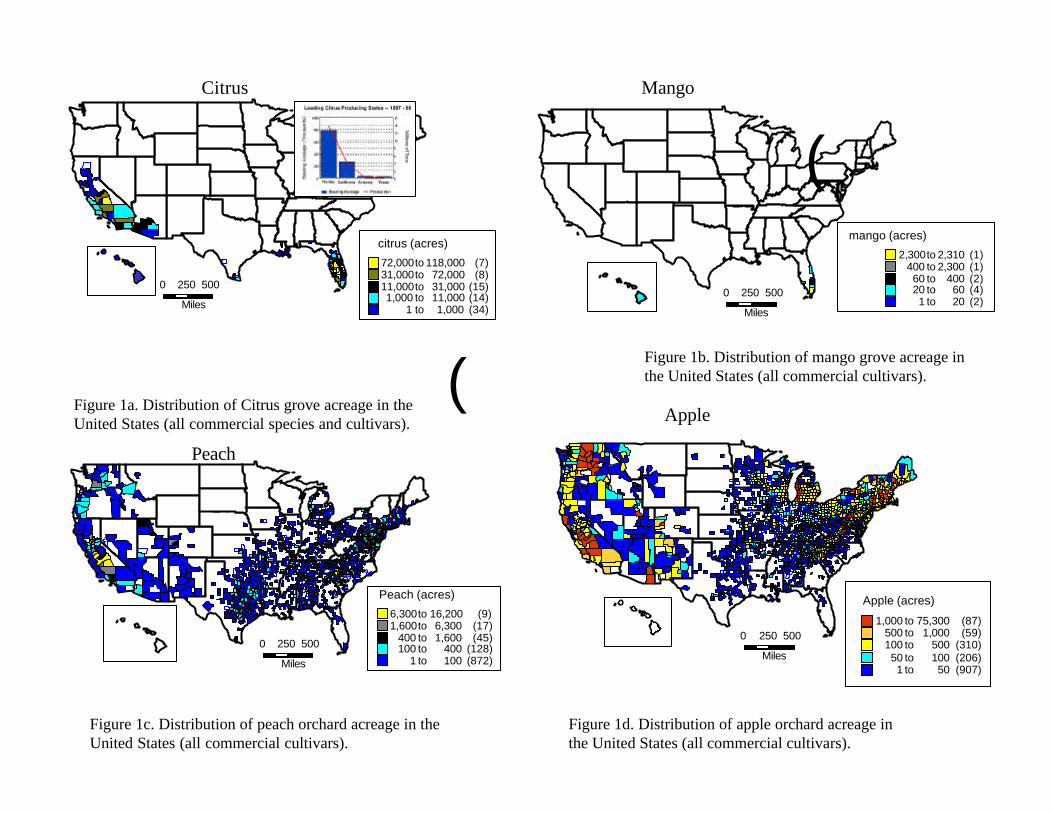
i
citrus (acres)
72,000to 118,000 (7)31,000to 72,000 (8)11,000to 31,000 (15)1,000 to 11,000 (14)
1 to 1,000 (34)
0 250
Miles
500
Citrus
Figure 1a. Distribution of Citrus grove acreage in the United States (all commercial species and cultivars).
Mango
imango (acres)
2,300to 2,310 (1)400 to 2,300 (1)60 to 400 (2)20 to 60 (4)1 to 20 (2)
Figure 1b. Distribution of mango grove acreage in the United States (all commercial cultivars).
Peach
Peach (acres)
6,300to 16,200 (9)1,600to 6,300 (17)
400 to 1,600 (45)100 to 400 (128)
1 to 100 (872)
Figure 1c. Distribution of peach orchard acreage in the United States (all commercial cultivars).
Apple
Figure 1d. Distribution of apple orchard acreage in the United States (all commercial cultivars).
Apple (acres)
1,000 to 75,300 (87)500 to 1,000 (59)100 to 500 (310)50 to 100 (206)1 to 50 (907)
0 250
Miles
500
0 250
Miles
5000 250
Miles
500
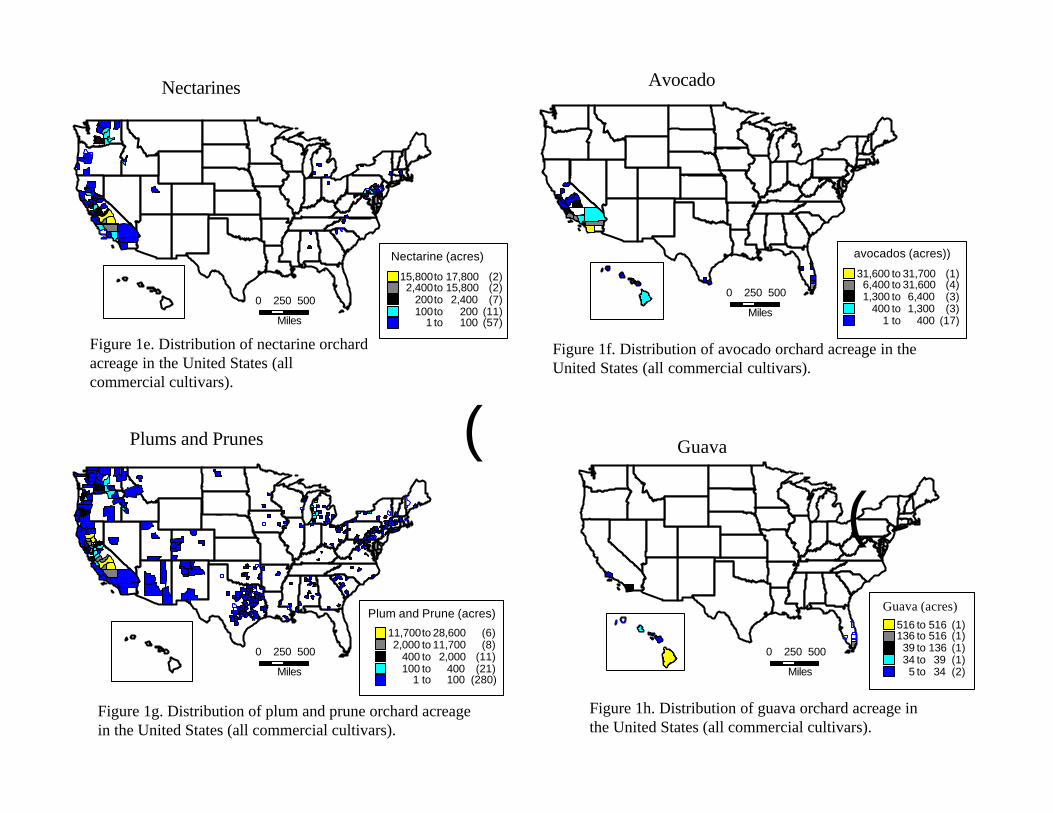
Nectarines
Nectarine (acres)
15,800to 17,800 (2)2,400to 15,800 (2)
200to 2,400 (7)100to 200 (11)
1 to 100 (57)
Figure 1e. Distribution of nectarine orchard acreage in the United States (all commercial cultivars).
Avocado
avocados (acres))
31,600 to 31,700 (1)6,400 to 31,600 (4)1,300 to 6,400 (3)
400 to 1,300 (3)1 to 400 (17)
Figure 1f. Distribution of avocado orchard acreage in the United States (all commercial cultivars).
Plums and Prunes
Plum and Prune (acres)
11,700to 28,600 (6)2,000 to 11,700 (8)
400 to 2,000 (11)100 to 400 (21)
1 to 100 (280)
Figure 1g. Distribution of plum and prune orchard acreage in the United States (all commercial cultivars).
Guava
iGuava (acres)
516 to 516 (1)136 to 516 (1)39 to 136 (1)34 to 39 (1)5 to 34 (2)
Figure 1h. Distribution of guava orchard acreage in the United States (all commercial cultivars).
i
0 250
Miles
5000 250
Miles
500
0 250
Miles
500 0 250
Miles
500
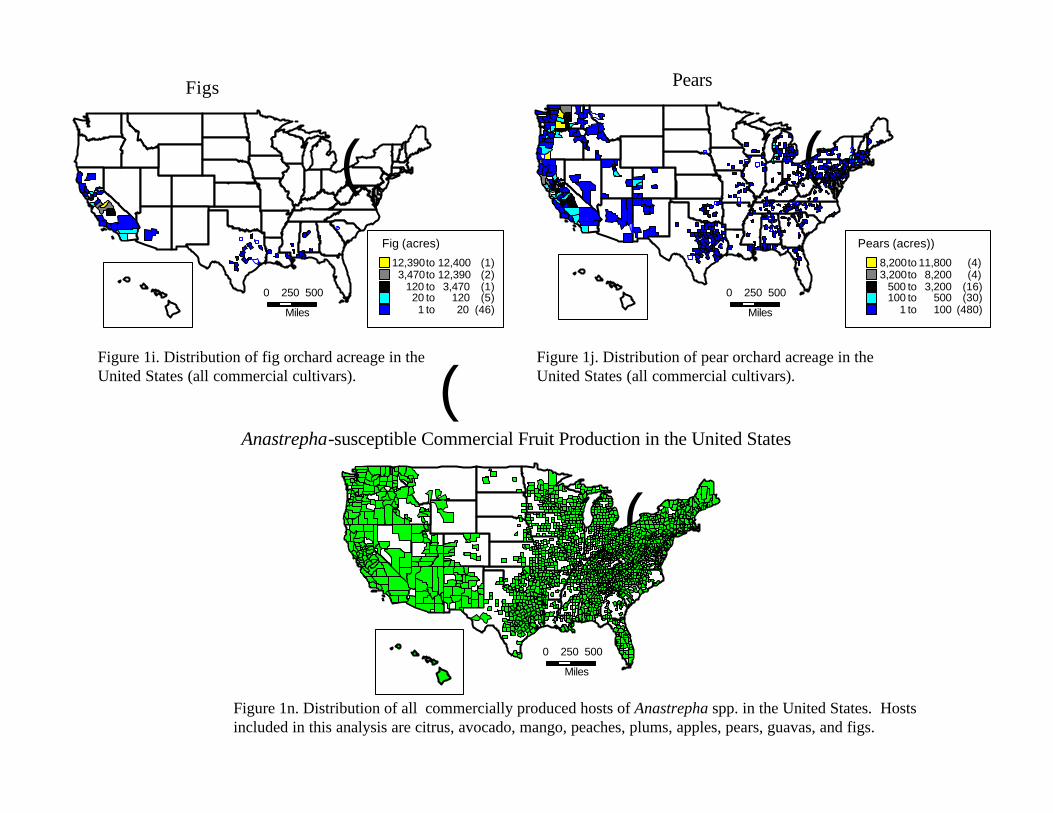
Figs
iFig (acres)
12,390to 12,400 (1)3,470to 12,390 (2)
120 to 3,470 (1)20 to 120 (5)1 to 20 (46)
Figure 1i. Distribution of fig orchard acreage in the United States (all commercial cultivars).
Pears
iPears (acres))
8,200to 11,800 (4)3,200to 8,200 (4)
500 to 3,200 (16)100 to 500 (30)
1 to 100 (480)
Figure 1j. Distribution of pear orchard acreage in the United States (all commercial cultivars).
Anastrepha-susceptible Commercial Fruit Production in the United States
Figure 1n. Distribution of all commercially produced hosts of Anastrepha spp. in the United States. Hosts included in this analysis are citrus, avocado, mango, peaches, plums, apples, pears, guavas, and figs.
i
i
0 250
Miles
5000 250
Miles
500
0 250
Miles
500
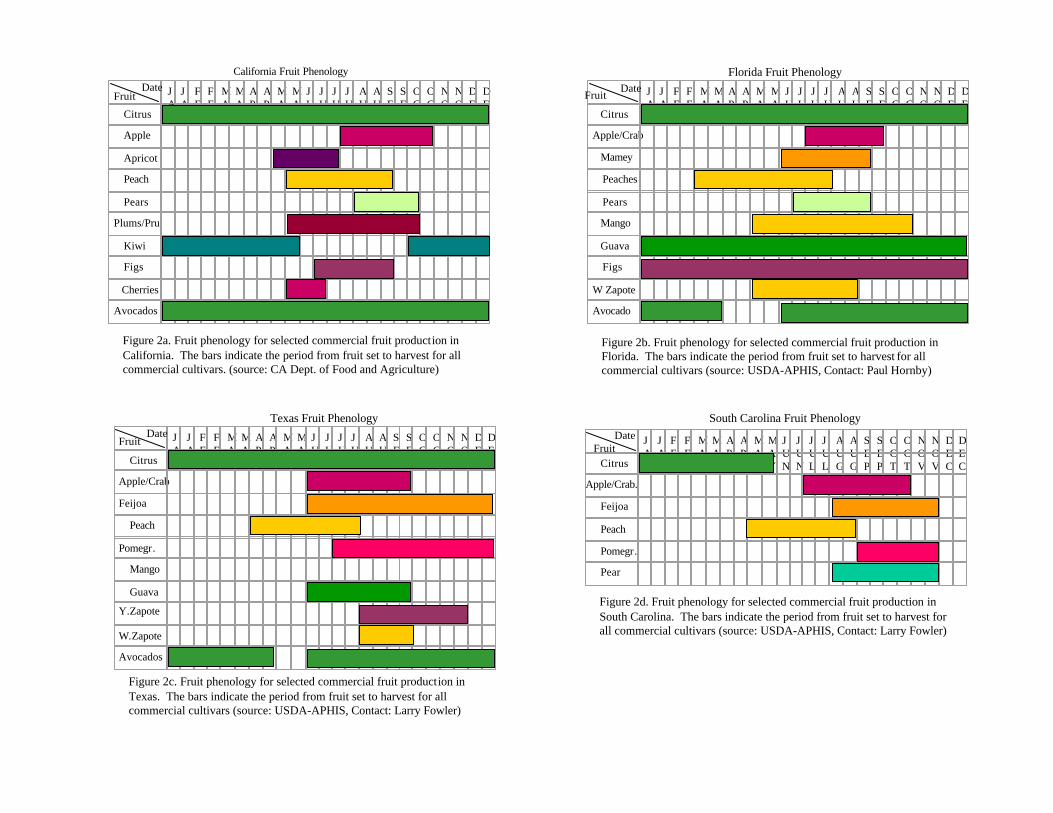
JAN
FEB
FEB
MAR
MAR
APR
APR
MAY
MAY
JUN
JUN
JUL
JUL
AUG
AUG
SEP
SEP
OCT
OCT
NOV
NOV
DEC
DEC
JAN
Apple
Apricot
Peach
Pears
Plums/Pru
Kiwi
Figs
Cherries
Avocados
Figure 2a. Fruit phenology for selected commercial fruit production in California. The bars indicate the period from fruit set to harvest for all commercial cultivars. (source: CA Dept. of Food and Agriculture)
California Fruit Phenology
DateFruit
Citrus
JAN
FEB
FEB
MAR
MAR
APR
APR
MAY
MAY
JUN
JUN
JUL
JUL
AUG
AUG
SEP
SEP
OCT
OCT
NOV
NOV
DEC
DEC
JANCitrus
Apple/Crab
Mamey
Peaches
Pears
Mango
Guava
Figs
W Zapote
Avocado
Figure 2b. Fruit phenology for selected commercial fruit production in Florida. The bars indicate the period from fruit set to harvest for all commercial cultivars (source: USDA-APHIS, Contact: Paul Hornby)
Florida Fruit PhenologyDate
Fruit
JAN
FEB
FEB
MAR
MAR
APR
APR
MAY
MAY
JUN
JUN
JUL
JUL
AUG
AUG
SEP
SEP
OCT
OCT
NOV
NOV
DEC
DEC
JANCitrus
Apple/Crab
Feijoa
Peach
Pomegr.
Mango
Guava
Y.Zapote
W.Zapote
Avocados
Figure 2c. Fruit phenology for selected commercial fruit production in Texas. The bars indicate the period from fruit set to harvest for all commercial cultivars (source: USDA-APHIS, Contact: Larry Fowler)
Texas Fruit PhenologyDate
Fruit JAN
FEB
FEB
MAR
MAR
APR
APR
MAY
MAY
JUN
JUN
JUL
JUL
AUG
AUG
SEP
SEP
OCT
OCT
NOV
NOV
DEC
DEC
JANCitrus
Apple/Crab.
Feijoa
Peach
Pomegr.
Pear
Figure 2d. Fruit phenology for selected commercial fruit production in South Carolina. The bars indicate the period from fruit set to harvest for all commercial cultivars (source: USDA-APHIS, Contact: Larry Fowler)
South Carolina Fruit Phenology
DateFruit
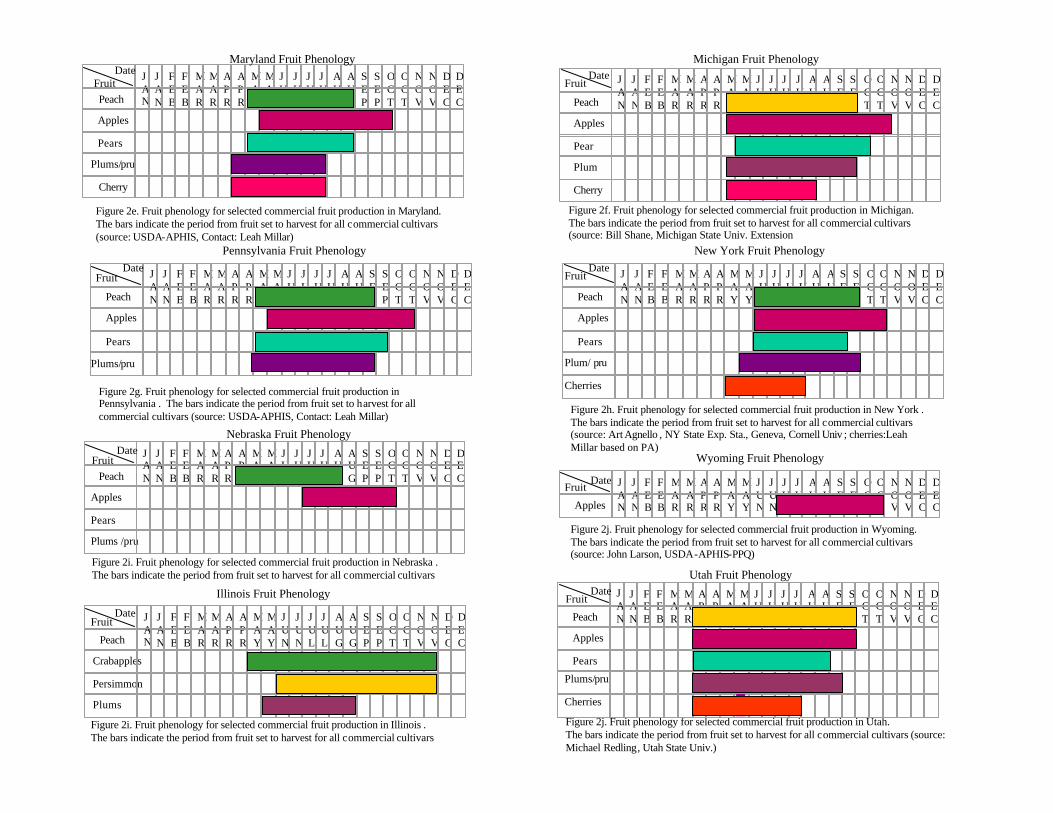
JAN
FEB
FEB
MAR
MAR
APR
APR
MAY
MAY
JUN
JUN
JUL
JUL
AUG
AUG
SEP
SEP
OCT
OCT
NOV
NOV
DEC
DEC
JANPeach
Apples
Pears
Plums/pru
Cherry
Figure 2e. Fruit phenology for selected commercial fruit production in Maryland.The bars indicate the period from fruit set to harvest for all commercial cultivars (source: USDA-APHIS, Contact: Leah Millar)
Maryland Fruit PhenologyDate
Fruit JAN
FEB
FEB
MAR
MAR
APR
APR
MAY
MAY
JUN
JUN
JUL
JUL
AUG
AUG
SEP
SEP
OCT
OCT
NOV
NOV
DEC
DEC
JANPeach
Apples
Figure 2f. Fruit phenology for selected commercial fruit production in Michigan.The bars indicate the period from fruit set to harvest for all commercial cultivars (source: Bill Shane, Michigan State Univ. Extension
Michigan Fruit PhenologyDate
Fruit
Pear
Plum
Cherry
JAN
FEB
FEB
MAR
MAR
APR
APR
MAY
MAY
JUN
JUN
JUL
JUL
AUG
AUG
SEP
SEP
OCT
OCT
NOV
NOV
DEC
DEC
JANPeach
Apples
Pears
Plums/pru
Figure 2g. Fruit phenology for selected commercial fruit production in Pennsylvania . The bars indicate the period from fruit set to harvest for all commercial cultivars (source: USDA-APHIS, Contact: Leah Millar)
Pennsylvania Fruit Phenology
DateFruit J
AN
FEB
FEB
MAR
MAR
APR
APR
MAY
MAY
JUN
JUN
JUL
JUL
AUG
AUG
SEP
SEP
OCT
OCT
NOV
NOV
DEC
DEC
JANPeach
Apples
Pears
Plum/ pru
Figure 2h. Fruit phenology for selected commercial fruit production in New York .The bars indicate the period from fruit set to harvest for all commercial cultivars (source: Art Agnello , NY State Exp. Sta., Geneva, Cornell Univ ; cherries:Leah Millar based on PA)
New York Fruit Phenology
DateFruit
JAN
FEB
FEB
MAR
MAR
APR
APR
MAY
MAY
JUN
JUN
JUL
JUL
AUG
AUG
SEP
SEP
OCT
OCT
NOV
NOV
DEC
DEC
JANPeach
Apples
Pears
Plums /pru
Figure 2i. Fruit phenology for selected commercial fruit production in Nebraska .The bars indicate the period from fruit set to harvest for all commercial cultivars
Nebraska Fruit PhenologyDate
Fruit
JAN
FEB
FEB
MAR
MAR
APR
APR
MAY
MAY
JUN
JUN
JUL
JUL
AUG
AUG
SEP
SEP
OCT
OCT
NOV
NOV
DEC
DEC
JANApples
Figure 2j. Fruit phenology for selected commercial fruit production in Wyoming.The bars indicate the period from fruit set to harvest for all commercial cultivars (source: John Larson, USDA-APHIS-PPQ)
Wyoming Fruit Phenology
DateFruit
Crabapples
Persimmon
Plums
Fruit JAN
FEB
FEB
MAR
MAR
APR
APR
MAY
MAY
JUN
JUN
JUL
JUL
AUG
AUG
SEP
SEP
OCT
OCT
NOV
NOV
DEC
DEC
JANPeach
Figure 2i. Fruit phenology for selected commercial fruit production in Illinois .The bars indicate the period from fruit set to harvest for all commercial cultivars
Illinois Fruit Phenology
Date
JAN
FEB
FEB
MAR
MAR
APR
APR
MAY
MAY
JUN
JUN
JUL
JUL
AUG
AUG
SEP
SEP
OCT
OCT
NOV
NOV
DEC
DEC
JANPeach
Apples
Pears
Plums/pru
Figure 2j. Fruit phenology for selected commercial fruit production in Utah.The bars indicate the period from fruit set to harvest for all commercial cultivars (source: Michael Redling, Utah State Univ.)
Utah Fruit PhenologyDate
Fruit
Cherries
Cherries
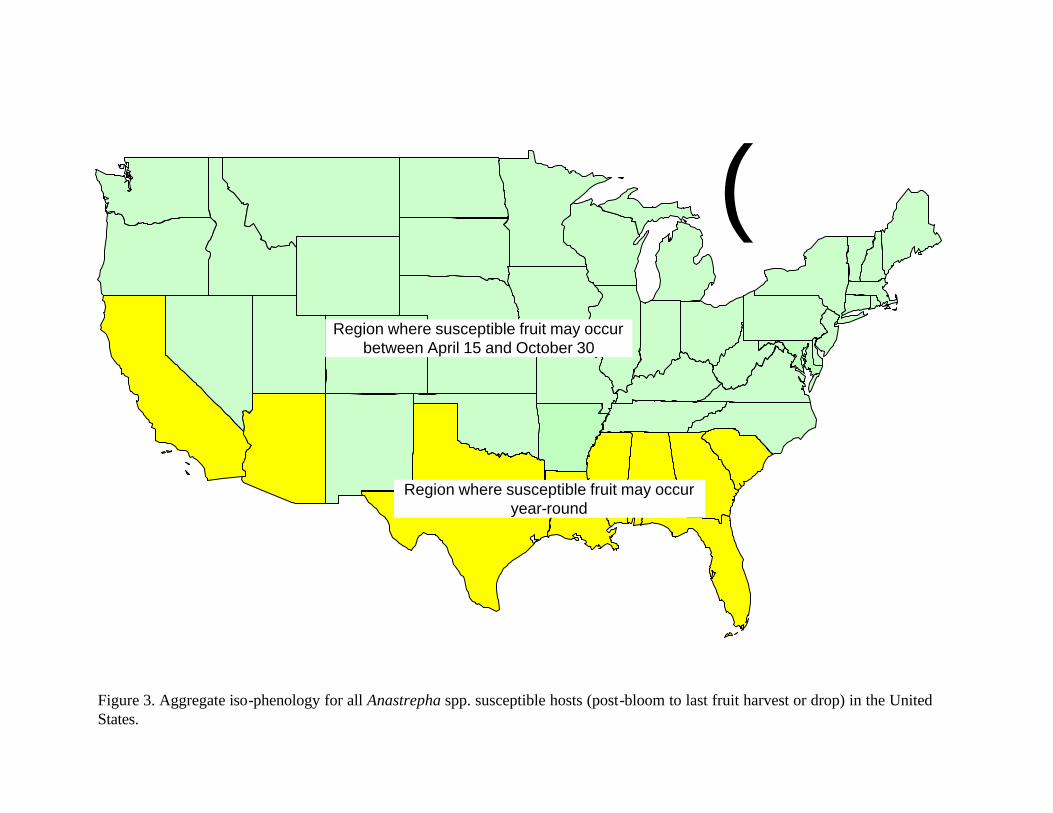
i
Figure 3. Aggregate iso-phenology for all Anastrepha spp. susceptible hosts (post-bloom to last fruit harvest or drop) in the United States.
Region where susceptible fruit may occur year-round
Region where susceptible fruit may occur between April 15 and October 30
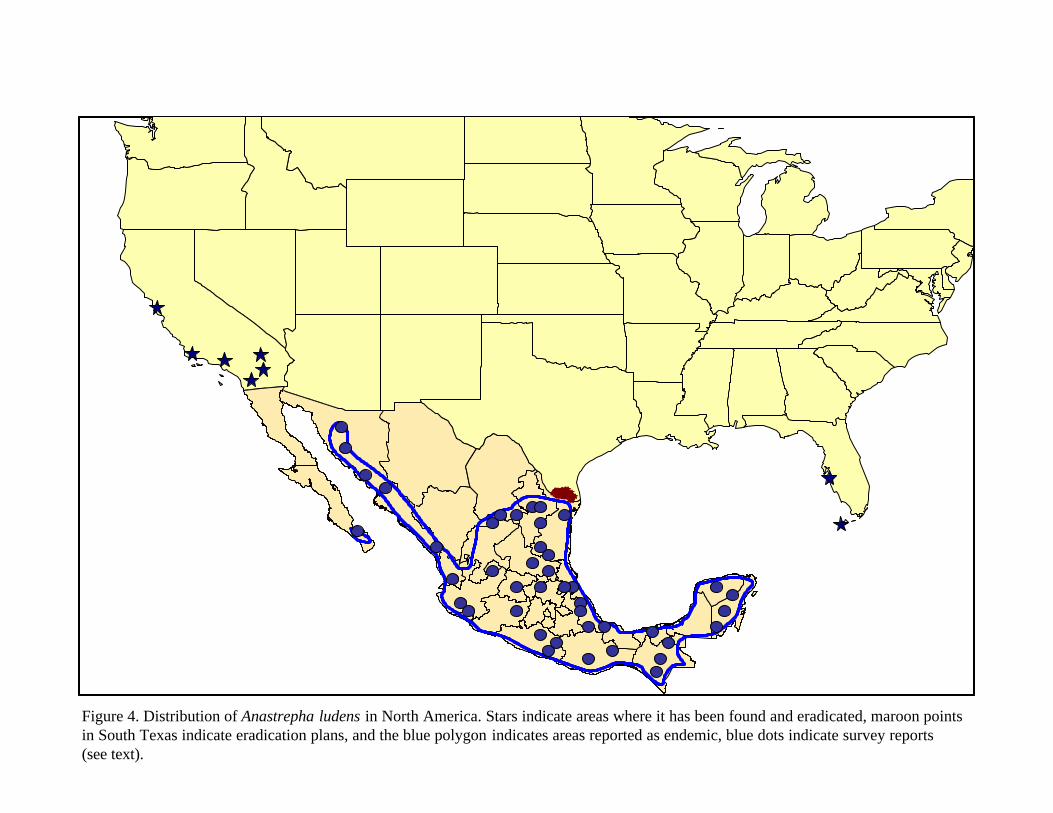
Figure 4. Distribution of Anastrepha ludens in North America. Stars indicate areas where it has been found and eradicated, maroon points in South Texas indicate eradication plans, and the blue polygon indicates areas reported as endemic, blue dots indicate survey reports (see text).
DDDDDDDDDDDDDDDDDDDDDDDDDDDDDDDDDDDDDDDDDDDDDDDDDDDDDDDDDDDDDDDDDDDDDDDDDDDDDDDDDDDDDDDDDDDDDDDDDDDDDDDDDDDDDDDDDDDDDDDDDDDDDDDDDDDDDDDDDDDDDDDDDDDDDDDDDDDDDDDDDDDDDDDDDDDDDDDDDDDDDDDDDDDDDDDDDDDDDDDDDDDDDDDDDDDDDDDDDDDDDDDDDDDDDDDDDDDDDDDDDDDDDDDDDDDDDDDDDDDDDDDDDDDDDDDDDDDDDDDDDDDDDDDDDDDDDDDDDDDDDDDDDDDDDDDDDDDDDDDDDDDDDDDDDDDDDDDDDDDDDDDDDDDDDDDDDDDDDDDDDDDDDDDDDDDDDDDDDDDDDDDDDDDDDDDDDDDDDDDDDDDDDDDDDDDDDDDDDDDDDDDDDDDDDDDDDDDDDDDDDDDDDDDDDDDDDDDDDDDDDDDDDDDDDDDDDDDDDDDDDDDDDDDDDDDDDDDDDDDDDDDDDDDDDDDDDDDDDDDDDDDDDDDDDDDDDDDDDDDDDDDDDDDDDDDDDDDDDDDDDDDDDDDDDDDDDDDDDDDDDDDDDDDDDDDDDDDDDDDDDDDDDDDDDDDDDDDDDDDDDDDDDDDDDDDDDDDDDDDDDDDDDDDDDDDDDDDDDDDDDDDDDDDDDDDDDDDDDDDDDDDDDDDDDDDDDDDDDDDDDDDDDDDDDDDDDDDDDDDDDDDDDDDDDDDDDDDDDDDDDDDDDDDDDDDDDDDDDDDDDDDDDDDDDDDDDDDDDDDDDDDDDDDDDDDDDDDDDDDDDDDDDDDDDDDDDDDDDDDDDDDDDDDDDDDDDDDDDDDDDDDDDDDDDDDDDDDDDDDDDDDDDDDDDDDDDDDDDDDDDDDDDDDDDDDDDDDDDDDDDDDDDDDDDDDDDDDDDDDDDDDDDDDDDDDDDDDDDDDDDDDDDDDDDDDDDDDDDDDDDDDDDDDDDDDDDDDDDDDDDDDDDDDDDDDDDDDDDDDDDDDDDDDDDDDDDDDDDDDDDDDDDDDDDDDDDDDDDDDDDDDDDDDDDDDDDDDDDDDDDDDDDDDDDDDDDDDDDDDDDDDDDDDDDDDDDDDDDDDDDDDDDDDDDDDDDDDDDDDDDDDDDDDDDDDDDDDDDDDDDDDDDDDDDDDDDDDDDDDDDDDDDDDDDDDDDDDDDDDDDDDDDDDDDDDDDDDDDDDDDDDDDDDDDDDDDDDDDDDDDDDDDDDDDDDDDDDDDDDDDDDDDDDDDDDDDDDDDDDDDDDDDDDDDDDDDDDDDDDDDDDDDDDDDDDDDDDDDDDDDDDDDDDDDDDDDDDDDDDDDDDDDDDDDDDDDDDDDDDDDDDDDDDDDDDDDDDDDDDDDDDDDDDDDDDDDDDDDDDDDDDDDDDDDDDDDDDDDDDDDDDDDDDDDDDDDDDDDDDDDDDDDDDDDDDDDDDDDDDDDDDDDDDDDDDDDDDDDDDDDDDDDDDDDDDDDDDDDDDDDDDDDDDDDDDDDDDDDDDDDDDDDDDDDDDDDDDDDDDDDDDDDDDDDDDDDDDDDDDDDDDDDDDDDDDDDDDDDDDDDDDDDDDDDDDDDDDDDDDDDDDDDDDDDDDDDDDDDDDDDDDDDDDDDDDDDDDDDDDDDDDDDDDDDDDDDDDDDDDDDDDDDDDDDDDDDDDDDDDDDDDDDDDDDDDDDDDDDDDDDDDDDDDDDDDDDDDDDDDDDDDDDDDDDDDDDDDDDDDDDDDDDDDDDDDDDDDDDDDDDDDDDDDDDDDDDDDDDDDDDDDDDDDDDDDDDDDDDDDDDDDDDDDDDDDDDDDDDDDDDDDDDDDDDDDDDDDDDDDDDDDDDDDDDDDDDDDDDDDDDDDDDDDDDDDDDDDDDDDDDDDDDDDDDDDDDDDDDDDDDDDDDDDDDDDDDDDDDDDDDDDDDDDDDDDDDDDDDDDDDDDDDDDDDDDDDDDDDDDDDDDDDDDDDDDDDDDDDDDDDDDDDDDDDDDDDDDDDDDDDDDDDDDDDDDDDDDDDDDDDDDDDDDDDDDDDDDDDDDDDDDDDDDDDDDDDDDDDDDDDDDDDDDDDDDDDDDDDDDDDDDDD
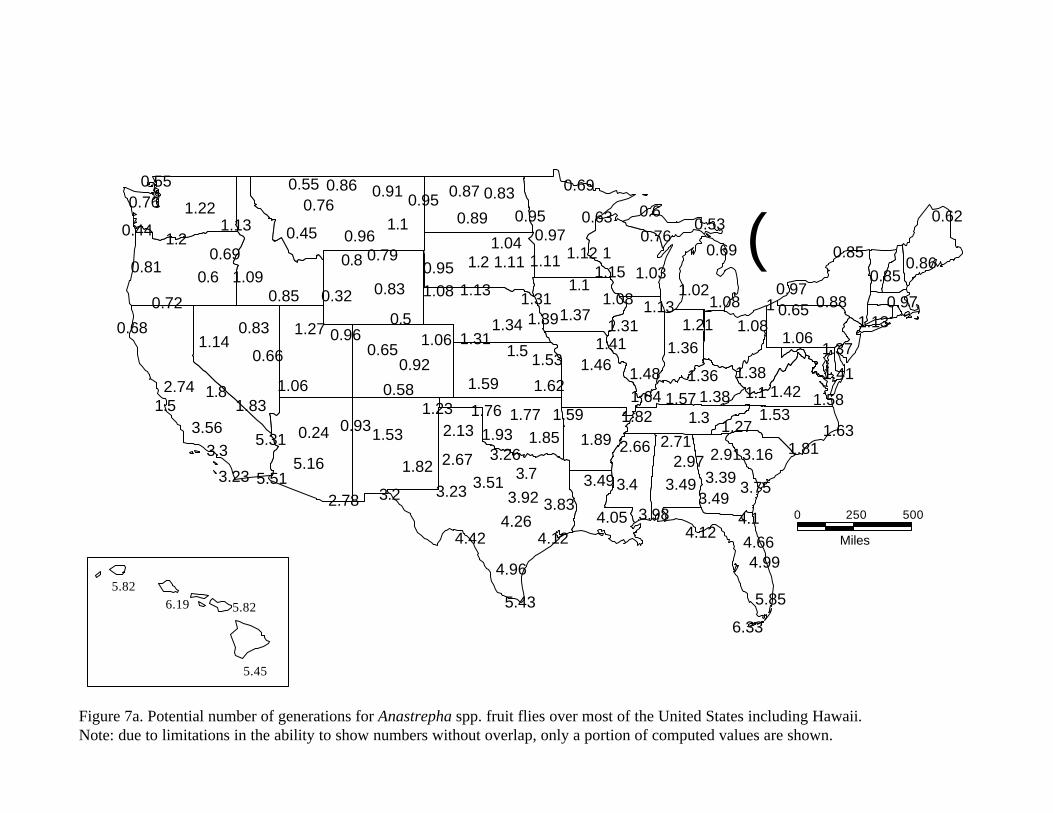
Figure 7a. Potential number of generations for Anastrepha spp. fruit flies over most of the United States including Hawaii.Note: due to limitations in the ability to show numbers without overlap, only a portion of computed values are shown.
5.82
6.19
5.45
5.82
0 250
Miles
500
i
2.972.71
3.98
3.492.78
0.24
5.165.51
4.124.66
5.85
4.1
6.33
4.99
3.49
2.91
3.393.75
3.56
1.8
3.3
0.68
2.741.5
5.31
3.23
4.05
3.493.4
2.66 3.16
3.51
4.96
4.12
2.13
4.26
5.43
3.7
4.42
3.2
2.67
3.833.23 3.92
3.26
1.59
1.89
1.06
0.58
0.920.65
1.13
1.37
1.090.85
1.13
1.131.31
1.48
1.411.21
1.36
1.371.08
1.11.31
1.62
1.5
1.59
1.53
1.57
1.361.381.64
0.86
0.62
1.41
0.97
0.69
1.081.02
0.6
0.760.53
0.970.63
0.69
1.11 1.12
1.46
0.960.45
0.55 0.910.76
0.86
1.1
0.95
1.08
1.341.31
1.39
1.13
1.83
0.83
0.661.14
0.85
1.53
1.230.93
1.82
0.880.97
0.85
1.27 1.631.53
1.81
0.89
0.83
0.95
0.87
1.08
1.76
1.93 1.85
1.77
0.44
0.69
0.60.81
0.72
1.06
0.651
1.041.111.20.95
1.31.82
1.06
1.27 0.96
1.42 1.58
0.55
1.2
1.220.76
1.11.38
11.031.15
0.32 0.83
0.8
0.5
0.79
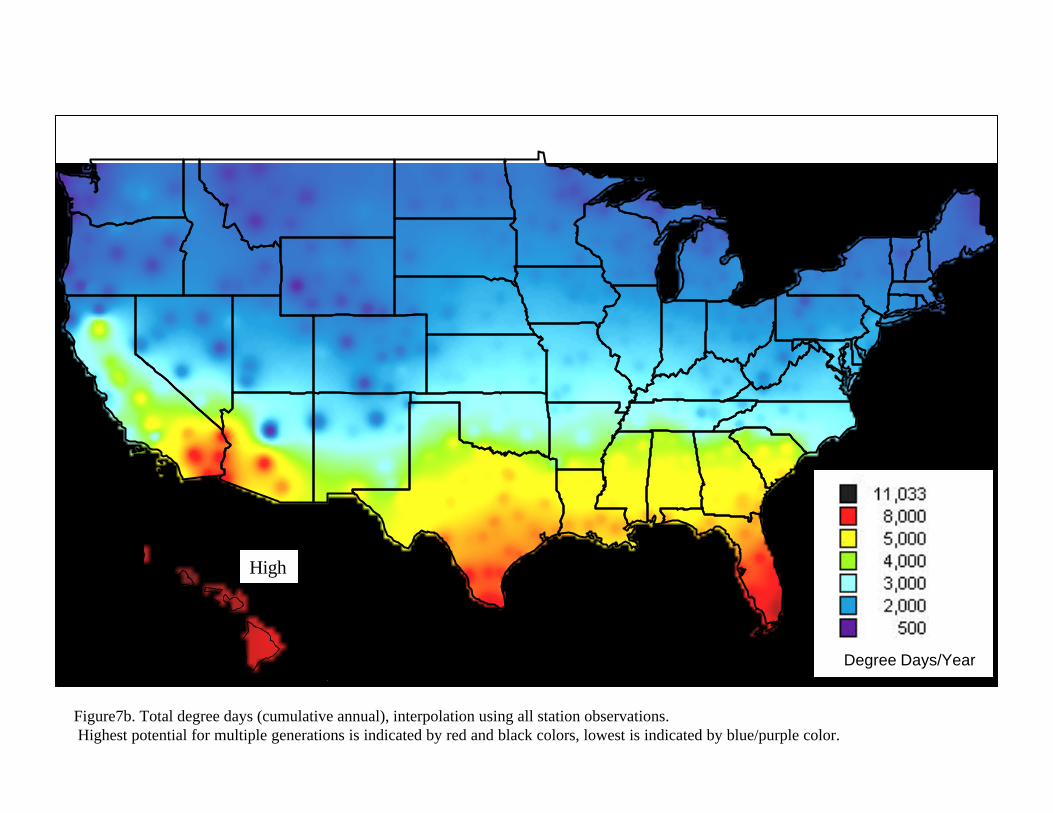
Figure7b. Total degree days (cumulative annual), interpolation using all station observations.Highest potential for multiple generations is indicated by red and black colors, lowest is indicated by blue/purple color.
Degree Days/Year
High
Hawaii
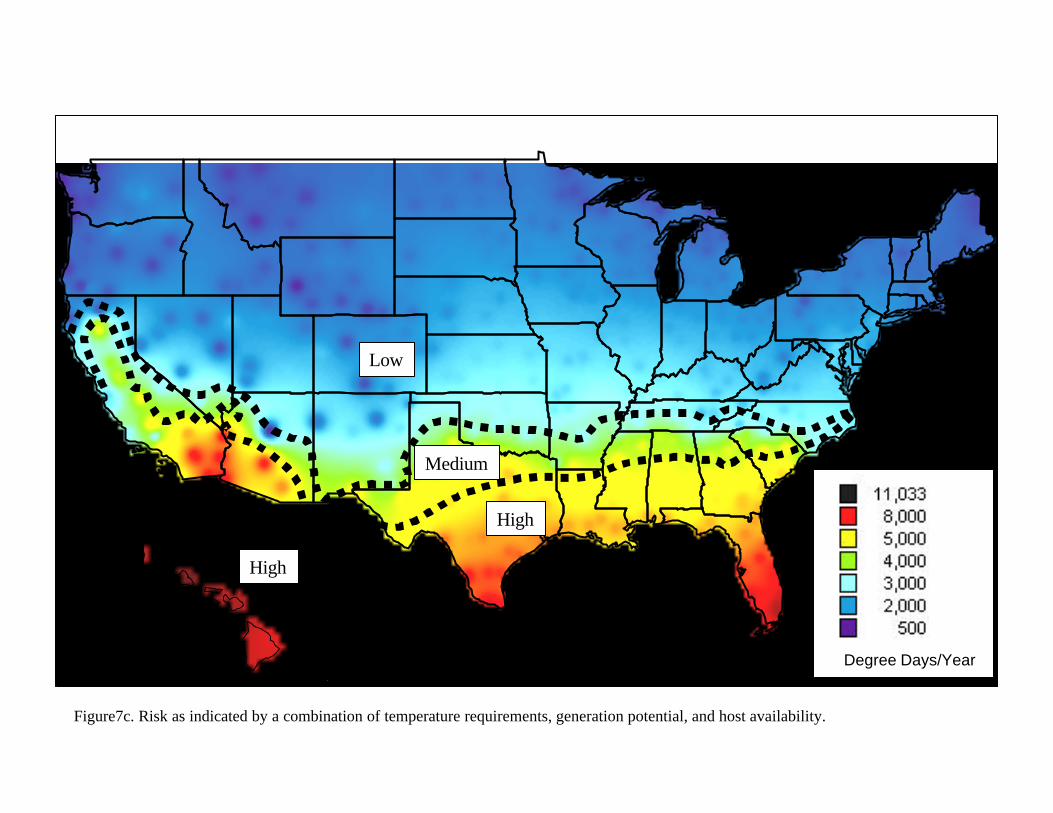
Figure7c. Risk as indicated by a combination of temperature requirements, generation potential, and host availability.
Low
Medium
High
High
Hawaii Degree Days/Year