identification of the function of rv0194 in · pdf filemom and dad, thank you for the...
TRANSCRIPT
1
IDENTIFICATION OF THE FUNCTION OF RV0194
IN MYCOBACTERIUM TUBERCULOSIS
by
RACHEL PHILPOTT
MICHAEL NIEDERWEIS, COMMITTEE CHAIR
ASIM BEJ
VITHAL GHANTA
A THESIS
Submitted to the graduate faculty of The University of Alabama at Birmingham,
in partial fulfillment of the requirements for the degree of Master of Science
BIRMINGHAM, ALABAMA
2009

ii
IDENTIFICATION OF THE FUNCTION OF RV0194
IN MYCOBACTERIUM TUBERCULOSIS
RACHEL PHILPOTT
BIOLOGY
ABSTRACT
Mycobacterium tuberculosis (Mtb), the causative agent of tuberculosis (TB), has
become increasingly resistant to antibiotics due to the lack of new drugs, poor treatment
compliances in certain regions, and the increase of co-infections with HIV/AIDS. Multi-
drug efflux pumps and a highly impermeable outer membrane are predominant factors
that contribute to its intrinsic drug resistance. A better understanding of the molecular
mechanisms of Mtb antibiotic resistance is needed.
A transposon library in Mycobacterium bovis BCG contained a mutant with an in-
sertion upstream of the gene bcg0231. This mutant overexpressed bcg0231 and was ex-
tremely resistant to ampicillin, chloramphenicol, and streptomycin. Expression of the
identical homolog Rv0194 of Mtb in the model organism M. smegmatis increased resis-
tance to multiple drugs via increased drug efflux. Rv0194 is similar to other ABC trans-
porters and, considering the increased resistance to ampicillin of M. bovis BCG and M.
smegmatis upon overexpression of Rv0194, we concluded that Rv0194 is a novel multi-
drug efflux pump and likely functions as the inner membrane component of a multi-
component drug efflux system capable of effluxing drugs across two membranes and out
of the cell.
To begin accessing drug resistance in mycobacteria, accurate antibiotic suscepti-
bility assays must first be established and validated. The Nitrate Reductase Assay (NRA)
was evaluated and compared to the Microplate Alamar Blue Assay. The NRA proved to
iii
be a more advantageous assay when studying Mtb due to time, ease of use, and materials
factors.
To examine the role of Rv0194 in the antibiotic resistance of Mtb, an rv0194 ex-
pression plasmid was constructed. However, the NRA showed only minor increases in
drug resistance. Possible explanations include the lack of upregulation of other proteins
in the multi-component efflux system. Gfp fluorescence was measured in Mtb using a
plasmid expressing a rv0194-gfp fusion demonstrating that Rv0194 is expressed.
An unmarked rv0194 deletion mutant of Mtb was constructed. The NRA did not
reveal any difference in resistance to ampicillin, chloramphenicol, and streptomycin
when Rv0194 was absent. These results suggest that Mtb is able to compensate for the
loss of Rv0194 by using one or several other drug efflux pumps.

iv
ACKNOWLEDGMENTS
I would like to thank my mentor Dr. Michael Niederweis for giving me the oppor-
tunity to study in such an exciting field of research and for his instruction, guidance, and
support throughout my studies in his lab. Thank you to the other members of my commit-
tee, Dr. Asim Bej and Dr. Vithal Ghanta, for their encouragement, guidance and support
throughout this journey. To Dr. Stephen Watts, thank you for your guidance, help, and,
most importantly, for first suggesting the idea of me pursuing a Masters.
Many thanks go to the wonderful people in the Niederweis Lab, Olga Danilchan-
ka, Jason Huff, Chris Jones, Mikhail Pavelnok, Axel Siroy, Alex Speer, Ying Wang,
Ryan Wells, and Frank Wolshendorf, for their assistance, instruction, valuable insight,
support, and friendship! I could not have asked for a better group of people to work with
these past two years!
I would especially like to thank all of my family and friends for their support and
encouragement throughout my studies. Mom and Dad, thank you for the countless calls
and your never ending support and love. Brian, I love you. Rod and Elizabeth, I’ll never
be able to thank you enough for allowing me to be a part of your wonderful family. Elise
and Daniel, thanks for the hugs and kisses that make everything better. Anna, Olivia, and
Randi, thanks for the much needed dinners and chats and for always being there.
v
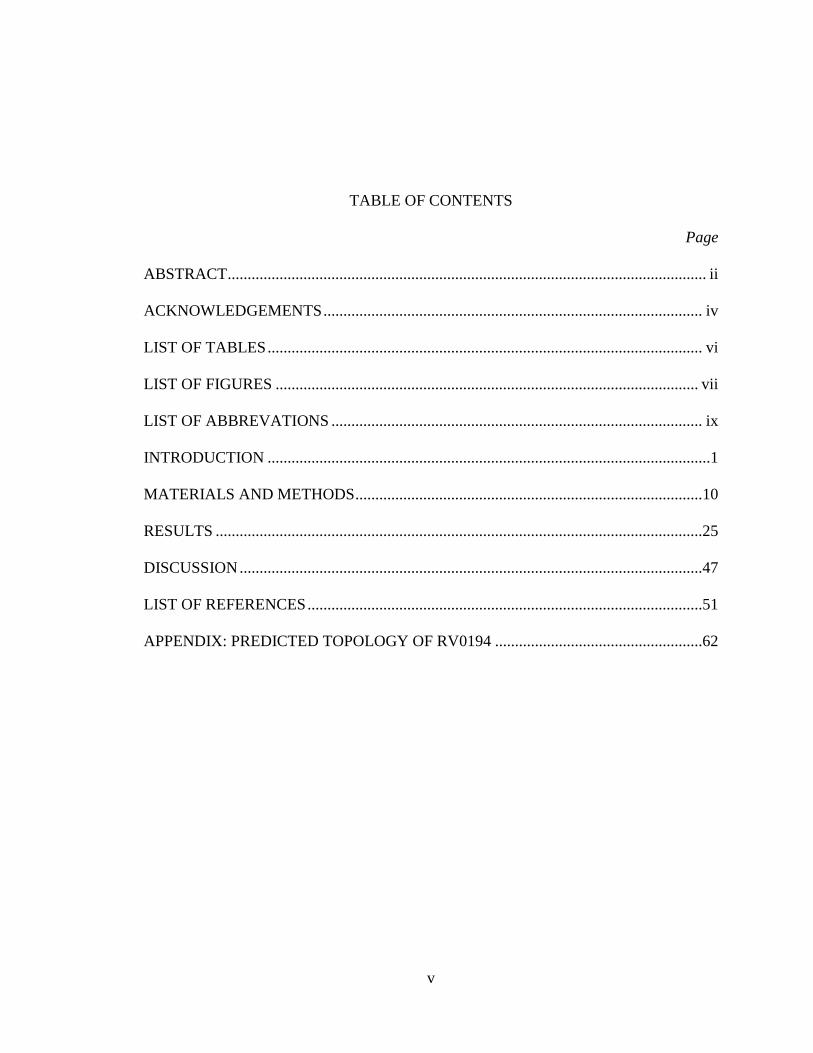
TABLE OF CONTENTS
Page
ABSTRACT ........................................................................................................................ ii
ACKNOWLEDGEMENTS ............................................................................................... iv
LIST OF TABLES ............................................................................................................. vi
LIST OF FIGURES .......................................................................................................... vii
LIST OF ABBREVATIONS ............................................................................................. ix
INTRODUCTION ...............................................................................................................1
MATERIALS AND METHODS .......................................................................................10
RESULTS ..........................................................................................................................25
DISCUSSION ....................................................................................................................47
LIST OF REFERENCES ...................................................................................................51
APPENDIX: PREDICTED TOPOLOGY OF RV0194 ....................................................62
vi
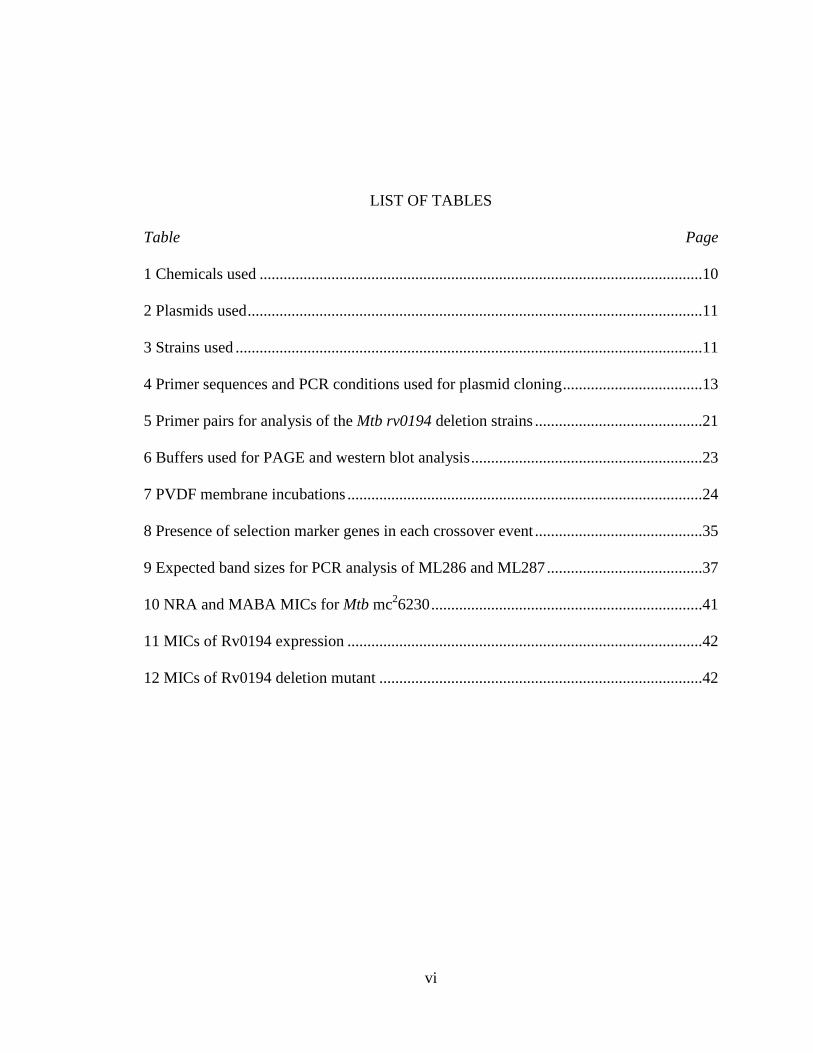
LIST OF TABLES
Table Page
1 Chemicals used ...............................................................................................................10
2 Plasmids used ..................................................................................................................11
3 Strains used .....................................................................................................................11
4 Primer sequences and PCR conditions used for plasmid cloning ...................................13
5 Primer pairs for analysis of the Mtb rv0194 deletion strains ..........................................21
6 Buffers used for PAGE and western blot analysis ..........................................................23
7 PVDF membrane incubations .........................................................................................24
8 Presence of selection marker genes in each crossover event ..........................................35
9 Expected band sizes for PCR analysis of ML286 and ML287 .......................................37
10 NRA and MABA MICs for Mtb mc26230 ....................................................................41
11 MICs of Rv0194 expression .........................................................................................42
12 MICs of Rv0194 deletion mutant .................................................................................42

vii
LIST OF FIGURES
Figure Page
1 Schematic model of drug efflux pumps in Gram-negative bacteria .................................4
2 Proposed structure of the AcrB–AcrA–TolC complex in the
cell envelope of E. Coli .....................................................................................................6
3 The mycobacterial cell envelope contains an outer membrane ........................................8
4 Schematic diagram of the NRA and MABA 96-well plate layout .................................18
5 Cloning of pML850 ........................................................................................................26
6 Digestion of pML850 clones ..........................................................................................26
7 Cloning of pML851 and pML852...................................................................................28
8 Digestion of pML851 clones ..........................................................................................29
9 Digestion of pML852 clones ..........................................................................................29
10 Cloning of pML853 ......................................................................................................30
11 Digestion of pML853 clones ........................................................................................31
12 Cloning of pML855 and pML856.................................................................................32
13 Digestion of pML855 clones ........................................................................................33
14 Digestion of pML856 clones ........................................................................................33
15 Genomic layout of deletion mutant crossover events ..................................................... 34
16 Crossover selection markers analysis ...........................................................................36
17 PCR analysis of ML286 ................................................................................................38
18 PCR analysis of ML287 ................................................................................................39
viii
19 Expression of Rv0194 in Mtb .......................................................................................44
20 Expression of the Rv0194-Gfp+ fusion in Mtb ............................................................45
21 Growth curve ................................................................................................................46
ix
LIST OF ABBREVATIONS
(w/v) percent weight per volume
µg microgram
µL microliters
ABC ATP-binding Cassette
aph kanamycin resistance gene
BCG Bacillus Calmette-Guérin
BME β-mercaptaethanol
BSL2 Biosafety Level 2
BSL3 Biosafety Level 3
CMP chloramphenicol
DCO double crossover
DNA deoxyribonucleic acid
E. Escherichia
ECL enhanced chemoluminescence
EDTA ethylenediaminetetraacetic acid
g gram
Gfp green fluorescence protein
HA hemaglutinin
HCl hydrochloric acid
HIS histadine
x
hyg gene for hygromycin phosphotransferase
Hyg hygromycin B antibiotic
Kan kanamycin antibiotic
kDa kiloDalton
L liter
LB Luria Bertani
M molar
M. Mycobacterium
MABA Microplate Alamar Blue Assay
MDR multidrug resistance
MFS Major Facilitator Superfamily
MIC minimum inhibitory concentration
mL milliliter
mM millimolar
Mtb Mycobacterium tuberculosis
NaCl sodium chloride
nm nanometer
NRA Nitrate Reductase Assay
OADC Oleic Albumin Dextrose Catalase
OD optical density
OM outer membrane
PAGE polyacrylamide gel electrophoresis
PCR polymerase chain reaction
xi
pimyc intermediate mycobacterial promoter
PVDF polyvinylidene fluoride
RND Resistance, Nodulation, and Cell Division
rpm rotations per minute
SCO single crossover
SDS sodium dodecyl sulphate
SMR Small Multidrug Resistance
TAE tris-acetate-EDTA
TB tuberculosis
TEMED N,N,N',N'-Tetramethylethylenediamine
Tris tris-(hydroxymethyl)-aminomethane
Tx tyloxapol
uDCO unmarked double crossover
UV ultraviolet
wt wildtype
XDR extensive drug resistance

1
INTRODUCTION
Drug Resistance of M. tuberculosis Represents a World-wide Problem
Mycobacterium tuberculosis (Mtb) has infected about 2 billion people and causes
the death of about two million people every year, more than any other pathogenic bacte-
rium [1]. Since the lungs of an infected patient contain more than a billion bacilli, poor
treatment compliance selects for multi drug resistant (MDR) strains. In particular, this has
been the case in Russia and other successor states of the former Soviet Union after the
breakdown of the healthcare system [2]. Another threatening development is the AIDS
pandemic in India and Africa with an exponentially increasing number of HIV patients,
whose immune system cannot control infections with Mtb and who primarily die of TB
[3]. TB caused by MDR strains prolongs the treatment time from 6 up to 24 months and
increases the costs per patient by 50-fold up to $100,000 [4]. An even more alarming
finding was the recent discovery of extensively drug resistant strains of Mtb (XDR)
which are resistant to isoniazid and rifampin, any fluoroquinolone and at least one of the
three injectable drugs capreomycin, kanamycin, and amikacin [5-8]. It has the potential to
derail the global efforts to contain HIV/AIDS, as broadly disseminated XDR-TB will
prove to be a much more serious public health threat. Thus, measures to prevent the oc-
currence of MDR and XDR Mtb strains and more effective drugs which reduce the prohi-
bitively long TB chemotherapy are urgently needed.

2
Role of Efflux Pumps in Drug Resistance of M. tuberculosis.
It was found early that Mtb quickly becomes resistant in therapeutic regimens
based on a single drug [9, 10]. Now, many of the mutations that cause resistance are
known to be target mutations [11]. In contrast to most other bacteria, plasmids or transpo-
sons which encode drug inactivating enzymes are unknown in mycobacteria. Neverthe-
less, mycobacteria including Mtb are resistant to many antibiotics and drugs mainly due
to a very impermeable outer membrane (OM) which acts in combination with chromo-
somally encoded -lactamases [12, 13] or multi-drug efflux pumps [14]. Bioinformatic
analysis revealed that Mtb encodes 69 proteins with similarities to drug efflux pumps
[14]. In particular, the drug-efflux pumps Tap [15], Rv1634 [16], Rv1258c [17] and Stp
[18] of the Major Facilitator Superfamily (MFS) confer resistance to aminoglycosides,
tetracycline [15], fluoroquinolones [16], rifampicin, ofloxacin [17], spectinomycin and
tetracycline [18], respectively. MmR of the Small Multidrug Resistance (SMR) family
provides resistance to different antiseptics, drugs, and intercalating dyes [19]. The ATP-
Binding Cassette (ABC) transporters DrrAB [20] and Rv2686c-2687c-2688c [21] confer
resistance to hydrophobic drugs [20] and to fluoroquinolones [21], respectively. The ge-
nome of Mtb also encodes 15 putative transporters of the Resistance, Nodulation and Cell
Division (RND) family called MmpL proteins [14, 22]. It was shown that MmpL7 is in-
deed a drug efflux pump and provides high resistance to isoniazid [23].
Multidrug Efflux Pumps in E. coli.
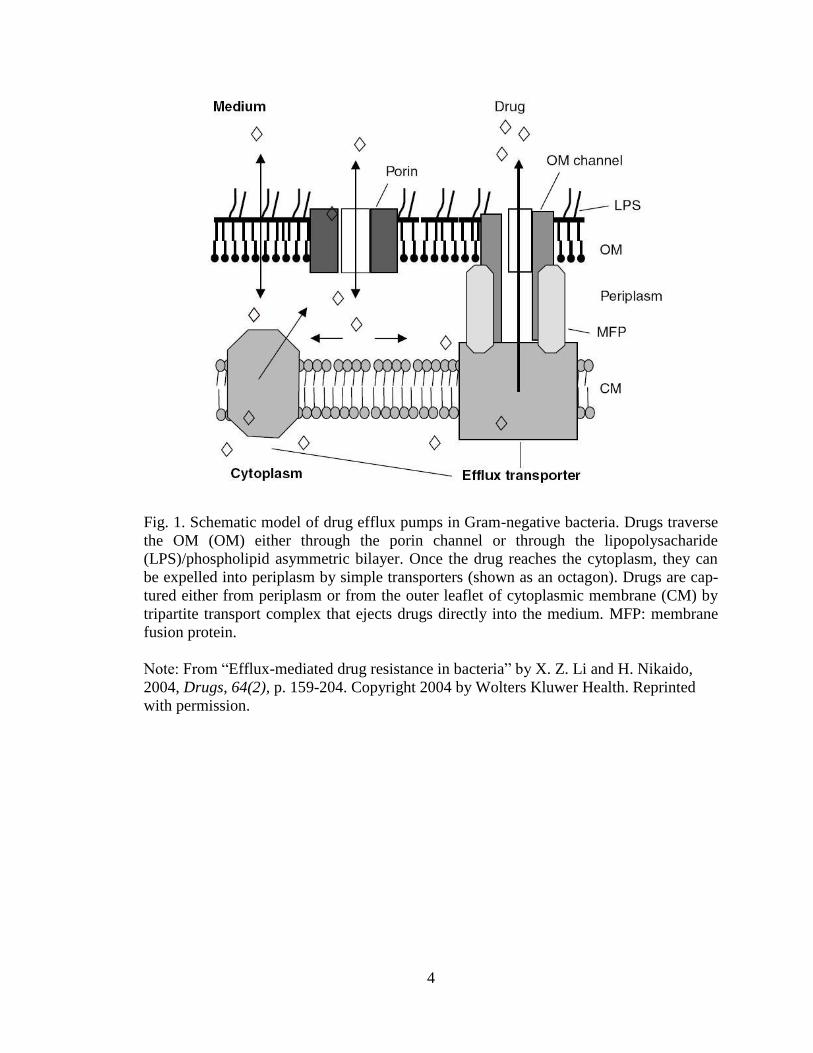
Efflux pumps are inner membrane transporter proteins which use energy (ATP
hydrolysis or proton gradient) to export solutes either into the periplasm or directly into

3
the medium [24] (Fig. 1). The majority of the efflux pumps of Gram-negative bacteria
connect to an OM protein and are especially effective, because they traverse both mem-
branes and pump drugs directly out of the cell and into the external medium [25-27]. For
example transporters of the MFS [28], the ABC superfamily [29] and the RND superfa-
mily [30] require an OM channel for function [31, 32]. AcrB of E. coli belongs to the
RND family and is one of the best examined efflux pumps. AcrB is the inner membrane
component of a tripartite system consisting also of the OM channel TolC and the mem-
brane fusion protein AcrA which is anchored in the inner membrane by an N-terminal
lipid moiety [33-35] (Fig. 1). In a crucial experiment, Sulavik et al. showed that the dele-
tion of TolC alone increased the susceptibility of E. coli to multiple drugs in a similar
manner as the deletion of AcrAB did [36]. Deletion of many other efflux pumps did not
result in increased susceptibilities.
4
Fig. 1. Schematic model of drug efflux pumps in Gram-negative bacteria. Drugs traverse
the OM (OM) either through the porin channel or through the lipopolysacharide
(LPS)/phospholipid asymmetric bilayer. Once the drug reaches the cytoplasm, they can
be expelled into periplasm by simple transporters (shown as an octagon). Drugs are cap-
tured either from periplasm or from the outer leaflet of cytoplasmic membrane (CM) by
tripartite transport complex that ejects drugs directly into the medium. MFP: membrane
fusion protein.
Note: From “Efflux-mediated drug resistance in bacteria” by X. Z. Li and H. Nikaido,
2004, Drugs, 64(2), p. 159-204. Copyright 2004 by Wolters Kluwer Health. Reprinted
with permission.
5
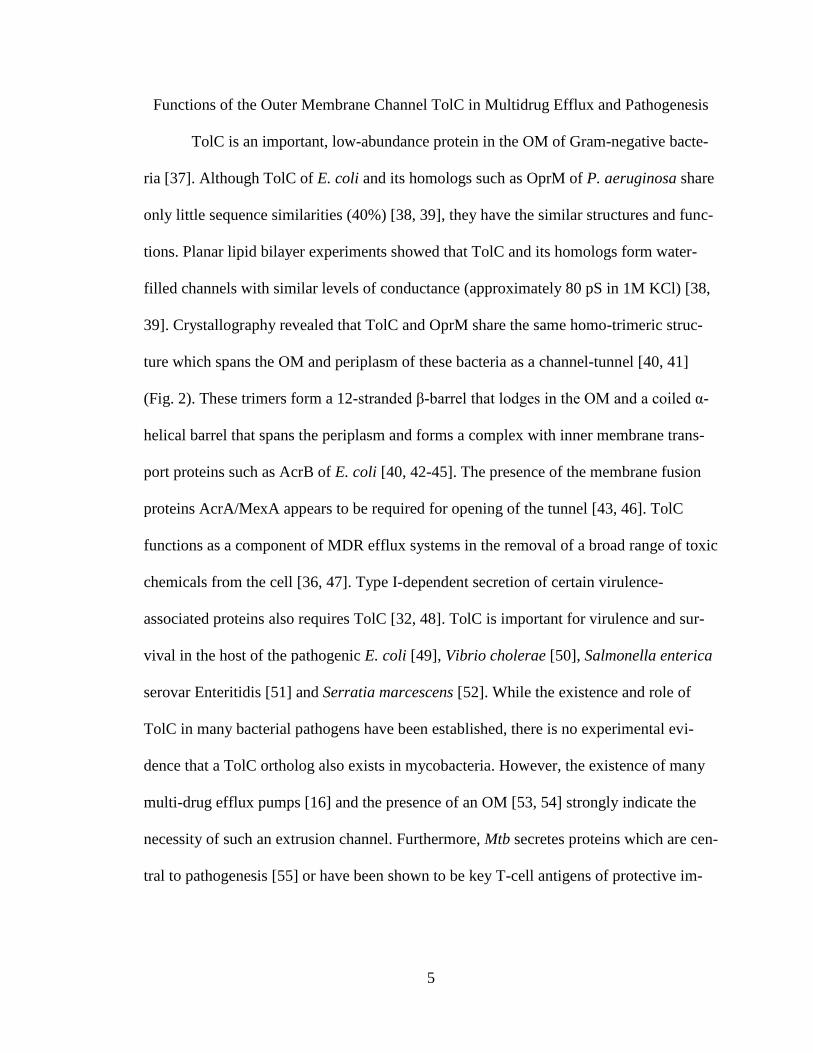
Functions of the Outer Membrane Channel TolC in Multidrug Efflux and Pathogenesis
TolC is an important, low-abundance protein in the OM of Gram-negative bacte-
ria [37]. Although TolC of E. coli and its homologs such as OprM of P. aeruginosa share
only little sequence similarities (40%) [38, 39], they have the similar structures and func-
tions. Planar lipid bilayer experiments showed that TolC and its homologs form water-
filled channels with similar levels of conductance (approximately 80 pS in 1M KCl) [38,
39]. Crystallography revealed that TolC and OprM share the same homo-trimeric struc-
ture which spans the OM and periplasm of these bacteria as a channel-tunnel [40, 41]
(Fig. 2). These trimers form a 12-stranded β-barrel that lodges in the OM and a coiled α-
helical barrel that spans the periplasm and forms a complex with inner membrane trans-
port proteins such as AcrB of E. coli [40, 42-45]. The presence of the membrane fusion
proteins AcrA/MexA appears to be required for opening of the tunnel [43, 46]. TolC
functions as a component of MDR efflux systems in the removal of a broad range of toxic
chemicals from the cell [36, 47]. Type I-dependent secretion of certain virulence-
associated proteins also requires TolC [32, 48]. TolC is important for virulence and sur-
vival in the host of the pathogenic E. coli [49], Vibrio cholerae [50], Salmonella enterica
serovar Enteritidis [51] and Serratia marcescens [52]. While the existence and role of
TolC in many bacterial pathogens have been established, there is no experimental evi-
dence that a TolC ortholog also exists in mycobacteria. However, the existence of many
multi-drug efflux pumps [16] and the presence of an OM [53, 54] strongly indicate the
necessity of such an extrusion channel. Furthermore, Mtb secretes proteins which are cen-
tral to pathogenesis [55] or have been shown to be key T-cell antigens of protective im-

6
munity against tuberculosis [56]. However, secretion pathways across the OM of Mtb are
unknown.
Fig. 2. Proposed structure of the AcrB–AcrA–TolC complex in the cell envelope of
E. coli. The TolC structure was manually docked to AcrB. Dotted ovals indicate AcrA
molecules. The figure was taken from [44].
Note: From “Crystal structure of bacterial multidrug efflux transporter ArcB” by S. Mu-
rakami et al., 2002, Nature, 419(6907), p. 587-593. Copyright 2002 by Nature Publishing
Group. Reprinted with permission.
The Cell Envelope of Mycobacteria Contains an Outer Membrane
Mycobacteria, unlike other gram-positive bacteria, have evolved a very complex
cell wall comprising a peptidoglycan-arabinogalactan polymer with covalently bound
mycolic acids of considerable size (up to 90 carbon atoms), a large variety of extractable
lipids [57, 58] and surface-accessible pore-forming membrane proteins outside the cytop-
7
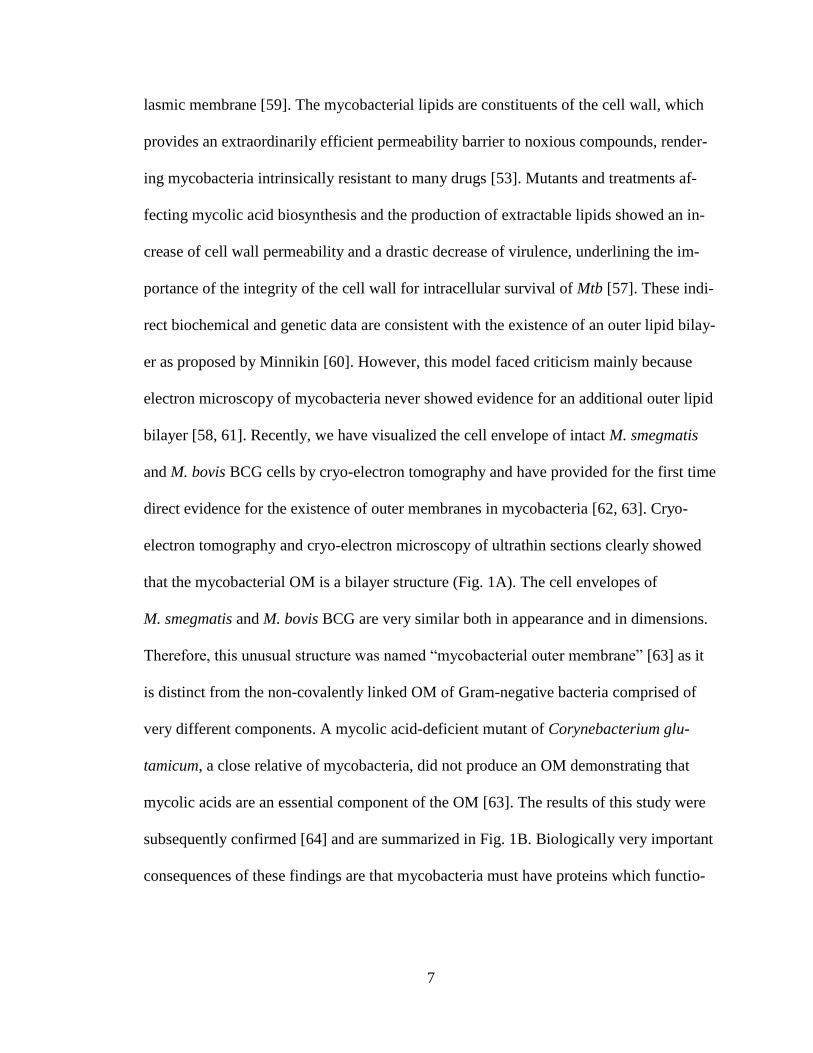
lasmic membrane [59]. The mycobacterial lipids are constituents of the cell wall, which
provides an extraordinarily efficient permeability barrier to noxious compounds, render-
ing mycobacteria intrinsically resistant to many drugs [53]. Mutants and treatments af-
fecting mycolic acid biosynthesis and the production of extractable lipids showed an in-
crease of cell wall permeability and a drastic decrease of virulence, underlining the im-
portance of the integrity of the cell wall for intracellular survival of Mtb [57]. These indi-
rect biochemical and genetic data are consistent with the existence of an outer lipid bilay-
er as proposed by Minnikin [60]. However, this model faced criticism mainly because
electron microscopy of mycobacteria never showed evidence for an additional outer lipid
bilayer [58, 61]. Recently, we have visualized the cell envelope of intact M. smegmatis
and M. bovis BCG cells by cryo-electron tomography and have provided for the first time
direct evidence for the existence of outer membranes in mycobacteria [62, 63]. Cryo-
electron tomography and cryo-electron microscopy of ultrathin sections clearly showed
that the mycobacterial OM is a bilayer structure (Fig. 1A). The cell envelopes of
M. smegmatis and M. bovis BCG are very similar both in appearance and in dimensions.
Therefore, this unusual structure was named “mycobacterial outer membrane” [63] as it
is distinct from the non-covalently linked OM of Gram-negative bacteria comprised of
very different components. A mycolic acid-deficient mutant of Corynebacterium glu-
tamicum, a close relative of mycobacteria, did not produce an OM demonstrating that
mycolic acids are an essential component of the OM [63]. The results of this study were
subsequently confirmed [64] and are summarized in Fig. 1B. Biologically very important
consequences of these findings are that mycobacteria must have proteins which functio-

8
nalize the periplasm and the outer membrane. Transport mechanisms across this OM are
unknown for Mtb as well as the identity of the proteins involved in these processes.
Fig. 3. The mycobacterial cell envelope contains an outer membrane.
A. Cryoelectron micrographs of vitreous cryosections from M. bovis BCG.
B. Schematic representation of the mycobacterial cell envelope based on cryoelectron
micrographs. Mycolic acids are covalently linked to the arabinogalactan (AG) – pepti-
doglycan (PG) copolymer and are an essential component of the inner leaflet of the my-
cobacterial outer membrane (MOM). IM: inner membrane. Extractable lipids are
represented in black. Proteins such as porins mediate the entry of hydrophilic solutes.
These proteins are unknown for Mtb. Hydrophobic compounds are assumed to diffuse
directly across the OM. Dimensions are drawn to scale.
Identification of a Novel Multidrug Efflux Pump in Mtb
The impermeability of the outer membrane in combination with drug efflux are
major determinants of the natural drug resistance of mycobacteria. β-Lactams are the
most widely used antibiotics for treatment of bacterial infections. However, it is unknown
how β-lactams enter Mtb and whether efflux pumps exist that can export these drugs out
of the cell. To identify the molecular mechanisms of Mtb’s resistance to β-lactams, a li-

9
brary of 7,500 transposon mutants was generated in the model organism Mycobacterium
bovis BCG. Thirty-three unique insertion sites were determined that conferred medium or
high-level (>2,000 µg/ml) resistance to ampicillin. Three mutants in sulfolipid synthesis
or transport were highly resistant to ampicillin, indicating an indirect effect of the lipid
composition on the outer membrane permeability of M. bovis BCG to ampicillin. Mutants
with insertions in genes encoding surface molecules such as PPE proteins or lipoarabi-
nomannan were also completely resistant to ampicillin, thus suggesting a lack of trans-
port across the outer membrane. Insertion of the transposon in front of bcg0231 increased
transcription of the gene and concomitantly the resistance of M. bovis BCG to ampicillin,
streptomycin, and chloramphenicol by 32- to 64-fold. Resistance to vancomycin and te-
tracycline was increased four- to eightfold. Bcg0231 and Rv0194 are almost identical
ATP-binding cassette transporters. Expression of rv0194 significantly reduced accumula-
tion of ethidium bromide and conferred multidrug resistance to M. smegmatis. Both ef-
fects were abrogated in the presence of the efflux pump inhibitor reserpine. These results
demonstrate that Rv0194 is a novel multidrug efflux pump of Mtb [65].
10
MATERIALS AND METHODS
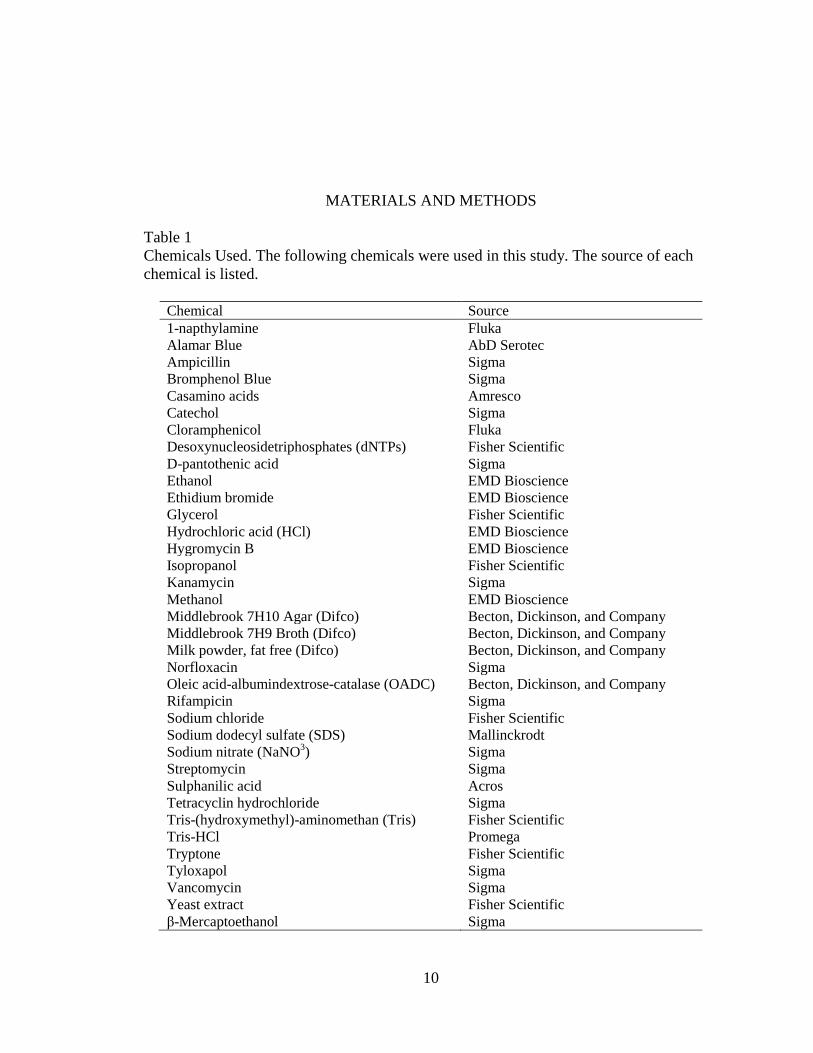
Table 1
Chemicals Used. The following chemicals were used in this study. The source of each
chemical is listed.
Chemical Source
1-napthylamine Fluka
Alamar Blue AbD Serotec
Ampicillin Sigma
Bromphenol Blue Sigma
Casamino acids Amresco
Catechol Sigma
Cloramphenicol Fluka
Desoxynucleosidetriphosphates (dNTPs) Fisher Scientific
D-pantothenic acid Sigma
Ethanol EMD Bioscience
Ethidium bromide EMD Bioscience
Glycerol Fisher Scientific
Hydrochloric acid (HCl) EMD Bioscience
Hygromycin B EMD Bioscience
Isopropanol Fisher Scientific
Kanamycin Sigma
Methanol EMD Bioscience
Middlebrook 7H10 Agar (Difco) Becton, Dickinson, and Company
Middlebrook 7H9 Broth (Difco) Becton, Dickinson, and Company
Milk powder, fat free (Difco) Becton, Dickinson, and Company
Norfloxacin Sigma
Oleic acid-albumindextrose-catalase (OADC) Becton, Dickinson, and Company
Rifampicin Sigma
Sodium chloride Fisher Scientific
Sodium dodecyl sulfate (SDS) Mallinckrodt
Sodium nitrate (NaNO3) Sigma
Streptomycin Sigma
Sulphanilic acid Acros
Tetracyclin hydrochloride Sigma
Tris-(hydroxymethyl)-aminomethan (Tris) Fisher Scientific
Tris-HCl Promega
Tryptone Fisher Scientific
Tyloxapol Sigma
Vancomycin Sigma
Yeast extract Fisher Scientific
β-Mercaptoethanol Sigma
11
Bacterial Strains, Media, Transformations and Growth Conditions
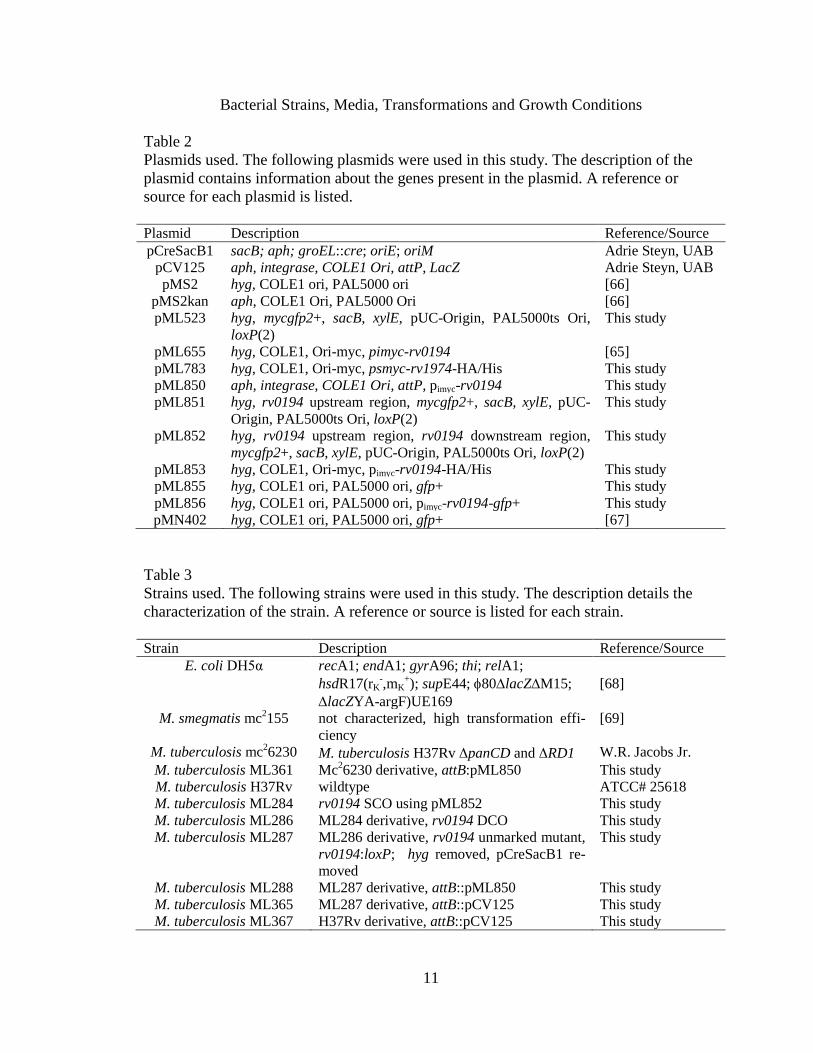
Table 2
Plasmids used. The following plasmids were used in this study. The description of the
plasmid contains information about the genes present in the plasmid. A reference or
source for each plasmid is listed.
Plasmid Description Reference/Source
pCreSacB1 sacB; aph; groEL::cre; oriE; oriM Adrie Steyn, UAB
pCV125 aph, integrase, COLE1 Ori, attP, LacZ Adrie Steyn, UAB
pMS2 hyg, COLE1 ori, PAL5000 ori [66]
pMS2kan aph, COLE1 Ori, PAL5000 Ori [66]
pML523 hyg, mycgfp2+, sacB, xylE, pUC-Origin, PAL5000ts Ori,
loxP(2)
This study
pML655 hyg, COLE1, Ori-myc, pimyc-rv0194 [65]
pML783 hyg, COLE1, Ori-myc, psmyc-rv1974-HA/His This study
pML850 aph, integrase, COLE1 Ori, attP, pimyc-rv0194 This study
pML851 hyg, rv0194 upstream region, mycgfp2+, sacB, xylE, pUC-
Origin, PAL5000ts Ori, loxP(2)
This study
pML852 hyg, rv0194 upstream region, rv0194 downstream region,
mycgfp2+, sacB, xylE, pUC-Origin, PAL5000ts Ori, loxP(2)
This study
pML853 hyg, COLE1, Ori-myc, pimyc-rv0194-HA/His This study
pML855 hyg, COLE1 ori, PAL5000 ori, gfp+ This study
pML856 hyg, COLE1 ori, PAL5000 ori, pimyc-rv0194-gfp+ This study
pMN402 hyg, COLE1 ori, PAL5000 ori, gfp+ [67]
Table 3
Strains used. The following strains were used in this study. The description details the
characterization of the strain. A reference or source is listed for each strain.
Strain Description Reference/Source
E. coli DH5α recA1; endA1; gyrA96; thi; relA1;
hsdR17(rK-,mK
+); supE44; 80lacZM15;
lacZYA-argF)UE169
[68]
M. smegmatis mc2155 not characterized, high transformation effi-
ciency
[69]
M. tuberculosis mc26230 M. tuberculosis H37Rv panCD and RD1 W.R. Jacobs Jr.
M. tuberculosis ML361 Mc26230 derivative, attB:pML850 This study
M. tuberculosis H37Rv wildtype ATCC# 25618
M. tuberculosis ML284 rv0194 SCO using pML852 This study
M. tuberculosis ML286 ML284 derivative, rv0194 DCO This study
M. tuberculosis ML287 ML286 derivative, rv0194 unmarked mutant,
rv0194:loxP; hyg removed, pCreSacB1 re-
moved
This study
M. tuberculosis ML288 ML287 derivative, attB::pML850 This study
M. tuberculosis ML365 ML287 derivative, attB::pCV125 This study
M. tuberculosis ML367 H37Rv derivative, attB::pCV125 This study
12
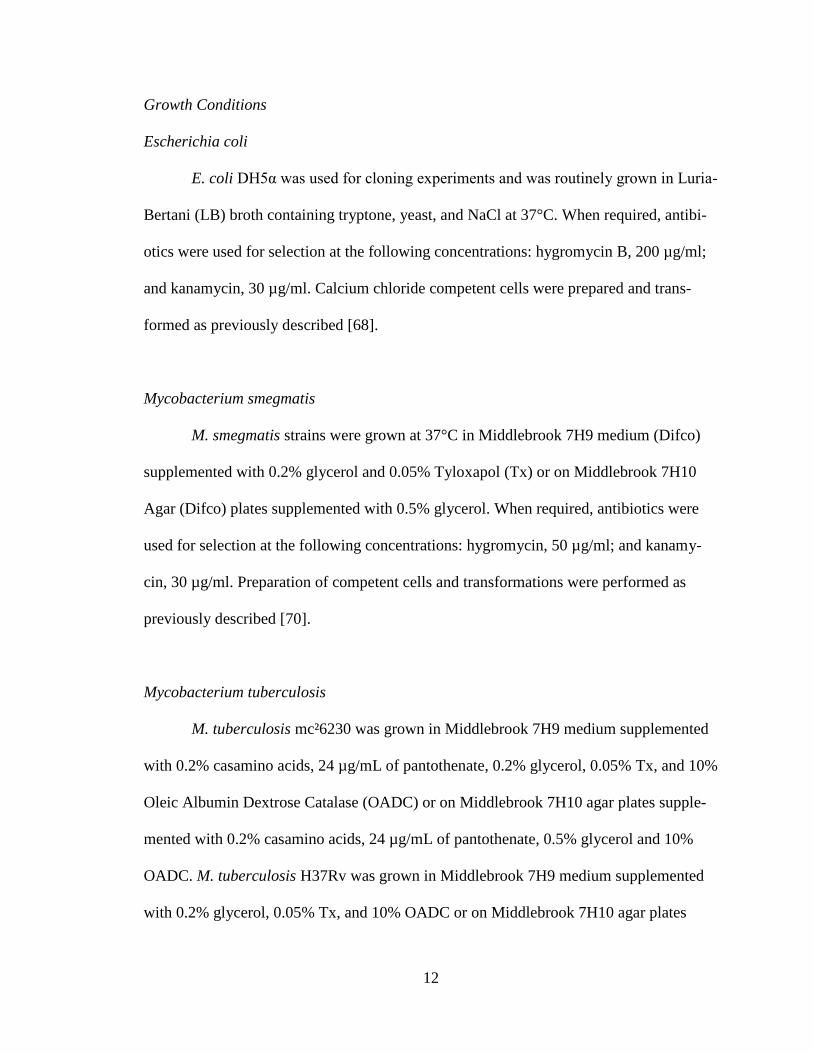
Growth Conditions
Escherichia coli
E. coli DH5α was used for cloning experiments and was routinely grown in Luria-
Bertani (LB) broth containing tryptone, yeast, and NaCl at 37°C. When required, antibi-
otics were used for selection at the following concentrations: hygromycin B, 200 µg/ml;
and kanamycin, 30 µg/ml. Calcium chloride competent cells were prepared and trans-
formed as previously described [68].
Mycobacterium smegmatis
M. smegmatis strains were grown at 37°C in Middlebrook 7H9 medium (Difco)
supplemented with 0.2% glycerol and 0.05% Tyloxapol (Tx) or on Middlebrook 7H10
Agar (Difco) plates supplemented with 0.5% glycerol. When required, antibiotics were
used for selection at the following concentrations: hygromycin, 50 µg/ml; and kanamy-
cin, 30 µg/ml. Preparation of competent cells and transformations were performed as
previously described [70].
Mycobacterium tuberculosis
M. tuberculosis mc²6230 was grown in Middlebrook 7H9 medium supplemented
with 0.2% casamino acids, 24 µg/mL of pantothenate, 0.2% glycerol, 0.05% Tx, and 10%
Oleic Albumin Dextrose Catalase (OADC) or on Middlebrook 7H10 agar plates supple-
mented with 0.2% casamino acids, 24 µg/mL of pantothenate, 0.5% glycerol and 10%
OADC. M. tuberculosis H37Rv was grown in Middlebrook 7H9 medium supplemented
with 0.2% glycerol, 0.05% Tx, and 10% OADC or on Middlebrook 7H10 agar plates

13
supplemented with 0.5% glycerol and 10% OADC. When required, antibiotics were used
at the following concentrations: hygromycin B, 50 µg/ml; and kanamycin, 30 µg/ml.
Preparation of competent cells and transformations were performed as previously de-
scribed [70].
Plasmid Cloning
Polymerase Chain Reaction Conditions
When indicated, polymerase chain reaction (PCR) was performed using either
iProof mix (BioRad) or Expand High Fidelity Enzyme Mix (Roche). Conditions were
determined by the accompanying manuals.
Table 4
Primer sequences and PCR conditions used for plasmid clonings. The following primer
pairs were used during PCR of cloning steps. The nucleotide sequence is listed from 5’ to
3’. Restriction sites introduced are underlined in the sequence. The conditions under
which the primer pairs were used are recorded.
Primer
Pairs Sequence (5’-3’)
Conditions
Used
CN1262 GACTAGTGATATGCAGCATGTTGTCCTG iProof
CN1263 GCATTTAAATTGGGCAATTCGACCGCCGTAG
CN1277 CGTTAATTAACACCCTCACCCTGGCAGCCC iProof
CN1278 CGATGCATCACGTTCGGGGAGTCGCAG
CN0131 CTCTAGGGTCCCCAATTAATTAGC iProof
CN1319 GTTAACATGGCTAGCAAAGGAGAAG
CN1169 AATATTATCGATTAGCTAAGCAGAAGGCCATCCTGAC Expand High
Fidelity CN1316 GCGATATCTGCGTCAATACATTGAAGCTGAG
CN1169 AATATTATCGATTAGCTAAGCAGAAGGCCATCCTGAC Expand High
Fidelity CN1320 CGGTTAACTGCGTCAATACATTGAAGCTG

14
DNA Analysis
Plasmid preparation from E. coli was performed using the Fast Plasmid Mini Kit
and Manual (Eppendorf) and the Plasmid Midi Kit (Quaigen) according to the manuals.
Recovery of DNA from gels and solutes was performed using the GFX purification kit
and manual (GE Healthcare). Plasmid DNA samples were analyzed using gel electropho-
resis as previously described [68]. Chromosomal DNA from mycobacteria was prepared
as previously described [71] and analyzed using PCR. After ligation of cloned plasmids
and transformation into competent cells, colonies grown in the presence of the appropri-
ate antibiotic were selected and grown in liquid culture. The 2-log DNA ladder (New
England Biolabs) was loaded as a marker for size reference. A control digest was done on
candidates that appeared to be the correct size. Candidates exhibiting the correct expected
DNA bands after the control digestion were then sequenced at the University of Alabama
at Birmingham DNA Sequencing Core to confirm the successful clone. Restriction en-
zymes were obtained from New England Biolabs and the accompanying protocols were
followed.
Rv0194 Integrative Expression Vector
For the cloning of the rv0194 integrative expression vector pML850 the pCV125
vector was used as the backbone and the pML655 plasmid was used for the insertion of
rv0194 with the pimyc mycobacterial promoter. DNA digestions using the restriction en-
zymes NotI for pCV125 and ClaI for pML655 were performed. The 5’ overhanging ends
were removed by T4 DNA polymerase (New England Biolabs) following the NotI & ClaI
digestions. Both plasmids were then digested using XbaI. The backbone from pCV125

15
and the insert from pML655 were cloned together using T4 DNA ligase (Invitrogen) to
create the pML850 plasmid. A control digest using the restriction enzymes SpeI and SphI
was performed to confirm positive pML850 clones.
Rv0194 Deletion Vector
For the cloning of the deletion vector to create an rv0194 deletion mutant an in-
termediate plasmid was first constructed. This was achieved by amplifying the upstream
region of the rv0194 gene from genomic DNA of M. tuberculosis H37Rv (obtained from
Colorado State University as part of National Institutes of Health, [NIAID] contract
HHSN266200400091C entitled “Tuberculosis Vaccine Testing and Research Materials”)
using the oligonuctotides CN1262 and CN1263 (Table 4), which introduced the restric-
tion sites SpeI at the 5’ end and SwaI at the 3’ end. The fragment and the plasmid
pML523 (Table 2) were both digested with SpeI and SwaI and ligated using T4 DNA li-
gase to create pML851. A control digest using the MscI restriction enzyme was used to
identify potential positive clones. Sequencing results were obtained to confirm the posi-
tive pML851 clones. Next the downstream region of the rv0194 gene was amplified from
the genomic DNA of M. tuberculosis H37Rv using the oligonucleotides CN1277 and
CN1278 (Table 4). This created the PacI restriction site at the 5’ end and the NsiI restric-
tion site at the 3’ end. The fragment and pML851 were both digested with PacI and NsiI.
The vector was de-phosphorylated using Antarctic Phosphotase (New England Biolabs)
to facilitate ligation with the insert using T4 DNA Ligase, thus creating pML852. Poten-
tially positive candidates were digested with the restriction enzyme MscI. Sequencing
results were obtained to confirm the pML852 plasmid.

16
Rv0194 HA/His Tagged Replicative Vector
The construction of a replicative plasmid containing rv0194 with a C-terminal
HA/His tag comprised of a hemagglutinin (HA) epitope tag and a histadine (HIS) rich
region was achieved by cloning the pimyc promoter and the rv0194 gene into pML783
(Table 2). pimyc and rv0194 were amplified from pML655 using the oligonucleotides
CN0131 and CN1319 (Table 4), which created an EcoRV restriction site at the 3’ end of
the gene. Both the fragment and the plasmid were digested using the restriction endonuc-
leases XbaI and EcoRV and cloned into pML853 using T4 DNA Ligase. Potential posi-
tive clones were digested using the ClaI and PmeI restriction enzymes and sequenced to
confirm the positive pML853 candidates.
Rv0194 Gfp Tagged Replicative Vector
Construction of a replicative plasmid containing a C-terminal gfp tag first re-
quired the creation of an intermediate plasmid. The gfp+ gene was amplified from the
pMN402 plasmid (Table 2) using the oligonucleotides CN1169 and CN1316, which
created a HpaI restriction site at the 5’ end. The fragment was digested using the restric-
tion endonuclease PstI. The pMS2 plasmid was digested with PstI and SwaI. The vector
was then de-phosphorylated using Antarctic Phosphotase to facilitate ligation with the
fragment using T4 DNA ligase to create the pML855 plasmid. Potential positive clones
were digested using the ClaI and PmeI restriction enzymes and sequenced to confirm the
positive pML855 candidates. The introduced HpaI site allows for genes to easily be
cloned into the pML855 plasmid. Next pimyc and rv0194 were amplified from pML655
using the oligonucleotides CN1169 and CN1320, which created a HpaI restriction site at

17
the 3’ end of the gene. Both the fragment and the pML855 gene were digested using XbaI
and HpaI and the pML855 vector was de-phosphorylated using Antarctic Phosphotase
before ligation with T4 DNA ligase, thus creating the pML856 plasmid. Potential positive
clones were digested using the PmeI, ClaI, and HindIII restriction enzymes and se-
quenced to confirm the positive pML856 candidates.
Nitrate Reductase Assay
The Nitrate Reductase Assay was performed as previously described [72] with the
following modifications. Bacterial cultures were grown under standard conditions in 10
mL of liquid media until an OD600 of around 1.0 was reached. The cultures were then di-
luted to an OD600 of 0.04 into standard liquid media supplemented with NaNO3
(1mg/mL). In a 96 well plate, 200 µL of sterile Millipore water was added to all perime-
ter wells and 100 uL of standard liquid media supplemented with NaNO3 was added to all
inner wells. 100 uL of a 4-fold concentrated drug solution was added to the bottom row
of wells. 100 uL was transferred upwards to perform serial dilutions, discarding the last
100 uL of excess media. One column was used for growth and medium controls, with
200 uL total in each well. 100uL of the diluted bacterial culture was then added to each
well containing antibiotic and to the growth control wells (Figure 4). The plates were
sealed with aluminum foil and incubated at 37⁰ C under continuous agitation at 230 rpm.
After the incubation period, 50 uL of a reagent mixture containing 1 part 50% HCl, 2
parts 0.2% sulphanilic acid, and 2 parts 0.1% 1-napththylamine was added to a growth
control well. If the well turned pink, 50 uL of the reagent mixture was added to all re-
maining inner wells. Absorbance at 570 nm may be measured using a microplate reader

18
(Synergy HT microplate reader, Bio-Tek). Data was analyzed using Microsoft Excel.
Background subtractions using the OD570 values of the medium controls were performed
on all well values. The relative viability [%] was defined as Test well OD570 / Mean drug-
free wells OD570 x 100 %. The minimum inhibitory concentration (MIC) was set as a
10% relative viability or at 20% relative viability when indicated.
Figure 4. Schematic diagram of the NRA and MABA 96-well plate layout. Water is add-
ed to all perimeter wells. Three wells contain only medium (medium control). Three
wells contain medium and cells to represent a drug free control. The remaining wells con-
tain medium, cells, and antibiotics. Antibiotics are analyzed in triplicate with concentra-
tions increasing down the column.
Comparison of Nitrate Reductase Assay and Microplate Alamar Blue Assay
For the comparison of NRA to the Microplate Alamar Blue Assay (MABA) M.
tuberculosis mc26230 was used. NRA was performed as mentioned previously in this
work and MABA was performed as previously described [72], [65]. All steps were car-
ried out the same for both NRA and MABA except where mentioned otherwise. Drugs
were tested in triplicate and final drug concentrations were as follows: ampicillin, 60-
1,920 µg; chloramphenicol and streptymocin, 1-32 µg; novobiacin and vancomycin, 4-
128 µg; erythromycin, 2-64 µg; norfloxacin, 0.5-16 µg; rifampicin, 0.03-1 µg; tetracyc-
lin, 16-512 µg. On day 5 of the plate incubation the NRA reagent mixture was added to
1 2 3 4 5 6 7 8 9 10 11 12 Water
Drug Free Control
Medium Control
Antibiotic 1
Antibiotic 2
Antibiotic 3
A
D
C
B
G
F
E
H

19
the NRA plates and the alamar blue mixture (1 part alamar blue + 1 part 10% Tx) was
added to the MABA plates. The NRA plates were then ready to be analyzed. The MABA
plates were re-sealed and incubated for another 24 hours. On day 6 the contents of the
MABA plates were transferred to black clear bottom 96 well plates. Fluorescence was
measured at an excitation wavelength of 530 nm and an emission wavelength of 590 nm
(Synergy HT microplate reader, Bio-Tek).
Determination of Antibiotic Susceptibility
The NRA method previously described in this work was used to compare the
MICs of wildtype (wt) M. tuberculosis H37Rv and ML287. The following concentrations
of antibiotics were used: ampicillin, 120-3,840 µg/mL; chloramphenicol, 1-32 µg/mL;
streptomycin, 0.25-8 µg/mL. The MICs were also determined for the ML361 strain. The
following concentrations of antibiotics were used: ampicillin, 120-3,840 µg/mL; chlo-
ramphenicol, 0.5-16 µg/mL; streptomycin, 2-64 µg/mL.
Construction of the Deletion Mutant
The rv0194 deletion vector pML852, which carries the reporter genes mycgfp2+
and xylE, was transformed into M. tuberculosis H37Rv competent cells by electropora-
tion, selected on Middlebrook 7H10 plates supplemented with 10% OADC and Hyg, and
incubated at 37°C. After three weeks a single colony that exhibited Gfp fluorescence and
turned yellow in the presence of 1% catehol was picked and used to inoculate 10 ml of
Middlebrook 7H9/OADC/Hyg medium. The culture was incubated at 37°C under con-
stant agitation until an OD600 exceeding 1.0 was reached. Then 100 µl were plated on
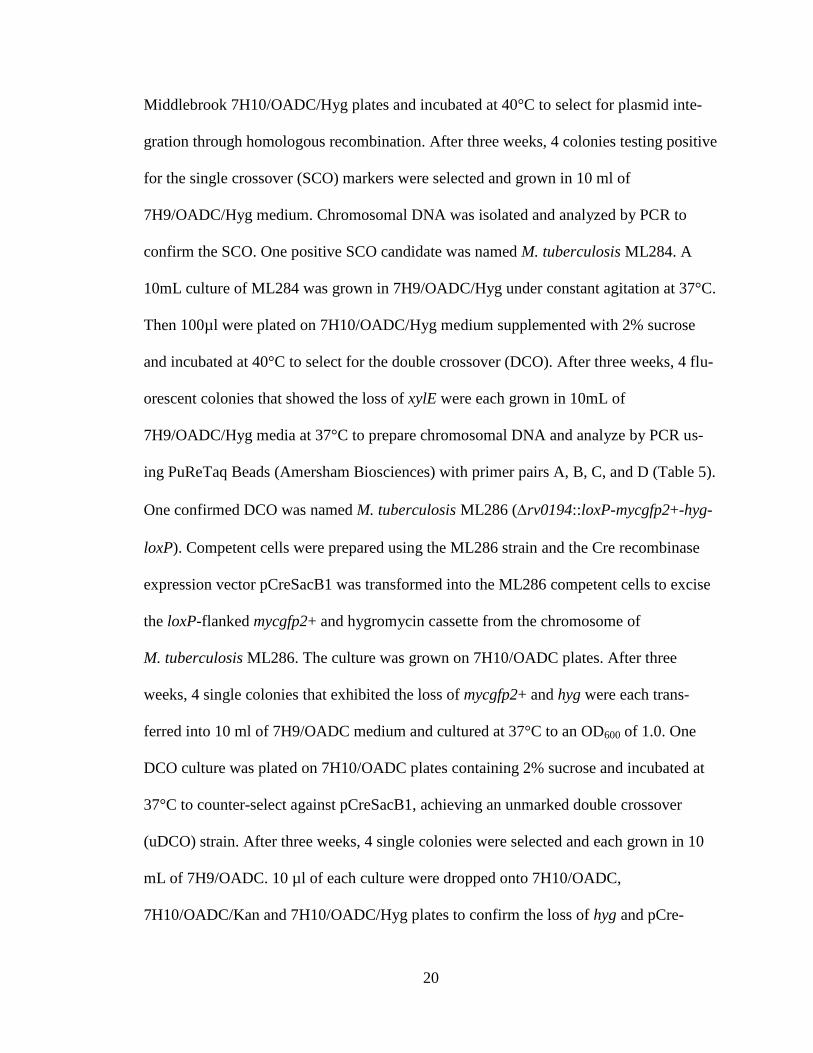
20
Middlebrook 7H10/OADC/Hyg plates and incubated at 40°C to select for plasmid inte-
gration through homologous recombination. After three weeks, 4 colonies testing positive
for the single crossover (SCO) markers were selected and grown in 10 ml of
7H9/OADC/Hyg medium. Chromosomal DNA was isolated and analyzed by PCR to
confirm the SCO. One positive SCO candidate was named M. tuberculosis ML284. A
10mL culture of ML284 was grown in 7H9/OADC/Hyg under constant agitation at 37°C.
Then 100µl were plated on 7H10/OADC/Hyg medium supplemented with 2% sucrose
and incubated at 40°C to select for the double crossover (DCO). After three weeks, 4 flu-
orescent colonies that showed the loss of xylE were each grown in 10mL of
7H9/OADC/Hyg media at 37°C to prepare chromosomal DNA and analyze by PCR us-
ing PuReTaq Beads (Amersham Biosciences) with primer pairs A, B, C, and D (Table 5).
One confirmed DCO was named M. tuberculosis ML286 (rv0194::loxP-mycgfp2+-hyg-
loxP). Competent cells were prepared using the ML286 strain and the Cre recombinase
expression vector pCreSacB1 was transformed into the ML286 competent cells to excise
the loxP-flanked mycgfp2+ and hygromycin cassette from the chromosome of
M. tuberculosis ML286. The culture was grown on 7H10/OADC plates. After three
weeks, 4 single colonies that exhibited the loss of mycgfp2+ and hyg were each trans-
ferred into 10 ml of 7H9/OADC medium and cultured at 37°C to an OD600 of 1.0. One
DCO culture was plated on 7H10/OADC plates containing 2% sucrose and incubated at
37°C to counter-select against pCreSacB1, achieving an unmarked double crossover
(uDCO) strain. After three weeks, 4 single colonies were selected and each grown in 10
mL of 7H9/OADC. 10 µl of each culture were dropped onto 7H10/OADC,
7H10/OADC/Kan and 7H10/OADC/Hyg plates to confirm the loss of hyg and pCre-

21
SacB1. Chromosomal DNA was prepared and analyzed with PuReTaq beads and primer
pair A, B, C, and E (Table 5) to confirm that the loxP-mycgfp2+-hyg-loxP cassette was
removed from the genome. One amplified fragment was submitted for sequencing with
the oligonucleotide CN1082. The sequencing results further confirmed that this colony
was an unmarked rv0194 deletion mutant and subsequently named M. tuberculosis
ML287 (rv0194::loxP).
Table 5
Primer pairs for analysis of the Mtb rv0194 deletion strains. The following primer pairs
were used to analyze the genomic layout of ML286 and ML287 and compare them to
Mtb H37Rv genomic DNA. The analysis allows for the confirmation of crossover events.
The nucleotide sequence of each primer is listed from 5’ to 3’.
Set Primer Pairs Sequence (5’-3’)
A CN1082 TAATGCGCACGAATTGCTGGTGG
CN1316 GCGATATCTGCGTCAATACATTGAAGCTGAG
B CN1427 GCCGCCAGGTAATGAGGATC
CGTGACGGTGCCGACGATCC CN1154
C CN0820 CTGCACGACTTCGAGGTGTTC
GTGTCAGGTTCGGCGGTCGG CN1430
D CN1486 GCCATATGATGATTACGGTGGGCACCTTTG
GCGCGGCCGCGATGAGCAGGGGCGGCAGCAG CN1487
E CN1427 GCCGCCAGGTAATGAGGATC
GTGTCAGGTTCGGCGGTCGG CN1430
Protein Extraction
M. smegmatis
The plasmid pML853 was transformed into M. smegmatis mc2155. A 50 mL cul-
ture was incubated at 37°C under constant agitation at 230 rpm. 10 mL aliquots were ob-
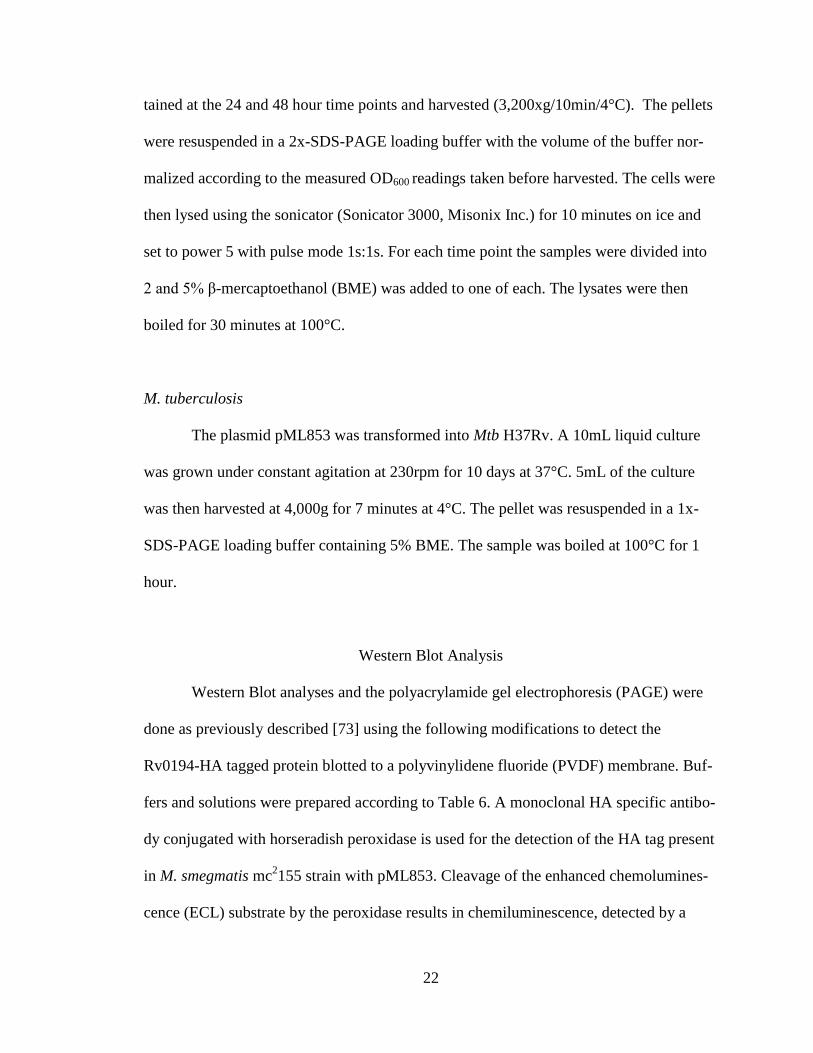
22
tained at the 24 and 48 hour time points and harvested (3,200xg/10min/4°C). The pellets
were resuspended in a 2x-SDS-PAGE loading buffer with the volume of the buffer nor-
malized according to the measured OD600 readings taken before harvested. The cells were
then lysed using the sonicator (Sonicator 3000, Misonix Inc.) for 10 minutes on ice and
set to power 5 with pulse mode 1s:1s. For each time point the samples were divided into
2 and 5% β-mercaptoethanol (BME) was added to one of each. The lysates were then
boiled for 30 minutes at 100°C.
M. tuberculosis
The plasmid pML853 was transformed into Mtb H37Rv. A 10mL liquid culture
was grown under constant agitation at 230rpm for 10 days at 37°C. 5mL of the culture
was then harvested at 4,000g for 7 minutes at 4°C. The pellet was resuspended in a 1x-
SDS-PAGE loading buffer containing 5% BME. The sample was boiled at 100°C for 1
hour.
Western Blot Analysis
Western Blot analyses and the polyacrylamide gel electrophoresis (PAGE) were
done as previously described [73] using the following modifications to detect the
Rv0194-HA tagged protein blotted to a polyvinylidene fluoride (PVDF) membrane. Buf-
fers and solutions were prepared according to Table 6. A monoclonal HA specific antibo-
dy conjugated with horseradish peroxidase is used for the detection of the HA tag present
in M. smegmatis mc2155 strain with pML853. Cleavage of the enhanced chemolumines-
cence (ECL) substrate by the peroxidase results in chemiluminescence, detected by a

23
chemoluminescence photo imager. 10 µl of each M. smegmatis sample, 5-20 µl of the M.
tuberculosis sample and 30 µl of a control sample was used for protein gel electrophore-
sis with a 10 % separation gel at a constant voltage of 100 V. The MagicMark (Invitro-
gen) protein marker was loaded as a reference. The proteins were electroblotted to a hy-
drophobic PVDF membrane (GE Healthcare) overnight with 50 mA and always covered
by transfer buffer. The membrane was treated as indicated in Table 7. The mouse anti-
HA-HRP (Sigma) antibody was diluted 1:2000 in 1x TBST. Immunoblots were devel-
oped using the Pierce ECL Western Blotting Substrate kit to the manufacturer’s recom-
mendations (Thermo Scientific).
Table 6
Buffers used for PAGE and western blot analysis. Buffers were made as follows for use
during polyacrylamide gel electrophoresis (PAGE) and western blot analysis.
Buffer Ingredients Buffer Ingredients
TBST (10 x): 0.1 M Tris-HCl pH8 Antibody solu-
tion:
Antibody diluted
1.5 M NaCl in 1x TBST
0.5 % Tween 20
Blocking: 5 % (w/v) fat free milk Transfer Buffer:
3.0g Tris
powder in 1x TBST 14.4g Glycine
1g SDS
4x SDS-
PAGE loading
buffer:
140 mM TrisHCl pH 7.0 H20 to 1L
30 % (w/v) Glycerol
4 % (w/v) SDS
0.1 % (w/v) Bromphenol Blue
24
Table 7
PVDF membrane incubations. Incubation steps were performed as follows for PVDF
membranes when detecting the Rv0194-HA fusion. The membrane was incubated in the
blocking solution for 60 minutes. It was next washed 3 times for 5 minutes each with 1x
TBST. The membrane was incubated in the antibody solution for 60 minutes and then
washed in 1x TBST 3 times for 5 minutes each before being developed using enhanced
chemoluminescence (ECL).
Solution Incubation
Blocking 60 min
1x TBST 3 x 5 min
Antibody solution 60 min
1x TBST 3 x 5 min
GFP Analysis
The Mtb H37Rv strain with pML856 was grown in liquid culture for one week
under constant agitation at 230rpm in 37°C. 5 µl, 10 µl, 15 µl, and 20 µl of culture were
dropped onto 7H10/OADC/Hyg plates and allowed to dry undisturbed. The plates were
incubated at 37°C for two weeks. Pictures were taken using a fluorescence microscope
(Olympus SZX12 & Zeiss AxioCam) under normal white lighting and then under ultra-
violet (UV) light at 366 nm to detect excitation of Gfp.
Growth Curves
Initially, 10 mL cultures of ML287, ML288, ML365, and ML368 were incubated
for 7 days at 37°C under constant agitation at 230 rpm. Cultures were then diluted to an
OD600 of 0.05. Beginning on Day 0 samples from each culture were taken and OD600
readings obtained. Samples continued to be taken on the following days: 3, 5, 6, 7, 9, 12,
and 13. The data were analyzed using Sigma Plot software (SYSTAT Software Inc.) and
a graph was generated plotting the data points on a logarithmic scale.

25
RESULTS
Plasmid Construction
Rv0194 Integrative Expression Vector
An integrative vector, pML850 (Fig. 5), was constructed for overexpression of
rv0194 from the chromosome. The plasmid was successfully cloned using the materials
and methods described. Clones 9, 13, and 15 were selected for a control digest using SpeI
and SphI. The parent plasmid pML655 was used as a control for the SpeI and SphI diges-
tions. Clones 9 and 15 had the correct DNA fragment sizes expected at 3.0 kb, 3.6 kb, 1.3
kb and 0.9 kb (Figure 6). Clone 9 of pML850 was selected for sequencing and confirmed
to be the correct plasmid.

26
Fig. 5. Cloning of pML850. The pML850 plasmid was derived from pML655 and
pCV125. pCV125 was digested with the restriction enzymes NotI and XbaI to create the
vector backbone. pML655 was digested with ClaI and XbaI to create the insert of the
pimyc promoter and rv0194 to be cloned into the vector backbone.
Fig 6. Digestion of pML850 clones. The pCV125 parent plasmid and the pML850 clones
9, 13, and 15 were digested with SpeI and SphI. A 2-log DNA ladder was loaded as a size
marker (A). The lanes were loaded as follows: pCV125 (B & I) digested with SpeI and
SphI (J); pML850 clone 9 (C) digested with SpeI and SphI (D); pML850 clone 13 (E)
digested with SpeI and SphI (F); pML850 clone 15 (G) digested with SpeI and SphI (H).
The digestion of pML850 clones 9 and 15 gave the correct DNA fragment sizes expected
at 3.0 kb, 3.6 kb, 1.3 kb and 0.9 kb. The digestion of pML850 clone 13 with SpeI and
SphI showed bands identical to the digestion of pCV125 with SpeI and SphI.

27
Rv0194 Deletion Vector
The construction of the rv0194 deletion vector required the cloning of an interme-
diate plasmid, pML851 (Fig. 7) before the final rv0194 deletion vector, pML852 (Fig. 7),
was obtained. The plasmid is designed to delete the entire rv0104 gene. The pML852 de-
letion vector contains several important genes. The pAL5000 thermosensitive origin of
replication that replicates at 37°C [74] which allows for the selection of integrated DNA
at 40°C. The pUC E. coli origin of replication is used for cloning steps. The upstream and
downstream regions of rv0194 select the region of the genome to be deleted. The hyg
gene allows for the selection of hygromycin resistance. The sacB gene is used for selec-
tion on 2% sucrose plates. If sacB is expressed the enzyme levansucrose is secreted
which hydrolyzes sucrose and synthesizes levans in the periplasm leading to cell death.
The mycgfp2+ gene expresses the green fluorescence protein and is used as a selection
marker. The xylE gene is also used as a selection marker because colonies turn yellow in
the presence of 1% catehol if XylE is expressed. The two loxP sites are used for site spe-
cific recombination. Clones 8, 9, and 10 for pML851 were digested with MscI and clone
8, 9, and 10 obtained correct bands at 6.6 kb and 4.4 kb (Fig.8). The parent plasmid
pML523 was used as a control for the MscI digestion. Clone 8 for pML851 was selected
for sequencing and confirmed to be the correct plasmid. Clones 2, 3, 4, and 5 for pML852
were digested with MscI and all four clones obtained correct bands at 6.1 kb, 4.4 kb, 1.0
kb, and 0.5 kb (Figure 9). pML851 was used as a control for the MscI digestion. Clone 2
of pML852 was selected for sequencing and confirmed to be the correct plasmid.
28
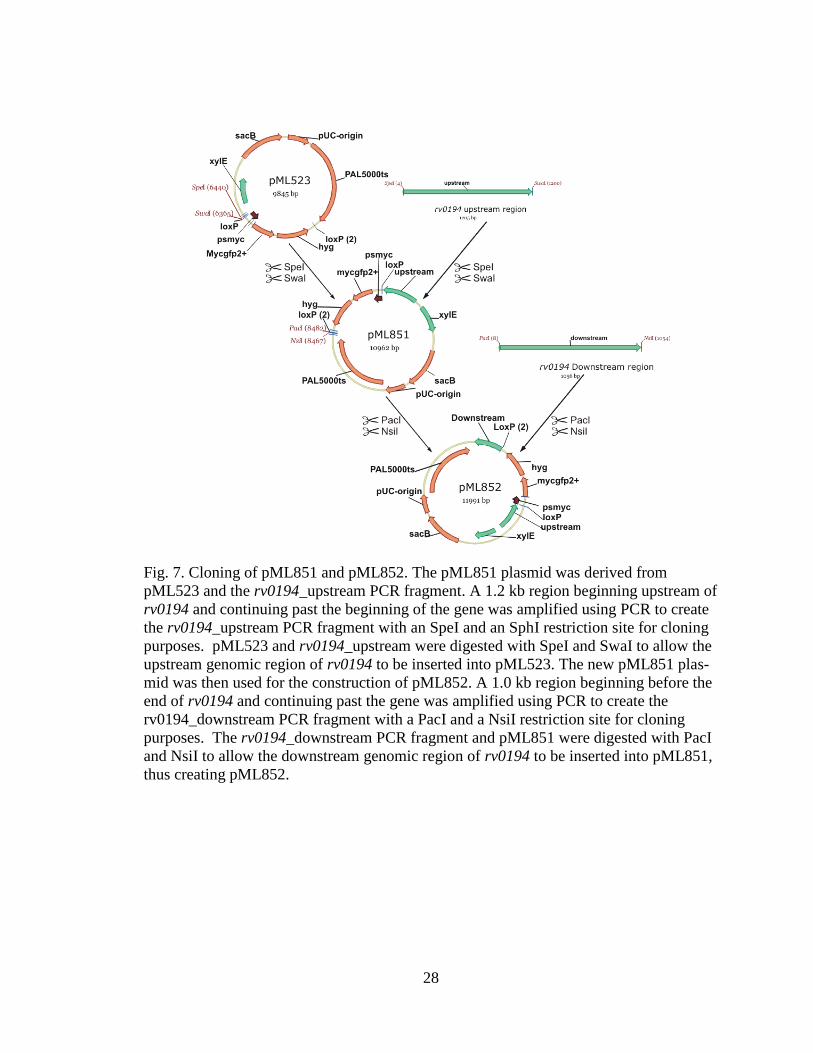
Fig. 7. Cloning of pML851 and pML852. The pML851 plasmid was derived from
pML523 and the rv0194_upstream PCR fragment. A 1.2 kb region beginning upstream of
rv0194 and continuing past the beginning of the gene was amplified using PCR to create
the rv0194_upstream PCR fragment with an SpeI and an SphI restriction site for cloning
purposes. pML523 and rv0194_upstream were digested with SpeI and SwaI to allow the
upstream genomic region of rv0194 to be inserted into pML523. The new pML851 plas-
mid was then used for the construction of pML852. A 1.0 kb region beginning before the
end of rv0194 and continuing past the gene was amplified using PCR to create the
rv0194_downstream PCR fragment with a PacI and a NsiI restriction site for cloning
purposes. The rv0194_downstream PCR fragment and pML851 were digested with PacI
and NsiI to allow the downstream genomic region of rv0194 to be inserted into pML851,
thus creating pML852.

29
Fig. 8. Digestion of pML851 clones. The pML523 parent plasmid and the pML851
clones 8, 9, 10, and 11 were digested with MscI. A 2-log DNA ladder was loaded as a
size marker (F). The lanes were loaded as follows: pML523 undigested (E & K) and di-
gested with MscI (L); pML851 clone 8 undigested (A) and digested with MscI (B);
pML851 clone 9 undigested (C) and digested with MscI (D); pML851 clone 10 undi-
gested (G) and digested with MscI (H); pML851 clone 11 undigested (I) and digested
with MscI (J). The digestion of pML85I clone 8, 9, and 10 obtained the correct expected
bands at 6.6 kb and 4.4 kb. The digestion of pML851 clone 11 with MscI showed bands
identical to the digestion of pML523 with MscI.
Fig. 9. Digestion of pML852 clones. The pML851 parent plasmid and the pML852
clones 2, 3, 4, and 5 were digested with MscI. A 2-log DNA ladder was loaded as a size
marker (E). The lanes were loaded as follows: pML851 undigested (F) and digested with
MscI (G); pML852 clone 2 undigested (A) digested with MscI (B); pML852 clone 3 un-
digested (C) digested with MscI (D); pML851 clone 4 undigested (H) and digested with
MscI (I); pML852 clone 5 undigested (J) and digested with MscI (K). All four clones
obtained the correct expected bands at 6.1 kb, 4.4 kb, 1.0 kb, and 0.5 kb.
30
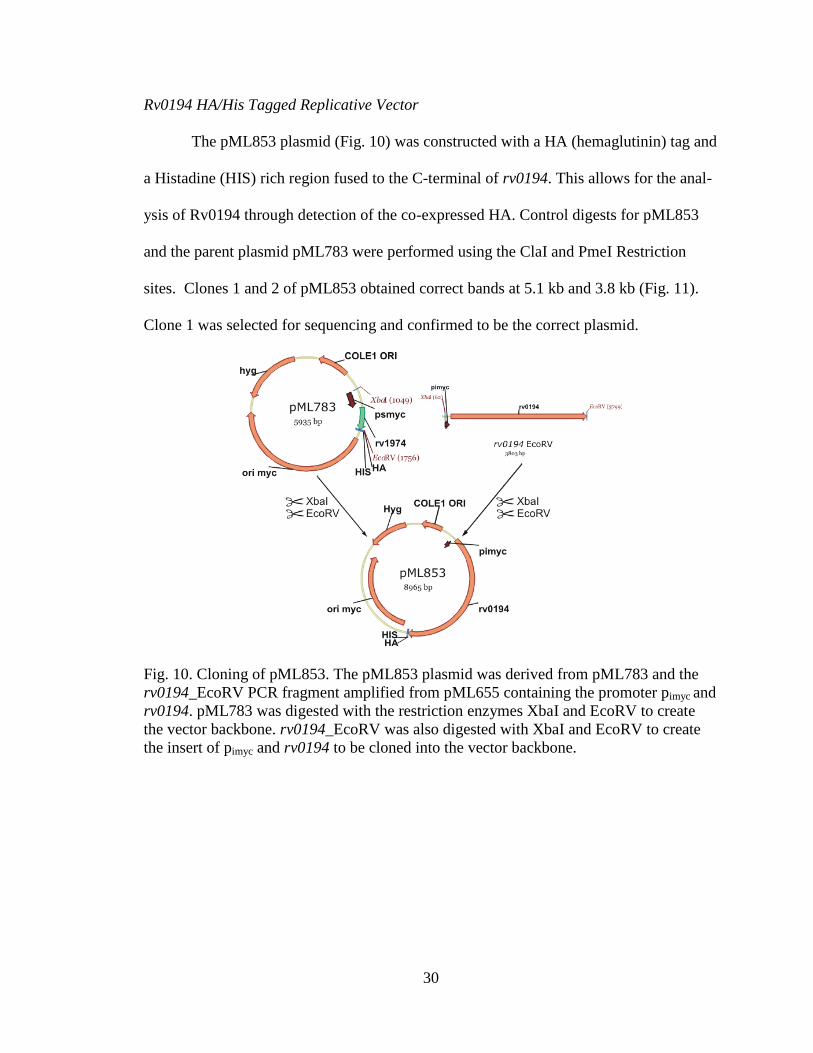
Rv0194 HA/His Tagged Replicative Vector
The pML853 plasmid (Fig. 10) was constructed with a HA (hemaglutinin) tag and
a Histadine (HIS) rich region fused to the C-terminal of rv0194. This allows for the anal-
ysis of Rv0194 through detection of the co-expressed HA. Control digests for pML853
and the parent plasmid pML783 were performed using the ClaI and PmeI Restriction
sites. Clones 1 and 2 of pML853 obtained correct bands at 5.1 kb and 3.8 kb (Fig. 11).
Clone 1 was selected for sequencing and confirmed to be the correct plasmid.
Fig. 10. Cloning of pML853. The pML853 plasmid was derived from pML783 and the
rv0194_EcoRV PCR fragment amplified from pML655 containing the promoter pimyc and
rv0194. pML783 was digested with the restriction enzymes XbaI and EcoRV to create
the vector backbone. rv0194_EcoRV was also digested with XbaI and EcoRV to create
the insert of pimyc and rv0194 to be cloned into the vector backbone.
31
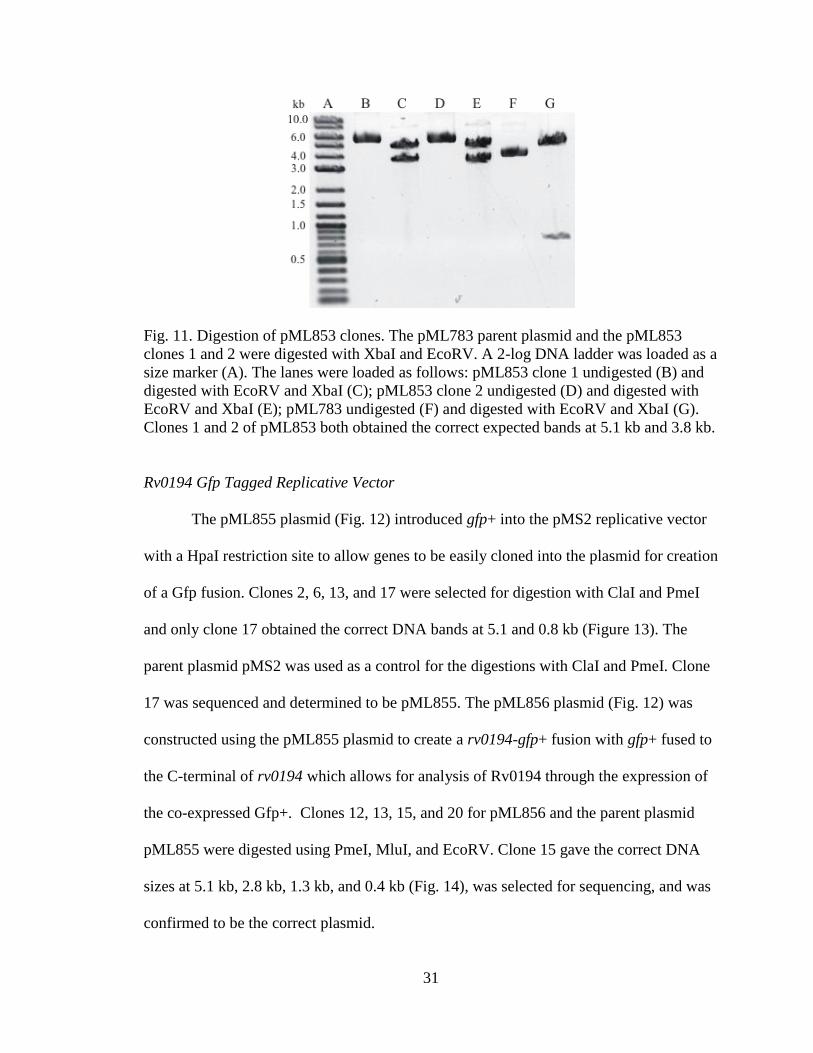
Fig. 11. Digestion of pML853 clones. The pML783 parent plasmid and the pML853
clones 1 and 2 were digested with XbaI and EcoRV. A 2-log DNA ladder was loaded as a
size marker (A). The lanes were loaded as follows: pML853 clone 1 undigested (B) and
digested with EcoRV and XbaI (C); pML853 clone 2 undigested (D) and digested with
EcoRV and XbaI (E); pML783 undigested (F) and digested with EcoRV and XbaI (G).
Clones 1 and 2 of pML853 both obtained the correct expected bands at 5.1 kb and 3.8 kb.
Rv0194 Gfp Tagged Replicative Vector
The pML855 plasmid (Fig. 12) introduced gfp+ into the pMS2 replicative vector
with a HpaI restriction site to allow genes to be easily cloned into the plasmid for creation
of a Gfp fusion. Clones 2, 6, 13, and 17 were selected for digestion with ClaI and PmeI
and only clone 17 obtained the correct DNA bands at 5.1 and 0.8 kb (Figure 13). The
parent plasmid pMS2 was used as a control for the digestions with ClaI and PmeI. Clone
17 was sequenced and determined to be pML855. The pML856 plasmid (Fig. 12) was
constructed using the pML855 plasmid to create a rv0194-gfp+ fusion with gfp+ fused to
the C-terminal of rv0194 which allows for analysis of Rv0194 through the expression of
the co-expressed Gfp+. Clones 12, 13, 15, and 20 for pML856 and the parent plasmid
pML855 were digested using PmeI, MluI, and EcoRV. Clone 15 gave the correct DNA
sizes at 5.1 kb, 2.8 kb, 1.3 kb, and 0.4 kb (Fig. 14), was selected for sequencing, and was
confirmed to be the correct plasmid.

32
Fig. 12. Cloning of pML855 and pML856. The pML855 plasmid was derived from pMS2
and the gfp_HpaI_402 PCR fragment. The gfp_HpaI_402 PCR fragment was amplified
from the pMN402 plasmid and a HpaI restriction site was created at the beginning of
gfp+ to be used for later clonings. pMS2 was digested with PstI and SwaI to create the
backbone vector. Gfp_HpaI_402 was digested only with PstI and inserted into the pMS2
backbone which created a new HpaI restriction site. The new pML855 plasmid was then
used for the construction of pML856.The rv0194_HapI PCR fragment was amplified
from pML655 and a HpaI restriction site was introduced at the end of rv0194 to be used
for cloning purposes. The rv0194_HpaI PCR fragment and pML855 were digested with
HpaI and XbaI to allow rv0194 to be inserted in front of gfp+ creating a rv0194-gfp+ fu-
sion.

33
Fig. 13. Digestion of pML855 clones. The pMS2 parent plasmid and the pML855 clones
2, 6, 13, and 17 were digested with ClaI and PmeI. A 2-log DNA ladder was loaded as a
size marker (E). The lanes were loaded as follows: pMS2 undigested (J) and digested
with ClaI and PmeI (K); pML855 clone 2 undigested (A) digested with ClaI and PmeI
(B); pML855 clone 6 undigested (C) digested with ClaI and PmeI (D); pML855 clone 13
undigested (F) digested with ClaI and PmeI (G); pML855 clone 2 undigested (H) di-
gested with ClaI and PmeI (I). pML855 clone 17 obtained the correct DNA bands at 5.1
and 0.8 kb.
Fig. 14. Digestion of pML856 clones The pML855 parent plasmid and the pML856
clones 12, 13, 15, and 20 were digested with PmeI, MluI, and EcoRV. A 2-log DNA lad-
der was loaded as a size marker (G). The lanes were loaded as follows: pML855 undi-
gested (A) and digested with PmeI, MluI, and EcoRV (B); pML856 clone 12 undigested
(C) digested with PmeI, MluI, and EcoRV (D); pML856 clone 13 undigested (E) digested
with PmeI, MluI, and EcoRV (F); pML856 clone 15 undigested (H) digested with PmeI,
MluI, and EcoRV (I); pML856 clone 20 undigested (J) digested with PmeI, MluI, and
EcoRV (K). pML856 Clone 15 gave the correct DNA sizes at 5.1 kb, 2.8 kb, 1.3 kb, and
0.4 kb
34
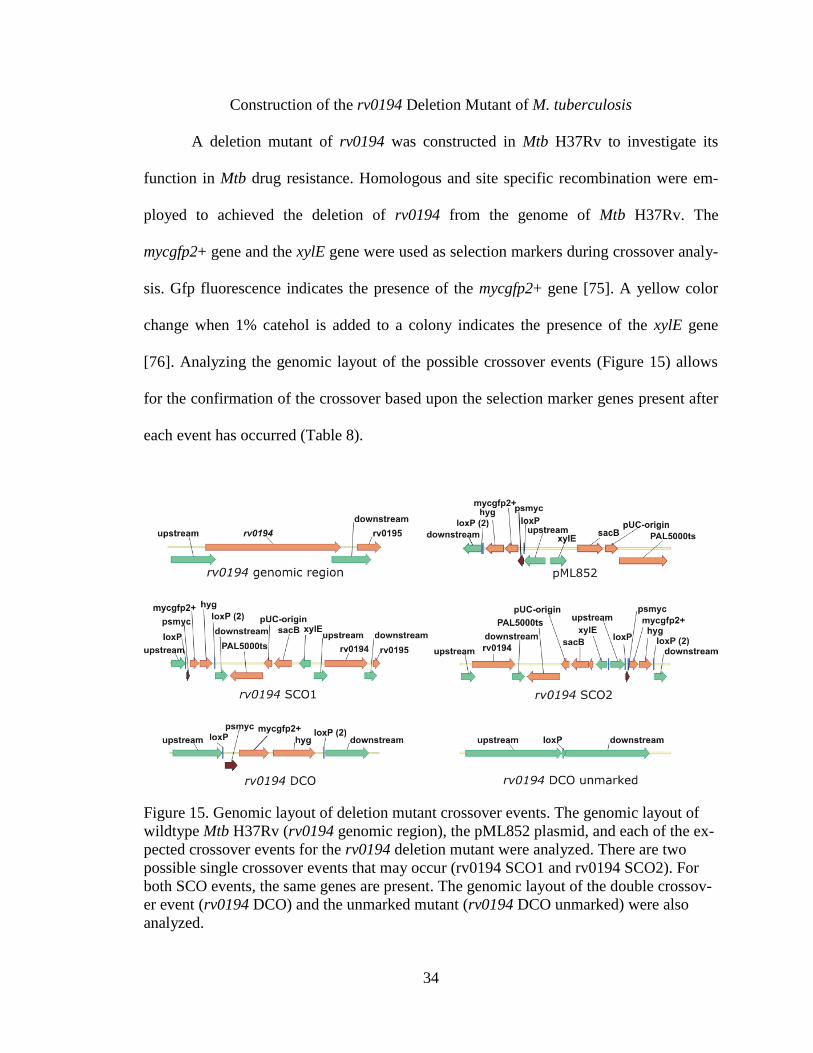
Construction of the rv0194 Deletion Mutant of M. tuberculosis
A deletion mutant of rv0194 was constructed in Mtb H37Rv to investigate its
function in Mtb drug resistance. Homologous and site specific recombination were em-
ployed to achieved the deletion of rv0194 from the genome of Mtb H37Rv. The
mycgfp2+ gene and the xylE gene were used as selection markers during crossover analy-
sis. Gfp fluorescence indicates the presence of the mycgfp2+ gene [75]. A yellow color
change when 1% catehol is added to a colony indicates the presence of the xylE gene
[76]. Analyzing the genomic layout of the possible crossover events (Figure 15) allows
for the confirmation of the crossover based upon the selection marker genes present after
each event has occurred (Table 8).
Figure 15. Genomic layout of deletion mutant crossover events. The genomic layout of
wildtype Mtb H37Rv (rv0194 genomic region), the pML852 plasmid, and each of the ex-
pected crossover events for the rv0194 deletion mutant were analyzed. There are two
possible single crossover events that may occur (rv0194 SCO1 and rv0194 SCO2). For
both SCO events, the same genes are present. The genomic layout of the double crossov-
er event (rv0194 DCO) and the unmarked mutant (rv0194 DCO unmarked) were also
analyzed.

35
Table 8
Presence of selection marker genes in each crossover event. The genomic layout of each
expected crossover event and the pML852 plasmid were analyzed to determine which of
the following selection marker genes should be present. A table was created to aid in ana-
lyzing crossover strains. The Gfp column indicates the presence or absence of mycgfp2+.
The XylE column indicates the presence or absence of xylE. The SacB column indicates
the presence or absence of sacB. The Hyg column indicates the presence or absence of
hyg. A + indicates the gene should be present and a – indicates the gene should be absent.
Crossover Gfp XylE SacB Hyg
pML852 + + + +
SCO + + + +
DCO + - - +
DCO unmarked - - - -
The SCO strain exhibited GFP fluorescence and turned yellow with the addition
of 1% catehol as predicted (Figure 16). The DCO strain was able to grow in the presence
of 2% sucrose which indicates the sacB gene was absent [77]. The confirmed DCO strain
ML286 also exhibited Gfp fluorescence and did not show a color change with the addi-
tion of 1% catehol (Figure 16).
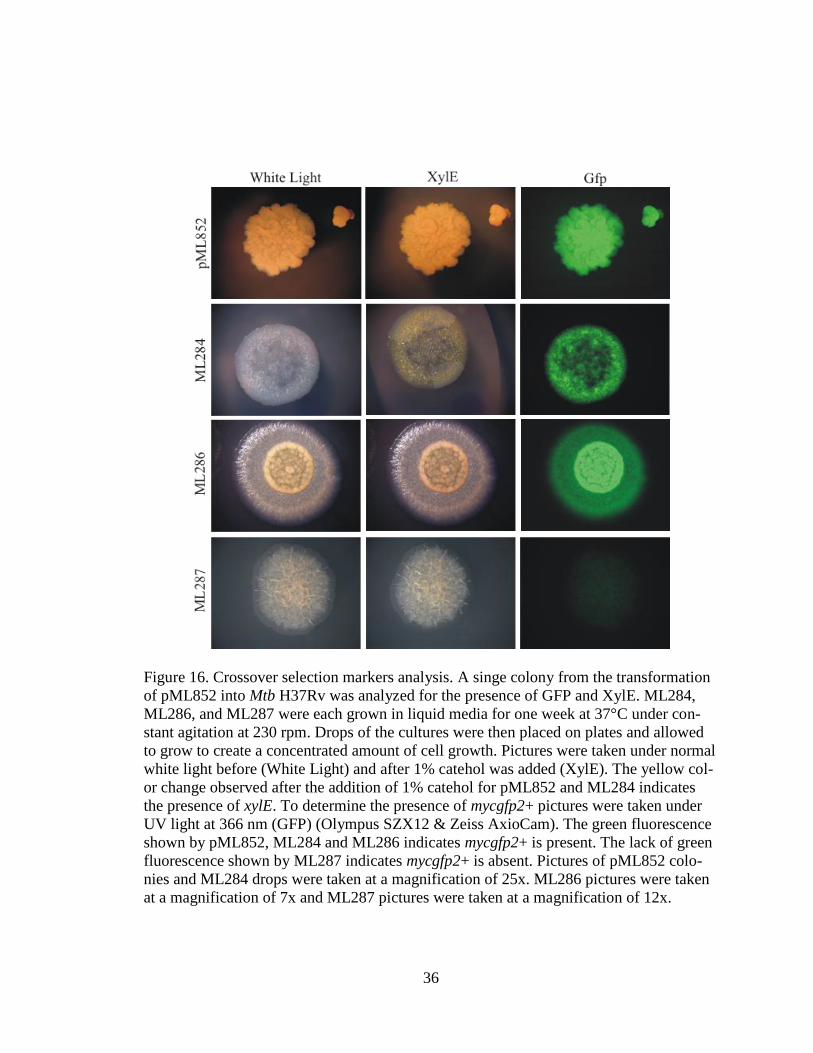
36
Figure 16. Crossover selection markers analysis. A singe colony from the transformation
of pML852 into Mtb H37Rv was analyzed for the presence of GFP and XylE. ML284,
ML286, and ML287 were each grown in liquid media for one week at 37°C under con-
stant agitation at 230 rpm. Drops of the cultures were then placed on plates and allowed
to grow to create a concentrated amount of cell growth. Pictures were taken under normal
white light before (White Light) and after 1% catehol was added (XylE). The yellow col-
or change observed after the addition of 1% catehol for pML852 and ML284 indicates
the presence of xylE. To determine the presence of mycgfp2+ pictures were taken under
UV light at 366 nm (GFP) (Olympus SZX12 & Zeiss AxioCam). The green fluorescence
shown by pML852, ML284 and ML286 indicates mycgfp2+ is present. The lack of green
fluorescence shown by ML287 indicates mycgfp2+ is absent. Pictures of pML852 colo-
nies and ML284 drops were taken at a magnification of 25x. ML286 pictures were taken
at a magnification of 7x and ML287 pictures were taken at a magnification of 12x.

37
PCR analysis of the chromosomal DNA prepared from ML286 revealed that the
backbone of the plasmid was excised leaving the loxP-mycgfp2+-hyg-loxP cassette (Fig-
ure 17). The expected size of the PCR fragments obtained can be found in Table 9.
Table 9
Expected band sizes for PCR analysis of ML286 and ML287. Sets of primer pairs were
analyzed and the size of the region expected to be amplified for ML286, ML287, and
wildtype (Mtb H37Rv) was recorded. The expected sizes of the ML286 and ML287 were
compared to each other and the amplified bands expected for the wildtype event. This
allowed for the confirmation of each crossover event. The sizes of the expected bands are
recorded in kilobases (kb).
Set Primer Pairs ML286 ML287 wildtype
A CN1082
2.97 0.5 3.5 CN1316
B CN1427
1.3 1.05 0 CN1154
C CN0820
1.5 0 0 CN1430
D CN1486
0 0 1.1 CN1487
E CN1427
0 2.3 0 CN1430

38
Fig. 17. PCR analysis of ML286. Sets of primer pairs were used to analyze chromosomal
DNA extracted from ML286 and from wildtype (wt) Mtb H37Rv. The PCR fragments
obtained were run on a gel to analyze the size of the bands. A 2-log DNA ladder was
loaded as a size reference (M). The following primer pairs were used: CN1082 and
CN1316 (A); CN1427 and CN1124 (B); CN0820 and CN1430 (C); and CN1486 and
CN1487 (D). Primer pair A gave the expected bands at 2.97 kb for ML286 and 3.5 kb for
wt. Primer pair B gave the expected band at 1.3 kb for ML286 and the expected lack of
bands for wt. Primer pair C gave the expected band at 1.5 kb for ML286 and expected
unspecific bands for the wt. Primer pair D showed the expected lack of bands for ML286
and the expected band at 1.1 kb for wt.
To unmark the deletion mutant, the pCreSacB1 plasmid was transformed into
ML286 competent cells. The plasmid contains genes that express Cre Recombinase and
levansucrose fro sacB. When expressed, Cre Recombinase excises the area between the
two loxP sites, removing mycgfp2+, hyg, and one loxP. This uDCO was confirmed by
growth on plates containing kanamycin, the absence of GFP fluorescence, and the ab-
sences of xylE (Figure 16). The pCreSacB1 plasmid was successfully counter selected by
growth present on plates containing 2% sucrose. The ML287 strain then was able to grow
on plates without antibiotics but unable to grow if hygromycin or kanamycin was present.
PCR analysis of chromosomal DNA prepared from ML287 further confirmed that the
unmarked double crossover mutant was obtained (Figure 18). A PCR fragment obtained
by using the oligonucleotides CN1427 and CN1430 was sequenced to further confirm the
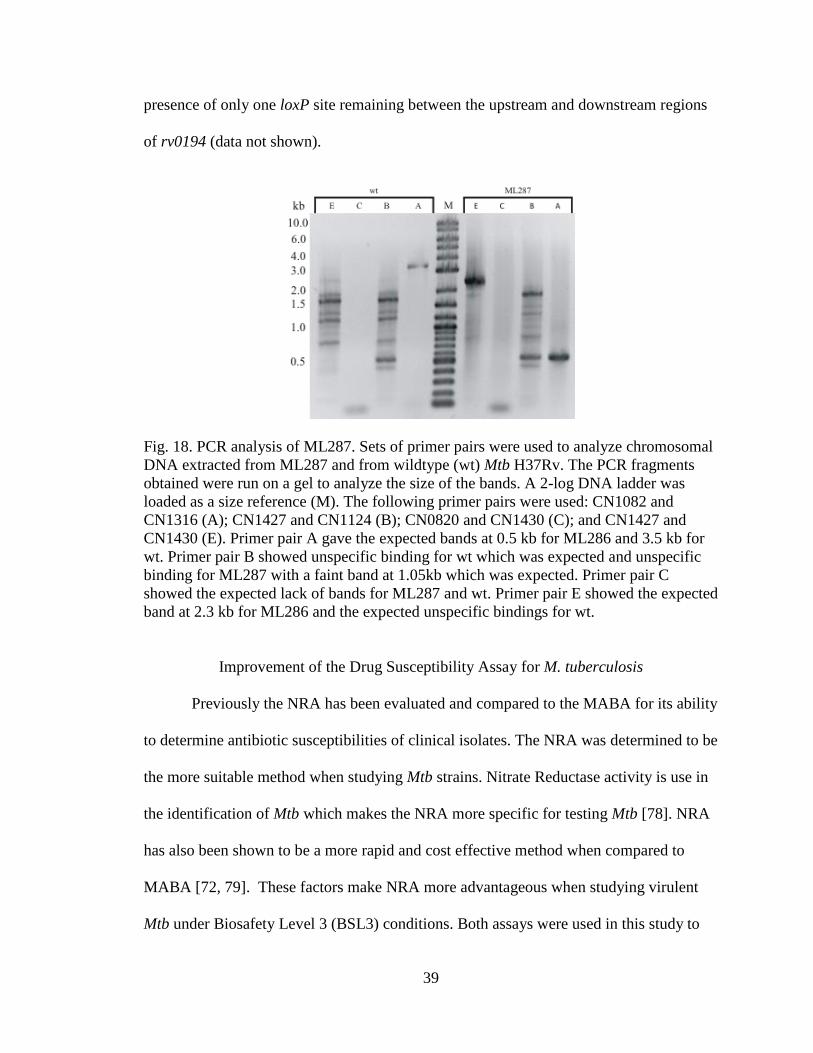
39
presence of only one loxP site remaining between the upstream and downstream regions
of rv0194 (data not shown).
Fig. 18. PCR analysis of ML287. Sets of primer pairs were used to analyze chromosomal
DNA extracted from ML287 and from wildtype (wt) Mtb H37Rv. The PCR fragments
obtained were run on a gel to analyze the size of the bands. A 2-log DNA ladder was
loaded as a size reference (M). The following primer pairs were used: CN1082 and
CN1316 (A); CN1427 and CN1124 (B); CN0820 and CN1430 (C); and CN1427 and
CN1430 (E). Primer pair A gave the expected bands at 0.5 kb for ML286 and 3.5 kb for
wt. Primer pair B showed unspecific binding for wt which was expected and unspecific
binding for ML287 with a faint band at 1.05kb which was expected. Primer pair C
showed the expected lack of bands for ML287 and wt. Primer pair E showed the expected
band at 2.3 kb for ML286 and the expected unspecific bindings for wt.
Improvement of the Drug Susceptibility Assay for M. tuberculosis
Previously the NRA has been evaluated and compared to the MABA for its ability
to determine antibiotic susceptibilities of clinical isolates. The NRA was determined to be
the more suitable method when studying Mtb strains. Nitrate Reductase activity is use in
the identification of Mtb which makes the NRA more specific for testing Mtb [78]. NRA
has also been shown to be a more rapid and cost effective method when compared to
MABA [72, 79]. These factors make NRA more advantageous when studying virulent
Mtb under Biosafety Level 3 (BSL3) conditions. Both assays were used in this study to
40
determine the MICs of Mtb mc26230. Mtb mc
26230 is an avirulent strain recently ac-
quired by our lab and is approved for study in Biosafety Level 2 (BSL2) conditions. Use
of this strain allows for the analysis of NRA when investigating Mtb before virulent Mtb
is studied under BSL3 conditions. A five day incubation period proved to be optimal for
the NRA and the MABA with an additional 24 hour incubation for MABA. MICs were
determined at the concentration that showed <10% survival for all antibiotics except iso-
niazid and ethambutol which determined MICs at the concentration that showed <20%
survival. Isoniazid and ethambutol were observed to cause the number of viable cells to
decrease but exhibited a continual level of activity before the 10% value was reached.
The MICs for ampicillin, chloramphenicol, rifampicin, and vancomycin were consistent
for both NRA and MABA. For, ethambutol, isoniazid, norfloxacin, streptomycin, and
tetracycline MIC values were 2 to >32 fold higher for MABA. Conclusive values for
erythromycin and novobiacin were not obtained. The MIC values obtained for NRA and
MABA were compared to published values previously determined using NRA and MA-
BA (Table 10).
41
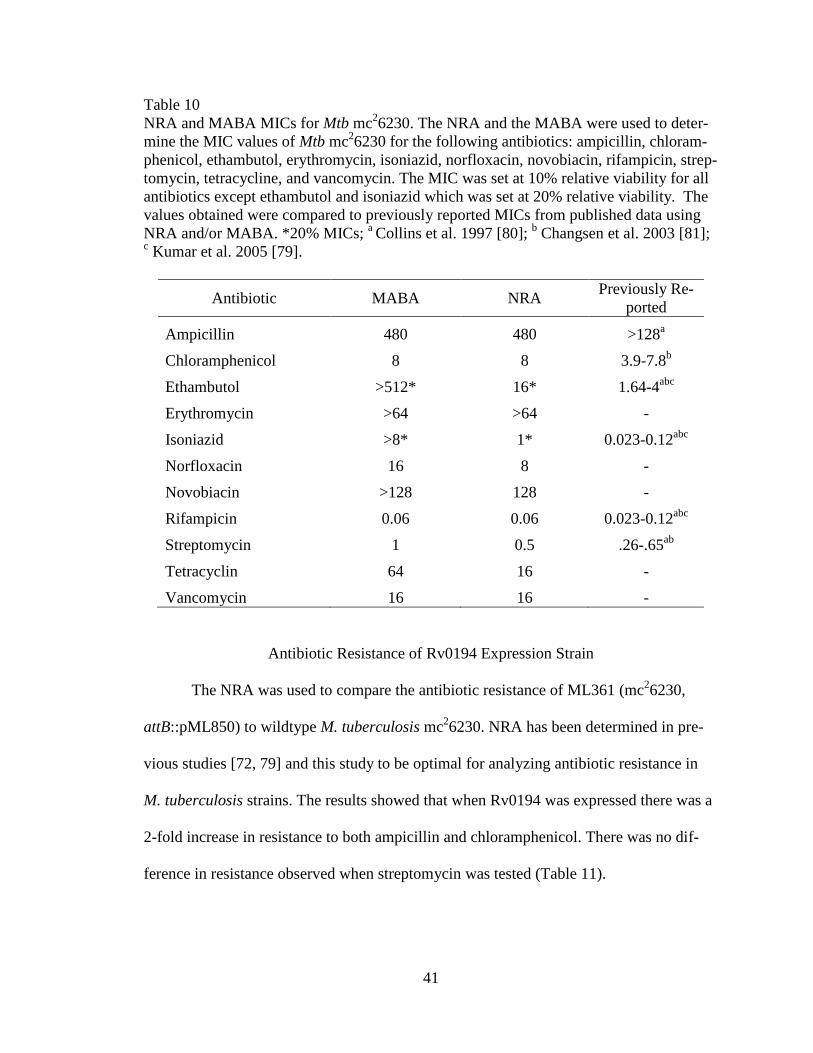
Table 10
NRA and MABA MICs for Mtb mc26230. The NRA and the MABA were used to deter-
mine the MIC values of Mtb mc26230 for the following antibiotics: ampicillin, chloram-
phenicol, ethambutol, erythromycin, isoniazid, norfloxacin, novobiacin, rifampicin, strep-
tomycin, tetracycline, and vancomycin. The MIC was set at 10% relative viability for all
antibiotics except ethambutol and isoniazid which was set at 20% relative viability. The
values obtained were compared to previously reported MICs from published data using
NRA and/or MABA. *20% MICs; a Collins et al. 1997 [80];
b Changsen et al. 2003 [81];
c Kumar et al. 2005 [79].
Antibiotic MABA NRA Previously Re-
ported
Ampicillin 480 480 >128a
Chloramphenicol 8 8 3.9-7.8b
Ethambutol >512* 16* 1.64-4abc
Erythromycin >64 >64 -
Isoniazid >8* 1* 0.023-0.12abc
Norfloxacin 16 8 -
Novobiacin >128 128 -
Rifampicin 0.06 0.06 0.023-0.12abc
Streptomycin 1 0.5 .26-.65ab
Tetracyclin 64 16 -
Vancomycin 16 16 -
Antibiotic Resistance of Rv0194 Expression Strain
The NRA was used to compare the antibiotic resistance of ML361 (mc26230,
attB::pML850) to wildtype M. tuberculosis mc26230. NRA has been determined in pre-
vious studies [72, 79] and this study to be optimal for analyzing antibiotic resistance in
M. tuberculosis strains. The results showed that when Rv0194 was expressed there was a
2-fold increase in resistance to both ampicillin and chloramphenicol. There was no dif-
ference in resistance observed when streptomycin was tested (Table 11).
42
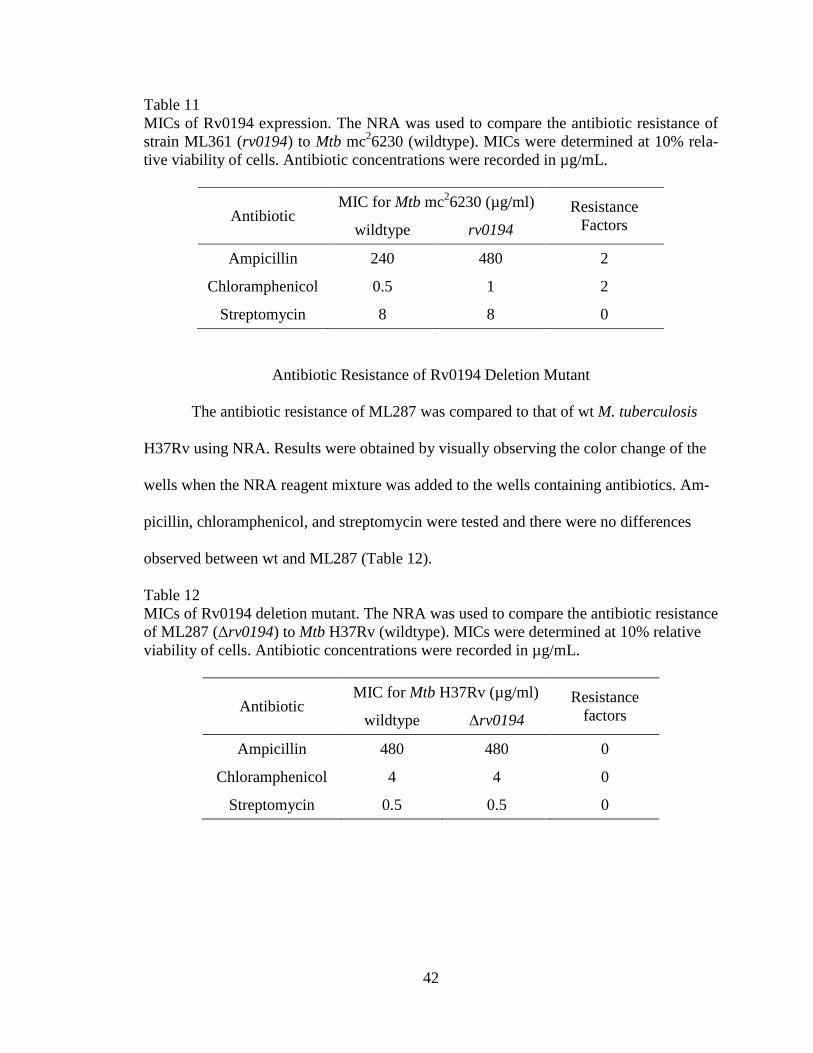
Table 11
MICs of Rv0194 expression. The NRA was used to compare the antibiotic resistance of
strain ML361 (rv0194) to Mtb mc26230 (wildtype). MICs were determined at 10% rela-
tive viability of cells. Antibiotic concentrations were recorded in µg/mL.
Antibiotic MIC for Mtb mc
26230 (µg/ml) Resistance
Factors wildtype rv0194
Ampicillin 240 480 2
Chloramphenicol 0.5 1 2
Streptomycin 8 8 0
Antibiotic Resistance of Rv0194 Deletion Mutant
The antibiotic resistance of ML287 was compared to that of wt M. tuberculosis
H37Rv using NRA. Results were obtained by visually observing the color change of the
wells when the NRA reagent mixture was added to the wells containing antibiotics. Am-
picillin, chloramphenicol, and streptomycin were tested and there were no differences
observed between wt and ML287 (Table 12).
Table 12
MICs of Rv0194 deletion mutant. The NRA was used to compare the antibiotic resistance
of ML287 (Δrv0194) to Mtb H37Rv (wildtype). MICs were determined at 10% relative
viability of cells. Antibiotic concentrations were recorded in µg/mL.
Antibiotic MIC for Mtb H37Rv (µg/ml) Resistance
factors wildtype Δrv0194
Ampicillin 480 480 0
Chloramphenicol 4 4 0
Streptomycin 0.5 0.5 0
43
Analysis of Expression of Rv0194
M. smegmatis mc2155
The 10 mL sample taken at the 24 hour time point had an OD600 of 0.74 and the
pellet was resuspended in 1 mL of the loading buffer. The 10 mL sample taken at the 48
hour time point had an OD600 of 3.4 and was resuspended in 4.6 mL of the loading buffer.
After sonication, 500 µl of each sample was added to one tube with BME and one tube
without BME. No bands of Rv0194 were detected in any of the M. smegmatis sample
lanes (data not shown).
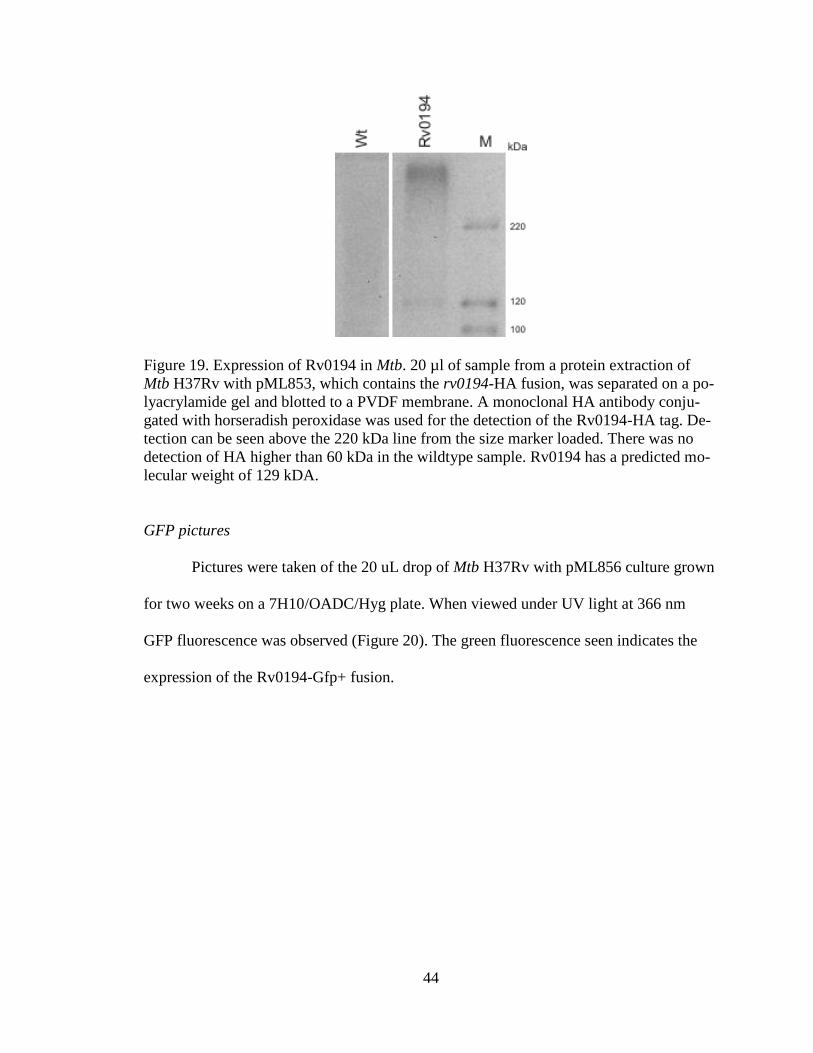
Mtb H37Rv with pML853
5µl, 10µl, 15µl and 20µl of sample were run on the gel and blotted to a PVDF
membrane. Detection of a band above the 220 kDa marker was achieved with the 20µl
sample (Figure 19). No protein was detected in the other samples (data not shown).
Rv0194 has a predicted molecular weight of 129 kDa. Proteins often run higher than their
predicted molecular weight and often form multimers. It is likely that the detected protein
is a multimer of Rv0194.
44
Figure 19. Expression of Rv0194 in Mtb. 20 µl of sample from a protein extraction of
Mtb H37Rv with pML853, which contains the rv0194-HA fusion, was separated on a po-
lyacrylamide gel and blotted to a PVDF membrane. A monoclonal HA antibody conju-
gated with horseradish peroxidase was used for the detection of the Rv0194-HA tag. De-
tection can be seen above the 220 kDa line from the size marker loaded. There was no
detection of HA higher than 60 kDa in the wildtype sample. Rv0194 has a predicted mo-
lecular weight of 129 kDA.
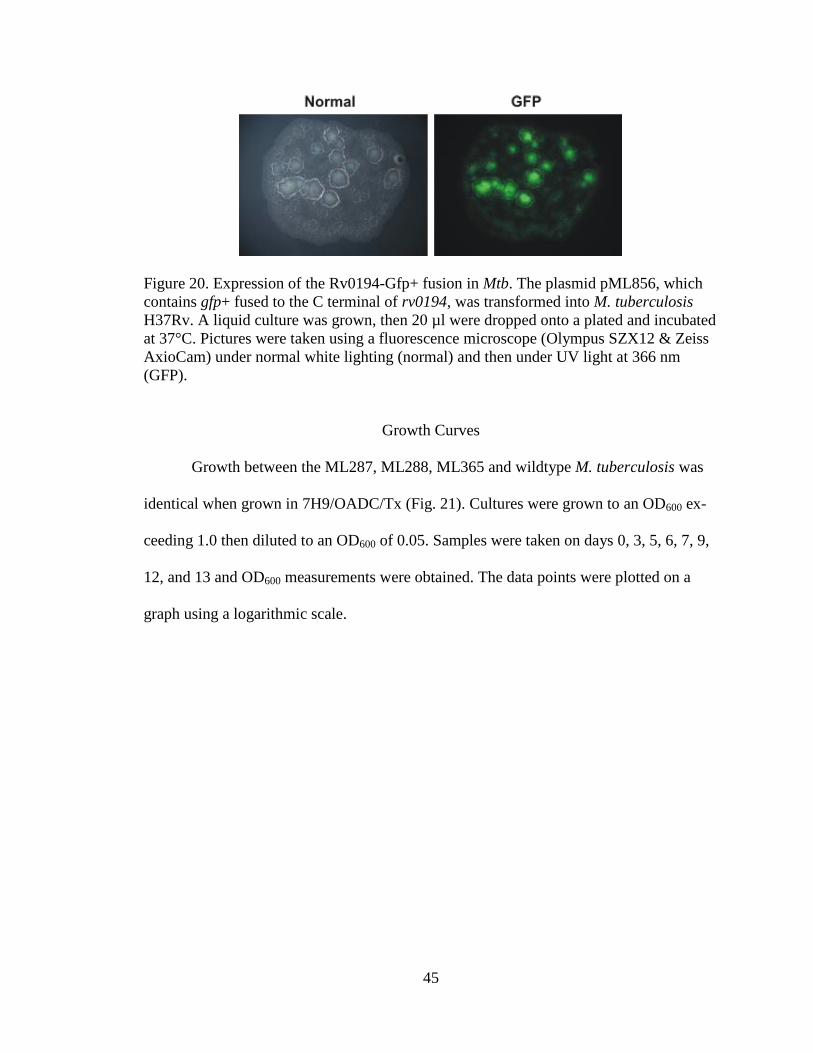
GFP pictures
Pictures were taken of the 20 uL drop of Mtb H37Rv with pML856 culture grown
for two weeks on a 7H10/OADC/Hyg plate. When viewed under UV light at 366 nm
GFP fluorescence was observed (Figure 20). The green fluorescence seen indicates the
expression of the Rv0194-Gfp+ fusion.
45
Figure 20. Expression of the Rv0194-Gfp+ fusion in Mtb. The plasmid pML856, which
contains gfp+ fused to the C terminal of rv0194, was transformed into M. tuberculosis
H37Rv. A liquid culture was grown, then 20 µl were dropped onto a plated and incubated
at 37°C. Pictures were taken using a fluorescence microscope (Olympus SZX12 & Zeiss
AxioCam) under normal white lighting (normal) and then under UV light at 366 nm
(GFP).
Growth Curves
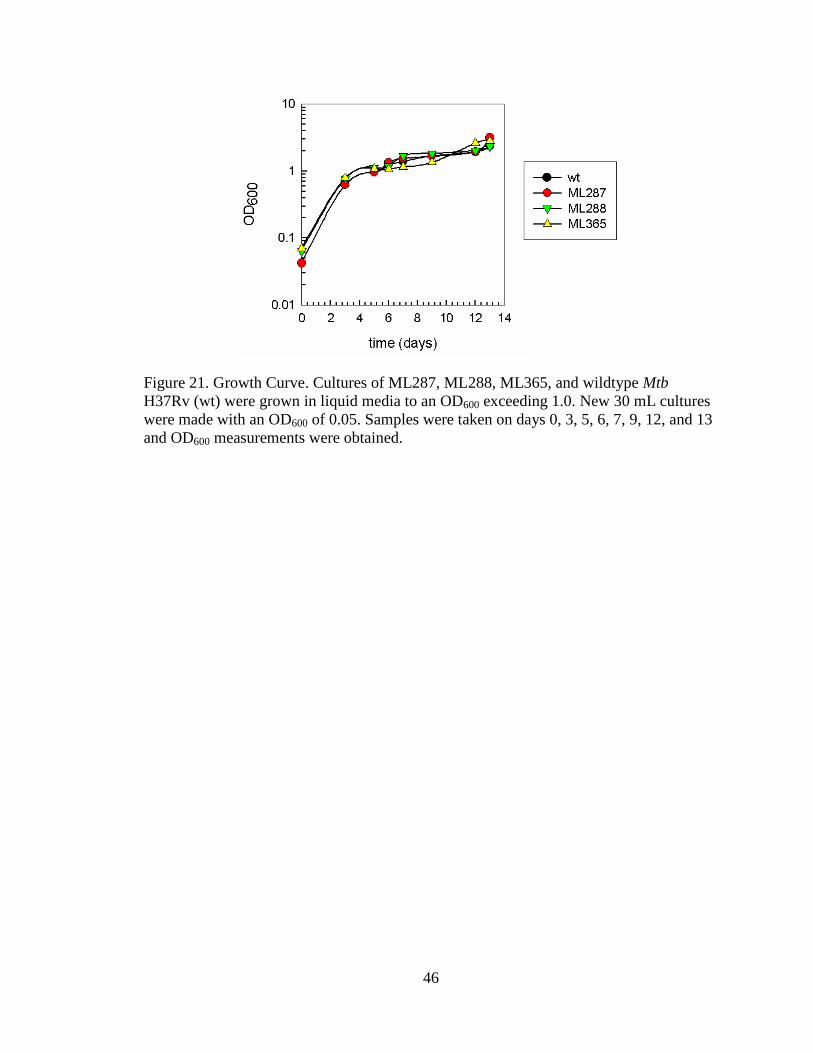
Growth between the ML287, ML288, ML365 and wildtype M. tuberculosis was
identical when grown in 7H9/OADC/Tx (Fig. 21). Cultures were grown to an OD600 ex-
ceeding 1.0 then diluted to an OD600 of 0.05. Samples were taken on days 0, 3, 5, 6, 7, 9,
12, and 13 and OD600 measurements were obtained. The data points were plotted on a
graph using a logarithmic scale.
46
Figure 21. Growth Curve. Cultures of ML287, ML288, ML365, and wildtype Mtb
H37Rv (wt) were grown in liquid media to an OD600 exceeding 1.0. New 30 mL cultures
were made with an OD600 of 0.05. Samples were taken on days 0, 3, 5, 6, 7, 9, 12, and 13
and OD600 measurements were obtained.
47
DISCUSSION
Improvement of the Drug Susceptibility Assay for M. tuberculosis
The Nitrate Reductase Assay (NRA) [72, 79] was implemented in our lab and
evaluated against the Microplate Alamar Blue Assay (MABA) [82] for determining anti-
biotic susceptibility of generated mycobacterial strains and plasmids. The comparison
showed significant differences between the two assays when analyzed visually. Visually
recorded MICs and MICs obtained by absorption readings using a microplate reader were
identical for the NRA. However, the visual interpretation MICs for MABA was more dif-
ficult due to indistinct color changes and produced disparaging results compared to MICs
recorded using fluorescence measurements obtained by a microplate reader. The ability to
accurately determine visual MICs makes the NRA more preferable when working under
BSL3 conditions. In addition, the NRA proved to be a more time efficient assay when
studying Mtb as previously reported by Kumar et al. [72, 79]. The shorter incubation time
required and the rapid distinct color change when the reagent mixture is added saves 24
hours when compared to MABA. These factors along with the use of fewer materials and
equipment make the NRA a more advantageous assay than MABA when studying Mtb,
especially under BSL3 conditions.
The MICs obtains for Mtb mc26230 did not vary greatly from previously reported
values obtained using MABA and NRA performed with Mtb H37Rv [79-81]. However,
some of the MABA MICs did differ significantly from the NRA MIC values and from
48
previously reported values. Differences in the MICs obtained between data sets can also
be due to the stability of the prepared antibiotics.
Newly prepared aliquots that have not been subjected to thawing and freezing are
expected to provide more consistent results. In retrospect, this could have been a factor in
the discrepancies between the first and second data sets obtained. Another interesting ef-
fect occurred when NRA was used to analyze ethambutol and isoniazid. Tested concen-
trations did not inhibit >90% of bacterial growth, but instead reached a plateau at >80%
inhibition of bacterial growth despite increasing antibiotic concentrations. This can be
explained by the cells reaching a constant level of drug efflux activity before 90% of cell
growth is inhibited. MABA results for isoniazid and ethambutol also showed a similar
trend, but tested concentrations did not inhibit more than 30% of bacterial growth. Due to
the reliability and practical advantages of the NRA, this assay was selected for further
experiments.
Expression of Rv0194 in M. tuberculosis
When Rv0194 was expressed in Mtb H37Rv, NRA results showed a 2-fold in-
crease in resistance to ampicillin and chloramphenicol consistent with its function as a
drug efflux pump of Mtb. However, only minor effects were observed when compared to
the previous expression of Rv0194 in M. smegmatis and M. bovis BCG [65]. Previously,
Rv0194 was expressed in M. smegmatis and a significant increase in drug resistance to
several antibiotics was observed [65]. The low level increase in resistance when Rv0194
is expressed in Mtb may be explained by the presence of the endogenous copy of rv0194
49
in wt Mtb. rv0194 is not present in wt M. smegmatis. Therefore, the increased resistance
in M. smegmatis is expected to be greater than the effect of Rv0194 expression in Mtb.
The observation of Gfp fluorescence in Mtb H37Rv with pML856 indicates that
the rv0194-gfp+ fusion is expressed. In this construct, gfp+ is fused to the C terminal end
of rv0194. It is known that Gfp expression occurs within the cytoplasm and is only func-
tional in the periplasm when translocated in its folded and active conformation across the
inner membrane via the Tat secretion system [83, 84]. Gfp fluorescence confirms that
Rv0194 is expressed and that the predicted topology of Rv0194 which places the C-
terminal in the cytoplasm is in fact correct (See Appendix A).
Rv0194 has previously been identified as a transporter involved in a novel multi-
drug efflux pump system [65]. We have shown in this study that Rv0194 does function in
the inner membrane and is likely a component in a tripartite drug efflux pump that con-
sists of an outer membrane protein coupled to the inner membrane transporter. This is
indicated by the increased resistance to ampicillin when Rv0194 is expressed in M. bovis
BCG or M. smegmatis [65]. Ampicillin, a β-lactam antibiotic, targets transpeptidases that
are located in the periplasm [85] and resistance to ampicillin requires efflux across both
membranes. Therefore, the inner membrane pump Rv0194 must connect to an outer
membrane channel. This investigation focuses only on Rv0194 as the outer membrane
component is unknown. Although this work shows that Rv0194 is expressed, if the other
components of the efflux pump are not also expressed there may not be a significant in-
crease in efflux. This scenario could result in an increase of antibiotics pumped from the
cytoplasm into the periplasm without an efficient way of expelling them to the outside of
the cell resulting in no significant change in the drug resistance of Mtb.
50
Protein extraction and western blot analysis of the new M. smegmatis mc2155
construct with pML853 showed no expression of Rv0194. It is possible that the expres-
sion level of the protein was below detection limits. Mtb H37Rv with pML853 did show
a band that corresponded to the expected size of Rv0194. The conditions and methods
used in Mtb protein extraction make it difficult to determine the amount of protein loaded
onto the gel, thereby making expression level estimates unreliable. However, these results
combined with Gfp fluorescence and increased resistance in the NRA confirm that ex-
pression of Rv0194 in Mtb can be achieved.
Deletion of the rv0194 gene in M. tuberculosis H37Rv
A deletion mutant of rv0194 in Mtb H37Rv was successfully obtained using much
improved deletion vectors and protocols [86, 87]. Growth of wild-type Mtb and the
rv0194 deletion mutant in a standard rich liquid medium was identical. This shows that
the loss of rv0194 does not affect the growth of Mtb in vitro. The NRA did not reveal any
differences in resistance to ampicillin, chloramphenicol, and streptomycin when rv0194
was absent. This is may be because only rv0194 is deleted in the ML287 mutant, while
other unidentified components of the efflux pump system remain unaffected. This sug-
gests that Mtb is able to compensate for the loss of Rv0194 by using one or several other
inner membrane pumps. An alternative explanation is that the endogenous rv0194 is not
expressed in wt Mtb under conditions tested so its deletion does not affect drug resis-
tance.
51
LIST OF REFERENCES
1. Bleed, D., C. Watt, and C. Dye, Global Tuberculosis Control, in WHO Report
2001. 2001, World Health Organization: Geneva, Switzerland.
2. Reichman, L.B., Timebomb. 2002, New York: McGraw-Hill.
3. Corbett, E.L., et al., The growing burden of tuberculosis: global trends and inte-
ractions with the HIV epidemic. Arch Intern Med, 2003. 163(9): p. 1009-21.
4. White, V.L. and J. Moore-Gillon, Resource implications of patients with multi-
drug resistant tuberculosis. Thorax, 2000. 55(11): p. 962-3.
5. Singh, J., R. Upshur, and N. Padayatchi, XDR-TB in South Africa: No time for
denial or complacency. PLoS Med, 2007. 4(1): p. e50.
6. Uplekar, M. and K. Lonnroth, Editorial: MDR and XDR - the price of delaying
engagement with all care providers for control of TB and TB/HIV. Trop Med Int
Health, 2007. 12(4): p. 473-4.
7. Migliori, G.B., et al., 125 years after Robert Koch's discovery of the tubercle ba-
cillus: the new XDR-TB threat. Is "science" enough to tackle the epidemic? Eur
Respir J, 2007. 29(3): p. 423-7.
8. XDR-TB--a global threat. Lancet, 2006. 368(9540): p. 964.
9. McLean, J.A., Streptomycin resistance in the tubercule bacillus. Edinburgh Med
J, 1950. 57(11): p. 547-56.
52
10. Waksman, S.A., Tenth anniversary of the discovery of streptomycin, the first
chemotherapeutic agent found to be effective against tuberculosis in humans. Am
Rev Tuberc, 1954. 70(1): p. 1-8.
11. Wade, M.M. and Y. Zhang, Mechanisms of drug resistance in Mycobacterium
tuberculosis. Front Biosci, 2004. 9: p. 975-94.
12. Cynamon, M.H. and G.S. Palmer, In vitro activity of amoxicillin in combination
with clavulanic acid against Mycobacterium tuberculosis. Antimicrob Agents
Chemother, 1983. 24(3): p. 429-31.
13. Hackbarth, C.J., I. Unsal, and H.F. Chambers, Cloning and sequence analysis of a
class A beta-lactamase from Mycobacterium tuberculosis H37Ra. Antimicrob
Agents Chemother, 1997. 41(5): p. 1182-5.
14. De Rossi, E., J.A. Ainsa, and G. Riccardi, Role of mycobacterial efflux transpor-
ters in drug resistance: an unresolved question. FEMS Microbiol Rev, 2006.
30(1): p. 36-52.
15. Ainsa, J.A., et al., Molecular cloning and characterization of Tap, a putative mul-
tidrug efflux pump present in Mycobacterium fortuitum and Mycobacterium tu-
berculosis. J Bacteriol, 1998. 180(22): p. 5836-43.
16. De Rossi, E., et al., The multidrug transporters belonging to major facilitator su-
perfamily in Mycobacterium tuberculosis. Mol Med, 2002. 8(11): p. 714-24.
17. Siddiqi, N., et al., Mycobacterium tuberculosis isolate with a distinct genomic
identity overexpresses a Tap-like efflux pump. Infection, 2004. 32(2): p. 109-11.
53
18. Ramon-Garcia, S., et al., Contribution of the Rv2333c efflux pump (the Stp pro-
tein) from Mycobacterium tuberculosis to intrinsic antibiotic resistance in Myco-
bacterium bovis BCG. J Antimicrob Chemother, 2007. 59(3): p. 544-7.
19. De Rossi, E., et al., Molecular cloning and functional analysis of a novel tetracyc-
line resistance determinant, tet(V), from Mycobacterium smegmatis. Antimicrob
Agents Chemother, 1998. 42(8): p. 1931-7.
20. Choudhuri, B.S., et al., Overexpression and functional characterization of an
ABC (ATP-binding cassette) transporter encoded by the genes drrA and drrB of
Mycobacterium tuberculosis. Biochem J, 2002. 367(Pt 1): p. 279-85.
21. Pasca, M.R., et al., Rv2686c-Rv2687c-Rv2688c, an ABC fluoroquinolone efflux
pump in Mycobacterium tuberculosis. Antimicrob Agents Chemother, 2004.
48(8): p. 3175-8.
22. Tekaia, F., et al., Analysis of the proteome of Mycobacterium tuberculosis in sili-
co. Tuber Lung Dis, 1999. 79(6): p. 329-42.
23. Pasca, M.R., et al., MmpL7 gene of Mycobacterium tuberculosis is responsible for
isoniazid efflux in Mycobacterium smegmatis. Antimicrob Agents Chemother,
2005. 49(11): p. 4775-7.
24. Lomovskaya, O., et al., Waltzing transporters and 'the dance macabre' between
humans and bacteria. Nat Rev Drug Discov, 2007. 6(1): p. 56-65.
25. Nikaido, H., Multidrug efflux pumps of gram-negative bacteria. J Bacteriol, 1996.
178(20): p. 5853-9.
26. Yu, E.W., et al., Structural basis of multiple drug-binding capacity of the AcrB
multidrug efflux pump. Science, 2003. 300(5621): p. 976-80.
54
27. Li, X.Z. and H. Nikaido, Efflux-mediated drug resistance in bacteria. Drugs,
2004. 64(2): p. 159-204.
28. Pao, S.S., I.T. Paulsen, and M.H. Saier, Jr., Major facilitator superfamily. Micro-
biol Mol Biol Rev, 1998. 62(1): p. 1-34.
29. Saurin, W., M. Hofnung, and E. Dassa, Getting in or out: early segregation be-
tween importers and exporters in the evolution of ATP-binding cassette (ABC)
transporters. J Mol Evol, 1999. 48(1): p. 22-41.
30. Tseng, T.T., et al., The RND permease superfamily: an ancient, ubiquitous and
diverse family that includes human disease and development proteins. J Mol Mi-
crobiol Biotechnol, 1999. 1(1): p. 107-25.
31. Borges-Walmsley, M.I. and A.R. Walmsley, The structure and function of drug
pumps. Trends Microbiol, 2001. 9(2): p. 71-9.
32. Yen, M.R., et al., Protein-translocating outer membrane porins of Gram-negative
bacteria. Biochim Biophys Acta, 2002. 1562(1-2): p. 6-31.
33. Touze, T., et al., Interactions underlying assembly of the Escherichia coli AcrAB-
TolC multidrug efflux system. Mol Microbiol, 2004. 53(2): p. 697-706.
34. Tikhonova, E.B. and H.I. Zgurskaya, AcrA, AcrB, and TolC of Escherichia coli
form a stable intermembrane multidrug efflux complex. J Biol Chem, 2004.
279(31): p. 32116-24.
35. Mikolosko, J., et al., Conformational flexibility in the multidrug efflux system pro-
tein AcrA. Structure, 2006. 14(3): p. 577-87.
55
36. Sulavik, M.C., et al., Antibiotic susceptibility profiles of Escherichia coli strains
lacking multidrug efflux pump genes. Antimicrob Agents Chemother, 2001. 45(4):
p. 1126-36.
37. Hackett, J. and P. Reeves, Primary structure of the tolC gene that codes for an
outer membrane protein of Escherichia coli K12. Nucleic Acids Res, 1983.
11(18): p. 6487-95.
38. Hancock, R.E. and F.S. Brinkman, Function of Pseudomonas porins in uptake
and efflux. Annu Rev Microbiol, 2002. 56: p. 17-38.
39. Wong, K.K., et al., Evaluation of a structural model of Pseudomonas aeruginosa
outer membrane protein OprM, an efflux component involved in intrinsic antibiot-
ic resistance. J Bacteriol, 2001. 183(1): p. 367-74.
40. Koronakis, V., et al., Crystal structure of the bacterial membrane protein TolC
central to multidrug efflux and protein export. Nature, 2000. 405(6789): p. 914-
919.
41. Akama, H., et al., Crystal structure of the drug discharge outer membrane pro-
tein, OprM, of Pseudomonas aeruginosa: dual modes of membrane anchoring
and occluded cavity end. J Biol Chem, 2004. 279(51): p. 52816-9.
42. Koronakis, V., TolC--the bacterial exit duct for proteins and drugs. FEBS Lett,
2003. 555(1): p. 66-71.
43. Lobedanz, S., et al., A periplasmic coiled-coil interface underlying TolC recruit-
ment and the assembly of bacterial drug efflux pumps. Proc Natl Acad Sci U S A,
2007. 104(11): p. 4612-7.
56
44. Murakami, S., et al., Crystal structure of bacterial multidrug efflux transporter
AcrB. Nature, 2002. 419(6907): p. 587-593.
45. Bokma, E., et al., Directed evolution of a bacterial efflux pump: adaptation of the
E. coli TolC exit duct to the Pseudomonas MexAB translocase. FEBS Lett, 2006.
580(22): p. 5339-43.
46. Husain, F., M. Humbard, and R. Misra, Interaction between the TolC and AcrA
proteins of a multidrug efflux system of Escherichia coli. J Bacteriol, 2004.
186(24): p. 8533-6.
47. Fralick, J.A., Evidence that TolC is required for functioning of the Mar/AcrAB
efflux pump of Escherichia coli. J Bacteriol, 1996. 178(19): p. 5803-5.
48. Wandersman, C. and P. Delepelaire, TolC, an Escherichia coli outer membrane
protein required for hemolysin secretion. Proc Natl Acad Sci U S A, 1990.
87(12): p. 4776-80.
49. Yamanaka, H., et al., Need for TolC, an Escherichia coli outer membrane protein,
in the secretion of heat-stable enterotoxin I across the outer membrane. Microb
Pathog, 1998. 25(3): p. 111-20.
50. Bina, J.E. and J.J. Mekalanos, Vibrio cholerae tolC is required for bile resistance
and colonization. Infect Immun, 2001. 69(7): p. 4681-5.
51. Stone, B.J. and V.L. Miller, Salmonella enteritidis has a homologue of tolC that is
required for virulence in BALB/c mice. Mol Microbiol, 1995. 17(4): p. 701-12.
52. Binet, R. and C. Wandersman, Cloning of the Serratia marcescens hasF gene en-
coding the Has ABC exporter outer membrane component: a TolC analogue. Mol
Microbiol, 1996. 22(2): p. 265-73.

57
53. Brennan, P.J. and H. Nikaido, The envelope of mycobacteria. Annu. Rev. Bio-
chem., 1995. 64: p. 29-63.
54. Nikaido, H., S.H. Kim, and E.Y. Rosenberg, Physical organization of lipids in the
cell wall of Mycobacterium chelonae. Mol. Microbiol., 1993. 8(6): p. 1025-1030.
55. Beatty, W.L. and D.G. Russell, Identification of mycobacterial surface proteins
released into subcellular compartments of infected macrophages. Infect Immun,
2000. 68(12): p. 6997-7002.
56. Roberts, A.D., et al., Characteristics of protective immunity engendered by vacci-
nation of mice with purified culture filtrate protein antigens of Mycobacterium
tuberculosis. Immunology, 1995. 85(3): p. 502-8.
57. Barry, C.E., 3rd, et al., Mycolic acids: structure, biosynthesis and physiological
functions. Prog. Lipid Res., 1998. 37(2-3): p. 143-79.
58. Daffé, M. and P. Draper, The envelope layers of mycobacteria with reference to
their pathogenicity. Adv. Microb. Physiol., 1998. 39: p. 131-203.
59. Niederweis, M., Mycobacterial porins - new channel proteins in unique outer
membranes. Mol. Microbiol., 2003. 49(5): p. 1167-77.
60. Minnikin, D.E., Lipids: Complex lipids, their chemistry, biosynthesis and roles, in
The biology of the mycobacteria: Physiology, identification and classification, C.
Ratledge and J. Stanford, Editors. 1982, Academic Press: London. p. 95-184.
61. Draper, P., The outer parts of the mycobacterial envelope as permeability bar-
riers. Front. Biosci., 1998. 3: p. 1253-61.

58
62. Hoffmann, C., et al., Cryo-electron tomography and vitreous sections reveal the
outer membrane of mycobacteria. Int J Med Microbiol, 2007. 297(Suppl. 1): p.
138-139.
63. Hoffmann, C., et al., Disclosure of the mycobacterial outer membrane: Cryo-
electron tomography and vitreous sections reveal the lipid bilayer structure. Proc
Natl Acad Sci U S A, 2008. 105(10): p. 3963-3967.
64. Zuber, B., et al., Direct visualization of the outer membrane of native mycobacte-
ria and corynebacteria. J Bacteriol, 2008. 190: p. 5672-5680.
65. Danilchanka, O., C. Mailaender, and M. Niederweis, Identification of a novel
multidrug efflux pump of Mycobacterium tuberculosis. Antimicrob Agents Che-
mother, 2008. 52(7): p. 2503-11.
66. Kaps, I., et al., Energy transfer between fluorescent proteins using a co-
expression system in Mycobacterium smegmatis. Gene, 2001. 278(1-2): p. 115-24.
67. Scholz, O., et al., Quantitative analysis of gene expression with an improved
green fluorescent protein. Eur. J. Biochem., 2000. 267(6): p. 1565-1570.
68. Sambrook, J., E.F. Fritsch, and T. Maniatis, Molecular cloning: a laboratory ma-
nual. 2nd ed. 1989, Cold Spring Harbor, N. Y.: Cold Spring Harbor Laboratory
Press.
69. Snapper, S.B., et al., Isolation and characterization of efficient plasmid transfor-
mation mutants of Mycobacterium smegmatis. Mol Microbiol, 1990. 4(11): p.
1911-9.
70. Parish, T. and N.G. Stoker, eds. Mycobacterium tuberculosis protocols. Methods
in molecular medicine, ed. J.M. Walker. 2001, Humana Press: Totowa.
59
71. Jacobs, W.R. and G.F. Hatfull, Molecular genetics of mycobacteria. 2000, Wash-
ington, DC: ASM Press.
72. Kumar, M., et al., Microplate nitrate reductase assay versus Alamar Blue assay
for MIC determination of Mycobacterium tuberculosis. Int J Tuberc Lung Dis,
2005. 9(8): p. 939-41.
73. Wolschendorf, F., M. Mahfoud, and M. Niederweis, Porins are required for up-
take of phosphates by Mycobacterium smegmatis. J Bacteriol, 2007. 189(6): p.
2435-42.
74. Gicquel-Sanzey, B., et al., Structure of pAL5000, a plasmid from M. fortuitum
and its utilization in transformation of mycobacteria. Acta Leprol, 1989. 7 Suppl
1: p. 208-11.
75. Kremer, L., et al., Green fluorescent protein as a new expression marker in myco-
bacteria. Mol Microbiol, 1995. 17(5): p. 913-22.
76. Curcic, R., S. Dhandayuthapani, and V. Deretic, Gene expression in mycobacte-
ria: transcriptional fusions based on xylE and analysis of the promoter region of
the response regulator mtrA from Mycobacterium tuberculosis. Mol Microbiol,
1994. 13(6): p. 1057-64.
77. Pelicic, V., J.M. Reyrat, and B. Gicquel, Expression of the Bacillus subtilis sacB
gene confers sucrose sensitivity on mycobacteria. J. Bacteriol., 1996. 178(4): p.
1197-1199.
78. Golyshevskaia, V.I., et al., [New microbiological Techniques in diagnosis of tu-
berculosis]. Probl Tuberk, 1996(6): p. 22-5.
60
79. Kumar, M., et al., Rapid, inexpensive MIC determination of Mycobacterium tu-
berculosis isolates by using microplate nitrate reductase assay. Diagn Microbiol
Infect Dis, 2005. 53(2): p. 121-4.
80. Collins, L. and S.G. Franzblau, Microplate alamar blue assay versus BACTEC
460 system for high-throughput screening of compounds against Mycobacterium
tuberculosis and Mycobacterium avium. Antimicrob. Agents Chemother., 1997.
41(5): p. 1004-9.
81. Changsen, C., S.G. Franzblau, and P. Palittapongarnpim, Improved green fluores-
cent protein reporter gene-based microplate screening for antituberculosis com-
pounds by utilizing an acetamidase promoter. Antimicrob Agents Chemother,
2003. 47(12): p. 3682-7.
82. Franzblau, S.G., et al., Rapid, low-technology MIC determination with clinical
Mycobacterium tuberculosis isolates by using the microplate Alamar Blue assay.
J Clin Microbiol, 1998. 36(2): p. 362-6.
83. Feilmeier, B.J., et al., Green fluorescent protein functions as a reporter for pro-
tein localization in Escherichia coli. J Bacteriol, 2000. 182(14): p. 4068-76.
84. Thomas, J.D., et al., Export of active green fluorescent protein to the periplasm by
the twin-arginine translocase (Tat) pathway in Escherichia coli. Mol Microbiol,
2001. 39(1): p. 47-53.
85. Koch, A.L., Penicillin binding proteins, beta-lactams, and lactamases: offensives,
attacks, and defensive countermeasures. Crit Rev Microbiol, 2000. 26(4): p. 205-
20.
61
86. Wolschendorf, F., Physiological functions of mycobacterial outer membrane
channel proteins. 2008, Friedrich-Alexander-Universität Erlangen-Nürnberg.
87. Song, H.W., F.; Niederweis, M, Construction of unmarked deletion mutants in
mycobacteria. Mycobacteria protocols., in Mycobacteria protocols. 2008, Huma-
na Press: Totowa, NY. p. 279-95.

62
APPENDIX
PREDICTED TOPOLOGY OF RV0194
63
Predicted Topology of Rv0194
The topology of Rv0194 was predicted using the bioinformatic algorithms Sig-
nalP, TMHMM, and TopPred found on the Expert Protein Analysis System (ExPASy)
proteomics server of the Swiss Institute of Bioinformatics. The Nucledotide Binding
Domains (NBDs) were predicted based on Walker A/B motifs that are highly conserved
among NBDs. Comparisons were made to other similar known ABC transporter proteins
found through BLAST analysis using the National Center for Biotechnology Informa-
tion’s (NCBI) software. The orientation of the loops was predicted based upon the re-
quirement of NBDs to be located on the cytoplasmic side of the membrane to bind ATP.
The following model was constructed by Ryan Wells of the Niederweis Lab.
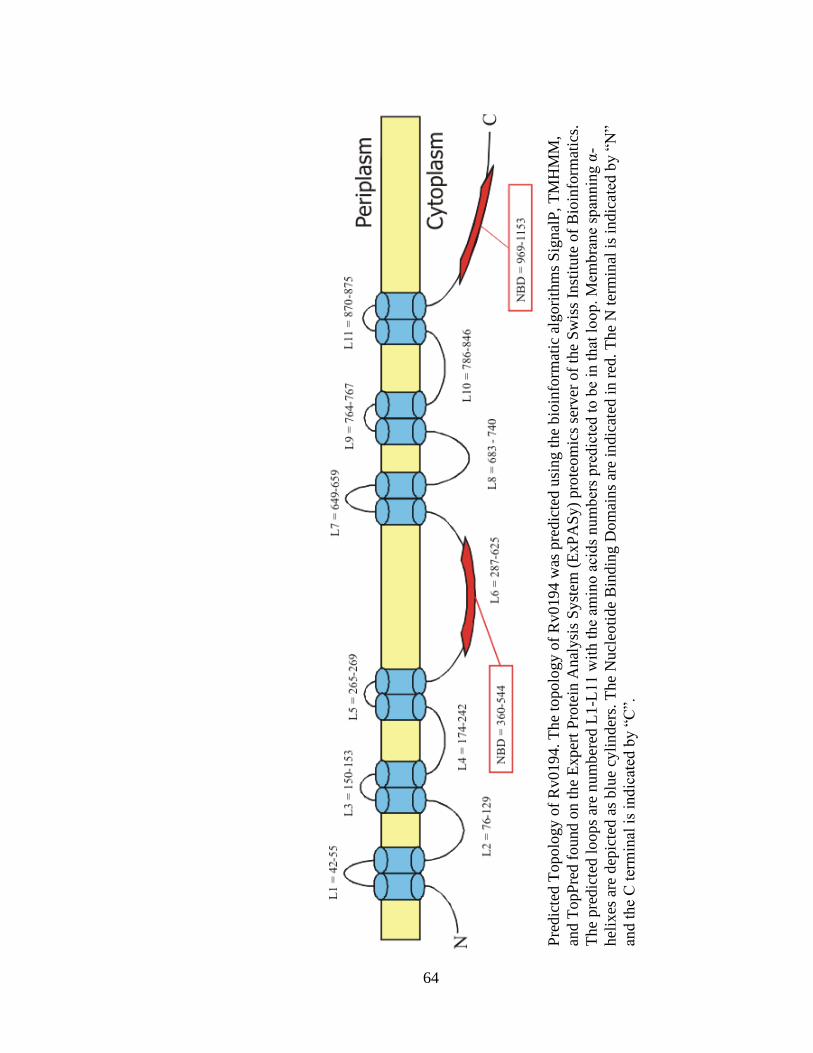
64
Pre
dic
ted T
opolo
gy o
f R
v0194.
The
topolo
gy o
f R
v0194 w
as p
redic
ted u
sing t
he
bio
info
rmat
ic a
lgori
thm
s S
ignal
P, T
MH
MM
,
and T
opP
red f
ound o
n t
he
Exper
t P
rote
in A
nal
ysi
s S
yst
em (
ExP
AS
y)
pro
teom
ics
serv
er o
f th
e S
wis
s In
stit
ute
of
Bio
info
rmat
ics.
The
pre
dic
ted l
oops
are
num
ber
ed L
1-L
11 w
ith t
he
amin
o a
cids
nu
mber
s p
redic
ted t
o b
e in
that
loo
p. M
embra
ne
span
nin
g α
-
hel
ixes
are
dep
icte
d a
s blu
e cy
linder
s. T
he
Nucl
eoti
de
Bin
din
g D
om
ains
are
indic
ated
in r
ed.
The
N t
erm
inal
is
indic
ate
d b
y “
N”
and t
he
C t
erm
inal
is
indic
ated
by “
C”.