identification of uxo using the associated … · identification of uxo using the associated...
TRANSCRIPT
IDENTIFICATION OF UXO USING THE ASSOCIATED PARTICLE NEUTRON TIME-OF-FLIGHT TECHNIQUE, FINAL REPORT
Sudeep Mitra
Prepared for Strategic Environmental Research and Development (SERDP),
U.S. Department of Defense, Arlington, VA
August 2011
Environmental Sciences Department/Energy Research and Technology Division
Brookhaven National Laboratory P.O. Box 5000
Upton, NY 11973-5000 www.bnl.gov
Notice: This manuscript has been authored by employees of Brookhaven Science Associates, LLC under Contract No. DE-AC02-98CH10886 with the U.S. Department of Energy. The publisher by accepting the manuscript for publication acknowledges that the United States Government retains a non-exclusive, paid-up, irrevocable, world-wide license to publish or reproduce the published form of this manuscript, or allow others to do so, for United States Government purposes.
DISCLAIMER
This report was prepared as an account of work sponsored by an agency of the United States Government. Neither the United States Government nor any agency thereof, nor any of their employees, nor any of their contractors, subcontractors, or their employees, makes any warranty, express or implied, or assumes any legal liability or responsibility for the accuracy, completeness, or any third party’s use or the results of such use of any information, apparatus, product, or process disclosed, or represents that its use would not infringe privately owned rights. Reference herein to any specific commercial product, process, or service by trade name, trademark, manufacturer, or otherwise, does not necessarily constitute or imply its endorsement, recommendation, or favoring by the United States Government or any agency thereof or its contractors or subcontractors. The views and opinions of authors expressed herein do not necessarily state or reflect those of the United States Government or any agency thereof.
FINAL REPORT
Identification of UXO using the Associated Particle Neutron Time-of-Flight Technique
Project Number: MR-1769 Performing Organization: Brookhaven National Laboratory
Lead Principal Investigator: Sudeep Mitra Date: August 2011
Version#: 2

i
TABLE OF CONTENTS TABLE OF CONTENTS..............................................................................................................…i LIST OF FIGURES......................................................................................................................... ii LIST OF TABLES..........................................................................................................................iii ACRONYMS.................................................................................................................................. iv ACKNOWLEDGEMENTS............................................................................................................ .v 1. OBJECTIVE..............................................................................................................................1 2. TECHNICAL APPROACH……………………………………………………………… …1
2.1 METHODS…………………………………………………………………….. ........3 2.1.1 OPTIMIZATION OF GEOMETRY AND TIMING.....................................................6 2.1.2 PROOF-OF-CONCEPT STUDY...................................................................................6
3. RESULTS AND DISCUSSION............................................................................................... .7 3.1 TIME CALIBRATION................................................................................................ ..7 3.2 CALIBRATION FOR OBJECT LOCATION...............................................................8 3.3 TIME CORRELATED GAMMA-RAY SPECTRA....................................................10 3.4 ISOLATION OF GAMMA-RAYS FROM “UXO”.................................................…12 3.4.1 LOCATING THE BOTTLE OF WATER................................................................…14
4. REGULATORY ISSUES.....................................................................................................…16 5. CONCLUSIONS..................................................................................................................…16
5.1 FUTURE STRATEGIES........................................................................................... ..16 6. REFERENCES.........................................................................................................................17 APPENDIX-1 FIELD DEPLOYABLE ELECTRONICS (TASK 2).......................................... ..18 APPENDIX-2 POSITION SENSITIVE PMT HOUSING.......................................................... ..19 APPENDIX-3 ENERGY SPECTRUM OF NITROGEN..............................................................20 APPENDIX-4 RADIATION DOSE SURVEY........................................................................... ..21 APPENDIX-5 WHITE PAPER-MODELING FOR REAL UXO IDENTIFICATION................ 22
ii
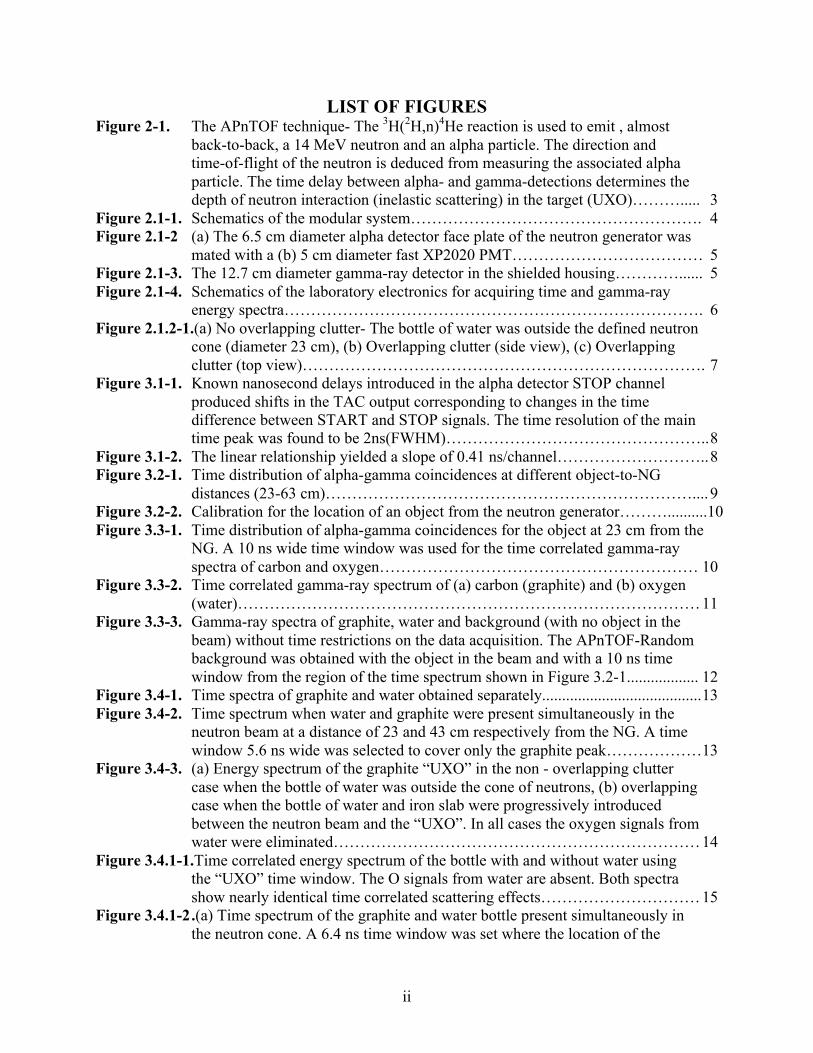
LIST OF FIGURES Figure 2-1. The APnTOF technique- The 3H(2H,n)4He reaction is used to emit , almost back-to-back, a 14 MeV neutron and an alpha particle. The direction and time-of-flight of the neutron is deduced from measuring the associated alpha
particle. The time delay between alpha- and gamma-detections determines the depth of neutron interaction (inelastic scattering) in the target (UXO)………..... 3
Figure 2.1-1. Schematics of the modular system………………………………………………. 4 Figure 2.1-2 (a) The 6.5 cm diameter alpha detector face plate of the neutron generator was
mated with a (b) 5 cm diameter fast XP2020 PMT……………………………… 5 Figure 2.1-3. The 12.7 cm diameter gamma-ray detector in the shielded housing…………...... 5 Figure 2.1-4. Schematics of the laboratory electronics for acquiring time and gamma-ray energy spectra……………………………………………………………………. 6 Figure 2.1.2-1.(a) No overlapping clutter- The bottle of water was outside the defined neutron
cone (diameter 23 cm), (b) Overlapping clutter (side view), (c) Overlapping clutter (top view)…………………………………………………………………. 7
Figure 3.1-1. Known nanosecond delays introduced in the alpha detector STOP channel produced shifts in the TAC output corresponding to changes in the time
difference between START and STOP signals. The time resolution of the main time peak was found to be 2ns(FWHM)………………………………………….. 8
Figure 3.1-2. The linear relationship yielded a slope of 0.41 ns/channel……………………….. 8 Figure 3.2-1. Time distribution of alpha-gamma coincidences at different object-to-NG
distances (23-63 cm)…………………………………………………………….... 9 Figure 3.2-2. Calibration for the location of an object from the neutron generator………..........10 Figure 3.3-1. Time distribution of alpha-gamma coincidences for the object at 23 cm from the
NG. A 10 ns wide time window was used for the time correlated gamma-ray spectra of carbon and oxygen…………………………………………………… 10
Figure 3.3-2. Time correlated gamma-ray spectrum of (a) carbon (graphite) and (b) oxygen (water)…………………………………………………………………………… 11
Figure 3.3-3. Gamma-ray spectra of graphite, water and background (with no object in the beam) without time restrictions on the data acquisition. The APnTOF-Random background was obtained with the object in the beam and with a 10 ns time window from the region of the time spectrum shown in Figure 3.2-1.................. 12
Figure 3.4-1. Time spectra of graphite and water obtained separately........................................ 13 Figure 3.4-2. Time spectrum when water and graphite were present simultaneously in the
neutron beam at a distance of 23 and 43 cm respectively from the NG. A time window 5.6 ns wide was selected to cover only the graphite peak……………… 13
Figure 3.4-3. (a) Energy spectrum of the graphite “UXO” in the non - overlapping clutter case when the bottle of water was outside the cone of neutrons, (b) overlapping
case when the bottle of water and iron slab were progressively introduced between the neutron beam and the “UXO”. In all cases the oxygen signals from water were eliminated…………………………………………………………… 14
Figure 3.4.1-1.Time correlated energy spectrum of the bottle with and without water using the “UXO” time window. The O signals from water are absent. Both spectra show nearly identical time correlated scattering effects………………………… 15 Figure 3.4.1-2 .(a) Time spectrum of the graphite and water bottle present simultaneously in the neutron cone. A 6.4 ns time window was set where the location of the

iii
water bottle was expected, (b) the energy spectrum revealed the oxygen signals from water……………………………………………………………………… 15
Figure A1-1. Schematics showing the front-end electronics that will amplify and shape detector signals and output digital signals for time stamping and furnishing List Mode data from the FPGA based data acquisition electronics…………….. 19 Figure A1-2. The assembled PCB showing the FPGA and the provision for five PMT
channels…………………………………………………………………………. 19 Figure A2 (a) The Hamamatsu H8500 PSPMT, (b) in the housing with flange for coupling with the API120 neutron generator’s alpha detector and (c) rear of the
PSPMT for signal read-out……………………………………………………… 20 Figure A3. Time correlated gamma-ray spectrum of nitrogen............................................... 21 Figure A4. Schematic showing the neutron and gamma dose map at the APnTOFfacility… 22 Figure A5-1 The MCNPX geometry setup was identical to the proof-of concept studies. 14
MeV neutron source particles were tracked in a 45 degree cone towards the graphite target.Two graphite-neutron source distances of 27 and 47 cm were modeled. The detector to sample distance of 55-69 cm was also maintained
The neutron generator or the surrounding structures were not modeled…………24 Figure A5-2 (a) Experimental and simulated time -of-flight spectra for the graphite sample at a distance of 27 cm from the neutron source. The diagonally dashed area
corresponds to gamma-rays from the neutron generator walls and nearby objects, (b) the time correlated experimental and simulated synthetic
spectrum showing the main, single(SE) and double escape (DE) peaks.............. 25 Figure A5-3 (a) Experimental and simulated time -of-flight spectra for the graphite sample at a distance of 47 cm from the neutron source. The diagonally dashed area corresponds to gamma rays from the neutron generator walls and nearby objects, (b) the time correlated experimental and simulated synthetic spectrum…………………………………………………………………………. 25 Figure A5-4 Calculated time versus energy plots for the graphite sample at a) 27 and b) 47 cm from the neutron source. The red color represents the maximum intensity of the carbon 4.43 MeV gamma-rays……………………… 26 Figure A5-5 Synthetic gamma-ray spectra of C, N and O showing the different Regions-Of- Interest (ROI) for determining the interference coefficients and extracting the elemental counts. ROI1 was set at 5.35-6.41 MeV,
ROI2 was 4.84-7.44 MeV and ROI3 was 4.24-4.72 MeV………………………. 27 Figure A5-6 Set-up for modeling the UXO interrogation……………………………………. 30 Figure A5-7 Smeared time spectrum of a 60 mm mortar resting on soil. The 4ns time cut used for eliminating soil signals and determining the time correlated
gamma-rays from theUXO is shown……………………………………………. 31 Figure A5-8 (a) Gamma-ray spectra show that the dominant signals are from the iron(Fe) of the shell. The 4ns time cut shows the absence of the Si (1.78MeV) line which is a good indicator for the successful elimination of soil signals, (b) Spectra showing the C, N and O signals...…………………………………...32 Figure A5-9 Synthetic spectra of the projectiles showing the C, N and O gamma-rays used for extracting their yields....……………………………...............................33
iv
LIST OF TABLES Table 3.3-1. Comparison of Peak/Background between the alpha-gamma coincidence and no-coincidence conditions for an MCA run of 600s Live Time…………… 12 Table A5-1 Interference coefficients…………………………………………………………. 28 Table A5-2 Data used for UXOs in the 57-155 mm range…………………………………. 28 Table A5-3 Chemical composition of the HE charge………………………………………. 29 Table A5-4 Detection efficiencies for measuring C, N and O in UXOs for a ten minute
interrogation time……………………………………………………………… 33

v
ACRONYMS
ADC-Analog to Digital Conversion APnTOF-Associated Particle neutron Time-of-Flight B-Background counts C-Carbon CFD-Constant Fraction Discriminator Cu- Copper DAQ-Data Acquisition System DE-Double Escape DoD-Department of Defence Fe-Iron FOFP-Fiber Optic Face Plate FPGA-Field Programmable Gate Array FWHM-Full Width Half Maximum HE-High Explosive I-Integral counts MCA-Multi channel Analyzer MCNPX-Monte Carlo N Particle MODAR-MCNP Output Data Analysis with ROOT N-Nitrogen NA-Not Available NG-Neutron generator NaI(Tl)-Sodium Iodide, Thallium doped NIM- Nuclear Instrumentation Module O-Oxygen P-Peak Counts PCA-Personal Computer Analyzer PCB-Printed Circuit Board PELAN-Pulsed Elemental Analysis with Neutrons PSPMT-Position Sensitive Photo Multiplier Tube PMT-Photo Multiplier Tube RB-Random Background SCA-Single Channel Analyzer SE-Single Escape SERDP-Strategic Environmental Research and Development Program Si-Silicon SiO2-Silicon Dioxide SNR-Signal-to-noise ratio TAC-Time-to-Amplitude Convertor USB-Universal Serial Bus UXO-Unexploded Ordnance VHDL-Verilog Hardware Description Language ZnO(Ga)-Zinc Oxide, Gallium doped
vi
ACKNOWLEDGEMENTS The PI would like to thank James Simpson and Michael Lemchak of Thermo Electron Corporation (Colorado Springs, CO) for the loan of the API120 neutron generator, to Istvan Dioszegi, Ph.D., (Scientist, Nonproliferation and National Security Department) for his interest and the loan of several electronic modules and initial set-up of electronics and to SERDP for funding and supporting the work.

1
1. OBJECTIVE The project’s goal is to develop a prototype field-deployable device that will non-destructively identify the fillers of previously found UXO as high explosive or benign using the APnTOF technique. Discriminating between UXO and non-hazardous items is a continuing complex problem that limits the effective remediation at Department of Defense (DoD) sites and improvements are needed in the technologies to reduce false alarms. The project addressed the Broad Agency Announcement released November 8, 2007 and SON Number MMSON-09-3 for “Advanced Technologies for Detection, Discrimination and Remediation of Military Munitions”. The suitability of the Associated Particle neutron Time-of-Flight technique (APnTOF) will be demonstrated. This technique will employ an electronically collimated tagged neutron beam from a novel compact, portable 14 MeV neutron generator system that can simultaneously provide 3-D imaging of objects and register their elemental composition. This advance firstly will allow us to inspect a specific element of volume, thus improving the selectivity, and hence, signal-to-noise ratio over present neutron-interrogation methods; the identification of small ammunition (20-40 mm shell diameters) will be enhanced. Secondly, it will offer elemental distribution maps of the selected voxel to better identify the type of munition. The APnTOF’s main advantage is its ability to suppress the background signal that is unrelated to the inspected area by imposing several conditions on the data-acquisition system. Year one constituted proof-of-concept studies and the main tasks to accomplish were:
1. Design and build electronics for laboratory experiments. 2. Develop FPGA based Time-to-Digital Converter and supporting USB data acquisition
firmware and software. 3. Test the coincidence spectroscopy system. 4. Demonstrate that “UXO” can be isolated from clutter.
Results from these studies also constituted a go-no go decision point. Success would mean:
• The main component, the candidate neutron generator provides stable neutron output and is easily integrated with the detector and data acquisition systems.
• The system is optimized in terms of geometry and timing. • The laboratory studies will provide the benchmark data to proceed towards the design
and construction of a field deployable instrument.
2. TECHNICAL APPROACH
The only technique showing promise for the non-destructive elemental characterization of surface- and sub-surface-UXOs utilizes neutron interactions with the unknown material. Given the high penetrating power of neutrons, such neutron-based techniques have been actively pursued for over two decades for the non-intrusive inspection of concealed explosives in objects ranging from small airline bags to large shipping containers (1). This methodology rests on the principle that explosives can be distinguished from each other and from innocuous materials by analyzing the quantities and ratios of carbon (C), nitrogen (N), and (O) in the material (2,3). Neutron-interrogation methods for fill material exploit either or both of two types of neutron interactions with nuclei, (a) inelastic scattering, and, (b) neutron captures, and then detects the induced element- specific high-energy prompt gamma rays. While these systems have some capability to characterize larger ammunitions (shells 90mm and more), several unresolved issues
2
hinder the wide application of this potentially very suitable technique. The most important one is that neutrons interact with all surrounding matter, not only with the interrogated material, leading to a very high gamma-ray background in the detector. Systems requiring bulky shielding and having poor SNRs for measuring elements are unsuitable. In particular, Womble(4) pointed out in a 2004 phase 1 demonstration report of the PELAN system that because soil contains many of the same elements (likely to be dominated by O) that are inside a shell, the SNR is severely affected by the background. Further, these techniques afford no information on the position sensitivity of the detected elements, so reducing the background from clutter will be difficult, if not impossible. The APnTOF technique being applied in this project is based on using mono-energetic neutrons produced by accelerating deuterium ions into the tritium target of a neutron generator. This reaction produces neutrons and alpha particles of 14.1 and 3.5 MeV, respectively, which are generated nearly back-to-back relative to the production site in the tritium target; this correlation is used to tag a specific fraction of the emitted neutrons. The neutrons within this cone, defined by the detection of correlated alpha-particles by a built-in alpha-detector in the neutron generator, interact with the nuclei of the interrogated object (often via inelastic scattering reactions), and emit element-specific prompt gamma- rays. Gamma detectors, in turn, uncover these rays. Measuring the time difference between detecting the alpha particles and the gamma radiation gives the distance traveled by the neutron before it scattered from a nucleus in the interrogated object (14- MeV neutrons travel at 5 cm/nanosecond, while gamma rays move at 30 cm/nanosecond). The energy spectrum of the gamma rays provides a means for identifying the element that scattered the neutrons, and the time delay in detecting a particular gamma-ray after detecting the alpha particle (corresponding to the neutron-time-of-flight) yields the position along the cone where the reaction occurred. This information, along with directional data from the position-sensitive alpha detector enables the investigator to determine the site of origin of the particular gamma-ray (C, N, or O) within the interrogated volume. Since the energy spectra are obtained from alpha-gamma coincidences, the data-acquisition system does not register gamma rays that do not fit into this correlation; thus, it excludes gamma- rays from the soil surrounding a munitions casing, those from clutter and those from reactions with neutrons that have lost their energy in multiple collisions with surrounding matter (thermalised neutrons). The SNR for measuring the C, N, and O signatures of filler material also simultaneously improve. The availability of compact sealed neutron generators with embedded alpha-particle detector makes it promising for field deployability (5, 6). Figure2-1 is a schematic of the APnTOF technique.

3
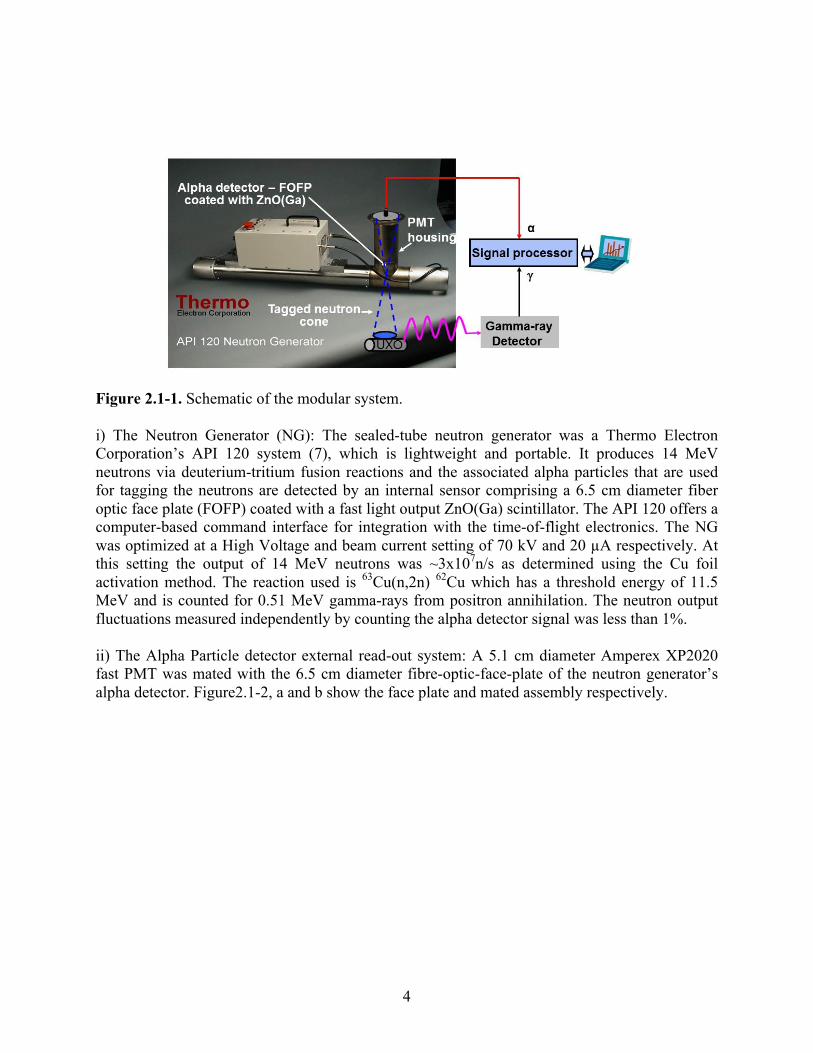
Figure 2-1. The APnTOF technique- The 3H(2H,n)4He reaction is used to emit , almost back-to-back, a 14 MeV neutron and an alpha particle. The direction and time-of-flight of the neutron is deduced from measuring the associated alpha particle. The time delay between alpha- and gamma-detections determines the depth of neutron interaction (inelastic scattering) in the target (UXO). 2.1 Methods The APnTOF system is modular, with independent functional modules. The schematic is shown in Fig.2.1-1. The main modules are: i) The Neutron Generator ii) The Alpha Particle detector external read-out system iii) The Gamma-ray detector, and iv) The data acquisition electronics (signal processor)
4
Figure 2.1-1. Schematic of the modular system. i) The Neutron Generator (NG): The sealed-tube neutron generator was a Thermo Electron Corporation’s API 120 system (7), which is lightweight and portable. It produces 14 MeV neutrons via deuterium-tritium fusion reactions and the associated alpha particles that are used for tagging the neutrons are detected by an internal sensor comprising a 6.5 cm diameter fiber optic face plate (FOFP) coated with a fast light output ZnO(Ga) scintillator. The API 120 offers a computer-based command interface for integration with the time-of-flight electronics. The NG was optimized at a High Voltage and beam current setting of 70 kV and 20 µA respectively. At this setting the output of 14 MeV neutrons was ~3x10⁷n/s as determined using the Cu foil activation method. The reaction used is 63Cu(n,2n) 62Cu which has a threshold energy of 11.5 MeV and is counted for 0.51 MeV gamma-rays from positron annihilation. The neutron output fluctuations measured independently by counting the alpha detector signal was less than 1%. ii) The Alpha Particle detector external read-out system: A 5.1 cm diameter Amperex XP2020 fast PMT was mated with the 6.5 cm diameter fibre-optic-face-plate of the neutron generator’s alpha detector. Figure2.1-2, a and b show the face plate and mated assembly respectively.
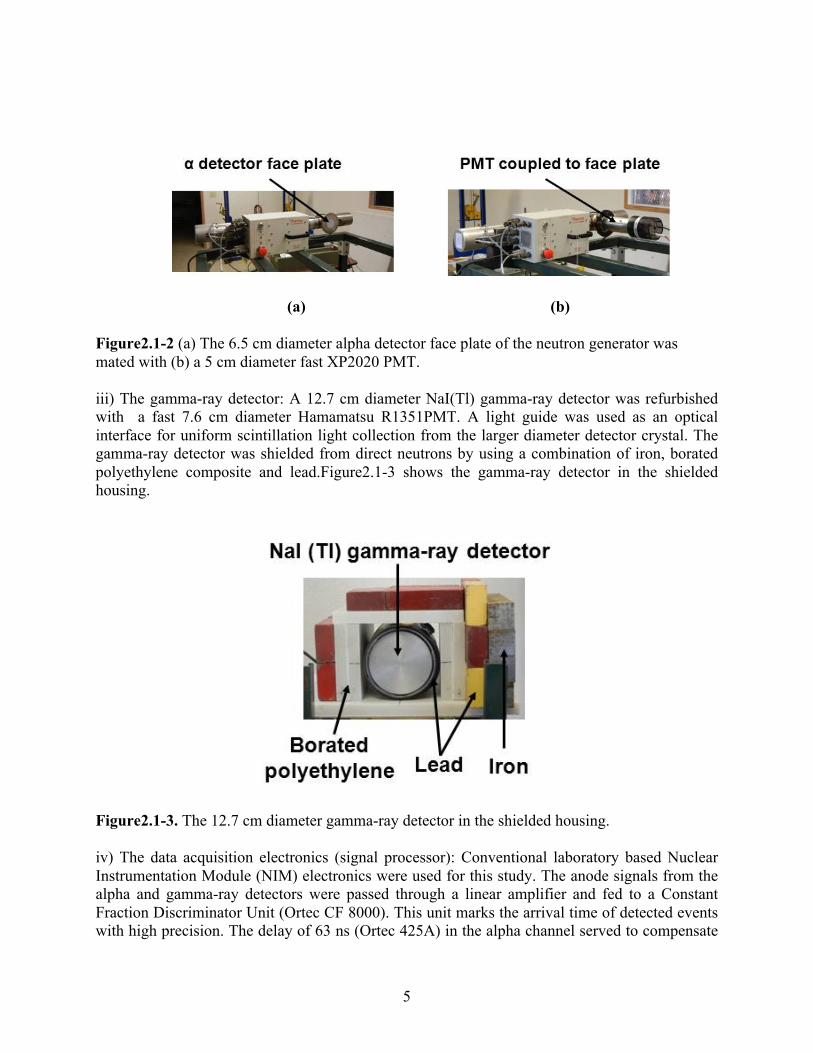
5
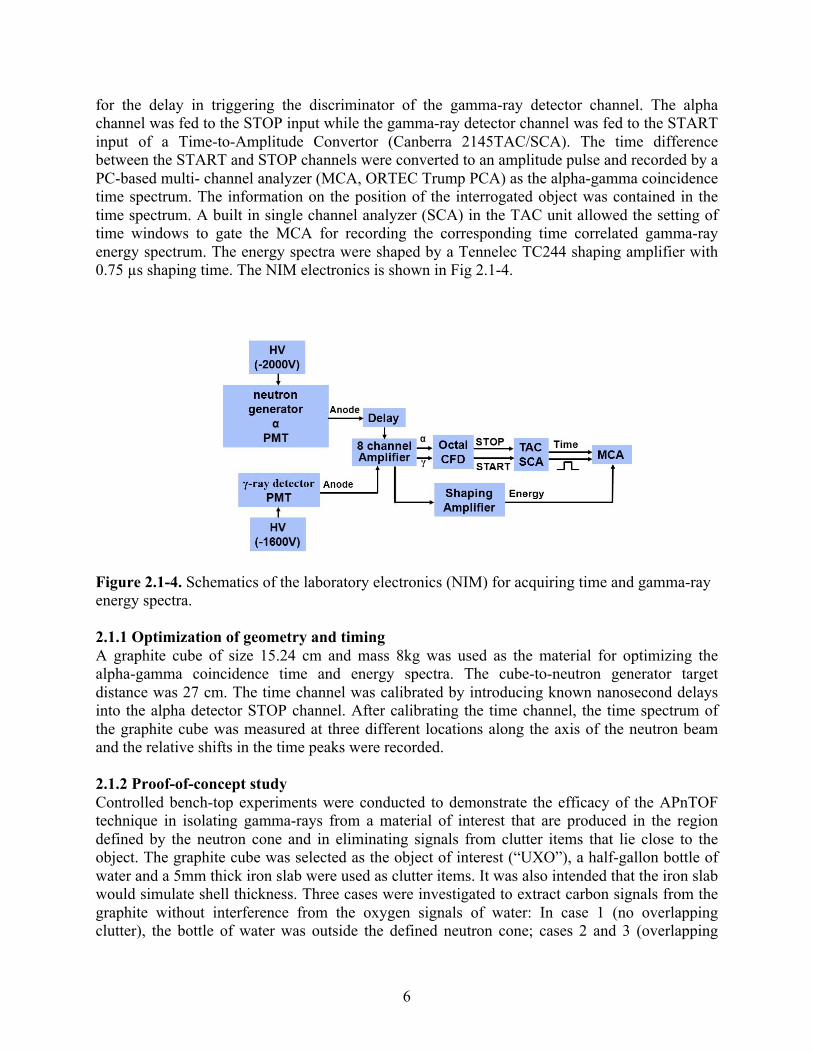
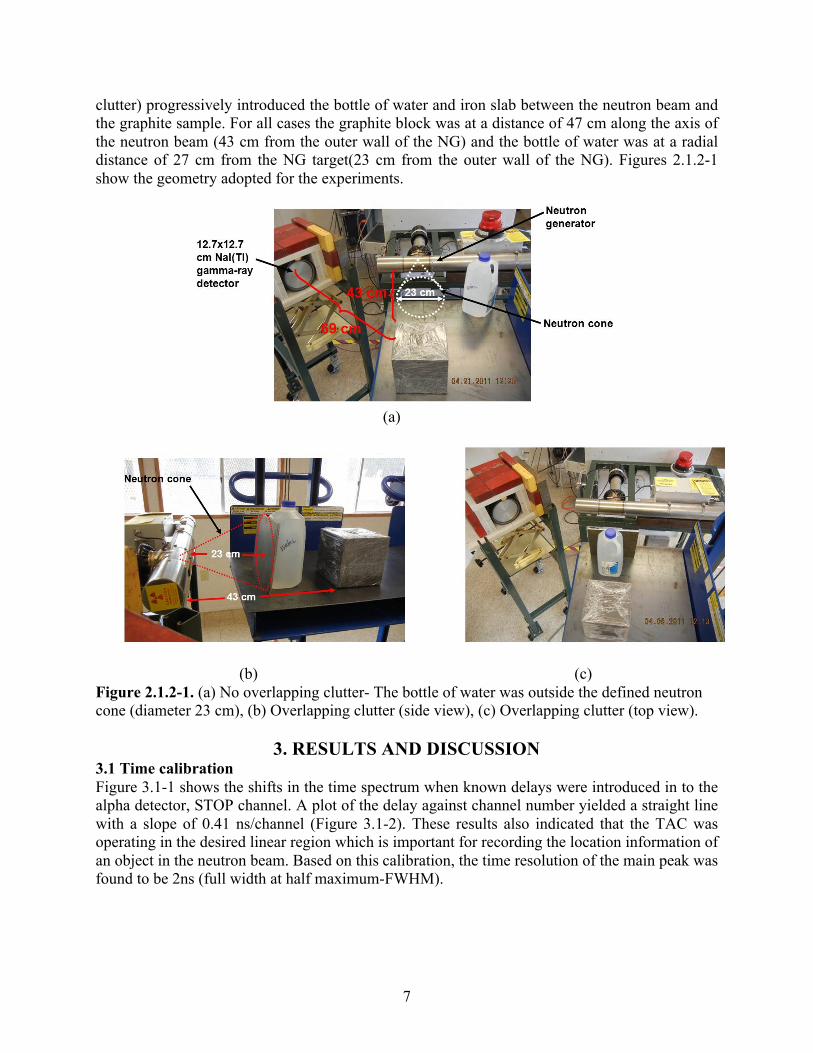
(a) (b) Figure2.1-2 (a) The 6.5 cm diameter alpha detector face plate of the neutron generator was mated with (b) a 5 cm diameter fast XP2020 PMT. iii) The gamma-ray detector: A 12.7 cm diameter NaI(Tl) gamma-ray detector was refurbished with a fast 7.6 cm diameter Hamamatsu R1351PMT. A light guide was used as an optical interface for uniform scintillation light collection from the larger diameter detector crystal. The gamma-ray detector was shielded from direct neutrons by using a combination of iron, borated polyethylene composite and lead.Figure2.1-3 shows the gamma-ray detector in the shielded housing. Figure2.1-3. The 12.7 cm diameter gamma-ray detector in the shielded housing. iv) The data acquisition electronics (signal processor): Conventional laboratory based Nuclear Instrumentation Module (NIM) electronics were used for this study. The anode signals from the alpha and gamma-ray detectors were passed through a linear amplifier and fed to a Constant Fraction Discriminator Unit (Ortec CF 8000). This unit marks the arrival time of detected events with high precision. The delay of 63 ns (Ortec 425A) in the alpha channel served to compensate
6
for the delay in triggering the discriminator of the gamma-ray detector channel. The alpha channel was fed to the STOP input while the gamma-ray detector channel was fed to the START input of a Time-to-Amplitude Convertor (Canberra 2145TAC/SCA). The time difference between the START and STOP channels were converted to an amplitude pulse and recorded by a PC-based multi- channel analyzer (MCA, ORTEC Trump PCA) as the alpha-gamma coincidence time spectrum. The information on the position of the interrogated object was contained in the time spectrum. A built in single channel analyzer (SCA) in the TAC unit allowed the setting of time windows to gate the MCA for recording the corresponding time correlated gamma-ray energy spectrum. The energy spectra were shaped by a Tennelec TC244 shaping amplifier with 0.75 µs shaping time. The NIM electronics is shown in Fig 2.1-4. Figure 2.1-4. Schematics of the laboratory electronics (NIM) for acquiring time and gamma-ray energy spectra. 2.1.1 Optimization of geometry and timing A graphite cube of size 15.24 cm and mass 8kg was used as the material for optimizing the alpha-gamma coincidence time and energy spectra. The cube-to-neutron generator target distance was 27 cm. The time channel was calibrated by introducing known nanosecond delays into the alpha detector STOP channel. After calibrating the time channel, the time spectrum of the graphite cube was measured at three different locations along the axis of the neutron beam and the relative shifts in the time peaks were recorded. 2.1.2 Proof-of-concept study Controlled bench-top experiments were conducted to demonstrate the efficacy of the APnTOF technique in isolating gamma-rays from a material of interest that are produced in the region defined by the neutron cone and in eliminating signals from clutter items that lie close to the object. The graphite cube was selected as the object of interest (“UXO”), a half-gallon bottle of water and a 5mm thick iron slab were used as clutter items. It was also intended that the iron slab would simulate shell thickness. Three cases were investigated to extract carbon signals from the graphite without interference from the oxygen signals of water: In case 1 (no overlapping clutter), the bottle of water was outside the defined neutron cone; cases 2 and 3 (overlapping
7
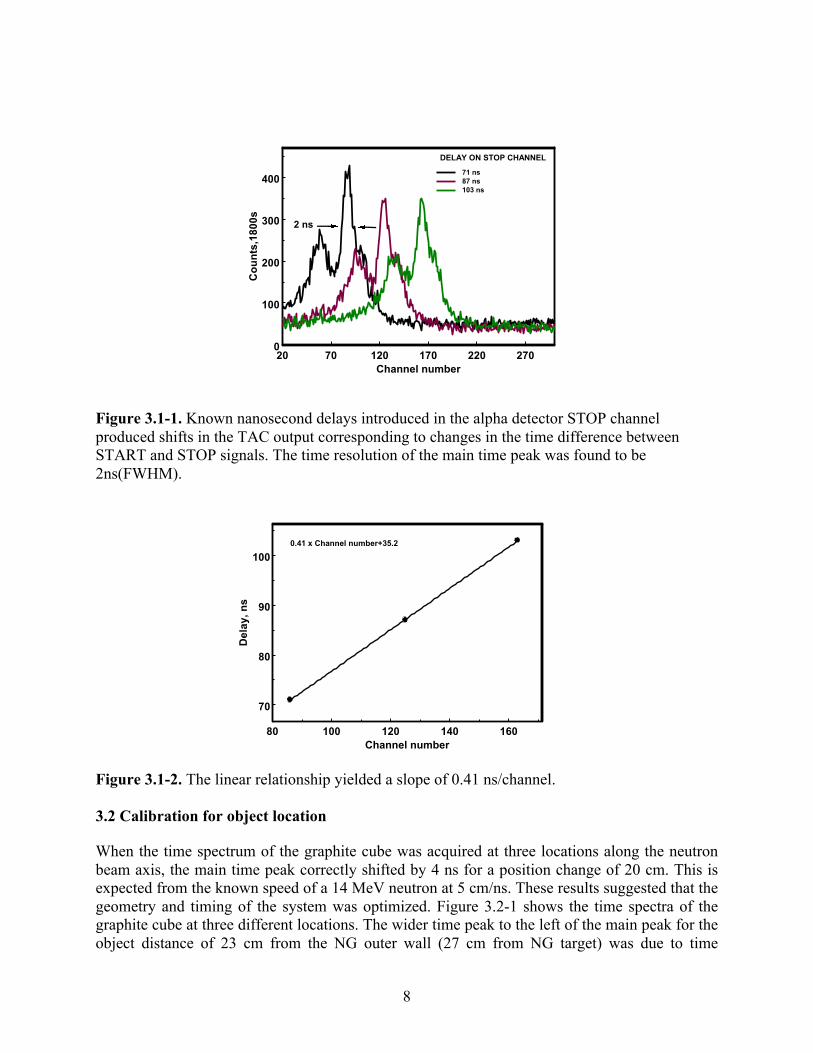
clutter) progressively introduced the bottle of water and iron slab between the neutron beam and the graphite sample. For all cases the graphite block was at a distance of 47 cm along the axis of the neutron beam (43 cm from the outer wall of the NG) and the bottle of water was at a radial distance of 27 cm from the NG target(23 cm from the outer wall of the NG). Figures 2.1.2-1 show the geometry adopted for the experiments.
(a)
(b) (c) Figure 2.1.2-1. (a) No overlapping clutter- The bottle of water was outside the defined neutron cone (diameter 23 cm), (b) Overlapping clutter (side view), (c) Overlapping clutter (top view).
3. RESULTS AND DISCUSSION 3.1 Time calibration Figure 3.1-1 shows the shifts in the time spectrum when known delays were introduced in to the alpha detector, STOP channel. A plot of the delay against channel number yielded a straight line with a slope of 0.41 ns/channel (Figure 3.1-2). These results also indicated that the TAC was operating in the desired linear region which is important for recording the location information of an object in the neutron beam. Based on this calibration, the time resolution of the main peak was found to be 2ns (full width at half maximum-FWHM).
8
Figure 3.1-1. Known nanosecond delays introduced in the alpha detector STOP channel produced shifts in the TAC output corresponding to changes in the time difference between START and STOP signals. The time resolution of the main time peak was found to be 2ns(FWHM). Figure 3.1-2. The linear relationship yielded a slope of 0.41 ns/channel. 3.2 Calibration for object location When the time spectrum of the graphite cube was acquired at three locations along the neutron beam axis, the main time peak correctly shifted by 4 ns for a position change of 20 cm. This is expected from the known speed of a 14 MeV neutron at 5 cm/ns. These results suggested that the geometry and timing of the system was optimized. Figure 3.2-1 shows the time spectra of the graphite cube at three different locations. The wider time peak to the left of the main peak for the object distance of 23 cm from the NG outer wall (27 cm from NG target) was due to time
80 100 120 140 160Channel number
70
80
90
100
Del
ay, n
s
0.41 x Channel number+35.2
20 70 120 170 220 270Channel number
0
100
200
300
400
Cou
nts,
1800
s
71 ns87 ns103 ns
DELAY ON STOP CHANNEL
2 ns

9
correlated neutrons being scattered into the gamma-ray detector. This effect decreased as reflected in the disappearance of the scattered peak when the object-to-NG distance (43 and 63 cm) and consequent object-to-gamma-ray detector increased. This effect is related to the decrease of neutron flux according to 1/r2 (inverse-square law) where r is the distance of the object from the NG target. The decrease in the neutron flux with distance also decreased the intensity of the time peak. The random background which constitutes the base line of the time spectrum is due to time uncorrelated gamma-rays being registered at the same time as the time correlated gamma-rays. These are the events that constitute the noise in the APnTOF technique. Figure 3.2-1. Time distribution of alpha-gamma coincidences at different object-to-NG distances (23-63 cm from outer wall of NG). A plot of the distance of the object from the NG against the peak channel number yielded the calibration in terms of locating objects. This is shown in Figure 3.2-2.
20 70 120 170Channel number
0
100
200
300
400
Cou
nts,
1800
s
23 cm43 cm63 cm
4 ns
Random background
neutron scatteringeffect from graphite
neutron direction

10
Figure 3.2-2. Calibration for the location of an object from the neutron generator. 3.3 Time correlated gamma-ray spectra. Using a time window of 10 ns (Figure 3.3-1), time correlated gamma-ray spectra of carbon and oxygen were recorded independently using the graphite cube and a gallon of water respectively. The objects were located at a distance of 23 cm from the outer wall of the NG. Figure3.3-1. Time distribution of alpha-gamma coincidences for the object at 23 cm from the NG. A 10 ns wide time window was used for the time correlated gamma-ray spectra of carbon and oxygen. The time correlated gamma-ray spectrum of the graphite cube and the bottle of water are shown in Figure 3.3-2a and b respectively. The typical two peak structure of the carbon peak
65 70 75 80 85Channel number
20
30
40
50
60
Dis
tanc
e fr
om n
eutr
on g
ener
ator
, cm 197.0 - 2.0 x Channel number
20 70 120 170Channel number
0
100
200
300
400
Cou
nts,
1800
s
10 ns time window
neutron direction

11
corresponding to the main energy of 4.43 MeV and the 3.92 MeV escape peak is seen due to the 12C(n,n’γ) 12C inelastic scattering reaction. The oxygen spectrum is more complex and shows all the major excited states following different nuclear reactions. The peaks at 2.75 and 6.13 are due to the 16O(n,n’γ)16O reaction while the peaks at 3.68 and 3.85 MeV are due to the 16O(n,α)13C. The minor peak at 4.43 MeV is emitted following the 16O(n,n’α)12C reaction. However the cross section for this reaction is negligible below 11 MeV.
Figure3.3-2. (a) Time correlated gamma-ray spectrum of carbon (graphite) and (b) oxygen (water). To compare the APnTOF technique with conventional neutron interrogation, the gamma-ray spectra of the same objects were also measured with no time restrictions on the data acquisition. The spectra are presented in Figure 3.3-3 for a 600s acquisition time. This corresponds to a continuous neutron output typical for a one hour operation of a 14 MeV pulsed neutron generator operating at a 10 kHz repetition rate and 15µs wide neutron pulse. The spectra with no time window show the high gamma-ray background from surrounding material and from neutron reactions in the detector. The peaks due to the shielding materials, lead (2.62 MeV) and carbon (4.43MeV) from the borated polyethylene clearly dominate the spectra. As a comparison, the random background recorded with a 10 ns window which was set from the region shown in Figure 3.2-1 was almost a factor 104 lower than the background obtained with no time window. The basic difference between the two background determinations is that the spectrum with no time window can only be determined with no object in the beam, whereas the time gated background is determined with the object in the beam. The latter background more accurately reflects the neutron scattering effects related to the object.
1 3 5 7Energy, MeV
0
50
100
150
200
250
Cou
nts,
180
0s
4.43 Carbon(a)
1 3 5 7Energy, MeV
0
50
100
150
200
Cou
nts,
360
0s
6.13
2.75
3.683.85
4.43
Oxygen(b)

12
Figure 3.3-3. Gamma-ray spectra of graphite, water and background (with no object in the beam) without time restrictions on the data acquisition. The APnTOF-Random background was obtained with the object in the beam and with a 10 ns time window from the region of the time spectrum shown in Figure 3.2-1. Simple SNR calculations were computed from Peak to Background counts ratio in the energy peaks at 4.43 MeV for C and 6.13 MeV for O and the results are summarized in Table 3.3-1. Table 3.3-1 Comparison of Peak/Background between the alpha-gamma coincidence and no-coincidence conditions for a MCA run of 600s Live Time.
Condition Element Energy(MeV) Peak counts(P)
Background counts(B)
P/B
No coincidence
C 4.43 9682 7645 1.3
O 6.13 4738 3767 1.3 Coincidence C 4.43 86 4 22
O 6.13 20 2 10 It can be seen that the P/B ratios of the coincidence technique are vastly improved compared to the no coincidence case. 3.4 Isolation of gamma-rays from “UXO” Time spectra of the graphite and bottle of water were first determined independently at their respective locations. These are shown in Figure 3.4-1. It can be seen that although the time peaks
2 4 6 8Energy, MeV
100
101
102
103
104
Cou
nts,
600
s
Water(one gallon)Graphite(8kg)Background
6.13 (O)4.43 (C)
2.62 (Pb)
APnTOF- Random background
Spectra with no time gate

13
are resolvable based on the differences in neutron flight time to the objects there is a considerable overlap of the two spectra because of the limitations of the time resolution of the system and the large size of the objects. Figure 3.4-1. Time spectra of graphite and water obtained separately. Fig 3.4-2 shows the time spectrum when both the objects are simultaneously present in the defined neutron cone in an overlapping mode. The composite spectrum now shows the two peaks corresponding to the two objects at their location. However the intensity of the graphite peak is significantly diminished as expected because the water removes useful neutrons from the beam mainly via elastic scattering reactions with the hydrogen of water. Figure 3.4-2. Time spectrum when water and graphite were present simultaneously in the neutron beam at a distance of 23 and 43 cm respectively from the NG. A time window, 5.6 ns wide, was selected to cover only the graphite peak.
20 70 120 170Channel number
20
70
120
170
220
Cou
nts,
180
0s
5.6 ns "UXO" time windowGraphite("UXO"), 43 cmWater, 23 cm
neutron direction
20 70 120 170Channel number
20
70
120
170
220
Cou
nts,
180
0s
5.6 ns "UXO" time window
neutron direction
water, 23 cmGraphite,43 cm

14
Based on the individual and composite time spectra, a time window 5.6 ns wide was set in the region corresponding to the graphite location and time correlated gamma-ray spectra were obtained for the three cases of non- overlapping and overlapping clutter. Figure 3.4-3a shows the time correlated gamma-ray spectrum for the case when the bottle of water was outside the defined neutron cone. It can be seen that the time slice completely eliminated the oxygen signals from the water although the water bottle was in a neutron field with the same neutron flux. The oxygen signals were eliminated in this case because the neutron field at the location of the water bottle was time uncorrelated.
Figure 3.4-3.(a) Energy spectrum of the graphite “UXO” in the non - overlapping clutter case when the bottle of water was outside the cone of neutrons, (b) overlapping case when the bottle of water and iron slab were progressively introduced between the neutron beam and the “UXO”. In all cases the oxygen signals from water were eliminated. Figure 3.4-3b shows the time correlated energy spectra for the graphite in the overlapping case when the bottle of water and iron slab was progressively introduced in to the neutron cone between the NG and graphite. The time slice completely eliminated the signals from O; in this case because of selective neutron flight time to the object of interest. There was a significant drop (50%) in the 4.43 MeV C peak because the water removed a significant amount of neutrons from the beam. When the iron slab was additionally introduced in the beam a further reduction of ~10% occurred. These data suggest that in a real-world case the intensity of the filler signals in the energy range 4-7 MeV, will be lowered by less than ~10% because of the casing material. The lower energy signals below 3 MeV are a result of additional time correlated neutron scattering effects from the near-by overlapping clutter.
3.4.1 Locating the bottle of water
An additional demonstration of the effectiveness of time slicing in locating an object was to reveal the location of the water bottle in the present geometry. Figure 3.4.1-1 shows the energy spectrum of the bottle with and without water when the 5.6 ns “UXO” time window used in the previous experiments was employed. The graphite sample was removed from these experiments. It can be seen that the characteristic O signals from water are absent. The spectral
1 2 3 4 5 6 7Energy, MeV
10
30
50
70
90
110
Cou
nts,
360
0s
"UXO"+Water (case2)"UXO"+Water+Iron shield(Case3)
(b)
1 2 3 4 5 6 7Energy, MeV
10
50
90
130
Cou
nts,
360
0s
(a)
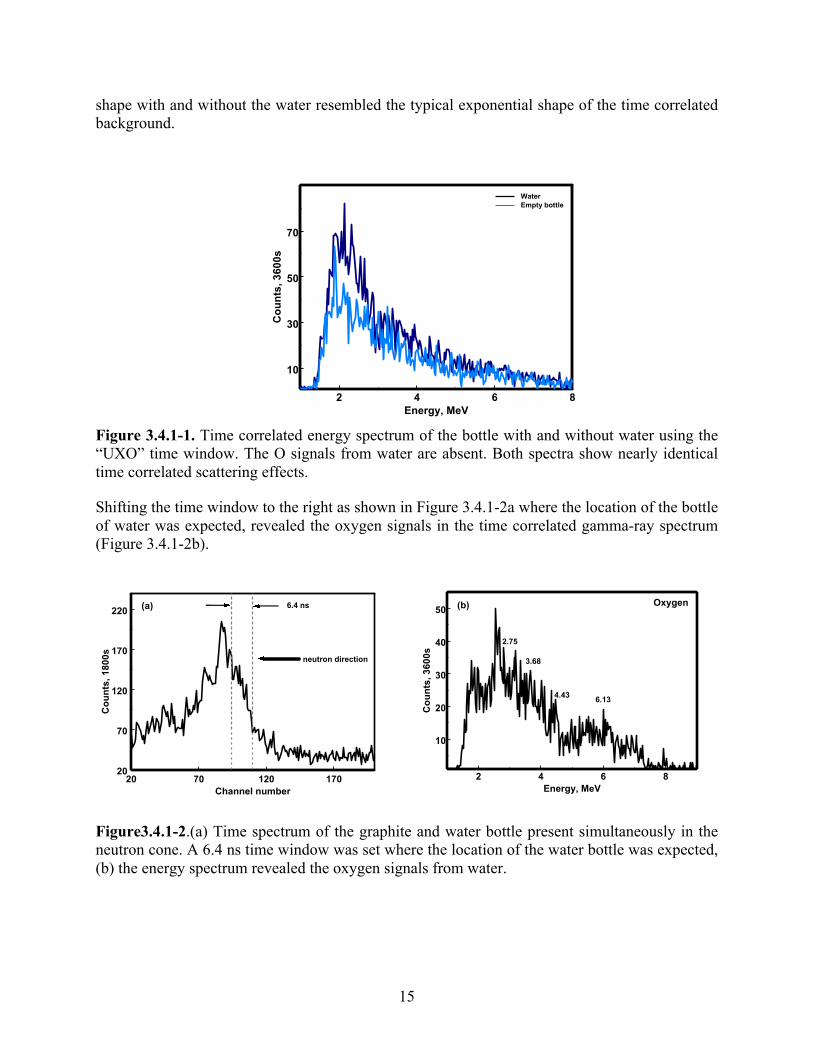
15
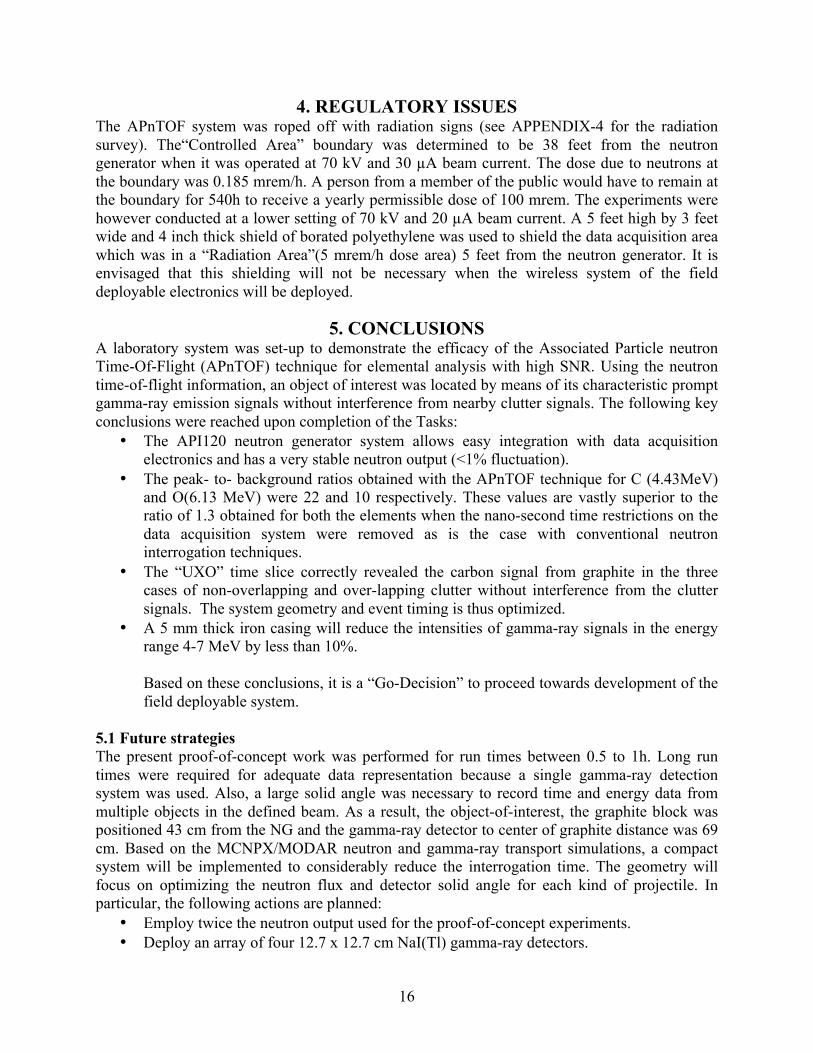
shape with and without the water resembled the typical exponential shape of the time correlated background. Figure 3.4.1-1. Time correlated energy spectrum of the bottle with and without water using the “UXO” time window. The O signals from water are absent. Both spectra show nearly identical time correlated scattering effects. Shifting the time window to the right as shown in Figure 3.4.1-2a where the location of the bottle of water was expected, revealed the oxygen signals in the time correlated gamma-ray spectrum (Figure 3.4.1-2b).
Figure3.4.1-2.(a) Time spectrum of the graphite and water bottle present simultaneously in the neutron cone. A 6.4 ns time window was set where the location of the water bottle was expected, (b) the energy spectrum revealed the oxygen signals from water.
20 70 120 170Channel number
20
70
120
170
220
Cou
nts,
180
0s
6.4 ns
neutron direction
(a)
2 4 6 8Energy, MeV
10
20
30
40
50
Cou
nts,
360
0s
4.43
3.68
2.75
Oxygen
6.13
(b)
2 4 6 8Energy, MeV
10
30
50
70
Cou
nts,
360
0s
Water Empty bottle
16
4. REGULATORY ISSUES The APnTOF system was roped off with radiation signs (see APPENDIX-4 for the radiation survey). The“Controlled Area” boundary was determined to be 38 feet from the neutron generator when it was operated at 70 kV and 30 µA beam current. The dose due to neutrons at the boundary was 0.185 mrem/h. A person from a member of the public would have to remain at the boundary for 540h to receive a yearly permissible dose of 100 mrem. The experiments were however conducted at a lower setting of 70 kV and 20 µA beam current. A 5 feet high by 3 feet wide and 4 inch thick shield of borated polyethylene was used to shield the data acquisition area which was in a “Radiation Area”(5 mrem/h dose area) 5 feet from the neutron generator. It is envisaged that this shielding will not be necessary when the wireless system of the field deployable electronics will be deployed.
5. CONCLUSIONS A laboratory system was set-up to demonstrate the efficacy of the Associated Particle neutron Time-Of-Flight (APnTOF) technique for elemental analysis with high SNR. Using the neutron time-of-flight information, an object of interest was located by means of its characteristic prompt gamma-ray emission signals without interference from nearby clutter signals. The following key conclusions were reached upon completion of the Tasks:
• The API120 neutron generator system allows easy integration with data acquisition electronics and has a very stable neutron output (<1% fluctuation).
• The peak- to- background ratios obtained with the APnTOF technique for C (4.43MeV) and O(6.13 MeV) were 22 and 10 respectively. These values are vastly superior to the ratio of 1.3 obtained for both the elements when the nano-second time restrictions on the data acquisition system were removed as is the case with conventional neutron interrogation techniques.
• The “UXO” time slice correctly revealed the carbon signal from graphite in the three cases of non-overlapping and over-lapping clutter without interference from the clutter signals. The system geometry and event timing is thus optimized.
• A 5 mm thick iron casing will reduce the intensities of gamma-ray signals in the energy range 4-7 MeV by less than 10%. Based on these conclusions, it is a “Go-Decision” to proceed towards development of the field deployable system.
5.1 Future strategies The present proof-of-concept work was performed for run times between 0.5 to 1h. Long run times were required for adequate data representation because a single gamma-ray detection system was used. Also, a large solid angle was necessary to record time and energy data from multiple objects in the defined beam. As a result, the object-of-interest, the graphite block was positioned 43 cm from the NG and the gamma-ray detector to center of graphite distance was 69 cm. Based on the MCNPX/MODAR neutron and gamma-ray transport simulations, a compact system will be implemented to considerably reduce the interrogation time. The geometry will focus on optimizing the neutron flux and detector solid angle for each kind of projectile. In particular, the following actions are planned:
• Employ twice the neutron output used for the proof-of-concept experiments. • Deploy an array of four 12.7 x 12.7 cm NaI(Tl) gamma-ray detectors.
17
• To maximize the utilization of counts in the spectra and reduce the statistical variation of counts, three large energy regions-of-interest will be implemented (5) as described in Appendix-5.
6. REFERENCES
1) T.Gozani, Neutron based non-intrusive inspection techniques, in: G.Vourvopoulos (Ed), Proceedings of the International Conference on Neutrons in Research and Industry, Proceedings of SPIE, Vol 2867, June 1996.
2) P.C.Womble, F.J. Schultz and G. Vourvopoulos, Non-destructive characterization using pulsed fast-thermal neutrons, Nucl. Instr and Methods in Phys. Research, B 99, 757(1995).
3) A. Buffler, F.D. Brooks, M.S. Allie, K. Bharuth-Ram and M.R. Nchodu, Materials classification by fast neutron scattering, Nucl. Instr. and Methods in Phys. Research, B 173, 483(2001).
4) P.C. Womble, Phase 1 demonstration report summary for: PELAN-A transportable neutron-based UXO Identification probe, “Environmental Security Technology Certification Program (ESTCP: 200106), February 13, 2004.
5) S. Mitra, J.E.Wolff , R. Garrett and C.W. Peters, Application of the associated particle technique for the whole-body measurement of protein, fat and water by 14 MeV neutron activation analysis- a feasibility study, Phys. Med. Biol., 40, 1045 (1995).
6) S.Mitra, J.E.Wolff and R. Garrett, Calibration of a prototype in vivo total body composition analyzer using 14 MeV neutron activation and the associated particle technique, Appl.Radiat.Isot.,49,5, 537 (1998).
7) D.L. Chichester, M. Lemchak, J.D. Simpson, The API 120: A portable neutron generator for the associated particle technique, Nucl.Instr. and Methods in Phys. Research, B241, 753(2005).
8) D. Pelowitz (ed.), MCNPX User’s Manual, Version 2.6.0, Los Alamos National Laboratory report LA-CP-07-1473 (April 2008).
9) C. Carasco, MCNP Output data analysis with ROOT (MODAR), Computer Physics Communications, 181, 1161(2010).

18
APPENDIX-1 FIELD DEPLOYABLE ELECTRONICS (TASK 2) Initial work towards field deployment was planned through Task2 in year 1 of the project. This involved development of the compact data acquisition electronics. In particular, the Field Programmable Gate Array (FPGA) based Time-to-Digital Converter and supporting USB data acquisition firmware and software were developed. The schematics of the overall pulse processing system are shown in Figure A1-1. Figure A1-1. Schematics showing the front-end electronics that will amplify and shape detector signals and output digital signals for time stamping and furnishing List Mode data from the FPGA based data acquisition electronics. The following tasks were accomplished:
• Two Printed Circuit Boards (PCBs) with components have been assembled. Figure A1-2 shows a picture of one such board.
• Firmware development (VHDL code) for implementing the FPGA functionality of the timing circuit has been completed.
• USB data acquisition firmware with wireless capability is functional.
Figure A1-2. The assembled PCB showing the FPGA and the provision for five PMT channels.
19
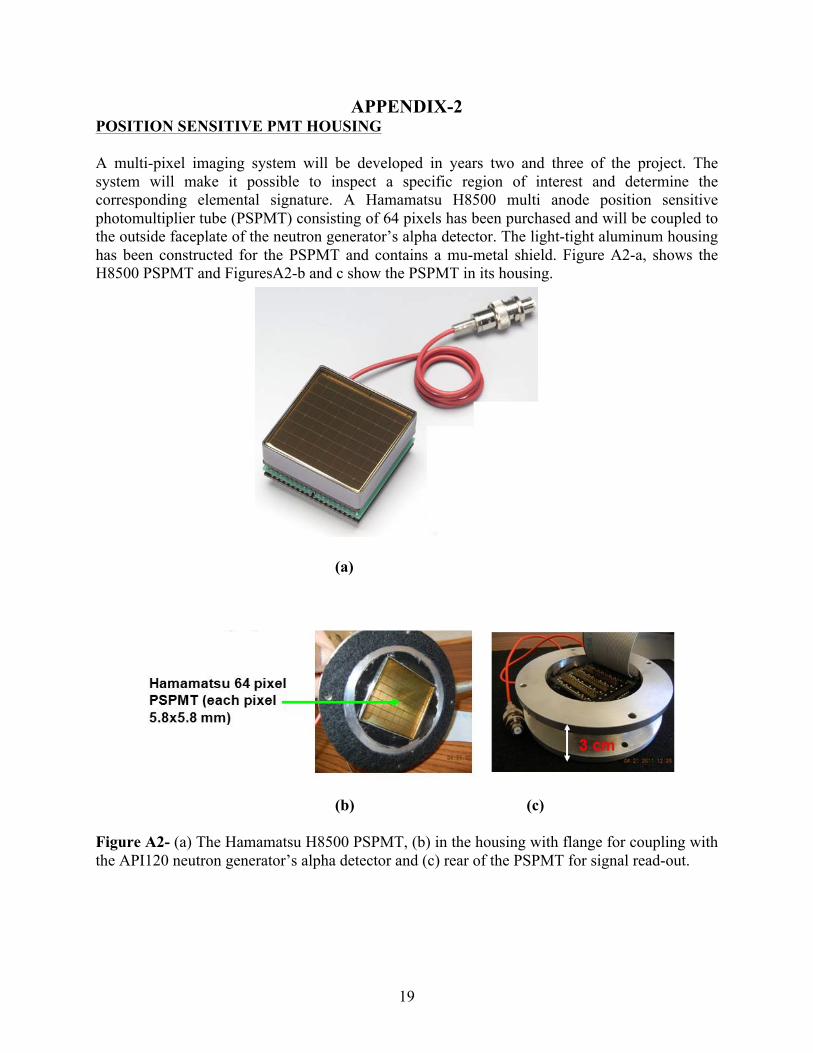
APPENDIX-2 POSITION SENSITIVE PMT HOUSING A multi-pixel imaging system will be developed in years two and three of the project. The system will make it possible to inspect a specific region of interest and determine the corresponding elemental signature. A Hamamatsu H8500 multi anode position sensitive photomultiplier tube (PSPMT) consisting of 64 pixels has been purchased and will be coupled to the outside faceplate of the neutron generator’s alpha detector. The light-tight aluminum housing has been constructed for the PSPMT and contains a mu-metal shield. Figure A2-a, shows the H8500 PSPMT and FiguresA2-b and c show the PSPMT in its housing.
(a)
(b) (c)
Figure A2- (a) The Hamamatsu H8500 PSPMT, (b) in the housing with flange for coupling with the API120 neutron generator’s alpha detector and (c) rear of the PSPMT for signal read-out.
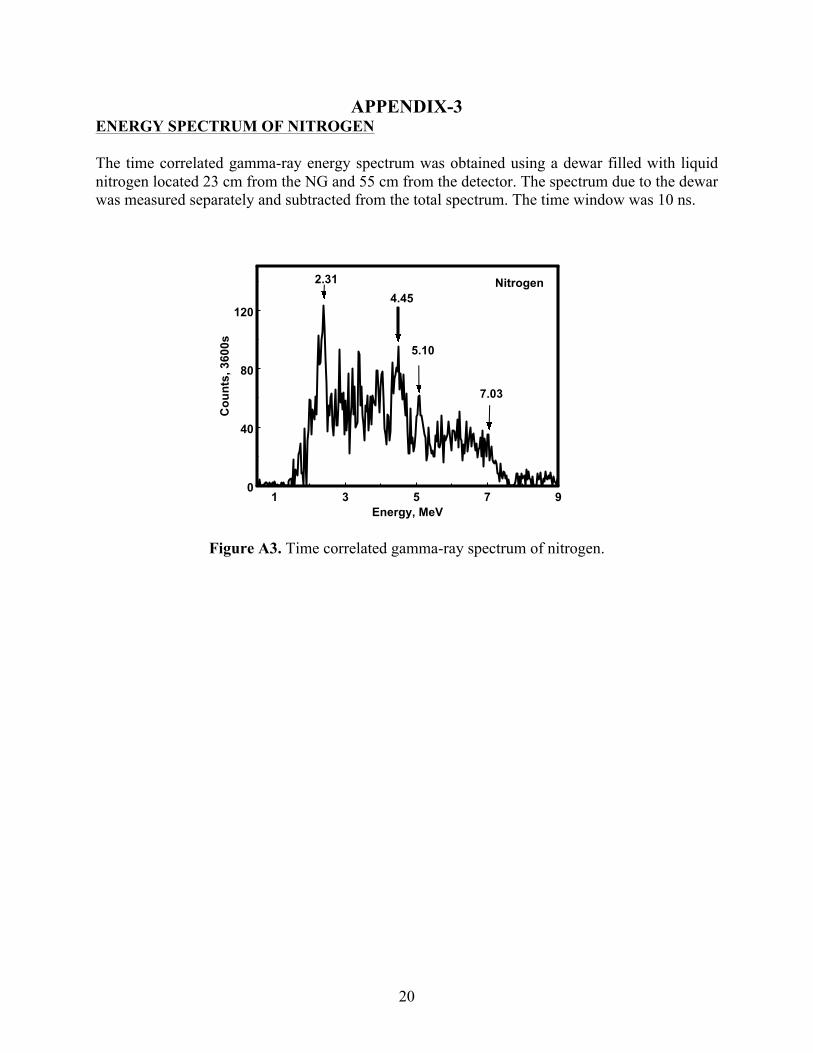
20
APPENDIX-3 ENERGY SPECTRUM OF NITROGEN The time correlated gamma-ray energy spectrum was obtained using a dewar filled with liquid nitrogen located 23 cm from the NG and 55 cm from the detector. The spectrum due to the dewar was measured separately and subtracted from the total spectrum. The time window was 10 ns.
Figure A3. Time correlated gamma-ray spectrum of nitrogen.
1 3 5 7 9Energy, MeV
0
40
80
120
Cou
nts,
360
0s
2.314.45
5.10
7.03
Nitrogen

21
APPENDIX-4 RADIATION DOSE SURVEY The Radiation Control Division at BNL performed a dose survey at the APnTOF facility. The Controlled area boundary was at a distance of 38 feet from the NG. Figure A4. Schematic showing the neutron and gamma dose map at the APnTOF facility.
Neutron Generator Data acquisition station Controlled Area (38 feet from the Neutron
Generator)
22
APPENDIX-5 WHITE PAPER
(Sudeep Mitra and Istvan Dioszegi1)
MODELING THE DETECTION EFFICIENCIES OF CARBON, NITROGEN AND OXYGEN FOR REAL UXO IDENTIFICATION IN THE 57-155 mm RANGE Objective
Proof-of-principle calculations have been performed for modeling the detection efficiencies of carbon, nitrogen and oxygen inelastic gamma-rays from real UXOs (with appropriate steel case thicknesses and energetic material loads) ranging from 57-mm mortars to 155-mm projectiles following 14 MeV neutron interrogation. To achieve as short an inspection time as possible, a neutron output of 6x10⁷ n/s (twice that used for the proof-of-concept experiments) was employed and gamma-ray yields for carbon, nitrogen and oxygen were determined using an array of four cylindrical NaI(Tl) gamma-ray detectors, each of dimension (12.7x12.7cm).
Technical background
The Monte Carlo technique simulates the APnTOF experiment. It consists of following each particle (neutron or gamma-ray) from the event of creation in the source throughout its propagation through matter (diffusion and interactions with the constituent atoms of the material), to its capture, cut off, or escape from the system. The individual events comprising this process (so called “particle history”) are simulated sequentially and the probability distributions governing these events are statistically sampled. The technique, essentially attempts to simulate the actual statistical nature of the nuclear-interaction processes. These probabilities are derived either from physical laws or the widely used experimentally based cross-section libraries from Brookhaven National Laboratory’s Evaluated Nuclear Data File (ENDF) for all relevant reactions. The statistical sampling process is based on the selection of pseudo-random numbers- analogous to throwing dice in a gambling casino-hence the name “Monte Carlo”. The code thus determines which process occurs (scattering, absorption), how much energy is lost and the new direction of the particle after scattering. Sufficient numbers of particles are tracked so that parameters of interest could be scored with acceptable statistical errors. Detector responses were also predicted by the Monte Carlo code. Because of the ability of Monte Carlo computer experiments to simulate complex problem geometries and analyze neutron and gamma-ray transport, they offer an accurate understanding of the phenomenology.
The neutron and gamma-ray fluxes were computed from track lengths or collision densities and the neutron induced reaction rates were determined in chosen volume elements using the MCNPX code. In particular, the reaction rate (RR) for the explosive constituents, C, N and O has been computed according to:
1 Istvan Dioszegi is with the Nonproliferation and National Security Department, Brookhaven National Laboratory, Upton, NY 11973-5000

23
RR= C ∫ ϕn ∑i
rdEE)( (1)
Where ϕn(E), ∑rE)( and C represent the incoming neutron flux, the macroscopic cross-
section for a particular reaction, r, and the re-normalizing constant (usually the atomic density of the isotope, i), respectively. The estimated reaction rates were subsequently used for simulating the neutron induced pulse height spectra of gamma-rays arriving at the face of a NaI(Tl) detector. Further, the reaction rates were scored in a chosen neutron energy band at ~ 14.1 MeV because the interaction location is based on the 14.1 MeV neutron time-of-flight at 5cm/nanosecond. The simulated gamma-ray spectra thus reflect the 14.1 MeV neutron energy dependent reaction rates. Experimentally, these are the gamma-rays recorded that satisfy the alpha-gamma coincidence requirement of the APnTOF technique.
Methods MCNPX v27e was used for the Monte Carlo simulations (8). The tagged neutron beam was modeled using a 45 degree conical source. This was based on the cone defined by the API120 neutron generator’s alpha detector dimension and it’s distance from the tritium - target. The neutron induced gamma-ray flux and it’s time distribution at the detector surface was determined using the F5 point detector tally. The tally was then processed using the ROOT and MODAR packages (9). These packages are able to read in the MCNPX output file, extract two dimensional energy-time tally data, and place energy and time windows to select subsets of the data. These subsets were subsequently processed by independently smearing the time data with the time response of the electronics using a normal distribution and an energy response function for gamma-rays impinging on the face of a 12.7x12.7 cm cross-sectional area gamma-ray detector defined by: S(e0,t0) = * Re(e0) * e-(T(t)-T(t
0))2/(2 2) /( ) (2)
Where Re (e0) is the probability that a photon with energy E (e) leads to an energy deposit E(e0) in the gamma ray detector and is the time resolution. The one dimensional histogram Re was built from a parametrized analytic function that iteratively fit the detector response functions calculated in the energy range 0.1 MeV-8.5 MeV using the MCNPX, F8 pulse-height tally. The Gaussian energy broadening of the F8 tally takes in to account the measured energy resolution of the detector. For the present simulations, Re, was adapted from the work of Carasco(9) on similar sized NaI(Tl) detectors. The final spectra can thus be directly compared to the experiments.

24
Benchmarking the simulation The neutron and gamma-ray transports were modeled using the same geometry as was employed for the proof-of-concept studies as shown in FigureA5-1
Figure A5-1 The MCNPX geometry setup was identical to the proof-of concept studies. 14 MeV neutron source particles were tracked in a 45 degree cone towards the graphite target. Two graphite-neutron source distances of 27 and 47 cm were modeled. The detector to sample distance of 55-69 cm was also maintained. The neutron generator or the surrounding structures were not modeled. Comparison between experiment and simulation Since MCNPX computes the probability distributions of events for a given number of source particles (10 million source neutrons in the present simulations) and normalizes the result per source neutron, the simulation results are scaled to match the experimental data in terms of the run time, and neutron emission. Figure A5-2a shows the comparison of the smeared time spectrum with that obtained experimentally for the case when the graphite was 27 cm from the neutron generator. It can be seen that a 2ns standard deviation used for smearing could fit the experimental time window that was used for determining the time correlated gamma-ray spectrum. Since the modeling did not take into account the neutron scattering effects in the detector or the time correlated gamma-rays produced in the neutron generator or it’s immediate vicinity, only a single time peak resulted due to the graphite sample. The features to the left and right of the main peak noticed in the experimental time peak were thus absent. For comparison, the random background was estimated

25
and added to the simulated time spectrum. FigureA5-2b shows a comparison of the corresponding time correlated gamma-ray spectra of the simulation and experiment after the simulated spectrum was smeared and scaled for experimental run time and neutron flux. A linear background was determined from the experimental spectrum and added to the synthetic spectrum.
Figure A5-2 (a) Experimental and simulated time-of-flight spectra for the graphite sample at a distance of 27 cm from the neutron source. The diagonally dashed area corresponds to gamma-rays from the neutron generator walls and nearby objects, (b) the time correlated experimental and simulated synthetic spectrum showing the main, single (SE) and double escape (DE) peaks.
Comparison of the experimental and simulated spectra for the graphite sample - neutron source distance of 47 cm is shown in Figure A5-3.
Figure A5-3 (a) Experimental and simulated time-of-flight spectra for the graphite sample at a distance of 47 cm from the neutron source. The diagonally dashed area corresponds to gamma rays from the neutron generator walls and nearby objects, (b) the time correlated experimental and simulated synthetic spectrum.
1 2 3 4 5 6 7Energy, MeV
0
100
200
300
Cou
nts,
180
0s
ExperimentSimulation
4.43
4.43(DE)
4.43(SE)
(b)
1 2 3 4 5 6 7Energy, MeV
0
40
80
120
Cou
nts,
3600
s
ExperimentSimulation
4.43
4.43(DE)
4.43(SE)(b)
20 70 120 170Channel number
0
100
200
300
400
Cou
nts,
180
0s
ExperimentSimulation
neutron direction
neutron generator walls
neutronscattering
(a)
20 70 120 170Channel number
20
70
120
170
220
Cou
nts,
180
0s
ExperimentSimulation
neutron direction
(a)
neutron generator walls
neutronscattering

26
The experimental and synthetic spectral shapes are in good agreement. The shapes are different at energies below 2 MeV because a threshold of 1.5 MeV was set for the experimental runs. The scaling factors required (~105) for matching with the two experimental spectra (27 and 47 cm distances), indicated that the tagged beam represented about 1% of the total isotropic neutron emission of ~107ns-1. The 2D time versus energy plots for the graphite sample at the two distances, 27 cm and 47 cm from the neutron generator are shown in Figures A5-4a and A5-4b.
Figure A5-4 Calculated time versus energy plots for the graphite sample at a) 27 and b) 47 cm from the neutron source. The red color represents the maximum intensity of the carbon 4.43 MeV gamma-rays. Spectral analysis While C, N and O produce characteristic fast neutron-induced gamma-rays, there are interferences amongst their energy peaks. An analytic scheme developed earlier has been used to correct these interferences (5). The prompt gamma-rays of interest, namely the full energy peaks from fast-neutron inelastic scattering with C, N and O are C(4.43 MeV), N(7.03, 5.1, 5.03 and 4.46 MeV) and O(7.12, 6.92, 6.13 and 4.43 MeV). N has a full energy peak at 2.31 MeV which could be used for determining the element away from the C and O interferences but will suffer from interference by Al emission at 2.21 MeV (a common structural material). Consequently, signals are extracted from the 4.0 – 7.5 MeV regions where the only elemental interferences are among C, N and O. There are two advantages with this scheme: 1) Energy resolution is not critical and 2) Higher energy signals in the 4.0-7.5 MeV regions are more penetrating than the 2.14 MeV gamma-rays and will therefore be more effectively detected when emanating from an UXO with various steel case thicknesses.
To maximize the signal-to-noise ratio, three Regions-Of-Interest (ROIs) were defined. ROI1 was set at 5.35-6.41 MeV, ROI2 was 4.84-7.44 MeV and ROI3 was 4.24-4.72 MeV. A system of three equations for the three unknowns, namely C, N and O, was obtained as follows:
ROI1 = aXO + bXN (3) ROI2 = XO + XN (4)
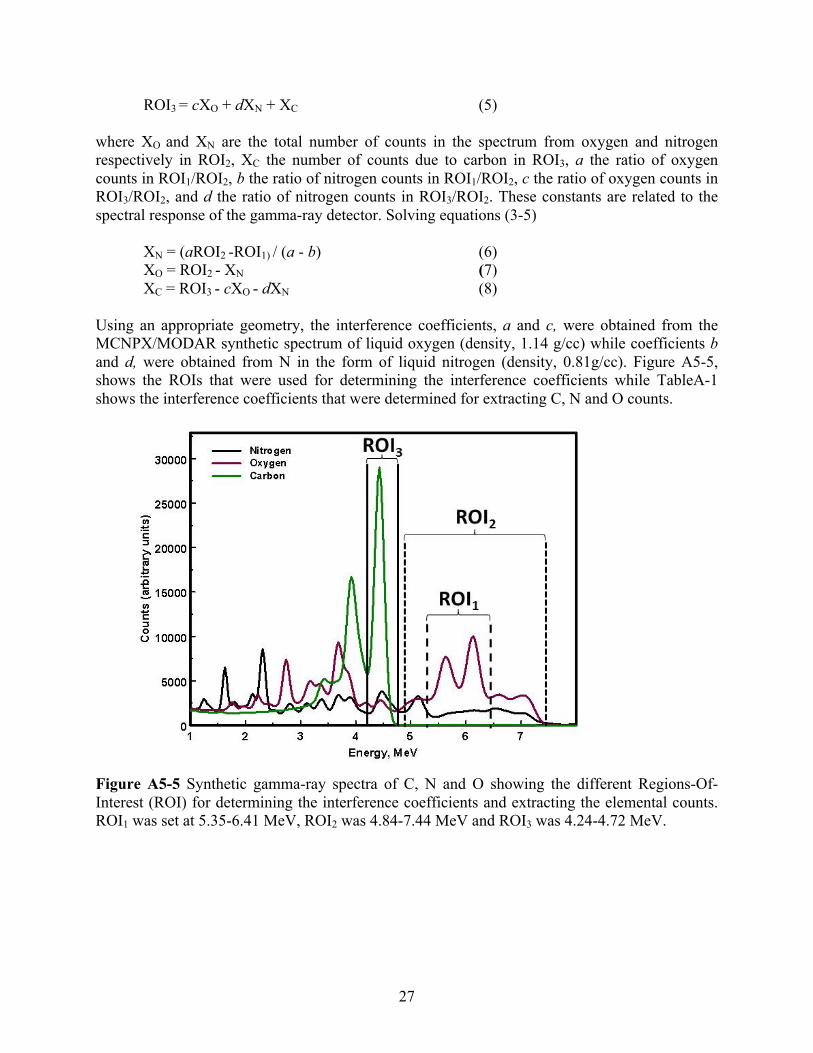
27
ROI3 = cXO + dXN + XC (5) where XO and XN are the total number of counts in the spectrum from oxygen and nitrogen respectively in ROI2, XC the number of counts due to carbon in ROI3, a the ratio of oxygen counts in ROI1/ROI2, b the ratio of nitrogen counts in ROI1/ROI2, c the ratio of oxygen counts in ROI3/ROI2, and d the ratio of nitrogen counts in ROI3/ROI2. These constants are related to the spectral response of the gamma-ray detector. Solving equations (3-5) XN = (aROI2 -ROI1) / (a - b) (6) XO = ROI2 - XN (7) XC = ROI3 - cXO - dXN (8) Using an appropriate geometry, the interference coefficients, a and c, were obtained from the MCNPX/MODAR synthetic spectrum of liquid oxygen (density, 1.14 g/cc) while coefficients b and d, were obtained from N in the form of liquid nitrogen (density, 0.81g/cc). Figure A5-5, shows the ROIs that were used for determining the interference coefficients while TableA-1 shows the interference coefficients that were determined for extracting C, N and O counts.
Figure A5-5 Synthetic gamma-ray spectra of C, N and O showing the different Regions-Of- Interest (ROI) for determining the interference coefficients and extracting the elemental counts. ROI1 was set at 5.35-6.41 MeV, ROI2 was 4.84-7.44 MeV and ROI3 was 4.24-4.72 MeV.
28
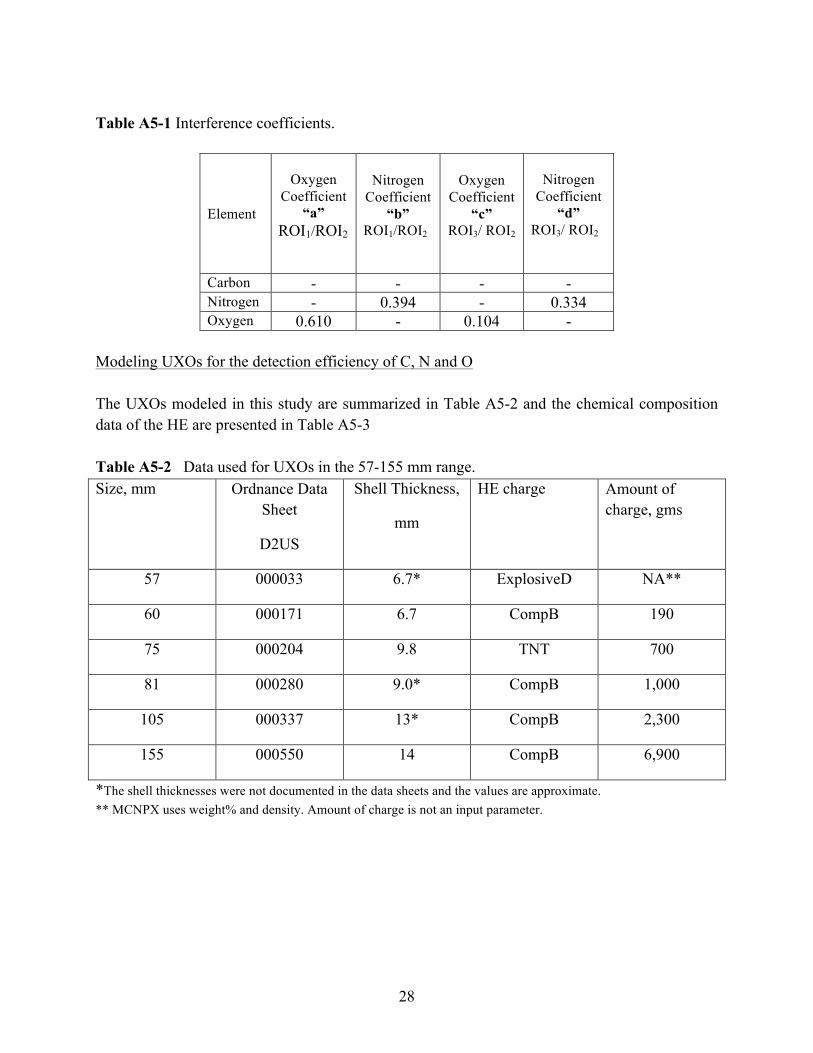
Table A5-1 Interference coefficients.
Element
Oxygen
Coefficient “a”
ROI1/ROI2
Nitrogen
Coefficient “b”
ROI1/ROI2
Oxygen Coefficient
“c” ROI3/ ROI2
Nitrogen Coefficient
“d” ROI3/ ROI2
Carbon - - - - Nitrogen - 0.394 - 0.334 Oxygen 0.610 - 0.104 -
Modeling UXOs for the detection efficiency of C, N and O The UXOs modeled in this study are summarized in Table A5-2 and the chemical composition data of the HE are presented in Table A5-3 Table A5-2 Data used for UXOs in the 57-155 mm range. Size, mm Ordnance Data
Sheet
D2US
Shell Thickness,
mm
HE charge Amount of charge, gms
57 000033 6.7* ExplosiveD NA**
60 000171 6.7 CompB 190
75 000204 9.8 TNT 700
81 000280 9.0* CompB 1,000
105 000337 13* CompB 2,300
155 000550 14 CompB 6,900
*The shell thicknesses were not documented in the data sheets and the values are approximate. ** MCNPX uses weight% and density. Amount of charge is not an input parameter.

29
Table A5-3 Chemical composition of the HE charge HE charge Weight,% Density,
g/cm3
C H N O
CompB 24.5 2.5 30.1 42.8 1.65
TNT 37 2.2 18.5 42.3 1.65
ExplosiveD
(Ammonium Picrate)
29.3 2.4 22.8 45.5 1.72
Simulation geometry For all runs, the base of the neutron cone had a diameter equal to the outer diameter of the UXO at it’s mid-line along the long-axis. The neutron source distance to the long axis thus varied from 5.7-15.5 cm for the 57-155 mm projectiles. The NaI(Tl) detector was positioned on top of the UXO at a distance of 30 cm from it’s mid-line. To model the soil effects, the UXO was made to rest on a 50x50x50 cm cube of soil (composition: SiO2). This area and volume of soil was considered to be adequate because the largest beam diameter at the sample was 15.5 cm. The schematics of the geometry are shown in Figure A5-6.

30
Figure A5-6 Set-up for modeling the UXO interrogation. Results and Discussion Since MCNPX outputs data per source neutron, and a single detector was used for the modeling, all spectra were scaled by a factor that included a ten minute interrogation time, twice the neutron output (from 3x10⁷ to 6x10⁷ ns-1) used for the proof-of-concept studies and four detectors. The results are summarized in Table A5-4 for two surface conditions when the UXO was either in air or on the soil surface. Only the major error due to the counting statistics (√counts) has been assumed. In practice, the alpha count rate is used to normalize the spectra so that there is no statistical variation for the incident 14 MeV neutron flux. Also the random “accidental” background can be precisely measured and subtracted from the UXO spectra. Using the data from the proof-of-concept studies (Figure3.3-3), the total random background in the three ROIs (4.24 MeV- 7.4 MeV) used for extracting counts has been determined to be ~1200 counts for a ten minute run at twice the neutron flux and using the four detector array of 12.7 cm NaI(Tl) detectors. The signal/random background for the same ROI is estimated to be ~15 for the 60 mm mortar and ~30 for the 155 mm projectile. It can be seen from TableA5-4 that the HE content of all the projectiles in the 57-155 mm range can be determined in terms of their C, N and O yields with good statistical precision. It is also interesting to note that the sensitivity of the technique can help differentiate the two types of HE fills in the 57 (Explosive D) and 60 mm (CompB) projectiles, based on the C, N and O yield differences. With the present interrogation geometry, there was some contribution to the overall time spectrum when the projectile was on the soil surface, but the background effects could be completely eliminated with appropriate time cuts. It was noticed, that for the 155mm projectile

31
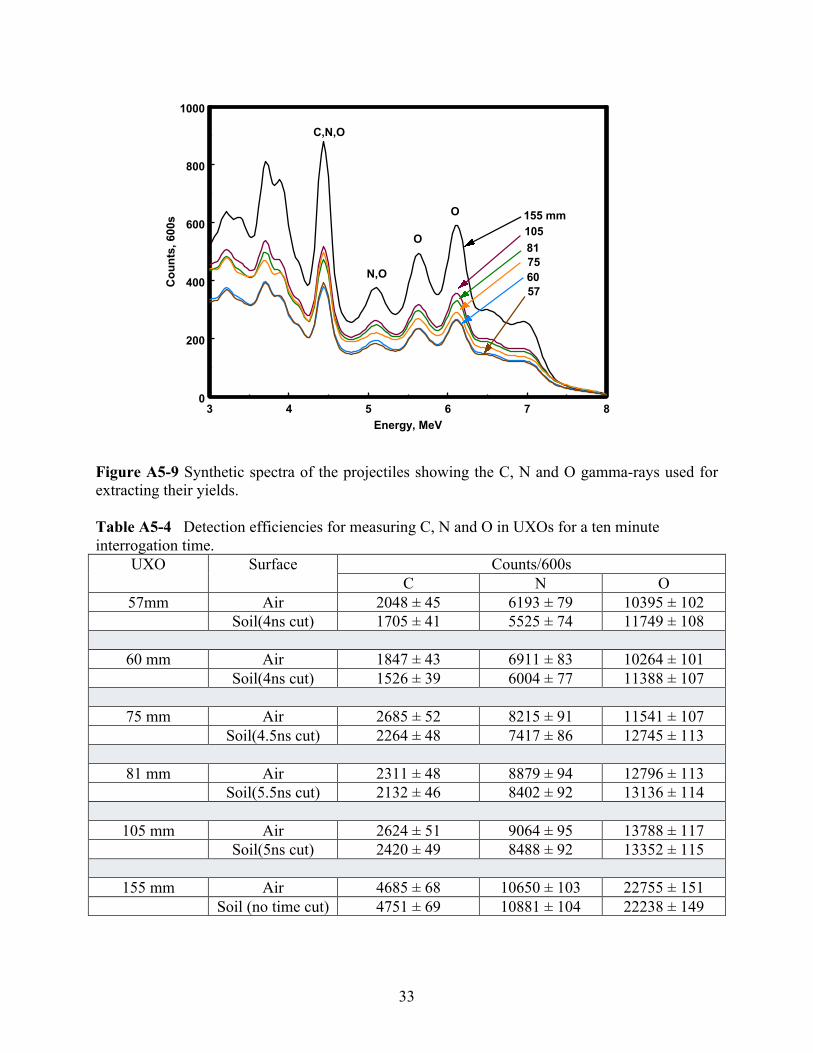
no time cuts were necessary because it completely shielded the soil. As an illustration, the composite time spectrum of a 60 mm (HE filled) mortar lying on soil is shown in Figure A5-7 and the corresponding time correlated gamma-rays from the mortar, obtained with a 4ns time cut is shown in Figures A5-8a and A5-8b. As shown, a time window of 4ns could effectively isolate the neutron induced gamma-rays from the mortar and reject all the signals from the soil; the absence of the silicon (Si, 1.78 MeV) line from the soil is a good indicator that the cut has eliminated the soil signals. Figure A5-9 shows the synthetic spectra of all the projectiles (57-155 mm) that were modeled for this study. Figure A5-7 Smeared time spectrum of a 60 mm mortar lying on soil. The 4ns time cut used for eliminating soil signals and determining the time correlated gamma-rays from the UXO is shown.

32
Figure A5-8 (a) Gamma-ray spectra show that the dominant signals are from the iron (Fe) content of the shell. The 4ns time cut shows the absence of the Si (1.78MeV) line which is a good indicator for the successful elimination of soil signals, (b) Spectra showing the C, N and O signals.
0.0 0.5 1.0 1.5 2.0 2.5Energy, MeV
0
2000
4000
6000
8000
Cou
nts,
600
s
Fe(1.24 MeV)Si(1.78 MeV)
(a)
60 mm
Fe(1.82 MeV)
ON SOIL(no time cut)SOIL(SiO2)4 ns time cutIN AIR
Fe(0.85 MeV)
3 4 5 6 7 8Energy, MeV
0
200
400
600
800
1000
Cou
nts,
600
s
C(4.43 MeV)
N(5.1MeV)
O(6.13 MeV)
60 mm
ON SOIL(no time cut)SOIL(SiO2)4 ns time cutIN AIR
(b)
33
Figure A5-9 Synthetic spectra of the projectiles showing the C, N and O gamma-rays used for extracting their yields. Table A5-4 Detection efficiencies for measuring C, N and O in UXOs for a ten minute interrogation time.
UXO Surface Counts/600s C N O
57mm Air 2048 ± 45 6193 ± 79 10395 ± 102 Soil(4ns cut) 1705 ± 41 5525 ± 74 11749 ± 108
60 mm Air 1847 ± 43 6911 ± 83 10264 ± 101
Soil(4ns cut) 1526 ± 39 6004 ± 77 11388 ± 107
75 mm Air 2685 ± 52 8215 ± 91 11541 ± 107 Soil(4.5ns cut) 2264 ± 48 7417 ± 86 12745 ± 113
81 mm Air 2311 ± 48 8879 ± 94 12796 ± 113
Soil(5.5ns cut) 2132 ± 46 8402 ± 92 13136 ± 114
105 mm Air 2624 ± 51 9064 ± 95 13788 ± 117 Soil(5ns cut) 2420 ± 49 8488 ± 92 13352 ± 115
155 mm Air 4685 ± 68 10650 ± 103 22755 ± 151
Soil (no time cut) 4751 ± 69 10881 ± 104 22238 ± 149
3 4 5 6 7 8Energy, MeV
0
200
400
600
800
1000
Cou
nts,
600
s
C,N,O
N,O
O
O 155 mm10581756057

34
Summary
• MCNPX/MODAR simulations were performed for identifying UXOs with HE filling and iron shells of documented thicknesses using 14 MeV neutron time-of-flight interrogation.
• Carbon, Nitrogen and Oxygen yields were determined for projectiles in the range 57-155 mm for a ten minute interrogation time.
• The estimated gamma-ray yields are based on twice the neutron output used for the proof-of-concept studies and an array of four 12.7 cm x 12.7 cm NaI(Tl) gamma-ray detectors.
• The detection efficiencies were modeled for the UXO in air and on soil. • Using a neutron cone whose base fit the UXO diameter, the soil background could be
eliminated with appropriate time cuts that defined the interrogated UXO volume. • No time cuts were necessary for background elimination in the 155 mm projectile signals
because it completely shielded the soil.
Conclusion The modeling data indicate that using a timed beam of 14 MeV neutrons, the key elements for identifying HE - carbon, nitrogen and oxygen, can be determined in the 57 -155 mm projectiles with good precision in a ten minute interrogation period. The background contamination of the useful signal from surrounding material and more particularly from the soil can be eliminated with the selection of appropriate time windows. It is also interesting to note that the sensitivity of the technique can help differentiate the two types of HE fills in the 57 (Explosive D) and 60 mm(CompB) projectiles, based on the C, N and O yield differences.