identify concrete properties and quality … · identify concrete properties and quality using...
TRANSCRIPT

IDENTIFY CONCRETE PROPERTIES AND QUALITY USING ACOUSTIC
EMISSION TECHNIQUE
Nabil H. El-Ashkar 1, Mohamed Shehadeh 2, Alaa Morsy 1, Amr Hussain 1
1 Construction & Building Engineering Department, College of Engineering & Technology.
2 Marine Engineering Department, College of Engineering & Technology, AASTMT, Egypt.
*Tel (+203) 5622366, Fax (+203) 5622525; E-mail: [email protected]
Abstract:
The development of diagnostic non-destructive testing (NDT) technique to evaluate the degradation of
concrete structure (materials based on cement) is one of the most important issues for any maintenance
program. One of the methods used for real-time nondestructive monitoring is Acoustic Emission (AE).
AE technique can present some information about defects inside the material, and it is capable of real-
time monitoring. AE technique has been widely applied to a variety of fields in civil engineering. The
main goal of this study is to determine a correlation between AE parameters and properties of
cementitious materials and concrete, such as compressive strength, flexural strength and moisture
content. Test results showed a strong correlation between attenuation factor and the compressive
strength, flexural strength and moisture content.
Keywords: Concrete; Acoustic Emission; Strength, Signal Analysis, Properties.
1. Introduction
Successful techniques for the detection of cracks, imperfections and damage in
homogeneous materials are of limited value when applied to concrete because of
heterogeneities at various length scales that create interferences, such as attenuation,
scattering, diffraction and reflection [1]. One of the methods used for real time
nondestructive monitoring is acoustic emission (AE). Using this technique, the
elastic waves released during crack initiation / propagation incidences are recorded
by sensors placed on the surface of the material [2, 3]. The sensors are transforming
the energy of the transient elastic wave to an electric waveform [4, 5]. Detection
analysis of AE signals can supply valuable information regarding the origin and
importance of a discontinuity in a material. Acoustic emission is unlike most other
nondestructive testing (NDT) techniques in two issues. Firstly, the energy detected is
released from the interior of the tested object rather than from some external source.
Secondly, AE technique is capable of detecting the dynamic processes associated
with the degradation of structural integrity [6, 9]. Many researchers have mentioned
that, acoustic emission technique (AET) has as a power full technique to detect the
damages of materials [7, 8]. However, no work has reported in the literature on the
use of AE technique for studying the quality of cementitious materials. This
motivates researches to find an appropriate method as non-destructive test- (NDT)
without making any defects in the structures to identifying its strength and quality.
There are many NDT have been found to examine concrete strength and quality, our
objective in this study to found a correlation between AE technique as NDT and the
strength of concrete and mortar either in compressive or flexural strength also to
predict the percentage of moisture content in both materials.
30th European Conference on Acoustic Emission Testing & 7th International Conference on Acoustic Emission University of Granada, 12-15 September 2012
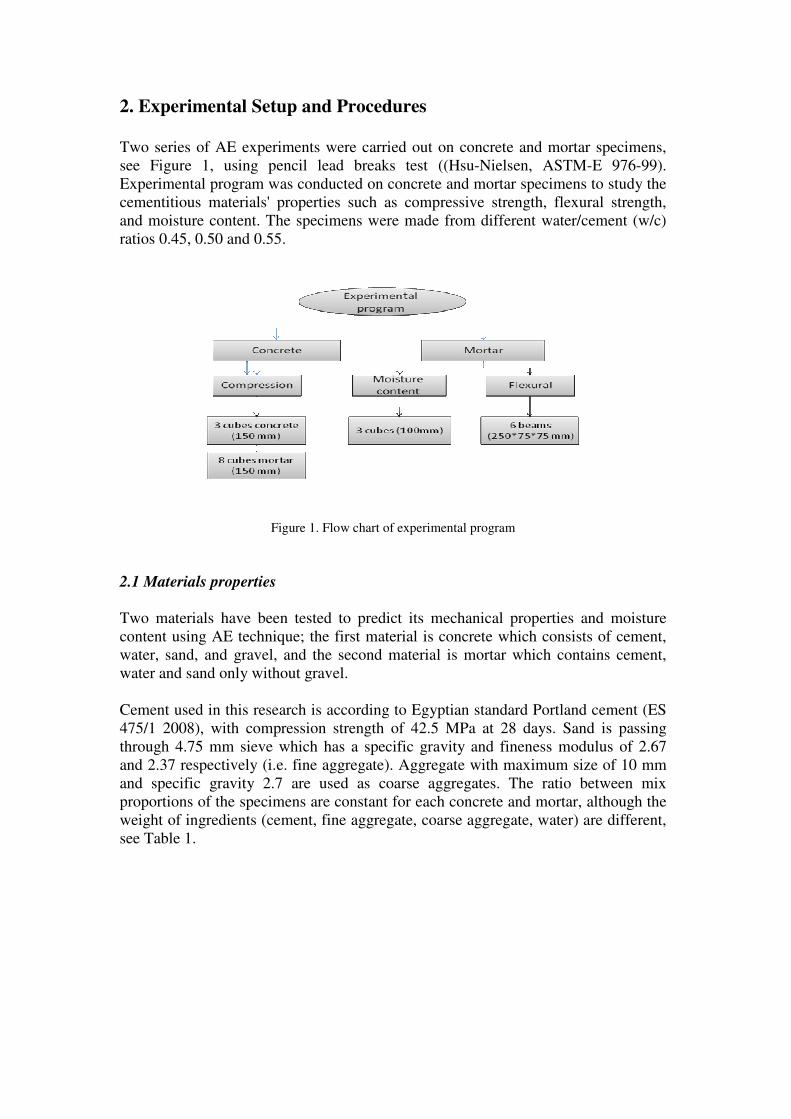
2. Experimental Setup and Procedures
Two series of AE experiments were carried out on concrete and mortar specimens,
see Figure 1, using pencil lead breaks test ((Hsu-Nielsen, ASTM-E 976-99).
Experimental program was conducted on concrete and mortar specimens to study the
cementitious materials' properties such as compressive strength, flexural strength,
and moisture content. The specimens were made from different water/cement (w/c)
ratios 0.45, 0.50 and 0.55.
Figure 1. Flow chart of experimental program
2.1 Materials properties
Two materials have been tested to predict its mechanical properties and moisture
content using AE technique; the first material is concrete which consists of cement,
water, sand, and gravel, and the second material is mortar which contains cement,
water and sand only without gravel.
Cement used in this research is according to Egyptian standard Portland cement (ES
475/1 2008), with compression strength of 42.5 MPa at 28 days. Sand is passing
through 4.75 mm sieve which has a specific gravity and fineness modulus of 2.67
and 2.37 respectively (i.e. fine aggregate). Aggregate with maximum size of 10 mm
and specific gravity 2.7 are used as coarse aggregates. The ratio between mix
proportions of the specimens are constant for each concrete and mortar, although the
weight of ingredients (cement, fine aggregate, coarse aggregate, water) are different,
see Table 1.

Table 1. Details of mix proportion
Concrete
Mortar
w/c
weight
0.45
0.50
0.55
0.45
0.50
0.55
Cement
(Kg) 12.5 1.1 1.07 18.41 3.17 3.09
Fine
aggregate
(Kg)
24.9 2.18 2.15 55.24 9.5 9.27
Coarse
aggregate
(Kg)
49.8 4.37 4.3 0 0 0
For mortar, C: FA: CA; 1:3:0 For concrete, C: FA: CA; 1:2:4
w/c : water to cement ratio
2.2 Specimens Preparation
The specimens prepared to study the properties of concrete and mortar. For the
compression strength, three concrete cubes of dimensions 150 mm and eight mortar
cubes of dimensions 150 mm with different w/c 0.45, 0.50 and 0.55. For the flexural
strength, six mortar beams of dimensions 75×75×250 mm with three different w/c
ratios (two beams of each w/c). For the moisture content, three mortar of dimensions
cubes 100 mm. All specimens were cured in water for 28 days.
2.3 Measurement & Instrumentation
In all experiments, data acquisition system (DAQ) was based on a hand held acoustic
emission system (pocket AE-2) with commercial wide band AE sensors WSA
(Physical Acoustics Corporation – PAC, member of MISTRAS Group Inc, certified to
ISO-9001 standards). The vacuum grease LR (high vacuum silicon grease) has been
used as a couplant. All specimens were tested using pencil lead break to simulate the
burst signal propagation. The device (pencil lead break) is an aid to simulate an
acoustic emission event using the fracture of a brittle graphite lead in a suitable
fitting. This generates an intense acoustic signal, quit similar to a natural AE source,
which the sensors detect as a strong burst [10]. This work presents the acoustic
emission test with pencil lead break method to be used as a non-real time easily in
situ.
2.3.1 Examine the compression strength
In this test, three concrete cubes and eight mortar cubes with dimensions 150 mm
were used. Two AE wide band sensors used, the first (trigger S1) sensor was placed at
8 mm from one cube surface edge. While the other sensor (S2) was incrementally
moved horizontally along the same cube surface to three positions of 47, 94 and 142
mm, as shown in Figure 2. Pencil lead breaks (simulation source) were performed

beside the trigger (S1). The experiments were being repeated 10 times at each position
in order to take the average of these ten results. The compression test as a destructive
accurate test for concrete strength was used also after AE test by compression
machine (compact/ADR 3000) with capacity 1650 KN (ASTM E4 – AS 2193).
Figure 2. AET procedure to examine the compressive strength
2.3.2 Examine the flexural strength
In this test, six mortar beams with dimensions 75×75×240 mm were used (two beams
of each w/c). Two sensors were used; the first sensor (trigger) was placed at 8 mm
from the beam surface edge. While the other sensor S2 was incrementally moved
horizontally along the same surface to four positions at distances 50, 100, 150 and 200
mm respectively, see Figure 3. The test was repeated 10 times at each position to take
the average of these results. Another destructive test was used to examine the flexural
strength of mortar using three point loads for mortar beam.
Figure 3. AE test procedures to examine the Flexure strength
2.3.3 Examine the moisture content
The main goal in this research to predict a relation between the AE parameter with
different moisture content situations for cementations materials. In this test, three
mortar cubes with dimensions 100 mm were used (one cube of each w/c). One sensor
was used in middle surface of specimen. The source (pencil lead breaks) was
performed at distance 25 mm from the sensor, as shown in Figure 4. For each
specimen, the experiment carried out on the stages. The first day, the specimens were
tested in the saturated case, and then left in the air for three days, so that it is tested
daily by AET. Finally, the specimens were placed in oven for further three days, so
that it is tested every day by AET. Thereafter, the specimens were weighted daily to
S2
S1
S2
S1
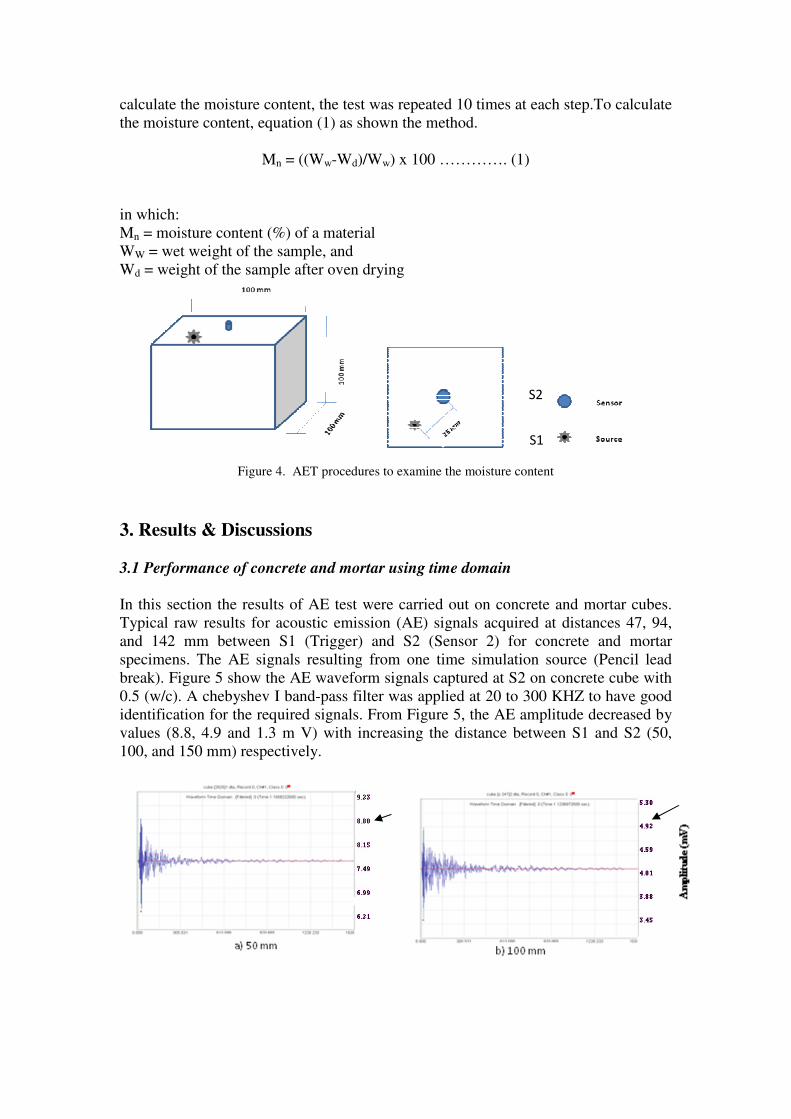
calculate the moisture content, the test was repeated 10 times at each step.To calculate
the moisture content, equation (1) as shown the method.
Mn = ((Ww-Wd)/Ww) x 100 …………. (1)
in which:
Mn = moisture content (%) of a material
WW = wet weight of the sample, and
Wd = weight of the sample after oven drying
Figure 4. AET procedures to examine the moisture content
3. Results & Discussions
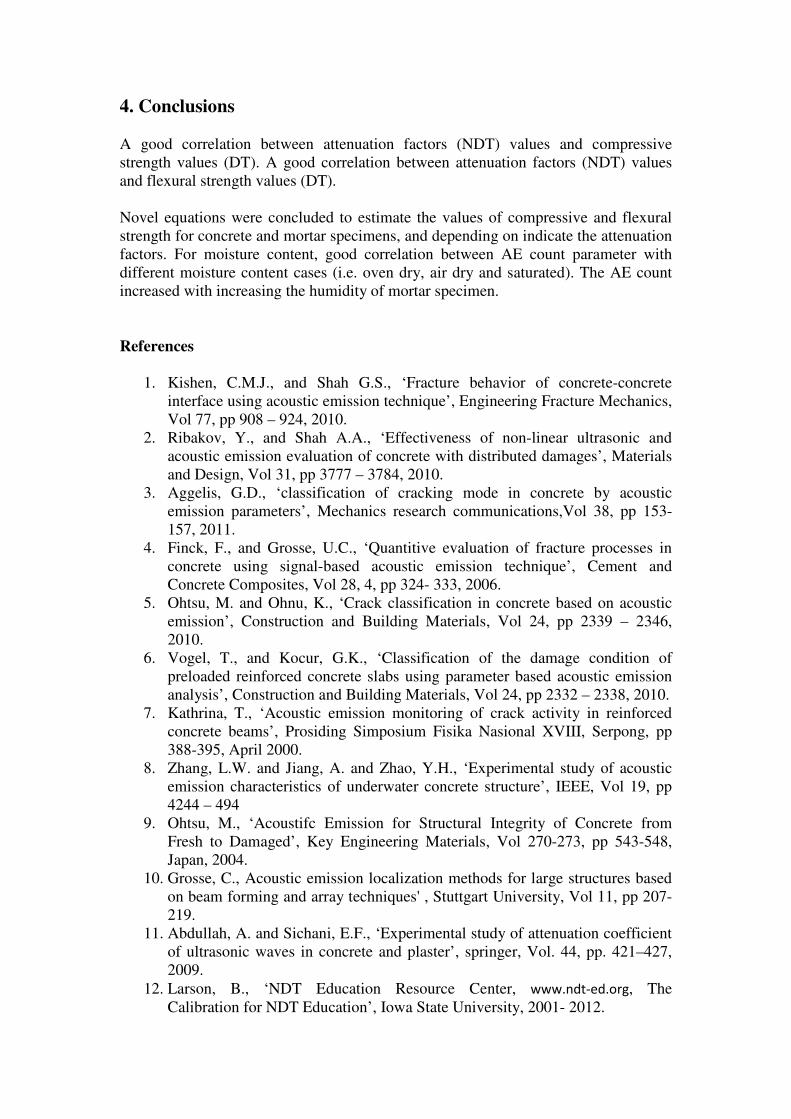
3.1 Performance of concrete and mortar using time domain
In this section the results of AE test were carried out on concrete and mortar cubes.
Typical raw results for acoustic emission (AE) signals acquired at distances 47, 94,
and 142 mm between S1 (Trigger) and S2 (Sensor 2) for concrete and mortar
specimens. The AE signals resulting from one time simulation source (Pencil lead
break). Figure 5 show the AE waveform signals captured at S2 on concrete cube with
0.5 (w/c). A chebyshev I band-pass filter was applied at 20 to 300 KHZ to have good
identification for the required signals. From Figure 5, the AE amplitude decreased by
values (8.8, 4.9 and 1.3 m V) with increasing the distance between S1 and S2 (50,
100, and 150 mm) respectively.
S2
S1

Time
Figure 5. Typical raw AE signals acquired at 47, 94, and 142 mm apart from S2 of concrete
Figures 6 shows typical raw AE signals (waveform) captured at S2 at three distances
47, 94 and 142 mm from S1 (Trigger) to S2 (Sensor) of mortar cube at 28 day with
0.50 (w/c). The AE signals resulting from one time simulation source (Pencil lead
break), the AE amplitude decreased by values (7.9, 3.62 and 0.88 m V) with
increasing the distance between S1 and S2 (50, 100, and 150 mm) respectively.
Figure 6. Typical raw AE signals acquired at 42, 94, 142 mm apart from S2 of mortar
From the previous results, it can be concluded that AE amplitude decreased with
sensor-source distance increasing. In another way, AE amplitude for concrete and
mortar is same behavior (of waveform) with distances but with different values.
Time

3.2 Correlations between compressive strength of concrete and mortar and AE
parameters
This section will discuss the AE attenuation test results on concrete and mortar
specimens. When sound travels through a medium, its intensity diminishes with
distance. In idealized materials, sound pressure (signal amplitude) is only reduced by
the spreading of the wave. Natural materials, however, all produce an effect which
further weakens the sound. This further weakening results from scattering and
absorption. The nature shape, density and distribution of the obstacles in the material
are prominent in attenuation phenomenon [11].
The amplitude change of a decaying plane wave can be expressed as
A = A° …………………… (2)
where:
A: reduced amplitude after the wave has traveled a distance z from that initial
location.
A°: un-attenuated amplitude of the propagating wave at some location.
α: attenuation coefficient of the wave traveling in the z-direction [12].
Z: the distance (mm).
Equation (2) used in all AE attenuation analysis at distances 47, 94 and 142 mm. 10
times of pencil lead break were performed (beside Trigger sensor) at each position to
take the average of these results. Figure 7, illustrate a logarithm of Amplitude (A) is
plotted with distance (z) for the three concrete specimens with different (w/c). It is
can be clearly seen that, the overall behavior for three w/c relation for the three
specimens is the same. Using fitting line equation which represents the slope of the
straight line is used to compute the AE amplitude attenuation factors (α) for each
specimen. Equation 3 illustrates the computing of attenuation factor (α) from a
previous equation 2.
Attenuation Factor (α) = Ln (A) – z Ln Ao ……………….(3)
Figure7. Amplitude attenuation of concrete specimens with three w/c

To correlate the relationship between the AE attenuation factors (α) for three concrete
specimens (from Figure 7) with compressive strength values (Fc) which resulting
from destructive test (DT), Figure 8, shows the relationship between AE attenuation
factors (α) with compressive strength values (Fc) for three concrete specimens which
may represent the relationship between (NDT) and (DT). It's noted that, the
attenuation factors (α) decreased with increasing compressive strength values (Fc).
To study AE attenuation test on mortar specimens, Figure 9 illustrate a logarithm of
Amplitude (A) with distance (z) of three mortar specimens with different (w/c) at 28
day, same behavior for three mortar specimens. Figure 10 illustrates the relationship
between AE attenuation factors (α) (which computing from Figure 9 using fitting line
equation) and compressive strength values (Fc), the attenuation factors (α) decreased
with increasing compressive strength, see Figure 10. In another way, the behavior for
concrete and mortar at 28 day is same.
Using straight line fitting equation in Figures 8 and 10 is possible to obtain the
following relations:
For concrete Fc = - 34212 + 52523 α – 1688……….. (4)
For Mortar Fc = -6907 α + 861.2………………………. (5)
Figure8. The relationship of attenuation factors with compressive strength (DT) for concrete
Figure9. Amplitude attenuation of mortar specimens for three w/c

Figure 10. The relationship of attenuation factors with compressive strength (DT) for mortar at 28 day
3.3 Effect of mortar age after casting on the A.E. parameters
To find the effect of curing ages of mortar on the above, same the previous method,
Figure 11 shows the relationship between compressive strength values (Fc) and AE
attenuation factors (α) for three mortar specimens with different w/c (0.45, 0.50, and
0.55) at 7 days age (relation between DT & NDT). Also, the attenuation factors (α)
decreased with increasing compressive strength.
In comparison between attenuation factors values for mortars at different ages (7, 14,
21 and 28) days, it can be seen that a clear trend between ages, Figure 12. The
attenuation factors decreased with compressive strength increasing in all ages of the
eight specimens. Changes in attenuation seem to be too small considering the progress
of concrete aging
Figure11. AE attenuation factors with compressive strength for mortar at 7 day

Figure 12. Attenuation factors of mortar in different ages with 3 w/c
Both ages and curing conditions parameters are effected on attenuation factors.
However the laboratory conditions are different from site conditions. In this study
small change in attenuation factors with curing age's development, this related to
optimization laboratory conditions and not exposed to difficult conditions.
3.4 Examine the flexural strength
In this section the results of AE test were carried out six mortar beams. Figures 13
shows typical raw AE sensor signals (which resulting from one time simulation
source / pencil lead break) (waveform) captured at S2 on the beams at distances 50,
100, and 150mm from (trigger) S1 to S2 with 0.50 (w/c). It can be seen clearly the
difference between the waveforms in difference distance S1 and S2, where AE
amplitude decreased by values 7.24, 2.63, and 1.09 mV with distance increase, see
Figure 13. A chebyshev I band-pass filter was applied at 20 to 300 KHZ to have good
identification for the inquired signals.
As mentioned earlier (section 3.2), Figure 14 shows the relationship between
attenuation factors (α) with the average flexural strength values (Ff) of the two beams
for each w/c ratio. It is noted that, the attenuation factor (α) decreased with increasing
flexural strength (Ff). Using fitting line second order equation in Figures 14, it is
possible to obtain the following relation:
Ff = 27.85 - 88.35 α+209.9………… (6)
Using the previous equation 6, it can compute the flexural strength (Ff) for any
laboratory mortar specimens.

Figure13. Typical raw AE signals y of mortar beam with 0.5 W/C from S2
Figure14. The relationship between the averages of attenuation factors with the average of flexural
strength values
3.5 Examine the moisture content
The main goal in this research to predict a relation between the AE parameter with
different moisture content situations for cementations materials. Three mortar
specimens with three different (w/c) were used. AE parameters such as count,
amplitude and frequency are used to analyze the results.
Figures (15 - 17) illustrate the behavior of AE parameters for three specimens with
different w/c. Each specimen was divided into three moisture content situations (i.e.
saturated, air dry and oven dry) It's noted that for each w/c ratio the AE parameters
(count, amplitude and frequency) increased with increasing humidity rate of
specimens (saturated, air dry, oven dry). In another way, the AE parameters at air dry
case greater than AE parameters at oven case and smaller at saturated case. This may

be related to the voids in saturated case is filled water and therefore the wave
transmissions are too weak, while the void at oven dry is dried allow the AE waves to
pass through easy. The transmission waves in water are greater than the air.
Figure 15. AE count behavior with moisture content stages
Figure 16. AE amplitude behavior with moisture content stages
Figure 17. AE frequency behavior with moisture content stages
4. Conclusions
A good correlation between attenuation factors (NDT) values and compressive
strength values (DT). A good correlation between attenuation factors (NDT) values
and flexural strength values (DT).
Novel equations were concluded to estimate the values of compressive and flexural
strength for concrete and mortar specimens, and depending on indicate the attenuation
factors. For moisture content, good correlation between AE count parameter with
different moisture content cases (i.e. oven dry, air dry and saturated). The AE count
increased with increasing the humidity of mortar specimen.
References
1. Kishen, C.M.J., and Shah G.S., ‘Fracture behavior of concrete-concrete
interface using acoustic emission technique’, Engineering Fracture Mechanics,
Vol 77, pp 908 – 924, 2010.
2. Ribakov, Y., and Shah A.A., ‘Effectiveness of non-linear ultrasonic and
acoustic emission evaluation of concrete with distributed damages’, Materials
and Design, Vol 31, pp 3777 – 3784, 2010.
3. Aggelis, G.D., ‘classification of cracking mode in concrete by acoustic
emission parameters’, Mechanics research communications,Vol 38, pp 153-
157, 2011.
4. Finck, F., and Grosse, U.C., ‘Quantitive evaluation of fracture processes in
concrete using signal-based acoustic emission technique’, Cement and
Concrete Composites, Vol 28, 4, pp 324- 333, 2006.
5. Ohtsu, M. and Ohnu, K., ‘Crack classification in concrete based on acoustic
emission’, Construction and Building Materials, Vol 24, pp 2339 – 2346,
2010.
6. Vogel, T., and Kocur, G.K., ‘Classification of the damage condition of
preloaded reinforced concrete slabs using parameter based acoustic emission
analysis’, Construction and Building Materials, Vol 24, pp 2332 – 2338, 2010.
7. Kathrina, T., ‘Acoustic emission monitoring of crack activity in reinforced
concrete beams’, Prosiding Simposium Fisika Nasional XVIII, Serpong, pp
388-395, April 2000.
8. Zhang, L.W. and Jiang, A. and Zhao, Y.H., ‘Experimental study of acoustic
emission characteristics of underwater concrete structure’, IEEE, Vol 19, pp
4244 – 494
9. Ohtsu, M., ‘Acoustifc Emission for Structural Integrity of Concrete from
Fresh to Damaged’, Key Engineering Materials, Vol 270-273, pp 543-548,
Japan, 2004.
10. Grosse, C., Acoustic emission localization methods for large structures based
on beam forming and array techniques' , Stuttgart University, Vol 11, pp 207-
219.
11. Abdullah, A. and Sichani, E.F., ‘Experimental study of attenuation coefficient
of ultrasonic waves in concrete and plaster’, springer, Vol. 44, pp. 421–427,
2009.
12. Larson, B., ‘NDT Education Resource Center, www.ndt-ed.org, The
Calibration for NDT Education’, Iowa State University, 2001- 2012.