identifying and validating alternative splicing...
TRANSCRIPT
A F F Y M E T R I X ® P R O D U C T FA M I LY > R N A A R R AYS A N D R E A G E N T S >
Pantone #2685 (Blue)4/Color Equivalent (C:100.0 M:94.0 Y:0.0 K:0.0)
Pantone #3288 (Green)4/Color Equivalent (C:100.0 M:0.0 Y:56.0 K:18.5)
Pantone #032 (Red)4/Color Equivalent (C:0.0 M:91.0 Y:87.0 K:0.0)
Black
Identifying and Validating AlternativeSplicing Events
GeneChip® Exon Arrays are powerful tools for the discovery and study of mRNAtranscript diversity. For the first time,researchers will obtain approximately 1.4million data points from each sample in asingle experiment. This increased datadensity also poses a number of dataanalysis challenges, including manage-ment of a higher number of potential falsepositives from the much larger data set.
In addition, exon arrays provide a newdimension of genomic informationbeyond classical gene expression resultsfrom microarrays—alternative splicing. Forthe analysis of alternative splicing, newalgorithms will need to be developed andtested in various data sets. This is an activearea of research and we anticipate thatnew developments and methods will con-tinue to emerge with the increasing avail-ability of sample data sets on exon arrays.
In this Technical Note, we present practi-cal recommendations for managing someof these challenges based on our experi-ence at Affymetrix. A sample workflowoperating mainly within Affymetrix®
Expression Console™ Software and otherGeneChip®-compatible™ software pro-grams for exon array analysis is describedin detail. Our experience shows that sys-tematic filtering of the raw array results, as detailed here, is critical to the improve-ment of validation rate in the subsequentRT-PCR validation experiments. Most ofthe analysis strategies discussed in thisTechnical Note will be applicable to anystatistical method developed for identify-ing alternative splicing events.
nnnn
GeneChip® Exon Arrays
An introduction to managing data provided by GeneChip® Exon Arrays
INTRODUCTION
Alternative splicing is a major source ofprotein diversity for higher eukaryoticorganisms, and is frequently regulated in adevelopmental stage-specific or tissue-spe-cific manner. Current estimates suggestthat 50 to 75 percent (or more) of humangenes have multiple isoforms.
Splice variants from the same gene can pro-duce proteins with distinct properties and dif-ferent (even antagonistic) functions. In addi-tion, a number of genetic mutations involvedin human disease have been mapped tochanges in splicing signals or sequences thatregulate splicing. Thus, an understanding ofchanges in splicing patterns is critical to acomprehensive understanding of biological
regulation and disease mechanisms.This Technical Note provides detailed
guidelines for those using exon arrays foralternative splicing analysis, to helpresearchers generate meaningful interpreta-tion of exon array data more quickly. Theseguidelines include the following:
n An introduction to alternative splicingprediction algorithms when comparingchanges that have occurred between twogroups of samples
n Description of an analysis workflown Practical considerations in filtering data n Experimental verification of alternative
splicing eventsA list of technical support materials is
included for convenient reference. It is highlyrecommended that users review these reference
Technical Note
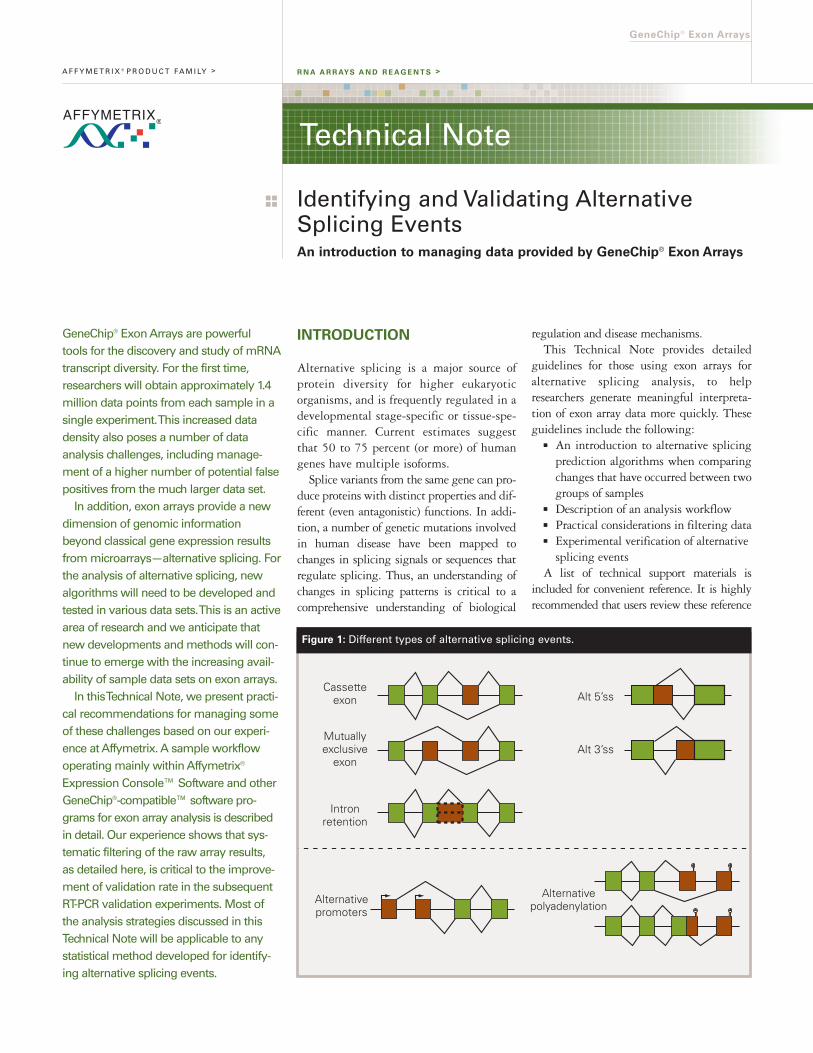
Cassetteexon
Mutuallyexclusive
exon
Intronretention
Alt 5’ss
Alt 3’ss
Alternativepromoters
Alternativepolyadenylation
Figure 1: Different types of alternative splicing events.

documents to become familiar with the arraydesign and basic algorithms associated withexon arrays prior to use of this Technical Noteto walk through the actual analysis workflow.For detailed information about using thisworkflow to generate biologically significantresults comparing colon cancer and normalsamples, see Gardina, et al.
BACKGROUND
EXON ARRAY DESIGN
GeneChip® Exon 1.0 ST Arrays are anincredibly powerful tool for the study ofalternative splicing. The ability to treat indi-vidual exons (or parts of exons) as independ-ent objects makes it possible to observe dif-ferential skipping or inclusion of exons. Thisis not possible (or at least, certainly not opti-mal) on more classical expression arraydesigns that focus on transcription activitiesat the 3’ end of a gene.
The exon array was designed to be as inclu-sive as possible at the exon level, drawn fromannotations ranging from empirically deter-mined, highly curated mRNA sequences toab-initio computational predictions (for moreinformation, see Technical Note, “GeneChip®
Exon Array Design”), enabling the discovery ofnew alternative splicing events. This is anadvantage over exon-exon junction arrays,which are typically designed against onlyobserved or annotated junctions.
The GeneChip Human Exon 1.0 STArray contains approximately 5.4 millionprobes (“features”) grouped into 1.4 mil-lion probe sets, interrogating over 1 mil-lion exon clusters, which are exon annota-tions from various sources that overlap bygenomic location. A Probe SelectionRegion (PSR) represents a region of thegenome that is predicted to act as an inte-gral, coherent unit of transcriptionalbehavior. A PSR is the target sequencefrom which probes are designed. In manycases, each PSR is an exon; in other cases,due to potentially overlapping exon struc-tures (or alternative splice site utilization),several PSRs may form contiguous, non-overlapping subsets of a true biological exon.
The median size of PSRs is 123 bp with a
minimum size of 25 bp. About 90 percent ofthe PSRs are represented by four Perfect Match(PM) probes (a “probe set”). Such redundancyallows robust statistical algorithms to be usedin estimating presence of signal, relativeexpression and existence of alternative splicing.
The exon arrays do not include a pairedMismatch probe for each PM probe. Instead,surrogate background intensities are derivedfrom approximately 1,000 pooled probeswith the same GC content as each PM probe.One commonly used set of backgroundprobes is called the “antigenomic” back-ground probe set, which contains sequencesthat are not present in the human genome (ora few other genomes) and are not expected tocross-hybridize with human transcripts.
In addition, exon arrays provide robustgene-level expression analysis. The mediannumber of probes for each RefSeq gene is 30to 40 distributed along the entire length ofthe transcript, as compared to probes select-ed only at the 3’ end in classical geneexpression microarrays.
PROBE SET ANNOTATIONS AND
TRANSCRIPT CLUSTERS
The plethora of exon architectures (as shownschematically in Figure 1, e.g., cassetteexons, mutually exclusive exons, alternativesplice sites, alternative transcriptional startsand stops), the variations in quality of tran-script annotations and the necessity of rapid-ly incorporating new genomic knowledgehave led to a dynamic design for reconstitut-ing exons into genes.
A set of rules was created for virtualassembly of the probe sets (exon-level) intotranscript clusters (gene-level) based on theconfidence level of the supporting evidenceand the juxtapositions of the exon borders(White Paper, “Exon Probe set Annotationsand Transcript Cluster Groupings v1.0”).The mapping between probe sets and tran-script clusters is defined by meta-probe set listsas described below (in order of decreasingconfidence). The number of clusters citedbelow reflects the version of mapping filesprovided by Affymetrix as of November2006. Updated mapping files incorporatingthe latest information may be downloaded
directly from Affymetrix’ web site. n Core: RefSeq transcripts and full-length
mRNAs (17,800 transcript clusters) n Extended: Core + cDNA-based annota-
tions (129,000 clusters) n Full: Extended + ab-initio gene pre-
dictions (262,000 clusters)
SIGNAL ESTIMATION ALGORITHMS
Several statistical methods may be used tocombine information from probes belongingto the same gene, or exon, to generate expres-sion signal values of the gene or exon. Forexample, RMA and PLIER are two of themost commonly used algorithms. Althoughthis Technical Note focuses only on theworkflow with PLIER, the basic principlesapply to RMA and other signal estimationanalysis methods, as well.
Relative expression can be determined usingthe PLIER algorithm (White Paper, “Guide toProbe Logarithmic Intensity Error (PLIER)Estimation”), a robust M-estimator that uses amulti-chip analysis to fit a model for featureresponse and target response for each sample.The target response is the PLIER estimate ofthe signal of a probe set (exon-level).
Gene-level PLIER estimates are derived bycombining all probe sets predicted to mapinto the same transcript cluster (according tothe meta-probe set list). Since PLIER is amodel-based algorithm, exons that are alter-natively spliced in the samples, thereforeexhibiting different expression patterns com-pared to the constitutive exons, will havedown-weighted effect in overall gene-leveltarget response values (White Paper, “GeneSignal Estimates from Exon Arrays”).
IterPLIER is a variation that iterativelydiscards features (probes) that do not corre-late well with the overall gene-level signaland then recalculates the signal estimate toderive a robust estimation of the gene expres-sion value primarily based on the expressionlevels of the constitutive exons.
Presence/absence of exons is determinedusing “Detection Above Background”(DABG), as documented in the Detection Callsection of the Technical Note, “StatisticalAlgorithms Reference Guide,” using surrogatebackground intensities as described above.
A F F Y M E T R I X ® P R O D U C T FA M I LY > ARRAYS
G E N E E X P R E S S I O N M O N I T O R I N G
A F F Y M E T R I X ® P R O D U C T FA M I LY > ARRAYS
nnnn 2

nnnn 3
ALTERNATIVE SPLICING ALGORITHMS
Alternative splicing by definition is differen-tial exon usage. It is not sufficient, however,to simply identify exons with differentialexpression patterns; we must also account fordifferential transcription of the gene itself.
For example, if a gene is expressed two-foldhigher in sample “A” than in sample “B,”
then all of the constitutively expressed exonsin that gene are also likely to have two-foldhigher signal values. Thus, in order to focuson the differential inclusion of individualexons, we need to normalize to the transcrip-tion rate of the gene, as shown in Figure 2.
This concept led to the development of the“Splicing Index” (Srinivasan K., et al.) and
was the motivation for other methods(MiDAS, Robust PAC, etc.). Different analyt-ical methods for performing splicing analysismay deal with this issue in different ways, butultimately, the total transcription activity andsplicing change must be included in theanalysis for the method to be successful.
The Splicing Index is a conceptually sim-ple algorithm that aims to identify exons(actually, PSRs) that have different inclusionrates (relative to the gene level) between twosample groups. The normalized exon intensi-ty (NI), as described in Figure 3, is the ratioof the probe set intensity to the gene intensi-ty as estimated by PLIER (or IterPLIER).
The Splicing Index Value (SI) is calculatedby taking the log ratio (base 2) of the NI inSample 1 and the NI in Sample 2. A hypo-thetical example of this is shown in Figure 4,where the inclusion rate of the measuredexon is 10 times lower in Sample 2, despitethe fact that the actual intensity is higher.
An SI of 0 indicates equal inclusion rates ofthe exon in both samples, positive values indi-cate enrichment of that exon in Sample 1, andnegative values indicate repression or exonskipping in Sample 1 relative to Sample 2.
To identify exons that have statisticallysignificant changes in inclusion ratesbetween two groups, a Student’s t-test can beperformed on the gene-level normalized exonintensities. The absolute value of theSplicing Index represents the magnitude ofthe difference for exon inclusion between thetwo samples (or groups of samples). It isimportant to consider both the p-value fromthe t-test and the magnitude of the changesince the best candidates for validation arelikely to have very small p-values and verylarge SIs (either positive or negative).
MiDAS, which is implemented as a com-mand-line program of the Affymetrix PowerTools (APT), is conceptually similar to theSplicing Index but allows simultaneous com-parisons between multiple sample groups.MiDAS employs the gene-level normalizedexon intensities in an ANOVA model to testthe hypothesis that no alternative splicingoccurs for a particular exon. In the case ofonly two sample groups, ANOVA reduces toa t-test.
Gene-levelNormalized
Intensity(NI) =
Probe set intensity
Expression level of the “gene”
Figure 3: Gene-level normalized intensity (NI).
Exon Level = Transcription x Splicing
The level of a given exon is a result of the transcription rate of
the gene and the inclusion rate of the exon.
Figure 2: Exon-level signal consists of the gene-level expression and the inclusion of
that exon as a part of the gene (splicing rate).
NI
SI
Probe set intensity
Gene level
Sample 1
500
500= 1.0
Sample 2
600
6000= 0.1
Sample 1 has 10x higher inclusion level
Sample 1 NISample 2 NISplicing Index = log2
= log21.00.1
= +3.32
Figure 4: Splicing Index Value (SI).
For a more detailed description of algo-rithms from Affymetrix, refer to the WhitePaper “Alternative Transcript AnalysisMethods for Exon Arrays,” available atwww.affymetrix.com. Various GeneChip®-compatible™ software products for the exonapplication also introduce additional optionsand algorithms for alternative splicing analy-sis. A complete list can be found athttp://www.affymetrix.com/products/soft-ware/compatible/exon_expression.affx.
CAVEATS OF MIDAS AND THE SPLICING INDEX
There are several caveats of the currentlyimplemented, first-generation splicing algo-rithms that are important to consider wheninterpreting exon array results.
First, the alternative splicing results arehighly dependent on the accurate annotation ofthe transcript clusters and precise quantitationof gene-level estimates. Mis-annotated tran-script clusters or otherwise incorrect gene-levelpredictions may produce less reliable results.
For example, genes with many alternative-ly spliced exons (a large percentage relative tothe total number of exons) or instances whereonly a sub-set of the gene is expressed (due toalternative transcriptional starts/stops) arelikely to have some inaccuracy in gene-levelestimates. One possible improvement thatmay increase the robustness of gene-levelestimates is to only use probe sets interrogat-ing constitutive exons. However, this can beextremely dependent on specific samples anddifficult to predict. The Splicing Indexworks best when the gene has a large numberof constitutive exons and a small number ofalternative exons.
Furthermore, these algorithms assumethat the splicing pattern is consistent amongall of the samples within a group. This isprobably not always the case, e.g., tissue-map experiments that combine multiple tis-sue types into a single group. Utilizinggroups consisting of multiple tissue typesmakes it impossible to discover splicing dif-ferences between two tissues within the samegroup. Large variations of splicing pattern(and gene expression, to a lesser extent) with-in a group will reduce the significance of thet-test, resulting in a larger p-value. One
potential solution for a tissue-map experi-ment with many different tissue types isto treat each tissue as a different groupand do many pair-wise comparisons of asingle tissue to all other tissues. MiDAS iscapable of including more than twogroups using ANOVA.
The third limitation is the requirement forreplicates in the statistical t-test (minimumof three samples per group). While it is actu-ally possible to run the algorithms withfewer than three samples per group, the t-test needs the replicates to estimate the intra-group variability to calculate meaningful p-values. In cases where there are insufficientreplicates within a sample group, it may bepossible to create logical groups that mightbe expected to have similar splicing patterns.As with many algorithms, the result is like-ly to be more robust with increased numbersof replicates, larger group sizes and increasedconsistency within each group.
CONTEXT FOR INTERPRETING ALTERNATIVE
SPLICING DATA
Alternative splicing introduces a new level ofcomplexity relative to the analysis of geneexpression. Several things are critical to con-sider for planning, evaluating and interpret-ing microarray data when screening foraltered splicing events:
1. Alternative splicing is often a subtleevent: there is rarely an all-or-none change inexon inclusion between one tissue and anoth-er. A more likely scenario may be a shift from50 percent inclusion of an exon in one tissueto 80 percent inclusion in a different tissue.A small change in the ratio of isoforms maybe biologically significant.
2. Alternative splicing is a very commonphenomenon: ~ 75 percent (or more) of allgenes appear to be alternatively spliced.Between any two tissue types there may bethousands of probe sets that vary in theirinclusion into transcripts. The splicing pat-tern can also be inherited and therefore differfrom individual to individual, resulting inheterogeneity in the population examined.This adds an additional factor in interpretingresults or identifying disease-specific alterna-tive splicing events in the mixed background.
3. We are typically dealing with a mixedpopulation of related transcripts from a locusrather than the singular “gene” that we usu-ally associate with other expression arrays.This is a messy concept, but it more closelyreflects real biology. The exon array does notdetect transcripts per se; it detects exons thatcan be virtually reassembled according to themeta-probe sets. It has no information aboutwhich exons are actually physically linkedtogether in transcripts, but instead treatsgenes as a collection of all the exons associat-ed with that locus. There may, in fact, be anumber of combinations of transcripts thatwould account for the observed exon probeset signals; therefore, known transcripts frompublic databases may be a useful guide forinterpreting the results.
4. Differential gene expression may furthercomplicate differential alternative splicinganalysis. In order to calculate differentialexon inclusion into gene transcripts, wealways have to account for relative differencesin gene expression between two sampletypes. Therefore, predictors of alternativesplicing must accurately estimate both gene-level signals and exon-level signals.
The combination of these factors meansthat typical considerations in designing agood microarray study such as sample sizeand sample quality become even more criti-cal. For example, tumors may be a mixture ofdifferent tumor stages and probably alsomixed with normal tissue. Even normal tis-sue may be composed of various cell typesexhibiting different splicing patterns; forinstance, colonic sections can consist of bothsmooth muscle and epithelial tissue.
Due to the inherent heterogeneity of thebiology, the data needs filtering by multiplemethods at both the exon and gene level toreduce false positives (described in detail inthe Workflow and Filtering Methods sec-tions below). Visually inspecting the probeset intensities in a genomic context is also auseful way to improve true discovery rate.
Ultimately, experimental confirmation bya different technology—RT-PCR, for exam-ple—will provide confidence in the resultsobtained from statistical analysis. However,experimental validation is laborious, so
A F F Y M E T R I X ® P R O D U C T FA M I LY > ARRAYS
G E N E E X P R E S S I O N M O N I T O R I N G
A F F Y M E T R I X ® P R O D U C T FA M I LY > ARRAYS
nnnn 4

nnnn 5
approaches to narrow down the candidatelist computationally may save much effort inthe lab. It should also be noted that in somecases filtering the data in an attempt toreduce false positives may involve a trade-offwith the loss of true positives. The suggest-ed filtering methods are intended to highlyenrich the results with true positives, there-by maximizing the likelihood of positivevalidation. Depending on the specific aimsof an individual experiment, a differentapproach may be more appropriate.
In addition, some users may be interested inusing exon arrays to detect unique individualsor samples within the experimental groupthat exhibit different splicing patterns com-pared to the rest of the samples. This analysiscan be used effectively to detect individual-to-individual splicing variation or exon-skippingmutations, frequently observed in cancer sam-ples. For this type of analysis, the methodsdescribed here are certainly relevant but thedetails will need to be modified to meet thespecific research objectives.
WORKFLOW
This workflow (as schematically shown inFigure 5) begins with CEL files and concludeswith empirical validation of the results. Someintroductory concepts are described here:
n Some of the workflow occurs outside ofExpression Console with external applica-tions for scripting/filtering (Perl) andstatistics (like Partek and other GeneChip®-compatible™ software packages).n There are actually two parallel analyses(gene-level and exon-level) carried out inExpression Console that ultimately con-verge at MiDAS (or other alternative algo-rithms) for alternative splicing prediction. n The assumption for this entire approachis that there are two or more samplegroups, and we intend to find differentialalternative splicing between the groups.Alternative splicing can occur within onetissue, but in this scenario, we are onlyconcerned with the way it varies in differ-ent tissues or conditions. n There are two points at which meta-probe set options are invoked:
1. In signal estimation, the meta-probeset defines the exons to be used to cal-culate gene-level signal (PLIER,IterPLIER, RMA, etc.), and thereforedefines the set of genes to include inthe analysis.2. In MiDAS, the meta-probe setdefines the exons that are mapped tothe input genes.
The result is that you could, for instance,specify only Core (highly confident) genes,but use MiDAS to predict alternative splic-ing for the Full (speculative) set of exonsassociated with those Core genes.
n Command-line formats are provided(gray box in next column) for those usingUNIX-based systems. The analogousinput options for the Windows GUI ver-sion of Expression Console are explained indetail in the user’s manual.
PHASE I: SIGNAL ESTIMATION
Listed below is a suggested example to con-duct exon array analysis. Although there areother possible ways to perform these samefunctions, we describe one of them here as astarting point for new users.
A) Gene leveln Use Expression Console n IterPLIER (PM-GCBG)n Antigenomic.bgp as the GC back-ground pool. Antigenomic sequencesare not found in the human genome orseveral other genomes.n Sketch normalization at 50,000data pointsn Meta-probe set = Core (this is themost conservative set of genes with thehighest confidence)n Set of CEL files
Do not use DABG for gene-level estima-tion of “Present/Absent.” Detection calls forgenes will be estimated separately withanother method (as described below duringthe filtering steps).
For those using the command-line APTprograms on UNIX:probe set-summarize -a quant-norm.sketch=50000.bioc=false,pm-gcbg,iter-plier -p HuEx-1_0-st-v2.pgf -c HuEx-1_0-st-v2.clf -bantigenomic.bgp -s meta-probeset.core.txt MyCelDirectory/*.CEL
Geneexpression
analysis
CEL
Meta-probe set IterPLIER PLIER DABG
Exonp-values
Remove outlier samples
Gene signal Exon signal
Filter genesignals
Filter exonsignals
Meta-probe set
MiDAS
AS predictions
Fold change and p-value
Visualization
Validation
Figure 5: Workflow for gene expression and alternative splicing analysis with exon arrays.
Tan boxes represent files or data sets and green boxes represent processes or programs.
Functions within the gray boxes occur within Expression Console, or Affymetrix APT. Solid
arrows are the main data flow and dashed lines are accessory flows.

B) Exon leveln Use Expression Consolen PLIER (PM-GCBG). Most probesets only have four probes, which is toolimited to be useful with IterPLIER atthe individual exon level.n Antigenomic.bgpn Sketch normalization at 50,000data pointsn DABG (PM-only)-produces p-val-ues for detection above backgroundn It is possible to limit the analysis toa subset of exons by providing a listfile. However, in general, it may bebest to begin with an inclusive set likeprobe set-list.main.txt to minimize anybias in analysis.n Set of CEL files
PHASE II: REMOVING OUTLIERS
Outlier samples should be identified andeliminated, or at a minimum, accounted for.This is particularly true in analysis of exonarray data since low sample quality is likelyto be highly influential in generating noise,therefore leading to high false positive rates.
A typical approach is the PrincipleComponent Analysis (PCA) for identifica-tion of possible outliers, followed byANOVA to test their effect (using a standardstatistical package, such as Partek’sGenomics Suite). Examples are shown inFigure 6. Samples found as extreme outliersshould be removed from the analysis.
PHASE III: FILTERING SIGNAL DATA
In order to obtain meaningful splicinginformation and to decrease the chances offalse positives (thereby increasing the veri-fication rate), a number of filtering stepscan be performed.
Within the analysis described in thisTechnical Note, validation of splicing events in
A F F Y M E T R I X ® P R O D U C T FA M I LY > ARRAYS
G E N E E X P R E S S I O N M O N I T O R I N G
A F F Y M E T R I X ® P R O D U C T FA M I LY > ARRAYS
nnnn 6
For those using the command-line APTprograms on UNIX:probe set-summarize -a plier-gcbg-sketch -p HuEx-1_0-st-v2.pgf -cHuEx-1_0-st-v2.clf -bantigenomic.bgp -s probe set-list.main.txt -a pm-only,dabg -x 2MyCelDirectory/*.CEL
-400
-700 -559 -419 -279 -139 0 140 280 420 560PC #1 20.6%
PC
#2
8.73
%
700
-317
-235
-153
-71
10
92
174
256
338
420
Tissue typeNormal
Tumor
Figure 6: Principle Component Analysis (PCA) to identify outlier samples. The examples
shown here are the colon and normal paired samples run on exon arrays. The CEL files are
available at www.affymetrix.com. Exon-level signals from each sample are mapped by PCA,
and paired tumor-normal samples are joined by lines. The circled sample data (back left)
appears to be an outlier in two dimensions (1 and 3) of the PCA mapping. However, it is
Patient #3 (black arrows) that behaves contrary to the majority of the samples; while most
of the tumor samples tend to have a higher value on the chief PCA component (i.e., right-
ward on the X-axis) than the normal tissue, Patient #3 tends to the opposite direction. The
aberrant behavior of Patient #3 is confirmed by ANOVA (shown in Figure 7 below). This also
illustrates one of the advantages of having paired samples.
0
AllDel_3
Patient
Ave
. F R
atio
Tissue Gender Stage Ulcer
1
2
3
4
5
6Sources of Variation
Figure 7: ANOVA analysis of signal and noise. Exclusion of the sample pair from Patient #3
(“Del_3”) in ANOVA analysis greatly improves the signal-to-noise ratio for discrimination by
tissue type (normal vs. tumor). Therefore, Patient #3 was removed from the remainder of
the analysis described below. No other sample pair had this magnitude of effect. Be aware,
however, that removing outliers reduces sample size; therefore removal of outlier samples
should be done cautiously. Furthermore, noise ratios (normalized against error) from
ANOVA also showed that the gender, patient and tumor-stage categories were relevant (F
Ratio > 1), and thus should be included as factors in later analysis.

nnnn 7
the laboratory (e.g., by RT-PCR) is by farthe most laborious step. Therefore, addition-al effort made during computational analysisto reduce false positive rate will ultimatelydecrease time spent in the lab. In this sec-tion, we present some suggestions for mini-mizing the impact of artifactual signals. Inaddition, several more stringent optional fil-tering steps are possible that may furtherlessen false positives and make it easier tofind “low-hanging fruit” for validation.Figure 8 illustrates several examples of pos-sible scenarios that may lead to misidentifi-cation of alternative splicing events.
Several filtering methods applied to signaldata are suggested here and are described indetail in the Filtering Methods section. Someof these methods have been implemented inthird-party software, but otherwise can be per-formed using simple scripts, e.g., in Perl.
PRIMARY (MANDATORY) FILTERING 1. Remove any gene (transcript cluster)
that is not expressed in both sample groups—to eliminate the scenario illustrated in the left column of Figure 8.
2. Remove any exon (probe set) that is not expressed in at least one sample group—to eliminate the scenario illustrated in the most right column of Figure 8.
SECONDARY (SUGGESTED) FILTERING1. Remove probe sets with high potential for
cross-hybridization—to eliminate the
scenario illustrated in the middle column of Figure 8.
2. Require a minimum gene signal level. 3. Remove probe sets with very large
exon/gene intensity ratio—which may also implicate cross-hybridization to other gene sequences.
4. Remove probe sets with very low exon/gene intensity ratio in the group that is expected to have the higher rate of inclusion—which may also implicate non-linearity of the probe set.
TERTIARY (OPTIONAL) FILTERING1. Remove genes that have very large
differential expression.2. Limit search to high-confidence exons.3. Restrict the search to only highly
expressed genes.4. Focus on exons that have gene-level
normalized intensities near 1.0 in the group predicted to have a higher inclusion rate and near 0 in the group predicted to have a lower inclusion rate.
5. Filter probes with unusually low variance.6. Limit search to known alternative
splicing events.
PHASE IV: MIDAS
Subsequent to filtering, both gene-level andexon-level signal intensities are input intoMiDAS.
One option to carry out alternative splic-ing analysis through MiDAS is detailed here:
n Gene signals—Core (filtered); the Core gene-level meta-probe set is chosen at the signal-estimation stage
n Exon signals—all exons (filtered) n Meta-probe set—Full; at this point the
meta-probe set tells MiDAS which set of exons to evaluate.The combination described here means that MiDAS will look at all the exons (“Full”) associated with the input Core genes. A more conservative approach may be to look only at Core exons by inputting the Core meta-set probe file.
n cel_ids.txt—This file tells MiDAS how samples are partitioned into Groups (e.g., “brain,” “lung,” “kidney”) that should be compared for differential splicing. The ANOVA in MiDAS can compare multiple groups but does not incorporate additional factors like gender, tumor stage, etc.
MiDAS outputs predictions for alternativesplicing events as p-values. These should notnecessarily be treated as true p-values but ratheras scores that reflect relative ranking. The falsepositive rate is likely to be much higher than
Group 1Group 1Gene LevelSplicing Index
Gene expressed in only one group Cross hybing probe set Non-responsive / absent probe set
Gene-levelNormalized Intensity
Splicing IndexValue
(Blue/Red)
Intensity
10
100
1000
<1
1
>1
-
0
+
10
100
1000
<1
1
>1
-
0
+
10
100
1000
<1
1
>1
-
0
+
Figure 8: Several scenarios that may lead to artifactual predictions of alternative splicing events. In each case, it is the combination of mis-
leading probe set results and differential gene expression that creates a false prediction of alternative splicing.
For those using the command-line APTprograms on UNIX:midas -c cel_ids.txt -g CC.genes-core.i-plier.sum.txt -e CC.exons-main.plier.sum.txt -m meta-probe-set.full.txt

indicated by p-values and the high-rankingcandidates should be further screened/filteredand ultimately verified empirically.
PHASE V: POST-MIDAS FILTERING
1. Keep only probe sets with p-values less than a particular cutoff (i.e., p-value < 1x10⁻³).
Probe sets with the smallest p-values are the most likely to have significant differences in inclusion rate. The cut-off value used can easily be lowered to increase stringency. The optimal cut-off value is really dependent on the number of targets you wish to see on your final list. In addition, you can do a multiple testing correction (such as Bonferroni or the Benjamini-Hochberg False Discovery Rate) to determine the p-value at which the differences are considered statistically significant.
2. Sort results by magnitude (absolute value of Splicing Index) and keep only probe sets that have a minimum difference of 0.5.
Probe sets with larger magnitudes of pre-dicted changes are more likely to have moredramatic splicing changes. Small magnitudechanges may still be biologically relevant;however, larger magnitude changes typicallymake better candidates for validation. As dis-cussed above, the cut-off value can easily beraised to increase stringency of the filterdepending on the study design and needs. Thisstep is analogous to filtering by fold change forgene expression. Whereas p-values measurethe ability to statistically separate two groups,the SI gives the magnitude of the difference.Unfortunately, MiDAS does not directly out-put the SI and it must be calculated externallyto the program (e.g., with Perl or R).
PHASE VI: VISUAL FILTERING OF RESULTS
Despite all attempts to filter the data, sever-al classes of false positives are not possible tobe identified purely based on values from thestatistical analysis itself. A simple manualinspection of the data in genomic context cancatch many of these potential pitfalls.Previous experience has shown the benefits ofdoing this in two ways.
First, BLAT the sequence of the PSR iden-tified to be alternatively spliced (can beobtained using the probe set ID on theNetAffx Data Analysis Center atwww.affymetrix.com) to the UCSC GenomeBrowser (http://genome.ucsc.edu). BLATingthe sequence can also provide informationabout potential cross-hybridization or if theprobe set maps to multiple genomic locations.
View the probe set in the browser andzoom out slightly to get a broader view of theregion around the exon or the entire genethat contains the exon of interest. Thegenome browser can provide importantinformation about location of the probe setwithin the gene and if the exon is known tobe alternatively spliced (based on EST andmRNA sequences). It may also be possible toobserve overlapping, intervening or inde-pendent transcripts (on the same or oppositestrand) and potential artifacts of transcriptcluster annotations, such as multiple genesbeing combined into a single cluster.
While not an absolute requirement forvalidation, candidates consistent with knownexamples of alternative splicing are morelikely to prove to be true positives. However,this filtering approach will also tend to sup-press the discovery of novel splicing events.
Second, it is worthwhile to examine theprobe set intensity data of your exon of inter-est and surrounding exons in an integratedbrowser such as the Affymetrix IntegratedGenome Browser (IGB) or BLIS (BiotiqueSystems). This is a helpful step to ensure thatthe data is consistent with alternative splic-
ing. For example, if the exon of interest is pre-dicted to be higher in group A (increasedinclusion), but surrounding probe sets alsoappear higher, it may suggest that the regionof the gene has an alternative start or stop thataffects multiple exons. Also, if there are mul-tiple probe sets for the exon, it is reassuringthat the data for all of them are in agreement.
Visualization and careful observation of thedata can often predict the likelihood of a pos-itive result prior to verification. For example,consider an experiment where we are compar-ing tumor samples to normal samples to lookfor aberrant splicing patterns in cancer. Wefind an exon that is predicted by the SplicingIndex (or similar algorithm) to be higher(increased inclusion) in the tumor samples.However, when we locate the position of theexon within the gene, we discover by lookingat the genome browser that the targeted exonappears to be constitutive (always included)in numerous EST and mRNA sequences.This exon is very unlikely to be a simple caseof alternative splicing (cassette exon), andthus is very unlikely to result in a positive val-idation. It is entirely possible that this seem-ingly constitutive exon is, in fact, alternative-ly spliced in cancer. However, in this case, theexon is predicted to be higher in the tumorsamples, but the exon is already included inall of the transcripts of this gene. It is not pos-sible to have an increase in inclusion when theexon is already present in 100 percent of tran-scripts. While the data may represent aninteresting biological event, it is possible thatthe result is a false positive or may involve a
A F F Y M E T R I X ® P R O D U C T FA M I LY > ARRAYS
G E N E E X P R E S S I O N M O N I T O R I N G
A F F Y M E T R I X ® P R O D U C T FA M I LY > ARRAYS
nnnn 8
Figure 9: A candidate splicing event mapped onto the UCSC Genome Browser. The high-
lighted region that corresponds to the targeted probe set (“YourSeq”) appears to be a cas-
sette exon (one that is included or skipped in different known transcripts).

nnnn 9
more complex regulation (possibly involvingalternative starts/stops) and as such may notbe easily verified by the follow-up RT-PCRverification.
While the process of manual filtering canbe time-consuming, a well-trained eye canview 100 or more potential hits in a reason-able amount of time. Our experience suggeststhat it is well worth the time and it can becoupled with the design of primer sequencesfor validation. Several commercially availableGeneChip®-compatible™ Software Packages,including Partek’s Genomics Suite andBiotique’s X-Ray, provide easy click-throughvisualization of the raw signal data on an exon-by-exon basis that belong to the same gene,and can easily be used to conduct this step ofvisual inspection.
PHASE VII: RT-PCR VALIDATION
Validations are easily carried out via RT-PCRusing primers in exons that flank the exon ofinterest. This works well for simple cassetteexons and alternative 5’ and 3’ splice sites. Asillustrated in Figure 11, when the PCR prod-ucts are run on an agarose gel, there will beseparation between the “include” product andthe “skip” product based on size (“include”product is larger by the size of the alternativeexon and therefore runs slower through thegel). Primers are best designed in flankingconstitutive exons and it is usually possible tocalculate the expected sizes of the PCR prod-ucts ahead of time.
While carefully designed quantitativePCR (i.e., TaqMan) could provide more accu-
rate estimates of the absolute levels of eachisoform, depending on the individualrequirements of the experiment, it may notbe necessary in the verification of results fromthe exon array. In most cases the two differentbands representing two alternatively splicedisoforms are produced by the same primerpair, and it is easy to observe changes in therelative intensity of the two bands betweensamples. Amplification efficiencies may differbetween the two products, but this bias willbe the same for all samples. The key observa-tion is a change in ratio (relative intensity) ofthe two products. By starting with equalamounts of input cDNA, simple RT-PCR canbe considered semi-quantitative.
Since each validation case is unique anddifferent types of alternative splicing eventsrequire different strategies, for best results,automated selection of primer sequences isnot recommended. For example, detection ofalternative starts and stops requires place-ment of a primer within the exon of interestsince the target exon does not connect toflanking exons on both sides. In this case, twoseparate PCR reactions should be run. Onedetermines presence/absence of the exon (asdescribed above), and the other is a referenceprimer pair designed to measure the alterna-tive pattern or expression level of the gene.
A similar design strategy can be used formutually exclusive exons of similar size thatcannot be resolved by separation on a gel. Inaddition, in order to discriminate inclusionversus skipping events on a gel, the overallsize of the amplicon should be designed rel-ative to the size of the target exon. Smallerexons should have smaller overall ampliconsizes so that the skip/include products willclearly resolve (separate) on the gel. Clearly,design of primers for validation is not a “onesize fits all” situation.
There are several classes of validation tar-gets that pose additional challenges to RT-PCR. Alternative starts/stops and mutuallyexclusive exons were mentioned above.Alternative transcriptional starts/stops thatinclude multiple exons are also tricky andrequire validation strategies different fromthe standard flanking exon approach.
For cassette exons that are very large insize, it may be difficult to efficiently amplify
Figure 10: A view of two mutually exclusive exons (19a and 19b) in the BLIS viewer
(Gardina, et al). This candidate splicing event was confirmed by RT-PCR. (BLIS normalizes
the exon signal for each sample to the median exon signal for that sample across all the
exons in the view.)
Typical RT-PCR ValidationPrimers in flanking constitutive exons
Pre-mRNA
Skipexon
Includeexon
Exon of interest
100
200
300
400
500
M Brai
n sa
mpl
eN
on-b
rain
sam
ple
Mature (spliced)RNA
Figure 11: Primer design for RT-PCR validation of alternative splicing events.

the “include” product using flanking exonsdue to the large size of the amplicon. Thismay also be the case for genes with multipleconsecutive cassette exons.
Additionally, incorrect selection of con-stitutive exons can lead to misinterpretationof the RT-PCR results. Independent inter-vening transcripts may be impossible tovalidate using this method since the exon ofinterest is never included in transcripts forthat gene. Some of these problematic casesare illustrated in Figure 12.
Nevertheless, thoughtful and carefulprimer design can usually find a solution forvalidation. This also supports the need forvisualization of the data in genomic context.Many of these problematic situations can beavoided by looking at EST/mRNA sequencedata for evidence of these odd types of tran-script structures. In many cases, if you didn’tknow the factors beforehand, RT-PCR mayresult in a single band and you may incor-rectly identify the exon as a false positive.
FILTERING METHODS
In this section, we will discuss some of theinherently challenging cases associatedwith this type of array-based alternativesplicing analysis, and propose a number ofprimary and optional methods to increasethe true discovery rate.
AN IDEAL SPLICING EVENT
Prior to describing the specifics of filtering,it is helpful for us to conceptualize the idealscenario for gene and exon expression thatwill maximize our ability to identify differ-ential splicing. Factors that deviate from thisideal situation tend to lower the probabilityof correctly identifying splicing eventsmathematically. Characteristics of the idealalternative splicing event include:
1. High gene expression (and consistent across all samples)
2. Equal gene expression in both sample groups
3. Most exons (probe sets) parallel the overall expression of the gene (in other words, most of the exons belonging to that gene are constitutive so that the
estimation of the gene-level signal is more reliable)
4. A single exon is alternatively spliced5. The alternatively spliced exon is always
included in one sample group and never included in the other sample group.
Figure 13 shows an example of a correctlyidentified alternative splicing event (latervalidated by RT-PCR).ANOMALOUS PROBE SIGNALS
In some cases, technical anomalies may
give a false signal for probe set intensitydue to cross-hybridization, probe set satu-ration or inherently weak and non-linearresponse. Although this is not a frequentevent, the exon array represents 1.4 millionprobe sets, giving a larger number ofpotential false positives. In most cases, thissignal will be about the same across allsamples in all groups. However, if the asso-ciated gene-level signals are differentbetween the two groups, the false probe set
A F F Y M E T R I X ® P R O D U C T FA M I LY > ARRAYS
G E N E E X P R E S S I O N M O N I T O R I N G
A F F Y M E T R I X ® P R O D U C T FA M I LY > ARRAYS
nnnn 10
Alternative 3’ ends
Internal alternative start
Independent transcript
Mutually exclusive exons
Multiple consecutive cassette exons
Very large cassette exon
Figure 12: Examples of challenging cases for RT-PCR validation where the primer pairs
(marked by flat arrows) may not give anticipated validation results due to the complication
of the biology. Therefore, careful selection of the primers and use of an alternative primer
design strategy should be considered if negative results are obtained.
Figure 13: Exon-level signals from a single gene with a validated differential splicing event.
The average signal and standard error for each probe set is shown for tumor samples (blue)
and normal samples (red). The log2 intensity scale is shown on the right-hand axis. In the
validated splicing event (indicated by the arrow), the exon shows low expression relative to
gene expression in normal tissues. Note that there are many characteristics of an ideal sce-
nario: the gene is highly and equally expressed in both groups, and most of the exons
behave uniformly. (The data here is visualized with the Partek Genomics Suite.)

nnnn 11
signal will be interpreted as differentialinclusion of the exon because the probe setsignals are normalized against the gene sig-nals from each group.
1. Cross-hybridizing or constitutively highprobe signals. In this scenario, an individ-
ual probe set signal may be stuck on “high”regardless of the actual expression of thatexon. Therefore, this exon will appear to berelatively more included in the samplegroup that has lower expression for thecognate gene. A probable example of this
phenomenon is shown in Figure 14.2. Poorly hybridizing or non-linear probes.This is the converse of the above problem,but the probe sets will appear to be weaklyexpressed in all samples (see Figure 15). Characteristics of these anomalous probe
set signals are:1. Approximately equal intensity in both
sample groups2. Low variance3. Possibly extreme intensities relative to
gene expression level.Implementation of a systematic filtering
method will be possible as more databecomes available. Fortunately, such anom-alous signals are also generally easy to identi-fy by visual inspection.
PRIMARY (MANDATORY) FILTERINGOF SPLICING INDEX RESULTSThere are two major criteria that must bemet for genes and probe sets to be includedin further downstream analysis aftermicroarrays. Both relate to a commontheme, where the lack of expression willvery often be mistaken for alternative splic-ing when compared to actual expression (oreven low expression) in another group, sincethe signals are so low that the arrays aresimply measuring the noise of the experi-ments. Thus, the first two mandatory filter-ing steps of all splicing analyses should be:
1. Remove exons (probe sets) that arenot expressed in at least one group.(The reason for only requiring detectionin one group is that if the exon is alter-natively spliced it is completely reason-able that it is absent in all of the samplesof one group.)
The following is a good default set of rules as starting points to remove exonsthat are expressed at low level:
1. If the DABG p-value of the probe set is less than 0.05, the exon is considered as “Present” in a sample.
2. If the exon is called as Present inmore than 50 percent samples of a group, the exon is considered to be expressed in that group.
3. If the exon is expressed in either group, accept it; otherwise, filter
Figure 14: A probable artifact from probe sets with constitutively high signals (indicated by
the arrow). Even though this probe set gives the same signal for both tissue types, it
appears to have a relatively high inclusion in normal samples because the gene-level signal
is lower in normal than in tumor. This probe set displays three trademark symptoms of this
artifact: it is higher than the neighboring probe set signals, it is approximately the same in
both tissues and it shows an extremely low variance across the replicates.
Figure 15: A probable artifact due to non-responsive or non-linear probes. The indicated
probe set appears to be alternatively spliced since its signal in tumor is relatively low com-
pared to gene expression in tumor. Consequently, the exon appears to be 100 percent
included in normal but only about 15 percent in tumor (the scale is log2). This probe set dis-
plays two trademark symptoms of this artifact: it has the same intensity in both tissues, and
it shows low variance across replicate samples.

it out.In a recent study of colon cancer
splicing, this step removed almost two-thirds of the exons (540,000 remained out of 1.4 million probe sets). More stringent filtering options may be implemented to require that the exon is called as Present in more than 75 percent of the samples or have a DABG p-value of less than 0.01.
2. Remove genes (transcript clusters)that are not expressed in both groups. (Alternative splicing is meaninglessunless the gene is expressed in bothsample groups.)
This is more complicated, because wedon’t presently have a direct way of mak-ing Present/Absent call at the gene level.Instead, an approach utilizes the exon-level DABG results to indirectly esti-mate Present/Absent for the gene. In thiscase, we use the Core exons as a surrogatefor gene expression (but this is only validfor Core genes).
The following is a good default set ofrules to remove genes expressed at low level:
1. If the DABG p-value of the probe set is less than 0.05, the exon is considered as Present in a gene.
2. If more than 50 percent of the Core exons are called as Present, the gene is considered Present.
3. If the gene is called as Present in more than 50 percent of the samples in a group, the gene is considered expressed in that group.
4. If the gene is expressed in bothgroups, accept it; otherwise, filter it out.
This filtering step is easily made morestringent by increasing the percentage ofsamples (e.g., more than 75 percent) inwhich the gene is expressed, and/or by low-ering the cut-off DABG p-value for detec-tion. Assuming that the gene is in factalternatively spliced, you may not want toincrease the “50 percent of Core probe sets”requirement since it is likely that some ofthe exons will be skipped.
In a recent study of colon cancer splicing,this step removed almost half of the Core
genes (9,000 remained out of 17,800 Coretranscript clusters). If Full gene sets areused for analysis, it is anticipated that amuch larger proportion of the speculativecontent will be removed.
SECONDARY (SUGGESTED) FILTERING1. Discard probe sets with high poten-tial for cross-hybridization.
Probe sets that have the potential for cross-hybridization are more likely to result in falsepositives. This is because the signal from theprobe set may originate from an entirely dif-ferent gene that may have tissue-specificexpression. On the exon array, each probe sethas a value of potential to cross-hybridize inthe annotation files. Probe sets with cross-hybridization values other than 1 might becandidates for removal from the analysis.2. Require a minimum gene expressionintensity of greater than 15.
Results from genes with low expressionvalues close to the noise level may not be asreliable. Genes with higher expression val-ues tend to have less noise. The actual opti-mal cut-off value is likely to be dependenton the experiment (and how the gene-levelvalues are calculated). This value can beincreased if higher stringency is desired.
In general, one can estimate the back-ground gene signal and set an absolutethreshold for calling the gene Present. Inthis case:
1. If the gene signal is greater than THRESHOLD, the gene is called as Present.
2. If the gene is called as Present in more than 50 percent of the samples in a group, the gene is expressed in that group.
3. If the gene is expressed in bothgroups, accept it; otherwise, filter it out.
3. Discard probe sets with verylarge gene-level normalized inten-sities (exon/gene > 5.0).
This filter relates to probes with poten-tial cross-hybridization, but also includesprobes with high background levels. Thetheory behind this filter is that exons hav-ing intensities much higher than the
median intensity across the gene are likelyto have a signal that originates from some-where outside of the gene. While thereshould be some consideration for probeswith varying affinities (probe response),intensities that are dramatically differentfrom the rest of the exons belonging to thesame gene are certainly questionable. Evengiven the potential variability in proberesponse, accepting a value much beyond 5.0(e.g., the exon is five times higher than thegene intensity in an absolute comparison sense)is not recommended. Large values for the gene-level normalized intensities can also result insomewhat inflated magnitudes of change.4. Discard probe sets with very lowgene-level normalized intensities in thegroup that is predicted to have the high-er rate of inclusion (exon/gene < 0.20).
The theory behind this filtering step issomewhat related to the argument above,that exon intensities that are much differentfrom the median intensity are unusual.However, it is a bit more complicated on thelow end. It is entirely feasible that an exoncould be included in only, say, 10 percent oftranscripts in group A, but in only 1 percentof transcripts in group B. This differencestill represents a 10-fold higher inclusionrate in group A, and the exon could still beconsidered enriched in group A. However, ifour interest is in reducing the false positiverate and finding suitable validation targets,this class is better off being filtered out. Inmost of these cases it is more likely that theexon is simply not expressed at all.
TERTIARY (OPTIONAL) FILTERING1. Remove genes that have very largeexpression differences between thetwo groups.
Despite the fact that the Splicing Indexalgorithm corrects for gene expression level,genes with very large differentials in geneexpression between the two groups have atendency to produce false positives. Largedisparities in transcription rate make itmore likely that probe set intensities inthe two groups are disproportionatelyaffected by background noise or satura-tion. A 10-fold difference is an arbitrary
A F F Y M E T R I X ® P R O D U C T FA M I LY > ARRAYS
G E N E E X P R E S S I O N M O N I T O R I N G
A F F Y M E T R I X ® P R O D U C T FA M I LY > ARRAYS
nnnn 12
nnnn 13
cut-off that can be decreased if a lessstringent filtering is desired:
|log2 (gene / gene)| > 3.32At the extreme, we might begin by look-ing only at genes with approximatelyequal expression.2. Limit search to “Ensembl/RefSeqSupported” or “Core” Exons.
Narrowing the set of analyzed exons toonly well-annotated exons (“Core” exons)is a way of dramatically reducing theamount of speculative content. Becausespeculative exons have much lower levelsof annotation/sequence support, they aremore likely to result in false positives. Thetrade-off with this filter is that you willlose the ability to discover new splicingevents involving novel exons. It is possi-ble, however, to uncover new examples ofalternative splicing that involve well-annotated exons (novel skipping of aknown exon, for example.)3. Increase stringency on gene expres-sion level filter to restrict the searchto only highly expressed genes.
Genes with higher expression levelshave exon intensities that are furtheraway from noise and thus are more reli-able. A reasonable, but very conservative,threshold would be greater than 100.This filter can be used to find the lowestof the “low-hanging fruit,” but at theexpense of potentially interesting alter-native splicing events in low or moder-ately expressed genes.4. Focus on exons that have gene-levelnormalized intensities near 1.0 in thegroup predicted to have a higher inclu-sion rate and gene-level normalizedintensities close to 0 in the group pre-dicted to have a lower inclusion rate.
This filter is a bit theoretical, but doeshave some basis in fact. For the sake ofsimplicity in this example, let’s assumethat all probes have equivalent affinities(probe response). Let’s also assume thatyou are looking for a dramatic change insplicing pattern such that an exon isfully included in all transcripts in onegroup and fully skipped in all transcriptsin the other group. In this perfect case,
the exon would be expected to have agene-level normalized intensity of 1.0(exon intensity equivalent to geneexpression level) in group A, and a gene-level normalized intensity of 0 (exon notexpressed) in group B.
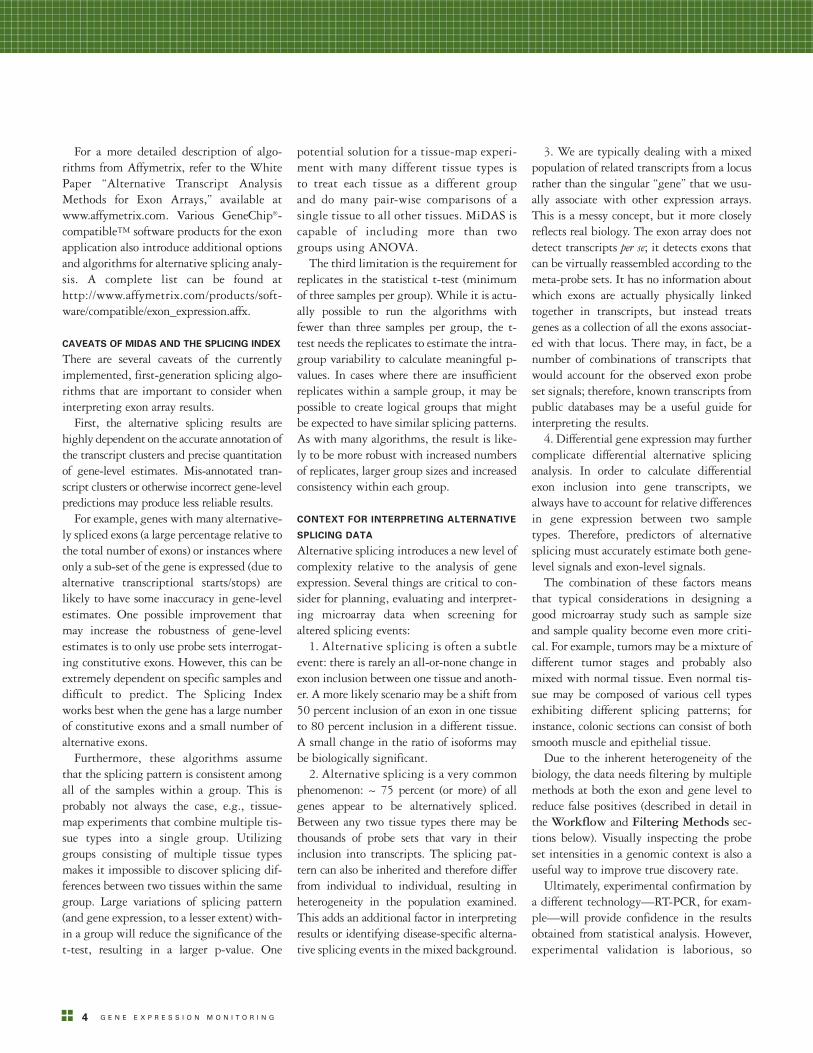
Real data is, of course, not this ideal-ized. However, there is some empiricalsupport for this theory. Figure 16 showsa histogram of gene-level normalizedintensities for validated brain-enrichedexons in both the brain samples (red) andnon-brain samples (green). The peak forthe brain samples (exon included) isbetween 0.8 and 1.0, and the peak forthe non-brain samples (exon skipped) isbetween 0.2 and 0.4.5. Filter probes with unusually lowvariance.
This filter seems a bit counterintu-itive at first, but the idea is thatprobes with very low variance (relativeto others within the gene) across thesamples are very likely to be eitherabsent in all samples (not expressed) orsaturated in all samples. If the signalis above background it can escape theDABG filter even though the exon is“Absent.” By definition, an alterna-
tively spliced exon will have probe setintensities that change between sam-ples (Present in one sample, Absent inanother). This will also tend to elimi-nate probes that are cross-hybridizingor non-responsive.6. Limit search to known alternativesplicing events.
One way of quickly screening for candi-dates that are most likely to result in pos-itive validations is to limit the analysis setto exons that have prior evidence of beinginvolved in an alternative splicing event.This filter is more difficult to implementsince it relies on bioinformatic predictionsof alternative splicing based onEST/mRNA sequences or annotations.The UCSC Genome Browser is one goodsource of transcript and alternative splic-ing predictions. In addition, there are anumber of publicly accessible databases ofalternative splicing events available on theInternet. It may be possible for this pre-diction to be run once to create a list ofprobe sets that could be used to filter allsubsequent analyses. It should be pointedout that most exon-exon junction arraysare filtered in this way by default sincethey are typically designed to observe
Median gene-level normalized intensity (Exon/Gene)
Freq
uen
cy
00.0 0.4 0.8 1.2 1.6 2.0 2.4 2.8 3.2 3.6 4.0
10
20
30
40
50
60
Brain Group
Non-brain Group
Figure 16: Histogram of gene-level normalized intensities for validated alternative
splicing events.

junctions. Thus, it might be expectedthat they would have higher validationrates on the whole compared to an exonarray design. Using this filter does, how-ever, surrender the ability to discover newalternative splicing events.
OVERALL STRATEGIES
It is important to remember that after theCEL files are produced, the most laboriousstep in the analysis is validation in the labo-ratory, e.g., by RT-PCR. Therefore, it maybe wise to begin with an extremely conser-vative analysis that minimizes false positives(i.e., using all or most of the recommendedfiltering steps), then relax the search for can-didate splicing events until the false positiverate becomes unacceptable.
This strategy may be modified depend-ing on time constraints since it postulatesiterative cycles of analysis/validation. Thefinal success rate will likely be heavilydependent on sample quality, sample sizeand the inherent biological differencesbetween the sample groups.
As an example, a study comprising apanel of relatively pure normal tissue sam-ples produced a validation rate of 85 per-cent, while a much noisier comparison ofcolon tumor versus normal tissue demon-strated a validation rate of 35 percent.Researchers might also have particularinterests that guide their strategies, e.g.,searching for targets of a particular splicingfactor or alternative splicing events in aparticular pathway.
SPLICING EVENTS THAT MAYBE MISSED BY THE ANALYSIS
Here is a partial list of situations wherea real splicing event may be missed (falsenegative) by current splicing algorithmsalong with brief discussions of each:
nn Alternative splicing outside oftranscript clusters
The MiDAS uses transcript clusterinformation to generate the gene-levelcall, thus any probe set outside of atranscript cluster is excluded from the
analysis. Depending on how youdefine “transcript cluster,” the exclud-ed probe sets represent a significantportion of the total number of probesets on the exon array.nn No probe set for the alternativelyspliced exon
There are several reasons why anexon may not be represented by aprobe set on the exon array. Some ofthe reasons for lack of probe set includevery small exons (less than 25 bp),over-fragmented exons resulting inmultiple PSRs that are all below theminimum size and lack of evidence (orprediction) for existence of the exon. Itis also possible that the sequence of theexon made it impossible to buildprobes, the designed probes give veryweak signal or the sequence of the exonis repeated elsewhere in the genomesuch that data from the probes for thatexon were discarded or filtered out.nn Alternatively spliced product israpidly degraded
It is possible that mRNA, includingan alternatively spliced exon, is turnedover at a high rate so that the signal isnot detectable by the array. In manycases, inclusion of an exon (or mis-splicing) alters the protein codingreading frame or incorporates a prema-ture termination codon (PTC). Cellshave a mechanism called NonsenseMediated Decay (NMD) for detectingand destroying these messages. It hasalso been shown that in some casesthis mechanism is exploited as ameans of regulating gene expression:purposeful inclusion of a PTC so thatthe mRNAs are degraded by NMD tosilence expression of the gene.nn Only a fraction of annotatedexons from a gene are expressed
Many genes have alternative tran-scriptional starts or alternative 3’ ends.In some cases, these alternative startsand stops may result in only a fractionof the well-annotated exons in a tran-script cluster being expressed. Our fil-tering approaches require that more
than 50 percent of the well-annotatedexons within a transcript cluster bedetected above background for thegene to be considered as expressed.Thus, if expression involves fewer thanhalf of the exons, the algorithm willincorrectly call the gene as absent.
SUMMARY
Exon arrays are powerful tools that enableresearchers to monitor genome-wide geneexpression and alternative splicing beyondclassical microarrays. By following the basicguidelines in this Technical Note, novelsplicing events may be uncovered that arecritical to biology and disease studies, addinga new dimension to genome research.
FAQs
1. Why should DABG not be used forgene-level Present/Absent calls?
There is a strong assumption in DABGthat all the probes are measuring the samething (i.e., the same transcript). This is notthe case at the gene level due to alternativesplicing. For example, probes for a cassetteexon that is skipped will contribute to a mis-leadingly insignificant p-value.
2. Can we determine frameshifts orthe introduction of nonsense codons byalternative splicing events?
No. The resolution of the Human Exon1.0 ST Array is not nearly sufficient to deter-mine single nucleotide changes. This wouldrequire junction-type arrays, which focus onspecific events that are known a priori. TheHuman Exon 1.0 ST Array is designed morefor genome-wide discovery of large-scalealterations in transcript structure.
3. What validation rate should beexpected from the analysis?
A validation rate of 80 percent would beexcellent, but rates down to 30 percent mightbe acceptable in discovery-based research.Generally, the predicted splicing events thatconsistently survive different types of filter-ing are more likely to be true positives. Theacceptable validation rate will be a balancebetween the researcher’s available time and
A F F Y M E T R I X ® P R O D U C T FA M I LY > ARRAYS
G E N E E X P R E S S I O N M O N I T O R I N G
A F F Y M E T R I X ® P R O D U C T FA M I LY > ARRAYS
nnnn 14

nnnn 15
resources to the validation versus the desire toextend the limits of the search. As a first dis-covery tool, exon arrays will generate infor-mation not previously possible with other tra-ditional technologies. In some cases, the dis-covery of even 10 new splicing events in anexon study might be highly significant. Asmore data sets become available on exonarrays, it is anticipated that further algorithmdevelopment will become more sophisticatedand the validation rate will improve.
4. Can MiDAS handle multiple sam-ple groups?
The ANOVA in MiDAS can comparemultiple groups, e.g., brain, kidney andheart. It does not handle additional factorslike gender, tumor stage, etc. More sophis-ticated ANOVA methods have been imple-mented in third-party packages.
REFERENCES
Technical Note, GeneChip® Exon Array DesignWhite Paper: Guide to Probe Logarithmic Intensity Error(PLIER) EstimationWhite Paper: Exon Probe Set Annotations and TranscriptCluster Groupings v1.0White Paper: Gene-Signal Estimates from Exon ArraysWhite Paper: Alternative Transcript Analysis Methods for Exon ArraysTechnical Note, Statistical Algorithms Reference GuideGardina, P. J., et al. Alternative splicing and differentialgene expression in colon cancer detected by a wholegenome exon array. BMC Genomics 7:325 (2006).Srinivasan K., et al. Detection and measurement ofalternative splicing using splicing-sensitive microarrays.Methods 37(4):345-59 (2005).
A complete listing of GeneChip®-compatible™ softwareproducts for exon applications can be found athttp://www.affymetrix.com/products/software/compatible/exon_expression.affx.

AFFYMETRIX, UK Ltd.
Voyager, Mercury Park,Wycombe Lane, Wooburn Green,High Wycombe HP10 0HHUnited KingdomUK and Others Tel: +44 (0) 1628552550France Tel: 0800919505Germany Tel: 01803001334Fax: +44 (0) 1628 [email protected]@affymetrix.com
AFFYMETRIX, INC.
3420 Central ExpresswaySanta Clara, CA 95051 USATel: 1-888-DNA-CHIP (1-888-362-2447)Fax: [email protected]@affymetrix.com
AFFYMETRIX JAPAN K.K.
Mita NN Bldg., 16 F 4-1-23 Shiba, Minato-ku, Tokyo 108-0014 Japan Tel: +81-(0)3-5730-8200 Fax: +81-(0)3-5730-8201 [email protected] [email protected]
Part No. 702422 Rev. 1©2006 Affymetrix, Inc. All rights reserved. Affymetrix®, ®, GeneChip®, HuSNP®, GenFlex®, Flying Objective™, CustomExpress®, CustomSeq® , NetAffx™, Tools To Take You As Far As Your Vision®, The Way Ahead™, Powered by Affymetrix™,GeneChip-compatible™, and Command Console™ are trademarks of Affymetrix, Inc. Products may be covered by one or more of the following patents and/or sold under license from Oxford Gene Technology: U.S. Patent Nos.5,445,934; 5,700,637; 5,744,305; 5,945,334; 6,054,270; 6,140,044; 6,261,776; 6,291,183; 6,346,413; 6,399,365; 6,420,169; 6,551,817; 6,610,482; 6,733,977; and EP 619 321; 373 203 and other U.S. or foreign patents.
www.affymetrix.com Please visit our web site for international distributor contact information.
For research use only. Not for use in diagnostic procedures.