identifying land use changes and it’s socio...
TRANSCRIPT

IDENTIFYING LAND USE CHANGES AND IT’S
SOCIO-ECONOMIC IMPACTS; A CASE STUDY OF
CHAKORIA SUNDARBAN IN BANGLADESH
Submitted by;
Name – Khalid Bin Musa
Person Number – 820202- 4678
Date- 4th June 2008
Thesis submitted in partial fulfillment of the
requirements for the degree of Master
Programmes of in Geoinformatics
Department of Computer and Information Science (IDA) Linköping University Linkoping, Sweden

Rapporttyp Report category
Licentiatavhandling
Examensarbete
C-uppsats
D-uppsats
Övrig rapport
Språk Language
Svenska/Swedish
Engelska/English
Titel Title
Författare Author
Sammanfattning Abstract
ISBN
ISRN LIU-IDA/FFK-UP-A--08/012--SE
Serietitel och serienummer ISSN Title of series, numbering
Nyckelord Keywords
Datum Dated, Linköping
URL för elektronisk version
■
Avdelning, institution Division, department
Institutionen för datavetenskap
Department of Computer and Information Science
Identifying land use changes and it’s socio-economic impacts; A Case Study of Chakoria Sundarban in Bangladesh.
Khalid Bin Musa
Human intervention and natural phenomenon cause change in land use day by day. Availability of accurate land use information is essential for many applications like natural resource management, planning and monitoring programs. Landuse Change has become a central component in current strategies for managing natural resources and monitoring environmental change. Because of the rapid development in the field of land use mapping, there is an increase in studies of land use change worldwide. Providing an accurate assessment of the extent and health of the world’s forest, grassland and agricultural resources has become an important priority. By printed maps without any statistics or only statistics without any map can not solve this visualization problem. Because printed maps have not attracted as much attention as statistics among the people because of it is limited applications (Himiyama, 2002). Remotely sensed data like aerial photographs and satellite imageries are undoubtedly the most ideal data for extracting land use change information. Satellite images are the most economical way of getting data for different times. The multitude of existing software helps getting information from satellite image also in manipulating the information. The approach used in this study to classify satellite images and change detection based on Satellite images Landsat MSS (1972), Landsat TM (1989) and Landsat ETM (1999) for using supervised classification methods like maximum likelihood (MAXLIKE), MAHALCLASS and time series analysis of CROSSTAB. After performed these hard and soft classifiers the research showed the significant Landuse change in the study area of Chakoria Sundarban mangrove forest. Remote sensing is the modern tools for detecting change pattern and behaviours of coastal environment (Saifuzzaman, 2000). So, those tools are used in the research work for better change analysis of the study area. For analyzing, evaluation and mapping environmental change detection of different years remotely sensed data have been undertaken. The present research provides some suggestions and recommendations as per research findings in order to optimize the utility of coastal resources and to maintain the sustainability of the resources, coastal land use control and there by stabilizing the coastal vulnerable area of Chakoria Sundarban.
Landuse Change, Remotely Sensed Data, Aerial Photographs, Satellite Imageries, Landsat MSS, Landsat TM, Landsat ETM, Supervised Classification, Maximum Likelihood (MAXLIKE), MAHALCLASS and CROSSTAB.
04/06/ 2008
Linköpings universitet
■

DECLARATION
This document describes work undertaken as a part of Master’s Programmes in Geoinformatic in the Linköping University. All views and opinions expressed there in remain the sole responsibility of the author
and do not necessarily represent those of the institute.

i
ACKNOWLEDGMENT
I would like to express my gratitude to the department of Computer and Information
Science (IDA), Geoinformatics for allowing me to conduct the research. I am grateful to my
supervisor Mr. Chandan Roy of the department of Computer and Information Science
(IDA), for his timely supervision, guiding me in the planning, excusing and reporting of this
research. I am also grateful to our great teacher, Professor Dr. Åke Sivertun. His Guideline
and teaching helps me around the research work. Thanks to Bangladesh Space Research and
Remote Sensing Organization (SPARRSO) to provide me the satellite images. Thanks are
also due to the staff members of Computer and Information Science (IDA) Geoinformatics
department where they provide us the great remote sensing labs and software’s. I wish to
thank all of my Geoinformatics course-mates for being part of a “family” at the University
and for sharing knowledge.
To my family and relatives, I am grateful to you for your steadfast understanding and
patience. My whole-heat full special thanks go to my Father, Mother and my Girl friend, for
all their support and prayers for me during my studies.
Finally, I bless my lord for the spiritual guidance, strength and protection provided to me
throughout my course.
Yours sincerely
Khalid Bin Musa

ii
Dedicated
To
MY PARENTS

iii
ABSTRACT
Human intervention and natural phenomenon cause change in land use day by day. Availability of
accurate land use information is essential for many applications like natural resource management,
planning and monitoring programs. Landuse Change has become a central component in current
strategies for managing natural resources and monitoring environmental change. Because of the rapid
development in the field of land use mapping, there is an increase in studies of land use change
worldwide. Providing an accurate assessment of the extent and health of the world’s forest, grassland
and agricultural resources has become an important priority. By printed maps without any statistics or
only statistics without any map can not solve this visualization problem. Because printed maps have not
attracted as much attention as statistics among the people because of it is limited applications
(Himiyama, 2002). Remotely sensed data like aerial photographs and satellite imageries are
undoubtedly the most ideal data for extracting land use change information. Satellite images are the
most economical way of getting data for different times. The multitude of existing software helps getting
information from satellite image also in manipulating the information. The approach used in this study
to classify satellite images and change detection based on Satellite images Landsat MSS (1972),
Landsat TM (1989) and Landsat ETM (1999) for using supervised classification methods like
maximum likelihood (MAXLIKE), MAHALCLASS and time series analysis of CROSSTAB.
After performed these hard and soft classifiers the research showed the significant Landuse change in the
study area of Chakoria Sundarban mangrove forest. Remote sensing is the modern tools for detecting
change pattern and behaviours of coastal environment (Saifuzzaman, 2000). So, those tools are used in
the research work for better change analysis of the study area. For analyzing, evaluation and mapping
environmental change detection of different years remotely sensed data have been undertaken. The
present research provides some suggestions and recommendations as per research findings in order to
optimize the utility of coastal resources and to maintain the sustainability of the resources, coastal land
use control and there by stabilizing the coastal vulnerable area of Chakoria Sundarban.
Keyword: Landuse Change, Remotely Sensed Data, Aerial Photographs, Satellite Imageries, Landsat
MSS, Landsat TM, Landsat ETM, Supervised Classification, Maximum Likelihood (MAXLIKE),
MAHALCLASS and CROSSTAB.

iv
TABLE OF CONTENTS
Acknowledgement .......................................................................................................... i
Dedication....................................................................................................................... ii
Abstract .......................................................................................................................... iii
Table of Contents ......................................................................................................... iv
List of Figures............................................................................................................ ..viii
List of Tables................................................................................................................. xi
1. INTRODUCTION................................................................................................ 1
1.1 Background of Study ..................................................................................... 1
1.2 Statement of the problems............................................................................. 2
1.3 Research objectives......................................................................................... 2
1.4 Hypothesis to be tested.................................................................................. 3
1.5 Data and Materials.......................................................................................... 3
1.6 Method used…………………………………………………………..7
1.6.1 Introduction........................................................................................... 7
1.6.2 Research stages...................................................................................... 7
1.6.2.1. Preparation ................................................................................. 8
1.6.2.1(A) Literature review………………………………8
1.6.2.1(B) Collection of the image and LGED map………8
1.6.2.2. Processing and description stage ........................................... ..8
1.6.2.3. Mapping and analysis stage....................................................... 8
1.6.2.4. Evaluation and reporting stage ................................................ 8
2. STUDY AREA........................................................................................................ 9
2.1 Introduction...................................................................................................... 9
2.2 Geographical location....................................................................................... 9
2.3 Climate ............................................................................................................... 9
2.3.1 Rainfall ......................................................................................... 11
2.3.2 Temperature ................................................................................ 13
2.3.3 Salinity .......................................................................................... 14
2.3.4 Wind............................................................................................. 17
2.3.5 Tide............................................................................................... 17
2.3.6 Water Level ................................................................................. 17
v
2.4 Geology and Physiographic ........................................................................... 18
2.4.1 Ganges Tidal Floodplain............................................................ 18
2.4.2 Sundarban ....……………………………………………...19
2.4.3 Chittagong Coastal Plain .......................................................... 19
2.5 Vegetation and Land Use............................................................................... 20
2.6 Cultural Practices in Chakoria Sundarban Area ......................................... 21
2.7 Shrimp Culture in Rotation with Salt .......................................................... 21
3. REVIEW OF LITERATURE AND
CONCEPTUAL BACKGROUND.................................................................... 23
3.1. Introduction.................................................................................................... 23
3.2 Environment .................................................................................................. 23
3.2.1 Natural environment ........................................................................... 23
3.2.2 Environmental Change......................................................................... 24
3.3 Geoinformatic ................................................................................................ 26
3.3.1 GIS ............................................................................................... 26
3.3.2 Remote sensing ........................................................................... 27
3.4 Deforestation................................................................................................... 27
3.4.1 Causes of deforestation.............................................................. 27
3.4.1.1 Environmental effects……………………………...28
3.4.1.2 Wildlife……………………………............................ 28
3.4.1.3 Soil erosion ...................................................................... 28
3.4.1.4 Landslides ........................................................................ 28
3.4.1.5 Social change ................................................................... 28
3.4.1.6 Other Causes ................................................................... 28
3.4.2 Effect of deforestation .............................................................. 29
3.4.3 Mangrove..................................................................................... 30
3.5 Land use .......................................................................................................... 32
3.5.1 Landuse Mapping using Satellite Image ................................... 32
4. REMOTE SENSING AND IT’S APPLICATION ....................................... 38
4.1. Introduction.................................................................................................... 38
4.2. The electromagnetic spectrum ..................................................................... 39
4.3. Energy interactions with the earth surface features ................................... 40
4.3.1 Interaction with the water bodies........................................................ 40
4.3.2 Interaction with the vegetation and soil ............................................ 41

vi
4.3.3 Observing the earth’s surface through satellites ............................... 42
4.4 IRS…… . ......................................................................................................... 43
4.5 Application of Remote Sensing .................................................................... 43
4.5.1 Mapping ................................................................................................. 43
4.5.2 Land Cover & Land Use ...................................................................... 44
4.5.3 Land Use Change (Rural / Urban)...................................................... 45
4.5.4 Forestry .................................................................................................. 46
4.5.4.1 Reconnaissance mapping: ....................................................... 47
4.5.4.2 Commercial forestry: ............................................................... 47
4.5.4.3 Environmental monitoring .................................................... 47
4.5.5 Mapping & Deforestation.................................................................... 48
5. IMAGE INTERPRETATION AND ANALYSIS…................................... 49
5.1 Introduction .................................................................................................... 49
5.2 Use of Software Resources ........................................................................... 52
5.3 Vector map generation from the LGED map............................................. 53
5.4 Digital Image Processing ............................................................................... 54
5.4.1 Preprocessing......................................................................................... 54
5.4.2 Image Enhancement............................................................................. 54
5.4.3 Image Transformation ......................................................................... 55
5.4.4 Image Classification and Analysis ...................................................... 55
5.5 Weighted difference vegetation Index (WDVI) ......................................... 58
5.6 FCC Analysis ................................................................................................... 61
5.7 Signature development................................................................................... 62
5.8 Hard Classification.......................................................................................... 62
5.8.1 Maximum Likelihood Classification ................................................... 62
5.9 Soft Classification .......................................................................................... 66
5.9.1 MAHALCLASS .................................................................................... 66
5.10 Changes in Landuse...................................................................................... 70
5.11 Time Series Analysis ..................................................................................... 70
5.11.1 CROSSTAB......................................................................................... 70
5.12 Survey Questionnaires Analysis................................................................... 76
5.13 Findings ......................................................................................................... 91
6. CONCLUSION................................................................................................... 92
6.1 Conclusion...................................................................................................... 92

vii
6.2 Recommendations ......................................................................................... 93
7. REFERENCES ................................................................................................... 94
8. APPENDIX……… . ......................................................................................... 99

viii
LIST OF FIGURES
Number Page
Figure 1.1: The map of Chakoria Sundarban…………………………………………..5
Figure 1.2: Satellite Landsat ETM (20 JAN 1999)
showing the study area (Cox’s Bazar coast)…………………….…………...6
Figure 1.3: Satellite digital data of Landsat ETM+
(20 JAN 1999) of the Chakoria Sundarban Area…………………………....6
Figure 1.4: Flowchart of the research methodology….………………..………………..7
Figure 2.1: The vector map of Chakoria Sundarban Union Areas………….……...........14
Figure 2.2: The vector map represents Deep Salinity and Low
Salinity Area in COX’S Bazar……………………………………………..15
Figure 2.3: The curve shows the increasing amounts
salinity in the soil in Chakoria Sundarban………………………………….16
Figure 2.4: The curve shows the
water level of the Chakoria Sundarban….………………………………....18
Figure 2.5: The charts showing the average Landuse
type in each and every union in Chakoria………………………………….20
Figure 2.6: The curve shows the increasing amounts
of shrimp farm in Chakoria Sundarban………………………………….…22
Figure 4.1: Electro magnetic Remote Sensing of earth resources………………….…....38
Figure 4.2: The electromagnetic spectrum……………………………………….…….39
Figure 4.3: Basic interactions between
electromagnetic energy and earth surface feature…………………………..40
Figure 4.4: Major factors influencing spectral characteristics of a water body……….….41
Figure 5.1: Remote Sensing working platform……………………………………...….49
Figure 5.2: The flowchart represents research stages for entire research work.………....48
Figure 5.3: The vector map shows River flow
and Forest map of Chakoria Sundarban………..………… ………………53
Figure 5.4: Remote Sensing image transformation…………………………………….55
Figure 5.5: Remote Sensing image classification………………………………………56
Figure 5.6: Remote Sensing image classification………………………………………57

ix
Figure 5.7: WDVI mechanisms for 1972………………………………………………58
Figure 5.8: WDVI mechanisms for 1989………………………………………………59
Figure 5.9: WDVI mechanisms for 1999………………………………………………59
Figure 5.10: FCC converted image…………….………………………………….……61
Figure 5.11: Signature development showing the Land Use type……………………….62
Figure 5.12: MAXLIKE Hard Classification on MM 1972……………………………..63
Figure5.13: The graph shows the Landuse type in the Chakoria
using MAXLIKE classification in Landsat MSS in year 1972……………...63
Figure 5.14: MAXLIKE Hard Classification on TM 1989……………………………..64
Figure5.15: The graph shows the land use type in the Chakoria using
MAXLIKE classification in Landsat TM in year 1989……………………64
Figure 5.16: MAXLIKE Hard Classification on ETM 1999…………………………...65
Figure5.17: The graph shows the land use type in the Chakoria using
MAXLIKE classification in Landsat ETM in year 1999…………………..65
Figure5.18: 1, 2, 3 MAHALCLASS on MSS(1972), TM (1989)
and ETM(1999) for Forest……………………………………………….66
Figure 5.19: 1, 2, 3 MAHALCLASS on MSS (1972), TM (1989)
and ETM (1999) for Salt Bed…………………………………………….67
Figure 5.20: 1, 2, 3 MAHALCLASS on MSS (1972), TM (1989)
and ETM (1999) for Settlement………………………………………….68
Figure 5.21: 1, 2, 3 MAHALCLASS on MSS (1972), TM (1989), ETM (1999)
for Water and Shrimp Farm……………………………………………69
Figure 5.22: Crosstab between MSS (1972) to TM (1989) And
TM (1989) to ETM (1999) for Forest……………………………………71
Figure 5.23: The graph shows the Change detection and comparison
between MSS (1972) to ETM (1999) using CROSSTAB
Time Series Analysis (Forest Area)……………………………………….71
Figure 5.24: Crosstab between MSS (1972) to TM (1989) And
TM (1989) to ETM (1999) for Salt Bed………………………………….72
Figure 5.25: The graph shows the Change detection and comparison
between MSS (1972) to ETM (1999) using CROSSTAB
Time Series Analysis (Salt Bed Area)……………………………………..72
Figure 5.26: Crosstab between MSS (1972) to TM (1989)
And TM (1989) to ETM (1999) for Settlement…………………………...73
Figure 5.27: The graph shows the Change detection and comparison
between MSS (1972) to ETM (1999) using

x
CROSSTAB Time Series Analysis (Settlement Area)………….…………..73
Figure 5.28: Crosstab between MSS (1972) to TM (1989)
And TM (1989) to ETM (1999) for Water & Shrimp farm.…………...74
Figure 5.29: The Graph shows Change detection and comparison
between MSS (1972) to ETM (1999) using
CROSSTAB Time Series Analysis (Water and Shrimp Farm)……………..74
Figure 5.30: Change detection and comparison result
between MSS (1972) to TM (1989) and TM (1989) to ETM (1999) using
CROSSTAB Time Series Analysis for MaxLike Hard Classifiers…………..75
Figure 5.31: Graph shows Change detection and comparison result
between MSS (1972) to TM (1989) using CROSSTAB
Time Series Analysis for MaxLike Hard Classifiers………………………..75
Figure 5.32: Graph shows Change detection and comparison result
between TM (1989) to ETM (1999) using CROSSTAB
Time Series Analysis for MaxLike Hard Classifiers………………………..76
xi
LIST OF TABLES
Number Page
Table 1.1 Characteristics of different sensors for visible regions……………...…4
Table-2.1 Shows the extreme and average temperature,
wind velocity and sunshine duration of Cox's Bazar & Relative
Humidity and evaporation of Chittagong..…………………..... . .......10
Table-2.2 Shows the extreme and average yearly
Rain Fall of Cox's Bazar district..……………………………....…...11
Table-2.3 Shows the extreme and average Monthly Rain
Fall and percentage of Cox's Bazar district..………………... ……....12
Table-2.4 Showing average Air temperature (°C) in Chakoria ................ ……....13
Table-2.5 Shows the extreme and average ionic concentrations
in sea water Cox's Bazar district………………………………… ...15
Table-4.1 Shows the data acquisition and data analysis process………………39
Table-4.2 Landsat MSS bands…………..……………………………………42
Table-4.3 Landsat TM bands…………………………………………….…...42
Table-4.4 IRS Sensors….…………………………………………………….43
1
Chapter 1
INTRODUCTION
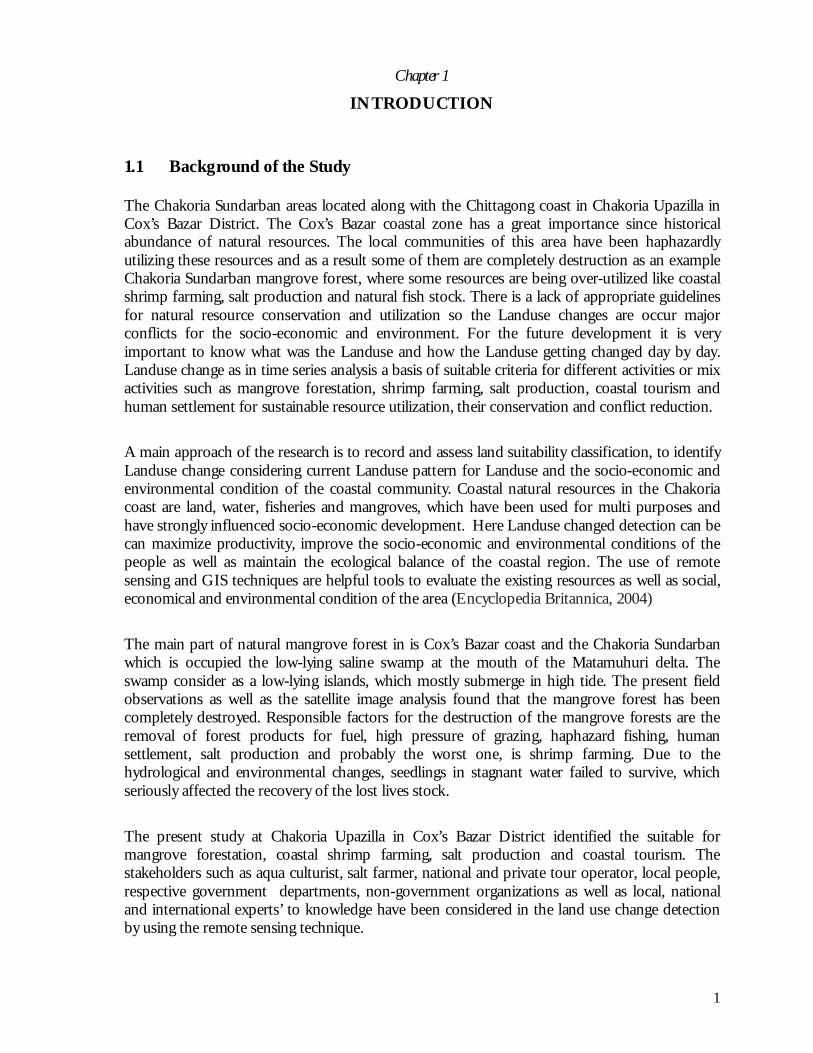
1.1 Background of the Study The Chakoria Sundarban areas located along with the Chittagong coast in Chakoria Upazilla in Cox’s Bazar District. The Cox’s Bazar coastal zone has a great importance since historical abundance of natural resources. The local communities of this area have been haphazardly utilizing these resources and as a result some of them are completely destruction as an example Chakoria Sundarban mangrove forest, where some resources are being over-utilized like coastal shrimp farming, salt production and natural fish stock. There is a lack of appropriate guidelines for natural resource conservation and utilization so the Landuse changes are occur major conflicts for the socio-economic and environment. For the future development it is very important to know what was the Landuse and how the Landuse getting changed day by day. Landuse change as in time series analysis a basis of suitable criteria for different activities or mix activities such as mangrove forestation, shrimp farming, salt production, coastal tourism and human settlement for sustainable resource utilization, their conservation and conflict reduction.
A main approach of the research is to record and assess land suitability classification, to identify Landuse change considering current Landuse pattern for Landuse and the socio-economic and environmental condition of the coastal community. Coastal natural resources in the Chakoria coast are land, water, fisheries and mangroves, which have been used for multi purposes and have strongly influenced socio-economic development. Here Landuse changed detection can be can maximize productivity, improve the socio-economic and environmental conditions of the people as well as maintain the ecological balance of the coastal region. The use of remote sensing and GIS techniques are helpful tools to evaluate the existing resources as well as social, economical and environmental condition of the area (Encyclopedia Britannica, 2004)
The main part of natural mangrove forest in is Cox’s Bazar coast and the Chakoria Sundarban which is occupied the low-lying saline swamp at the mouth of the Matamuhuri delta. The swamp consider as a low-lying islands, which mostly submerge in high tide. The present field observations as well as the satellite image analysis found that the mangrove forest has been completely destroyed. Responsible factors for the destruction of the mangrove forests are the removal of forest products for fuel, high pressure of grazing, haphazard fishing, human settlement, salt production and probably the worst one, is shrimp farming. Due to the hydrological and environmental changes, seedlings in stagnant water failed to survive, which seriously affected the recovery of the lost lives stock.
The present study at Chakoria Upazilla in Cox’s Bazar District identified the suitable for mangrove forestation, coastal shrimp farming, salt production and coastal tourism. The stakeholders such as aqua culturist, salt farmer, national and private tour operator, local people, respective government departments, non-government organizations as well as local, national and international experts’ to knowledge have been considered in the land use change detection by using the remote sensing technique.

2
1.2 Statement of the problems Chakoria Sundarban area was a mangrove forest of the Matamuhuri delta at Chakoria in Cox's Bazar district. The initial area of the Chakoria Sundarban area was about 18,200 ha and 7,490 ha of land were declared as Reserved Forest and rest of the area was Protected Forest (BBS, 2007). It was a selection system followed to manage the forest area. But it was modified in time to time in order to manage the condition of demand. At one point restrictions were imposed on extraction of forest. But this could not stop the destruction of the forest. In fact, the forest already has been completely destroyed few years back. Most of the mangrove forest area which is close by shrimp ponds has been cleared and some of the area has a few trees standing (Sherman, et. al., 1998).
The entire Chakoria Sundarban is now a barren area all the mangrove forest area is vanished only about 200 healthy trees are left. A number of reasons involve to destruction of this forest such as; (i) fuel-wood; (ii) overgrazing of cattle; (iii) spread of human settlements; (iv) fishing and (v) shrimp culture.
There was project of World Bank between 1977 and 1982 to develop the shrimp farm in Chakoria and this project transferred about 3,000 ha of mangrove forest area for shrimp farming and human settlement. And also the government followed that policy to allowing people to use the reserved forest for shrimp farms and human settlement and encouraged people to cleared forest indiscriminately (World Bank, 2001).
All these reason there is a huge environmental change occurring on this area. For shrimp farming and salt production the area are loosing the ability of cultivation and soil are getting erosion by the tidal effect. So the water levels of the area are getting higher and higher. So on the research statement of problem is, (i) Landuse change in Chakoria Sundarban area, (ii) destruction of mangrove forest, (iii) environmental degradation and (iv) roll of mega investor.
1.3 Research objectives
The objectives of the present research have been set as follows:
Ø To identify the patern of Landuse change of Chakoria Sundarban
Ø To identify the environmental change in Chakoria Sundarban during last 35 years.
Ø Identifying the socio-economic change of the study area.
Ø Suggesting policies and guide lines for sustainable development of Chakoria Sundarban.

3
1.4 Hypothesis to be tested
The general hypotheses which will be tested in this research are the following:
Ø The mangrove forest of Chakoria Sundarban has been totally cleared by human activities
Ø Shrimp & Salt farm has been expanded rapidly.
Ø Socio-economic condition of the people has been changed.
Ø Over all environments has degraded.
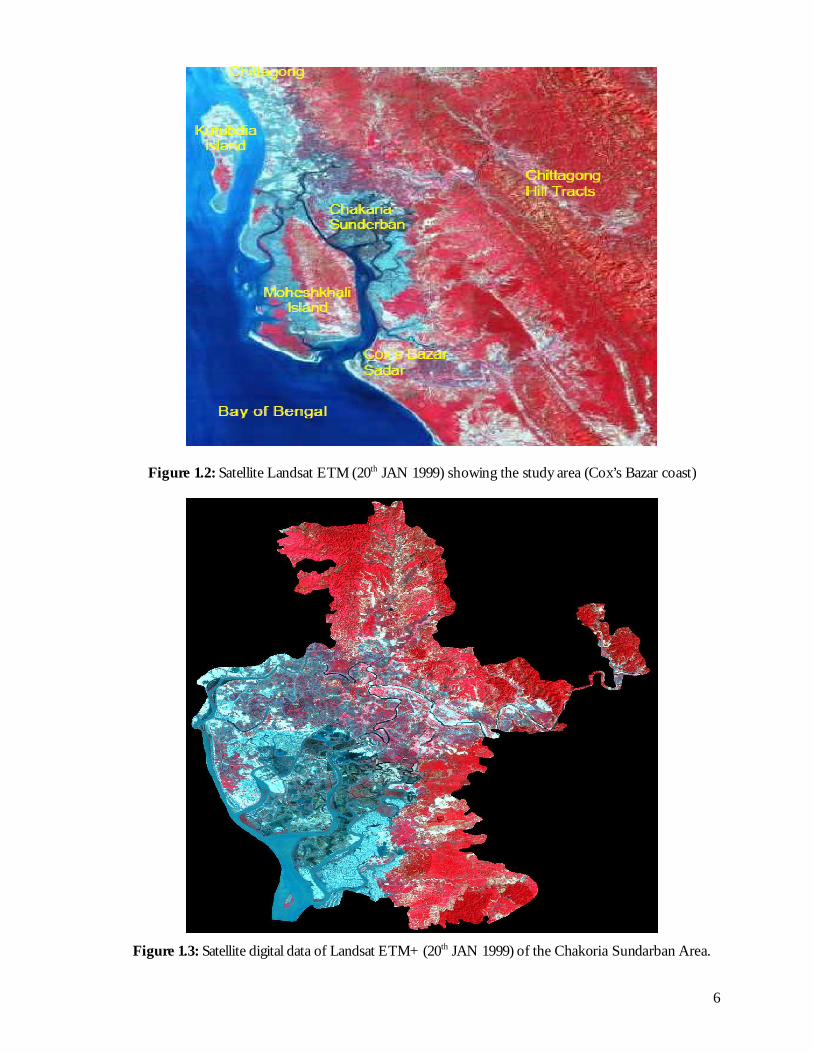
1.5 Data and Materials
Two important and relevant data which have been used in this research are the Survey of Chakoria Sundarban which for socio economic survey of the study area and the raw satellite digital data of Landsat ETM of 20th JAN 1999, Landsat TM of 20th JAN 1989 and Landsat MSS of 20th Jan 1972 of the study area Chakoria Sundarban (Figure 1.2) LGED vector map of Chakoria Sundarban area. The potential usable satellite data are collected by various satellites and organization from Bangladesh such as Landsat ETM, TM and MSS. But the most important factor here is the spectral coverage of the satellites as well as the temporal resolution. As the area coverage is significantly wide so the lower spatial resolution (even up to 1 km) impacts little to view the features of the study area. Moreover by using higher spectral resolution image may be better to separate different features more accurately. For this present research it is very important to examining time series analysis which can be possible by using temporal resolution. The table below is showing the comparative characteristics of the satellite sensors for visible parts. The blue spectrum region of Landsat 7 is the most upper part of the visible area where compare to other satellite sensors (Table 1.1) and the TM channel blue is having spectrum width of 0.45 μm to 0.52 μm found to be the most suitable satellite image. Among all other visible spectrums we can say that the blue has the maximum water penetration capacity which is of up to 20m (Lillesand and Kiefer, 2002) due to its shorter wave length but on the other hand susceptible to back scattering (Rayleigh’s effect) due to the presence of smaller suspended particles. Also, availability of Landsat data is easier and cheaper than all others. As a satellite data of course the better data the MODIS data it has bandwidth which is shorter and much better. The Major problem incorporating MODIS in present research that it’s radiometric resolution of 12 bit, which was unable to be processed due to software limitation. However for main data generation for the present thesis research the data of Landsat ETM, TM and MSS.

4
Table 1.1: Characteristics of different sensors for visible regions
SCANNER SPATIAL RESOLUTIO
N IN METERS
TEMPORAL RESOLUTION IN DAYS
AT EQUATOR
RADIOMETRIC RESOLUTION
IN BIT
ETM (1) 0.45 – 0.515 30 16 8
ETM (2) 0.525 – 0.605 30 16 8 ETM (3) 0.63 – 0.69 30 16 8 IRS (1) 0.52 – 0.59 36.25 24 8 IRS (2) 0.62 – 0.68 36.25 24 8 IRS (3) 0.77 – 0.86 36.25 24 8
SPOT (1) 0.5 – 0.59 20 26 8 SPOT (2) 0.61 – 0.68 20 26 8 SPOT (3) 0.79 – 0.89 20 26 8
AVHRR (1) 0.58 – 0.68 1100 2 10 AVHRR (2) 0.725 – 1.10 1100 2 10 AVHRR (3) 3.55 – 3.93 1100 2 10 MODIS (8) 0.405 – 0.42 1000 2 12 MODIS (9) 0.438 – 0.448 1000 2 12 MODIS (10) 0.483 – 0.493 1000 2 12
Reference: Lillesand and Kiefer, 2002.
SPECTRAL RESOLUTION
IN µm

5
Figure 1.1: The map of Chakoria Sundarban (Source: LGED1, 2008).
1 LGED means Local Government Engineering Department
6
Figure 1.2: Satellite Landsat ETM (20th JAN 1999) showing the study area (Cox’s Bazar coast)
Figure 1.3: Satellite digital data of Landsat ETM+ (20th JAN 1999) of the Chakoria Sundarban Area.
7
1.6 Method used
1.6.1 Introduction
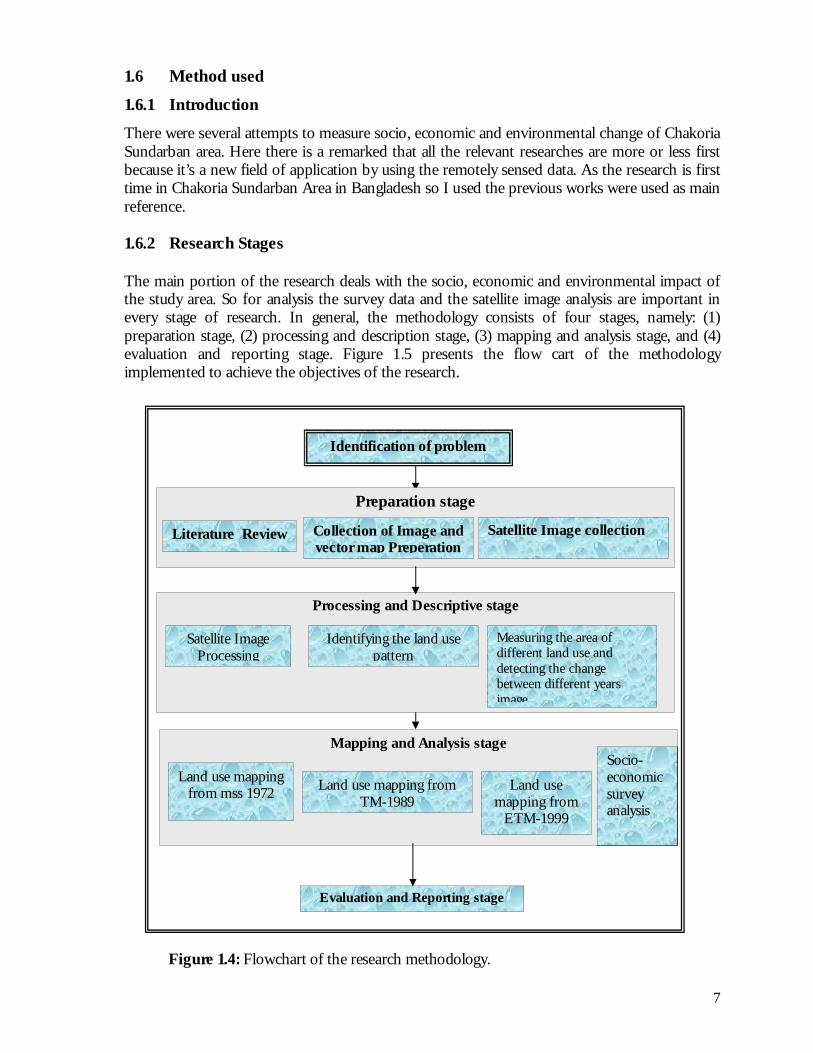
There were several attempts to measure socio, economic and environmental change of Chakoria Sundarban area. Here there is a remarked that all the relevant researches are more or less first because it’s a new field of application by using the remotely sensed data. As the research is first time in Chakoria Sundarban Area in Bangladesh so I used the previous works were used as main reference. 1.6.2 Research Stages The main portion of the research deals with the socio, economic and environmental impact of the study area. So for analysis the survey data and the satellite image analysis are important in every stage of research. In general, the methodology consists of four stages, namely: (1) preparation stage, (2) processing and description stage, (3) mapping and analysis stage, and (4) evaluation and reporting stage. Figure 1.5 presents the flow cart of the methodology implemented to achieve the objectives of the research.
Identification of problem
Preparation stage
Literature Review Collection of Image and vector map Preperation
Satellite Image collection
Processing and Descriptive stage
Satellite Image Processing
Identifying the land use pattern
Measuring the area of different land use and detecting the change between different years image
Mapping and Analysis stage
Land use mapping from mss 1972
Land use mapping from TM-1989
Land use mapping from
ETM-1999
Socio-economic survey analysis
Evaluation and Reporting stage
Figure 1.4: Flowchart of the research methodology.

8
1.6.2.1 Preparation This stage composed of activities such as literature review, proposal finalization, and collection of satellite images and LGED vector map of Chakoria Sundarban area. This stage has done at the laboratory of remote sensing in IDA Linköping University, Sweden. 1.6.2.1(A) Literature review This activity will be continuously and transversally on throughout the entire research process. It includes the bibliographic studies from journals and books concerning the relevant research topic. Literature review can carry out in order to develop the knowledge about the research on scientific and technical aspects. Methodology development for socio, economical and environmental change from the satellite image is the main subject on this stage. After a systematic review of different literature source, some methods for remote sensing were found. 1.6.2.1(B) Collection of the image and LGED map These two elements can be considered as the raw materials of the study area. So the satellite image and LGED map was collected from the relevant authority which is LGED and SPARRSO in Bangladesh. 1.6.2.2 Processing and description stage This stage includes all the stages of processing the satellite image and the survey of socio-economic of the study area. 1.6.2.3 Mapping and analysis stage On this stage I had to do the digitization of the LGED map by using the Cartalinx software. And on the other hand I had to input all the field survey data in the SPSS software system where I did all the analysis for the field survey data and Satellite images analysis on IDRISI Andes software. 1.6.2.4 Evaluation and reporting stage This is the last stage of the research. This stage includes the evaluation of the methods applied in this research and also the evaluation of the used remote sensing images (Landsat ETM) for the study area. This is a comparative study which has been done between the satellite image analysis and the survey of socio-economic impact generated by SPSS. Here the present report, including maps is the final result of this thesis work.

9
Chapter 2
STUDY AREA
2.1 Introduction This chapter deals with the description of the area where this research was conducted. The description includes the geographical location and environmental features of the study area. 2.2 Geographical location The Chakoria Sundarban areas are located along the Chittagong coast in Chakoria Upazilla Cox’s Bazar District. The area is the most extended plain landmass located between 5321 ′° N to
8421 ′° N latitude and 5791° ’E to 590 ′° E latitude. The total area between the Matamuhuri-Harbang Khals is the north; the confluence made Khal at the south, the Cox’s Bazar-Chittagong highway in the east and the Maheskhali Channels in the west, covers about 260 Km2 and has been considered for the present Study. Chakoria is one of the moderately populated areas in the contest of Bangladesh (Fazal et. al., 2001). 2.3 Climate The area has pronounced tropical monsoon climate. There are three main seasons, the monsoon (or rainy)season from June to October which is warm and humid during which about 77 – 80 percent of the total annual rainfall occurs; the winter, from November to February, during which very little rainfall is received and has the lowest temperature and humidity of the year and the pre-monsoon (or hot) season from March to May, which has the highest temperature and evaporation rates of the year and has periodic thunder showers receiving about 381–508 mm of the total annual rainfall (Hussain, 2006). The cyclonic storms originating in the high seas during April-May and October-November associated with tidal wave severally affect the tidal area, when crops, livestock, property and human lives are lost. The climate and rainfall distribution of the area is of tropical nature dominated by the south-west monsoon of the Indian Ocean. There are three distinct seasons: each of which has its characteristics. The warm season lasts from March through May. The highest temperatures of the year occur during this period. About 15% of the annual rainfall occurs during this period mainly as thunder storms often accompanied by strong winds. The humidity is generally high throughout the period.
The monsoon season normally begins in June and continues till October. In an average 75% to 80% of the annual rainfall occur during this period. Minimum temperature exceeds 32.22°C and humidity approaches the saturation point, skies are over cast a large part of the time during the monsoon. Rain storms of several days duration characterized by relatively slow but steady rain occur during this season. Most of the destructive cyclonic storms with wind of more than 75 miles per hour occur during pre-monsoon and post monsoon period, i.e. April-May and November. The cool season extends from November through February and is generally pleasant and comfortable. Rainfall in this season is infrequent. The lowest temperature of the year which vary from 7.23°C to 10°C are recorded in these months and daily maximum are usually below 32.22°C. Skies are generally cloudless during this season. Fog occasionally occurs in the early morning in the later part of the winter season (i.e. January-March) and last for several hours. Visibility is very poor during the period the fog lasts.

10
Table-2.1: - Shows the extreme and average temperature, wind velocity and sunshine duration of Cox's Bazar & Relative Humidity and evaporation of Chittagong.
TABLE – 2.1 CLIMATOLOGICAL DATA CHITTAGONG REGION
Temperature °C of Cox's Bazar
J F M A M J J A S O N D
Heighest 32.8 33.9 37.2 37.2 36.7 40.6 35.0 33.9 33.9 35.0 33.9 31.7
Av. Max 26.4 27.9 30.2 31.8 32.1 30.3 29.6 29.6 30.3 30.7 29.3 26.9
Av. Min 13.8 15.7 19.8 23.4 24.9 24.8 24.8 24.7 24.7 23.6 19.6 15.6
Lowest 7.8 9.4 11.1 16.7 16.7 20.6 21.7 19.4 21.7 17.2 13.3 8.9
Relative Humidity in % of Chittagong
9 A.M. 72 87 70 73 75 82 85 85 83 89 76 77
6 P.M. 65 63 77 73 77 84 86 86 81 81 73 69
Average wind velicity of Cox's Bazar
km / h 3.3 4.5 5.6 7.6 8.0 8.4 9.3 8.2 6.0 3.9 2.8 2.6
mi / h 2.1 2.8 3.5 4.7 5.0 5.2 5.8 5.1 3.7 2.4 1.8 1.6
Sunshine Duration of Cox's Bazar
Hours of Bright sunshine 9.4 9.7 9.3 9.5 8.1 4.0 4.1 4.3 5.9 6.5 9.6 8.5
Day Length
(Hours) 11.0 11.5 12.0 12.7 13.2 13.4 13.3 12.9 12.3 11.7 11.2 10.9
Sunshine as % of day length 85 84 78 75 61 30 31 33 48 56 86 78
Relative Humidity of Cox's Bazar
9 A.M. 77 74 77 78 80 86 89 89 86 82 80 81
6 P.M.
Mean Monthly Evaporation in mm of Chittagong
Annual1432.5 88.2 103.8 131.5 160.6 163.8 127.9 137.5 130.0 105.9 104.6 94.8 83.9
Source: BMD2, 2002.
2 BMD means Bangladesh Meteorological Department

11
2.3.1 Rainfall
In the present observation, the rainfall maximum was recorded as 38.47 m.m. in June, 1982 at Chakoria. Where as the rainfall were noted as 0.1 m.m and 0.16 m.m in October, 1982 at Chakoria.
Table-2.2: - Shows the extreme and average yearly Rain Fall of Cox's Bazar district.
TABLE – 2.2 MONTHLY & ANNUAL RAINFALL
STATION: COX’S BAZAR (M.M.)
YEAR JAN FEB MAR APR MAY JUN JLY AUG SEP OCT NOV DEC ANNUAL
1967 58.0 0 2.0 135.1 80.8 715.3 1168.6 935.7 924.1 275.4 0 0 4295.0
1968 39.6 37.9 7.3 64.7 338.5 1078.2 902.3 971.7 201.0 276.4 2.8 0 3920.4
1969 0 0 74.7 91.9 113.1 945.4 1361.3 1187.5 459.2 123.1 20.1 0 4376.3
1970 0 38.1 0 64.7 431 9 584.3 1470.7 709.8 393.5 402.2 63.8 0 4159.0
1971 3.3 0.2 0.8 7.7 48.5 1315.4 1550.4 845.3 176.0 186.8 191.8 0 4326.2
1972 0 4.3 0 88.6 109.0 286.7 325.4 814.5 108.1 176.3 0.5 0 1913.4
1973 2.5 4.1 1.5 13.5 518.6 819.6 875.9 462.9 364.3 275.7 250.6 21.9 3611.1
1974 2.8 0 155.4 74.7 479.8 1178.2 1294.9 790.3 252.4 115.2 88.0 0 4431.7
1975 0 25.4 0 9.7 253.3 476.7 1792.9 446.2 280.0 684.0 354.3 0 4322.5
1976 0 0 0 107.5 252.1 887.2 1791.1 675.6 58.3 234.4 274.1 0 4280.3
1977 0 21.6 0 607.0 335.0 933.3 1097.6 647.8 237.3 24.1 52.8 30.5 3987.0
1978 0 0 0 107.6 480.6 885.0 533.8 571.9 477.5 186.1 0 0 3242.5
1979; 0 0 0 14.0 94.7 214.6 - - - - - - -
1980 - - - 383.3 1038.6 674.4 1046.2 249.2 318.0 0 0 30.2 -
1981 30.2 2.03 39.6 196.1 271.8 641.9 818.9 471.2 417.6 60.5 10.9 29.7 2990.4
Max 58.0 38.1 155.4 607.0 1038.6 1315.4 1792.9 1187.5 924.1 684.0 354.3 30.5 4431.7
Mean 9.7 9.5 20.1 132.9 323.1 775.7 1145.0 698.5 333.4 215.7 93.6 8.0 3765.2
Min 0 0 0 7.7 48.5 214.6 325.4 249.2 58.3 0 0 0 1913.4
19 15 44 168 254 309 436 249 212 174 122 13 735
Source: BMD, 2002.
12
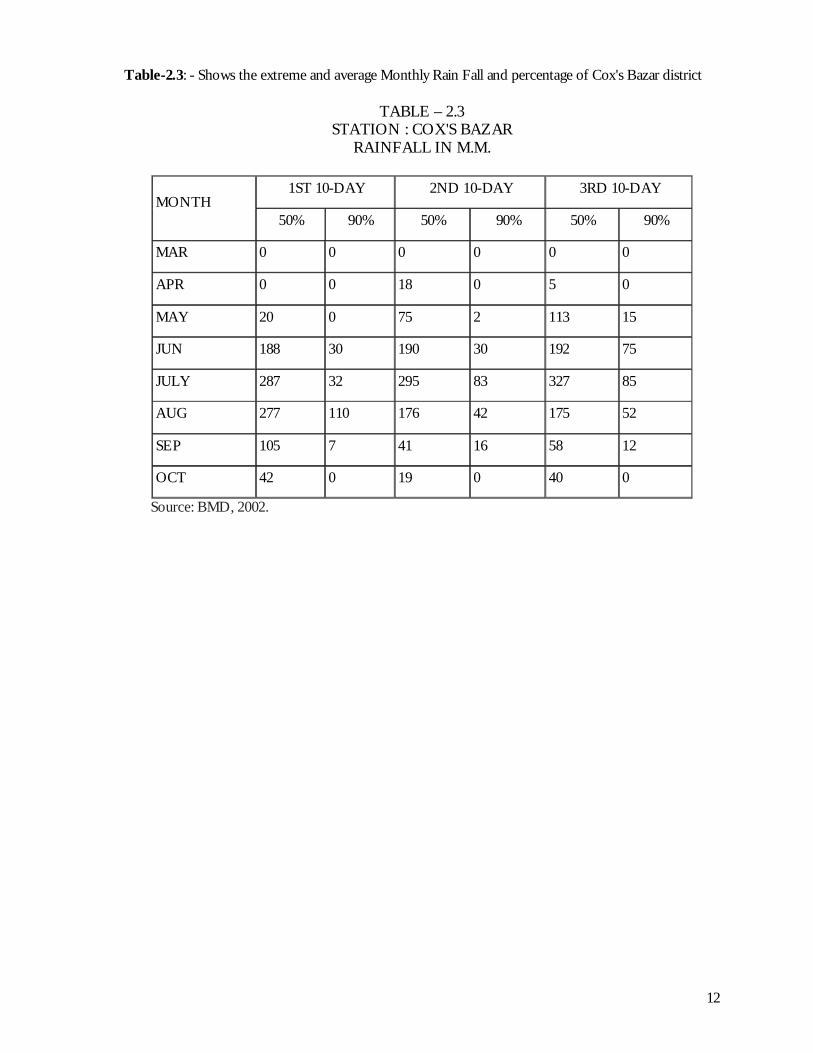
Table-2.3: - Shows the extreme and average Monthly Rain Fall and percentage of Cox's Bazar district
TABLE – 2.3 STATION : COX'S BAZAR
RAINFALL IN M.M.
1ST 10-DAY 2ND 10-DAY 3RD 10-DAY MONTH
50% 90% 50% 90% 50% 90%
MAR 0 0 0 0 0 0
APR 0 0 18 0 5 0
MAY 20 0 75 2 113 15
JUN 188 30 190 30 192 75
JULY 287 32 295 83 327 85
AUG 277 110 176 42 175 52
SEP 105 7 41 16 58 12
OCT 42 0 19 0 40 0
Source: BMD, 2002.

13
2.3.2 Temperature The temperature is generally regarded as one of the important factors in aquatic biology (Ali, 1980). In all the investigated areas the average air temperature was observed always higher than average water temperature and a close parallel relationship existed. Thus the water temperature and air temperature was found to go hand in hand. So, the present study showed that the water temperature in these areas was mainly influenced by air temperature.
Table-2.4: Showing average Air temperature (°C) in Chakoria
AREA CHAKORIA
MONTH RIVER FISHPONDS AVERAGE
MAY(1982) 30.78 30.83 30.81
JUNE 29.11 29.78 29.45
JULY 28.75 29.8 29.28
AUGUST 25.01 21.78 23.40
SEPTEMBER 29.93 32.73 31.33
OCTOBER 28.53 30.93 29.73
NOVEMBER 27.59 27.36 27.48
DECEMBER 22.16 21.18 21.67
JANUARY (1983) 21.2 19.47 20.34
FEBRUARY 22.8 25.1 23.95
MARCH 26.21 25.27 25.74
APRIL 28.41 29.36 28.89
MAY 30.18 32.01 31.07
JUNE 29.64 28.53 29.09
Source: BMD, 2002.

14
Figure 2.1: The vector map of Chakoria Sundarban Union Areas (Source: LGED, 2008) 2.3.3 Salinity The Bay of Bengal is the source of salinity in the coastal area of Bangladesh. During every high tide the saline water from the Bay enters into the closest area and mixes with the upland flow. Turbulent diffusion of this salinity travels going towards up stream with decreasing the concentration. At every section of an estuary, salinity varies with the state of tide and also with the up land flow. Bangladesh has a monsoon climate. The upland river flow has a distinct seasonal pattern. The upland flow increases start from June to reach the peak in August/September and decreases from October. With this variation of fresh water flow salinity varies sequentially. Salinity front of a particular concentration starts moving up streams from October and starts moving towards sea during June. The Ocean water has salinity of 35 parts per thousand whereas in the Bay of Bengal close to Bangladesh coast it is 30–32 parts per thousand. This is due to the sweet water by the three big rivers. It has been found that the relative chemical composition of Sea water is essentially constant. The ionic concentrations in sea water are Chloride, Sodium, Sulfate, Magnesium, Calcium and Potassium in that order. Many other ionic constituents are present, but in smaller or trace concentration. The total dissolved solid contents of most sea water average about 34,500 PPM (Chowdhury, 2001).

15
Figure 2.2: The vector map represents Deep Salinity and Low Salinity Area in COX’S Bazar.
Table-2.5: - Shows the extreme and average ionic concentrations in sea water Cox's Bazar district In terms of percentage they stand as follows:
Sl.No. Name of ions Constitution in terms of percent
1. Chloride 55.04
2. Sodium 30.61
3. Sulfate 7.68
4. Potassium 1.10
5. Magnesium 3.69
6. Calcium 1.16
7. Strontium 0.04
8. Bi-Carbonate 0.41
9. Boric Acid 0.07
Total: 99.8
Source: DoF3, 2002.
3 DoF means Department of Fisheries

16
Among the various units of measuring salinity the following are more popular.
(1) Total Dissolved Solids
(TDS) in PPM
(2) Chloride in PPM
(3) Electrical conductivity in micro mhos/ at
25°C.
Of these TDS is difficult to evaluate. Chloride can easily to determine by titrating a known quantity of water sample by AgNo3, solution of known strength. Electrical conductivity meters with temperature compensation arrangement are easy means for field measurement of salinity. For sea water the relation ship between the three units are as follows: 1. Salinity in PPM = 0.64×E.C.M Mhos. 2. Salinity in PPM = 30+1.805 Chlorinity (PPM)
Figure 2.3: The curve shows the increasing amounts salinity in the soil in Chakoria Sundarban. Source: DoF, 2002.

17
2.3.4 Wind Only a few stations in Bangladesh have the data for wind records. Chittagong has 25% calm period which means very windy weather. The prevailing wind direction is north-east. The coastal areas of Chittagong have 15% calm (very windy due to exposure) with south east winds blowing almost parallel to the coast line. In the monsoon season which is June to October in Bangladesh the windiest region is Chittagong, COX’S Bazar (Chakoria) with 15% calm and prevailing wind parallel to the shore line. It is a south east wind with some southerlies. The wind field appears to be the same as that of the previous period. 2.3.5 Tide The tide along Bangladesh coast originates from the Indian Ocean and it travels through the depth of Bay of Bengal and arrives at Hiron point and Cox's Bazar at about the same time. These two points are being practically at the heads of the submarine canyons i.e. swatch of no ground and Burma trench. The tide in the Bangladesh coast is semi-diurnal with slight diurnal inequality. In the extensive shallow areas in the north-eastern corner of the bay, the tidal range increases due to partial reflection. The rising limb of the tide curve become steeper and under some circumstances moving hydraulic jumps locally known as tidal bore may occur. As the tidal wave travels along inland rivers, the frictional force causes gradual decay in the tide. This process is further accelerated by the upland flow. The horizontal tide i.e. reversal of flow direction due to tide is felt in the low water season as far up as Bardia on the Gorai, the confluence of lower Kumar with the Arial Khan, Lohajang on the Padma etc. the back water effect of this tide is felt further up stream. The tides from the deeper part of the Bay of Bengal enter into the continental shelf through the two submarine canyons. The ranges of the tides at the tip of these two canyons i.e. Hiron point and Cox's Bazar being about, 10 feet during the spring tides of the equinoxes (Ahmed, 1999). 2.3.6 Water Level In order to asses the fluctuation of tide level round the year, the daily high and low tide has been plotted for the following stations. i. Cox's Bazar, Patenga for the period from April 1981 - March 1982. ii. Chiringa for the period from April 1982 - March 1983. It has to be understood that the actual course of water level changes are within this two points. The effect of spring tide (higher high water and lower low water) and effect of neap tide (Lower high water and higher low water) are also visible (Ahmed, 1995). Examination of hydrograph of Cox's Bazar will show a general rise of sea level by about 2 to 3 ft. during the monsoon. High and Low tides of different frequencies High and Low tides of 50% and 80% probabilities in the area. These levels when considered with topography within the ponds areas will show the possibilities of water exchange with tides. High tide increases from January attains highest value during July to September and then starts falling. Tidal range however is high during lean season i.e. January to June and is comparatively low during July to September. The graph following shows the water level of the study area which during the period of 1972 to 1999 year.

18
Figure 2.4: The curve shows the water level of the Chakoria Sundarban. Source: DoF, 2002. 2.4 Geology and Physiographic The tidal area is entirely underlain by sedimentary deposits in recent age. The overall pattern is a large area of estuarine floodplain which is in the east and a large area of tidal floodplain in the southwest. A description of the different physiographic unit within the area is presented here. Old Meghna river Estuarine Floodplain; this comprises an almost level landscape, with little different in elevation between the broad ridges and basins, Flooding is shallow in the east, becoming deep towards the west and is tidally influenced in the extreme south. The sediments are predominantly high salty and stratified the area with clays in some basins. The landscape differs marked from those of both river and tidal floodplains. There are a few small rivers in the unit Most of the drainage is provided by man made canal. It is smoother and lacks of the abandoned channels of river meander floodplains and it lacks the frequent tidal creeks of a tidal floodplain (Khan, 1991).
2.4.1 Ganges Tidal Floodplain
This area has a lower relief and crossed by innumerable tidal rivers and creeks. The sediments are mainly no calcareous clays but they become more salty in the east and usually have a buried peat laver in the west. The rivers are saline throughout the year in most of Khulna district. In Patuakhali district, they are mainly fresh in the monsoon season but become saline
19
in the dry season. In the north of Patuakhali district and in Bakerganj (Barisal) district, they remain fresh throughout the year (except on the east coast of Bhola Island). Seasonal flooding is mainly shallow and by fresh river water or rain water, except at high spring tides and during cyclonic storm surges in the extreme south and east. 2.4.2 Sundarban The Khulna Sundarban are part of the Ganges tidal floodplain which as remained under mangrove forest. The area is affected by tidal salt water flooding for most or all of the year. The Chakoria Sundarban occupies tidal flats at the mouth of the Matamuhuri River in Chittagong district. 2.4.3 Chittagong Coastal Plain This includes the generally narrow strip of land between the Chittagong hills and the sea, together with the Halda, lower Karnaphuli and lower Sangu river floodplains, and the greater part of the off-shore islands. That consists of gently sloping, mainly loamy, alluvial flats adjoining the hills and extensive level clay plains adjoining the three main rivers. Tidal clay plains absorb most of the off-shore islands in the south. Most of the area is subject to shallow Flooding and to flash flood from the hills. It is also exposed to cyclones (Khan & Mia, 1984).

20
2.5 Vegetation and Land Use The present land use in the area is mainly determined by the depth and duration of seasonal flooding and the availability of soil moisture in the dry season, the effect of salinity, the topography and also by the local agricultural practices. Depending on the depth of monsoon season flooding and the availability of dry season irrigation, rice can be grown in Aus, Aman and Boro seasons. When the land is only shallow flooded or water can be kept on the land by small bunds, farmers grow Aus paddy followed by transplanted Aman. If sufficient dry season soil moisture is available a second or a third dry land crops can be raised. In the moderately saline areas, a single crop of transplanted Aman can be grown whereas; in saline and toxic soils only mangrove forests. Chakoria Sundarban which is almost level swamps crossed by many tidal creeks are tidally flooded with salt water, except where embanked and reclaimed. This area is under mangrove forest and the reclaimed land is mainly used for salt production in the dry season, through out the year is shrimp farm is the main Landuse of the study area. The important vegetation is Bain, Keora, Sundri, Gewa, Goran etc.
Figure 2.5: The charts showing the average Landuse type in each and every union in Chakoria Upazila.

21
2.6 Cultural Practices in Chakoria Sundarban Area
The area of Chakoria Sundarban is within the delta of Matamuhuri River. In response to the increased public demand some 1900 ha of forest land has been leased out to 40 private parties. After obtaining the lease from the forest department these private parties they constructed the shrimp farm and salt production farm by cutting the mangrove forest. There is general misconception that Chakoria Sundarban areas are being cleared by public for developing shrimp fisheries. This is possibly not the case.
For whatever reasons, Chakoria Sundarban forest started deterioration long back and the land as a forest land was not producing its expected yield. Since, the land was lying fallow, some enthusiastic fishery entrepreneurs managed to obtain the lease through fishery department.
Either of the following two reasons or a combination of the two caused destruction of the forest.
i. Because of high demand of fire wood, for salt production in the past, indiscriminate falling of trees caused ultimate destruction of the forest to its present state. Since most of the area is above the general tide level during dry season, when the salinity is optimum the area is not suitable for a natural habitat of shrimp.
ii. With the gradual deposition of silt, the land elevation became higher and higher so that land is flooded only during monsoon and the water being comparatively sweet during this season, is not favorable for sustaining mangrove forest.
The Matamuhuri basin and the Cox's Bazar area is characterised by the higher rainfall intensities. Fresh flood in the Matamuhuri River causes sudden drop down of the salinity which restrict the proper growth of the shrimp. At that time the mortality rate is also high (Safiuddin and Karim, 2003).
2.7 Shrimp Culture in Rotation with Salt
Shrimp culture is relatively new introduction in Chittagong district. At present, it is located around Cox's Bazar area, from Bashkhali South to Teknaf, Moheskhali Island and in Chakoria Sundarban area. Most of the shrimp culture is taking place on salt drying bed during the monsoon season (May to December) when salt production is not possible. Salt production was once widely practiced in the Coastal region but now is mostly in the central area of Chittagong district. For salt cultivation pond is erected in tidally inundated land with small embankment and the salt water is introduced in the pond during dry season where it is evaporated by sun-shine and the crude salt is produced. Some polders in the tidal lands are at present also being used for salt production.
22
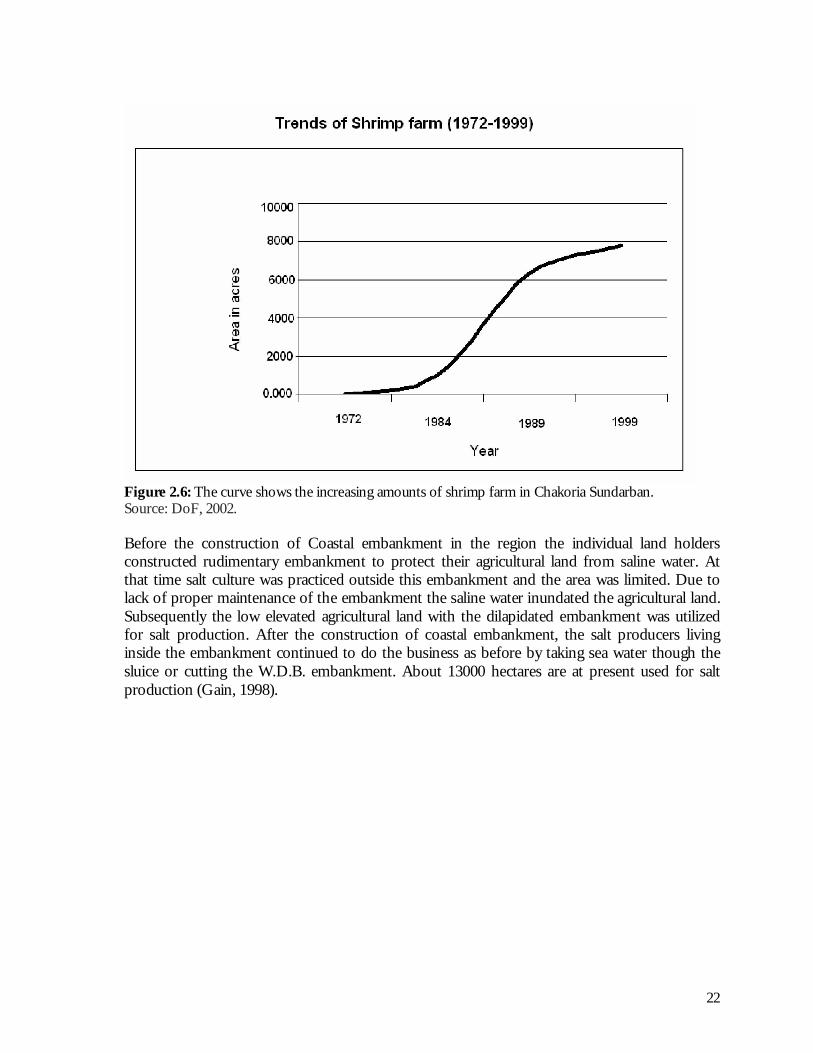
Figure 2.6: The curve shows the increasing amounts of shrimp farm in Chakoria Sundarban. Source: DoF, 2002.
Before the construction of Coastal embankment in the region the individual land holders constructed rudimentary embankment to protect their agricultural land from saline water. At that time salt culture was practiced outside this embankment and the area was limited. Due to lack of proper maintenance of the embankment the saline water inundated the agricultural land. Subsequently the low elevated agricultural land with the dilapidated embankment was utilized for salt production. After the construction of coastal embankment, the salt producers living inside the embankment continued to do the business as before by taking sea water though the sluice or cutting the W.D.B. embankment. About 13000 hectares are at present used for salt production (Gain, 1998).
23
Chapter 3
REVIEW OF LITERATURE AND CONCEPTUAL BACKGROUND
3.1 Introduction This chapter has explored the literature related to the research study. Different books, journal articles reports were investigated to conceptualize and explore knowledge gap in the study of environmental change, monitor, mapping, impact management and standardize the analysis of research at local context. 3.2 Environment An environment is a complex of external factors that acts on a system and determines its course and form of existence. An environment may be thought of as a superset, of which the given system is a subset. An environment may have one or more parameters, physical or otherwise. The environment of a given system must necessarily interact with that system. Generally, the environment or milieu of some object or action consists of the substances, circumstances, objects or conditions by which it is surrounded or in which it occurs. (Although the two terms are usually synonyms, some scientists prefer the less common milieu to avoid confusion with the more well-known meanings of environment in ecology, politics, and sociology.)
In biology, Environment may be defined as the complex of climatic, biotic and social factors that acts upon an organism and determines its form and survival. That’s why its includes everything that may directly affect the metabolism or behavior of a living organism or species, including light, air, water, soil and other living beings.
3.2.1 Natural environment
The Natural environment comprises all living and non-living things that occur naturally on Earth. In the purist sense, as in environment that is not the result of human activity or intervention. The natural environment exists in contrast the term, "the built environment."
For some reason, there is some difficulty within the term "natural environment" in that most natural environments have been directly or indirectly influenced by humans at some point of time. In order to address this concern, some level of human influence is thus allowable without the status of any particular landscape ceasing to be "natural." The term's meaning, however, is usually dependent more on context than a set definition. Many natural environments are the product of the interaction between nature and humans. For this reason, the term ecosystem has been used to describe an environment that contains nature and includes people. It follows then that environmental problems are human or social problems. Some also consider it dangerously misleading to regard "environment" as separate from "people."
Le, Xuan Sinh (1994) analyze regarding a result of increased population growth, the attraction of high profits from shrimp culture and ineffective mangrove forest management, a number of serious environmental problems exist in Ngoc Hien District, Minh Hai Province in Vietnam. These environmental problems are highlighted in this article.

24
Dr. V. N. Sharma, Jafrullah Mohammed, Srinivas Uppuluri (2003) Describes GIS is a readily available spatial analysis tool which gives unique and unparalleled insights into the natural and man made environments due to its strength to link the "generic information" with its "location". GIS is a powerful tool which is not only analyses the present environmental scenario but also helps in projecting for the future, in other words, one can effectively use the GIS tool for past, present and future studies on environment and its protection for the generations to come in future.
The few examples where GIS can be effectively used are in Environmental planning, Ground water contamination, Fresh water and sea water interface, Water quality, Solid waste and Waste water management, Air & Water pollution, Natural Hazards and their mitigation etc. This paper primarily focuses on the application of GIS in different environmental scenarios in brief and the merits and constraints.
T. Saravanapavan and Dennis G. Dye (1995)suggests that a remote sensing contextual analysis method can be successfully used for estimating and mapping air temperature, soil moisture conditions and atmospheric humidity at regional-to-global scales. And here on the Report validations, however, have so far been limited to only mid-latitude temperate in the environments. They examine the robustness of the method in an application to sites in the seasonally humid tropical environment in Thailand. Their initial analysis focuses on the air temperature variable and employs 10-day composites of 1 km resolution normalized different vegetation index (NDVI) data from the NOAA Advanced Very High Resolution Radiometer (A VHRR). For most sites the satellite estimates the air temperature with surface data, confirming the method can be successfully applied in a seasonally moist tropical environment. Because of the using 10 days of composite NDVI data may not adequately represent the daily variations in temperature; So the research anticipate that the improved results might come when the method is going to apply at the daily time scale.
3.2.2 Environmental Change
Environmental change is a major problem of the world. Coastal Environment of Bangladesh has been changed since 1980. Many researchers tried to focus on different issues and aspects of environmental change. The environmental problems associated with shrimp farming in Bangladesh have been widely reported through out the period of 1990s. The extensive farming systems requiring large land areas have contributed most to encroachment of agriculture land and mangrove clearance with increased intrusion of salinity, degradation of land and de-stabilization of coastal eco-systems. The important recent documents that address environmental issues of shrimp farming are: Ghafur et al (1999), Aftabuzzman (1998), Huq and Mainuddin (1999), Datta (2001), Gregow (1997), Deb (1997), Gain (1998), Manju (2000), Bhattacharya et al (1999a), Bhattacharya et al (1999b), Islam (1999) etc. Some of the literatures discuss with environmental impact of shrimp while the others focus on both environmental and social issues. The mainstream literatures argue that shrimp farming in Bangladesh has many negative environmental impacts including salinisation of soil and water, loss of wild and domesticated flora and fauna, mangrove destruction, change in cropping patterns and species composition.
Gregow (1997) critically analyzed the ecological problems created by unplanned shrimp cultivation particularly in the Chakoria Sundarban. The report concluded that the extinction of mangroves in Chakoria Sundarban by introducing shrimp farming was a tragic example of how

25
commercial interest have been allowed to direct the development process, which has led to the destruction of natural resources and deprivation of the marginalized sections of society.
Deb (1997) examines the impacts of unregulated shrimp culture on coastal resources and environment and focuses on loss of bio-diversity, destruction of mangroves, salinity intrusion and danger of importing post-larva. The article mentions that the existing shrimp systems fail to recognize and imitate the natural ecosystem functions and hence give rise to many environmental problems. The practice is regarded as the most obdurate destroyer of mangroves. The pond construction eradicates natural mangrove vegetation; the construction of canals and dikes alters irreversibly the hydrological characteristics of the coastal areas. A large number of immigrating young shrimp and fishes are destroyed before attaining biologically sustainable size due to intensive fishing pressures. Further, targeted shrimp fry collection indiscriminately destroy innumerable other fish species.
Gain (1998) reported on environmental concerns caused by shrimp in Bangladesh. He mentions that the coastal environment, which has already suffered tremendously due to embankments built from 1962 to 1972, was exposed to more risk through unplanned and unscientific shrimp cultivation. The rapid expansion of shrimp farming has drastically reduced the stock of indigenous fish varieties and destroyed many mangrove flora and fauna. Ghafur et al (1999) expressed gave huge concerns about environmental degradation and suggested that shrimp cultivation should be limited to the high salinity zones and part of medium salinity zones, where shrimp cultivation is economically more profitable. Islam et al (1999) studied the impacts of shrimp farming on soil and water quality in some selected areas and the results of the study demonstrated some adverse impact of shrimp farming on soil properties by increasing soil salinity levels (which is up to 500%) in non-saline area that hampered crop cultivation seriously. Water bodies were also found contaminated with high salinity (up to 22 ppt) that does not favour growth of many fresh water organisms. Manju (2000) felt that in shrimp cultivation, the issue of natural equilibrium is not only absent in the production practices, but also absent in the perception of different classes of people engaged in shrimp farming in Bangladesh. The study solicited people's views regarding their environmental problems due to extensive shrimp farming in their localities. The local people identified two most important problems i.e., depletion of fisheries resources and reduction of plants and trees that affect their lives, livelihood and environment. Mohsen Ahadnejad (2000) describes Environmental protection is faced a critical problems due to several factors as the increasing population, demolishing natural resources, environmental pollution, land use planning as well as others. Presently unplanned changes of land use have become a major problem. Most land use changes occur without a clear and logical planning with any attention to their environmental impacts. Major flooding, air pollution in large cities as well as deforestation, urban growth, soil erosion, desertification are all consequences of a mismanaged planning without considering environmental impacts of development planes. Desertification is a common consequence of improper land use change. Many authors have experienced in satellite image analysis for land use mapping as well as change detection studies. Sunarar (1966) has compared the results of five different techniques of band

26
combination, subtraction, band division, principal component analysis and classification in Ekitally in Turkey. This study revealed a better result in case of principal component analysis and comparison of the classification results. Gupta and Parakash (1998) used a combined method of color composite, band subtraction, band division and supervised classification to prepare a land use map for change detection studies in a coal-mining district in India. He concluded that the supervised classification gives a better result for detection changes. Lashkari (1977) has used probability index method and fuzzy to analyses multi-temporal TM imageries for land use changes detection mapping in city of Mashhad. Varasteh Moradi (1996) has employed Mark off Hierarchy to predict land use changes in Gillan Province. At that time the researcher used supervised classification to detect the land use changes occurred in Maragheh region. Furthermore ecological models have also been used to analyze environmental impacts of land use changes in the study area.
3.3 Geoinformatic
Geoinformatic is a shorter name of Geographic Information. Geographic information is created by manipulating geographic (or spatial) data in a computerized system. Systems can include computers and networks, standards and protocols for data use and exchange between users within a range of different applications. Typical applications are land registration, hydrology, cadastre, land evaluation, planning or environmental observation. Geodata comes in many different forms, such as maps or images taken from the air or from space. Geoinformatic is the useful output, produced by analyzing data with a kind of computer program called a "geographic information system", or GIS. The environment in which is operate by GIS (machines, people, networks) is called a "spatial information system", and is designed and created to respond to the strategic spatial information needs of people or organizations (Maguire at al 2005).
3.3.1 GIS
A geographic information system (GIS) is a system for managing data that has a spatial specialized form of an information system. In the strictest sense, it is a computer system capable of assembling, storing, manipulating, and displaying geographically-referenced information in a relational database, i.e. data identified according to their locations. Practitioners also regard the total GIS as including operating personnel and the data that go into the system.
Geographic information systems technology can be used for scientific investigations, resource management and development planning. For example, a GIS might allow emergency planners to easily calculate emergency response times in the event of a natural disaster or a GIS might be used to find wetlands that need protection from pollution.
27
3.3.2 Remote sensing
In the broadest sense, remote sensing is the measurement or acquisition of information of an object or phenomenon, by a recording device that is not in physical or intimate contact with the object.
It is the utilization at a distance (as from aircraft, spacecraft, satellite, or ship) of any device for gathering information about the environment. The technique can make use of devices such as a camera, laser, radar, sonar, seismograph or a gravimeter. Modern remote sensing normally includes digital processes but can be done as well with non-digital methods. While all astronomy could be considered remote sensing (in fact, extremely remote sensing) the term "remote sensing" is normally only applied to terrestrial observations.
Examples of remote sensing are very numerous. For example:
• Topographic maps were often produced from stereographic pairs of aerial photographs. Trained personnel would then trace the shape of the land into maps.
• Earthquakes are located (after the fact) by comparing seismograms taken at different locations; the relative intensity and precise timing yield information about the location and nature.
• Digital elevation maps can be produced by interferometric synthetic aperture radar, a process in which an aircraft, spacecraft or satellite passes over the target area while emitting a series of radar pulses. Combining the data from these pulses yields a detailed map containing information about ground cover and possibly elevation or movement on a scale of centimeters. The data usually covers a many kilometers wide (Gupta and Parakash 1998)
3.4 Deforestation
Deforestation is the conversion of forested areas to non-forest. Historically, this meant conversion to grassland or to its artificial counterpart, grain fields; however, the Industrial Revolution added urbanization and technological use for the new generations (Bhattacharya et al 1999).Generally this removal or destruction of significant areas of forest cover has resulted in a simplified (or degraded) environment with reduced biodiversity. In developing countries, massive deforestation is a leading cause of environmental degradation. The forest is an enormously valuable resource and the loss or degradation of the forest can cause severe and irreparable damage to wildlife habitat and to other economic and ecological services which is provides by the forest. Historically deforestation has accompanied mankind's progress since the Neolithic and has shaped climate and geography.
3.4.1 Causes of deforestation There have some causes which is the major reason for deforestation. Below the research have detail description about the causes of deforestation.

28
3.4.1.1 Environmental effects
Deforestation is one of the major causes of the enhanced greenhouse effect. Trees and other plants remove carbon (in the form of carbon dioxide) from the atmosphere during the process of photosynthesis. Both the decay and burning of wood releases this stored carbon back to the atmosphere.
3.4.1.2 Wildlife
Some forests are rich in biological diversity. Deforestation can cause the destruction of the habitats that support this biological diversity - thus causing population shifts and extinctions.
3.4.1.3 Soil erosion
Deforestation generally increases rates of soil erosion, by increasing the amount of runoff and reducing the protection of the soil from tree litter. Forestry operations themselves also increase erosion through the development of roads and the use of mechanized equipment. China's Loess Plateau was cleared of forest millennia ago (Deb 1997). Since then it has been eroding, creating dramatic incised valleys and providing the sediment that gives the Yellow River its yellow color and that causes the flooding of the river in the lower reaches (hence the river's nick-name 'China's sorrow').
Removal of trees does not always increase erosion rates. In certain regions of southwest US, shrubs and trees have been encroaching on grassland. The trees themselves enhance the loss of grass between tree canopies. The bare inter canopy areas become highly erodible. The US Forest Service in Bandelier National Monument for example, is studying how to restore the former ecosystem and reduce erosion by removing the trees.
3.4.1.4 Landslides
Tree roots bind soil together and act to keep the soil in place. Tree removal on steep slopes increases the risk of landslides.
3.4.1.5 Social change
Some societies are making efforts to stop or slow deforestation. In China, where large scale destruction of forests has occurred, the government has required that every able-bodied citizen between the ages of 11 and 60 plant three to five trees per year or do the equivalent amount of work in other forest services. The government claims that at least 1000 million trees have been planted in China every year since 1982 (Deb 1997). In western countries, increasing consumer demand for wood products that have been produced and harvested in a sustainable manner are causing forest landowners and forest industries to become increasingly accountable for their forest management and timber harvesting practices.
3.4.1.6 Other Causes
Agents of deforestation can be individuals or groups of individuals that are clearing the forest. Commercial farmers slash and burn farmers, cattle ranches and loggers are all agents of deforestation. Agents are usually acting in their own self interest. Causes include demand for
29
farm land and fuel wood. Underlining causes include poverty, lack of land reform. The causes of deforestation are complex and change over time. Deforestation can be most easily be understood by studying the causes for each forest and country separately.
3.4.2 Effect of deforestation
Deforestation can be accompanied by some degree, the gradual reduction of water resources by deforested region; desertification is an extreme result. Forests support considerable biodiversity. Forests are valuable habitat for wildlife. Direct economic benefits accrue from the harvest of forest resources such as wildlife, non-wood products like wild mushrooms, honey and medicinal herbs and from the sale of hunting and camping equipment. Forests also play an important role in watershed protection, soil conservation and the recharge of aquifers. They can also be the source of new drugs (like taxol) (Gyani Babu Juwa, 2000).
Deforestation percolates into the soil where deforested areas become sources of surface water runoff, increasing potential for flooding. Although timber production can be an important cause of deforestation, higher long-term gains can be obtained by managing forest lands to maintain forest cover. Forests are also important stores of organic carbon, and forests can extract carbon dioxide and pollutants from the air. Forests are also valued as a thing of aesthetic beauty and as a cultural resource. Deforestation results in the loss of these benefits.
Gyani Babu Juwa (2000) identified forest in Nepal by using Remote Sensing and Geographical Information System (GIS). He used Landsat TM satellite image. A minimum of 10% canopy closure is often used as criteria for separating forested from non-forested land. Based on satellite image, it was not possible to define a certain canopy closure for limiting forest from non-forest. Therefore, a threshold value of the combination of Landsat bands (NDVI value) was chosen as a proxy. Normalized difference Vegetation Index (NDVI) these holding is applied for separating forested land from non-forested land in the satellite image analysis. NDVI is used to be highly correction with green biomass making it a viable tool for the identification of forest. Rectification and cloud correction are done in the satellite image with the help of photos LRMP land use maps. The methodology used in the Terrain can not be used in the hilly area of the country due to slopes and shades and highly inaccuracy of the available data.
The current study of the woody vegetation cover of Nepal in 1992/1996 was 39.6% of the total area (forest 29% and shrub 10.6%). The result given by the land Resources Mapping Project (LRMP) in 1978/79 was 42.7% (forest 38% and 4.7%). The woody vegetation cover is decreased by 3.1 % within the period of 1978/79 to 1992//1996. The result shown only the different are the proportion of forest in the woody vegetation have declined and the proportion of the bush has increased.
M.Ganzorig, H.Tulgaa, D.Amarsaikhan, B.Enkhtuvshin (2001) describes different airspace experiments for various scientific and economic purposes which have been carried out in Mongolia using remotely sensed data taken from different; platforms and materials of the ground measurements. The investigation of the physical condition of ecosystem in past and present time is one of the urgent tasks of many researchers dealing with earth sciences. Aim in this study is to investigate two different ecosystems in Mongolia to reach the goal of the diverse data where compiled within the ERDAS and ILWIS systems and various RS and GIS techniques was applied.

30
Hideki Saito, Khali Aziz Hamzah and Haruo Sawada (1995) Used SAR images in both wet and dry seasons, as they are available in all-weather. In addition, SAR observes objects with the same energy where we can compare any SAR images that are acquired at different time directly. These characteristics are effective for monitoring a forest in Malaysia that is often covered by cloud and has different condition due to seasons. The purpose of this study was to improve the classification accuracy of forest area in east coast Malaysia using JERS-1 SAR data and Landsat TM data. However SAR data alone is not enough for obtaining good result on forest classification. Therefore the researcher attempted to combine SAR and TM data for the classification. Their results are as follows; (1) The classification accuracy of peat swamp forest, hill forest and grass land are improved, (2) It is effective to use average filtered image of SAR, (3) its also effective to use two SAR data which are acquired in different seasons. Combining TM and SAR data is quite useful for the classification of forest in Malaysia. These results indicate that SAR is closely related to the forest volume and structure of forest in Malaysia. This point must be the subject of future research. 3.4.3 Mangrove
Mangroves are woody trees or shrubs that grow in coastal habitats or mangle (Hogarth, 1999), for which the term mangrove would apply. Mangrove plants occupy shallow water and intertidal zones in tropical and subtropical coastal regions, usually where protected from direct wave action and thus characterized by muddy or fine sediment substrata.
Mangrove habitat is exclusively tropical and tidal, and therefore having soil or sediment that is water-logged and saline or of variable salinity. The Area where mangle occurs includes estuaries and marine shorelines. A wide variety of plant species can be found in mangrove habitat but some 54 species in 20 genera, belonging to 16 families constitute the "true mangroves" - species that occur almost exclusively in mangrove habitats and rarely elsewhere (Hogarth, 1999).
The roots of the mangrove plants stabilize the sand and mud. In areas of the world where mangroves have been removed for development purposes, the coastline has been subject to rapid erosion. They also provide a habitat for wildlife and serve as a natural buffer to strong winds and waves produced by cyclones. In Vietnam, Thailand, Philippine and India, mangrove plantations are grown in coastal regions for this purpose.
Aftabuzzman (1998) emphasizes that mangroves play an important role in ecology of coastal zones and support the marine species that utilize mangrove environment during part or all of their life cycle and appropriate utilization of mangrove resources allows for maintaining high level of integrity in the mangrove area while capitalizing on the economic benefits of brackish water aquaculture. On the other hand, many other studies and reports have shown that with the rapid expansion of shrimp farming, the mangrove ecosystem has been greatly affected (Gain, 1998, Manju, 2000, Islam, 1999, Deb, 1997, Bhattacharya et al, 1999, Gregow, 1997 etc). Gain (1998) mentioned that Chakoria Sundarban used to be a reserve and protect forest managed by the government’s forest department in Cox’s bazar district (southeast coastal region of Bangladesh). In 1985, the government decided to hand over all shrimp cultivable forest land to the Ministry of Land (MoL) and the MoL gave about 7,000 acres of forest land to the Department of Fisheries to start shrimp farming in the mangrove forest and foreign-assisted

31
shrimp farms were set up in the areas. The MoL also leased out forestland to other local entrepreneurs for shrimp cultivation. An ADB report (Sited in Gain, 1998) says about 800 hector of mangrove forest was cleaned to culture brackish water shrimp. A large portion of land (approximately 100,000 hector) now being utilized for shrimp culture in Bangladesh was originally mangrove forest. The cleaning of mangroves in the Chakoria Sundarban under the project has clearly reduced shrimp/fish breeding and nursery grounds in the areas.
Gregow (1997) also reports on disappearance of large amount of Chakoria mangrove forests in Cox's Bazaar largely due to shrimp cultivation and mentions that this has been an example of how shrimp cultivation has caused unprecedented harm to the unique mangrove systems. Unfortunately, this has happened under government-private initiatives with donor's supports. The process of mangrove destruction in Satkhira, Khulna and Bagerhat districts started two decades ago, which was not benefitted both the natural environment, ecosystems and social systems (Deb, 1997 and Manju, 2000).
De Paula Mueller, A.C.; Da Cunha Lana, P. (1986) describe a systematic survey of the Teredinidae (Mollusca, Bivalvia) of the Parana coast (Brazil). The following species have been found, mainly in the mangrove areas: Lyrodus floridanus, Teredo navalis, Teredo bartschi, Teredo mindanensis, Neoteredo reynei, Nausitora fusticula, Bankia rochi, Bankia fimbriatula, Bankia bagidaensis and Bankia gouldi. Keys, descriptions and figures of each species are included.
Untawale, A.G. (1986) describes vast mangrove areas have been degraded to wastelands as a result of deforestation, reclamation and pollution. This has also affected adversely the yield from coastal fisheries. Vast degraded intertidal wetlands can be brought to their pristine glory and high productivity by taking up large scale mangrove a forestation programmed. Recently NIO, Dona Paula Goa, India, undertake a field experiment on mangrove forestation. This booklet describes the common problems generally faced in such programmes and will be useful for forestation.
Badiane, S. (1986) describes the impact of the anti-salt dam of Guides is reported. Emphasis is on the impact to the plant populations. Badiane, S. (1986) analyzed reasons of mangrove degradation in Casamance. They are related to both human and natural factors. The area lost during the last 15 yr can be valued at 25% of the total. The authors recommend ways to maintain the ecosystem and suggest in-depth studies on the mangrove, particularly on its relationship to the fishery.
Dagar, J.C.; Dagar, H.S. (1986) describe the ethno botanical observations with special reference to mangroves and some coastal plants in the life of aborigines of Andaman and Nicobar Islands are discussed. Plants used in taboos and totems, food, canoe-making, fiber, wrapping material or plates, thatching material, timber and fuel, art and craft, fish poison and medicine by the tribal’s have been documented.
Singh, N.T. (1986) describes the nature and properties of soils and donation of vegetation in coastal areas depends upon their elevation with respect to the mean sea level and the tidal amplitude. The east and west coast of India differ from each other in width of coastal plain, elevation, soil types, climate and continental shelf. The Kerala Coast with the maximum length is famous for its back waters and lagoons while Gujarat Coast encompasses the barren Ran

32
and the Kutch Peninsula. The agricultural problems in coastal soils comprise of salinity, sea erosion, soil erosion and cyclones and presence of acid sulphate soils. The dimensions of these problems change with climate, soil, relief and tidal amplitude. Ecological considerations determine important farming systems in coastal soils which comprise of crop-based mixed farming, fish-based farming and farming systems based on mangrove forests. Coastal zone fisheries including open-water aquaculture and capture fisheries play significant role in the economy of the coastal regions of India.
3.5 Land use The relationship between man and land is inseparably closed. That means, land has been the source of mans food, shelter, clothes, etc, that is why, people has been using land in many ways which is changed according to place and time as well as the social and economical needs of people, So I think Man have to know about the land resource and land use in order to meet his own needs. The term Landuse has been attempted to be defined differently from various perspectives by different scholars. Land use has been seen as a product of interactions between a societies cultural back ground, skill, and its physical needs in one hand, and the natural potential of land on the other hand (Rarn and Kolarkar 1993). Landuse is also defined as people’s activities on land which are directly related to land (Clawson and Stewart 1965), (Burley, 1961).
Land cover + land utilization = Landuse.
In that sense we can say it is one of the main conditions, to visualize the development planning of any developed nation. AS a nation we are in the developing group. The barriers of the development are our population and a limited land resource. In this present world, it is obvious to prepare and correct data to fulfill the present needs as well as for the future generation's betterment. Through the long history, it is found that scientists are trying to control land use and to preserve its quality by their research. At different times, different geographers have worked for the Nature in type of land use. Although, the land survey system had been much improve in the ancient Egyptian Nile civilization. The study if Landuse is very important both to the user of the land parcel as well as to understand the environment around. The Landuse pattern of an area changes along with time, according to need. The changes are related to the overall functional demand and physical environmental change. Without knowing the Landuse-changing pattern, it is impossible to make a future development plan for an area or region (Khorram et at. 1991). For the best use of any parcel of land, it is very essential to know the potentiality of that land recourse and the Landuse changing trend of that area. At a more mundane level, interaction occurs between everyday behavior and future Landuse patterns: existing Landuse arrangements in part determine where people live, where they work and how and when they travel there, where they shop, where they play, etc., while such behavior in turn helps to shape future Landuse patterns (Rhind and Hudson, 1980). 3.5.1 Landuse Mapping using Satellite Image In case of identifying Landuse feature, although use of satellite data is known from early seventies, significant works are found to appear mainly the eighties. The increasing number of significant works is due mainly to the availability of increasing higher resolution to satellite borne scanners, particularly, spot and Landsat TM (Khan, 1988). The feature detection capability of the sensors such as resolution and band spread had undergone extensive research and frequently

33
hanged and effectively increased the capability. Since the launching of Landsat-1 (ERTS) in 1972 a lot of works were done on remote sensing application, in the field of geographical, hydrological, geological and agricultural, Landuse detection and analysis, etc. Some of such works could be obtained from the Remote Sensing Manual vol. I & XI (1975, 1985). Various theoretical and applied aspects of remote sensing applications were discussed in the manuals. There are a numbers of renowned journals especially in remote sensing (e. g. Asian- pacific Remote Sensing Journal., Canadian Journal of Remote Sensing, International Journal of Remote Sensing, Photogram metric Engineering and. Remote Sensing, Remote Sensing Quarterly.) These journals regularly publish different theoretical and applied research articles on remote sensing. Here, a, review of some important works done in Bangladesh and the world in context of the present study are presented here, The application of remote sensing technology in Bangladesh began in 1-948 with the availability of aerial photographs taken for cartographic Mapping, forest inventory and water resource studies in 1978 Bangladesh Landsat program (BLP), now known as SPARRSO, they introduced satellite remote sensing technique first time in Bangladesh which is BLP successfully prepared for the Landuse map of St. Martins Island in Bangladesh by using Landsat MSS data and documented as BLP REPORT (1978). The study was to some extent a detail work where the agricultural lands, villages, barren lands and roads were shown. In the same year BLP conducted another Landuse classification study in collaboration with the Geography Department of Dhaka University on Nachole Thana of Rajshahi districts, Bangladesh. This was using aerial photographs and Landsat MSS images. Later on the soil classification map of Nachole was constructed by Bhuiyan (1978) using aerial photographs and Landsat data. In a notice able, work Sharma (1980) identified the Landuse changes and growth of Delhi Metropolitan Area, India, that is for between the years 1972 and 1977. Landsat MSS data of September 1972, November and May 1977 were used in the study. The researcher mainly intended to find out how Landsat MSS data could be used for urban Landuse detection and analysis and whether multi-temporal data could be used to identify urban growth. Some research work of different authors discussed below.
Khan (1988) prepared a land use map of Dhamrai Thana (Dhaka, District), Bangladesh to measure winter rice estate. He used Landsat MSS digital data (bands 4, 5 & 7) of February 1984. The researcher found that 80 meter ground resolution MSS data could be suitably used for broad land or agricultural classification. Thant et. al. (1988) mainly tried to find out the integration of GIS with remotely sensed data for preparing and updating land use maps. For the study they prepare a land use map of Khoku-ku ward of Yokohama city, Japan using Landsat TM FCC (extracted from. barids 2, 3, & 4) of 1984. Here the researchers interpreted the image manually. The result of the study indicated that the identifications of detailed land use classes were limited by the resolution of the TM data (30-m resolution.). The effectively, however, depends largely on the map scale. So for small scale mapping of land use feature Landsat TM data could be used with acceptable dependence as he mentioned. In this study both vector based GIS software ARC/INFO and raster-based GIS software ERDAS were used for GIS operation. The amount of vector-raster conversion error was founded about 1% (except roads). The error was examined on a 1:2500 scale map. Considering the 30-m grid cell sizes, this was 0.3 mm. on a 1 - 100,000 Scale map and it is very close to the accuracy in mapping.
34
Pramanik, M. A. H. & Jabbar, M.A. (1990) the applications of satellite data in the Bangladesh coastal Zone for the identification of geomorphologic changes and the determination of estuarine water circulation. Data from Landsat 4 of 1984 and Metsat (NOAA AVHRR) of 1986/87 were used in the study. For geomorphologic changes, the period, under study was between 1960 and 1984. For estuarine water circulation, Metsat data of 1986/87 were used. Both erosion and accretion are prominent in the study area. North/south water movements can be noticed in the estuarine water circulation. Most erosion on the bay front is probably the result of tide and wave action.
Chowdhury, A.M. et. al. (1990) in this study the temporal rate of deforestation of Chakoria Sundarban situated in the South Eastern Bangladesh along the Coast has been studied using remote sensing techniques. The study has been made using a series of aerial photographs and Landsat imagery supplemented by a number of ground truth verifications Examination of black and white aerial photographs taken in 1981 shows that destructive deforestation has already started whereas study of 1975 aerial photographs did not show this feature. Year wise deterioration of forest cover in combination with expansion of shrimp farms has been shown in graphical form. Gradually shrimp farms were established by replacing mangrove vegetation. Doi (1991) prepared Landuse map of entire Vietnam using remotely sensed data for the first time. He used Landsat TM color images scanned in 1989 and 1990 and interpreted by manual visual interpretation method. The manual interpretation was based largely on personal experience and fieldwork. Also supplemented by supplied forest maps, provincial Landuse maps statistical data etc. In this study the Landuse features were classified into five major classes. That is vegetation, agricultural land, forestland and residential land, specialized land (Rocky Mountains, wet sand, dry sand, ponds & marshes, and unused land) and other land (land for salt production and area for water products). According to Duc Doi, remotely sensed data are undoubtedly useful for land use mapping.
Majumdar et. al. (1991) Studies the Landuse classification of a part of Kamiichi area Japan using visible infrared (IR) and thermal IR data. Five different lands use class’s which are vegetation paddy field, forest, grass, lawn; urban area and bare soil were identified successfully. In addition, higher order classification could also be achieved using visible, IR and thermal IR data of each class of interest. Khan (1992) identified the Landuse changes of Meghna-Dhonaghoda flood control drainage and irrigation project area of Bangladesh which is between 1973 and 1988 using remotely sensed data of Landsat MSS, SPOT PAN Images and color infrared (CIR) aerial photographs were interpreted manually for obtaining Landuse maps of the study area. Five-land use classes vegetation, settlement, cropland, fallow land, waterlogged area and river/channel were detected from manual interpretation by the researcher. In this study modified from (applicable for Bangladesh) Landuse and land cover classification system for use with remote sensing data (Anderson et at. 1976) was use for the land classification scheme. The result of this study was significant and achieved better accuracy.
Madhavan and Khire (1992) prepared land use/land cover maps of the Godavari delta in the eastern coastal part of the Indian peninsula by visual interpretation of X-band synthetic aperture radar (SAR) images and the IRS-1A, LISS-11, FCC (band 2, 3 & 4) of the study area. Basically, it was a comparative study on the utility on images thorn two different techniques which is an

35
interpretation point of view. SAR data were found to be more useful for detail land use/land cover mapping; both the SAR and IRS data used in this study provided the major land use/land-cover information of the study area.
Verma (1993) identified spatial distribution of land use and land-cover patterns in the central Rayong Basin of Thailand in 1986 by visual interpretation and computer assisted analysis of SPOT digital data. SPOT MSS FCC of bands 3, 2, and it was used for visual interpretation and SPOT data retrieved from CCT was processed using image-processing software ERDAS. SPOT FCC interpretation was supplemented by ground truth data. The researcher extracted eight land use/land-cover classes in this study. The computer classification accuracy was 85% and the visual. Accuracy was 73%, which are acceptable for land use/land cover inventories. The researcher experienced that high resolution SPOT HRV data permitted the identification of some features, which are very difficult in case of satellite images. For an example the bush along the canals, shrubs, small trees and roads which is not less than 3m in width. The researcher described SPOT RV data as a very good tool for land use/land-cover mapping.
Jordan, Shi hand Tan (1994) identified the coastal land classification of Bangladesh by using the satellite remote sensing data. IRS-IB LISS-11 digital data was classified using an unsupervised maximum likelihood technique. The coverage area (scan center 22.2002 0 N, 89-8399 0 E) included a portion of the coastal region of Sundarban, Bangladesh. The dry season data of 06 April 1993 ensure a cloud-free image and maximum distinction between agricultural fields (between production seasons) and natural vegetation. The 4 band image was processed with the E1, As ERAS (Earth Resource Application software) system. After that, a vegetation index and land cover map was produced. The NDVI was computed from the images. LISS-11 bands 3 and 4 were used in this index ratio. The result for LISS-11 data indicated relativity high values of NDVI for the tidal swamp and for the cultivated trees along the canal banks. These agree with the high NDVI could be found in fallow fields (between production seasons). Very low NDVI was expected from evergreen trees. Low values of NDVI indicated for some of the rice fields and for the marshland surrounding the small islands. The researcher thought that the low NDVI could be found in fallow field (between production seasons) very low NDVI was found in the water surface within the pixel "foot print" for wet rice fields and marsh. The unsupervised maximum likely hoods technique was used on all four performed based on the published data on the NDVI imaged. General Land\land-cover types distinguished included trees (mangrove species in the in the tidal swamp), monocot trees (alum and included decoct trees palm bamboo species cultivated along the canal banks), agriculture, (nee fields), marsh and water. The researchers were quite satisfied with the result of LISS-11 data for vegetation index mapping and land cover mapping of the study area in Bangladesh. They also observed that is the 36m spatial resolution of IRS-113 LISS-11 is compatible with those of currently available data from Landsat TM and SPOT PAN and they are of-course cost effective.
Chutiratanaphan et. al. (1995) identified and discriminated the Landuse /land cover changes in Phuket islands in Thailand during the years between 1988 and 1993. In this study Landsat TM FCC (3-R. 2-G, I-B) images of 13 December 1988 were used to identify five land use/land-cover classes which is vegetation, built-up area, mangrove forest, shrimp farm , rubber plantation and paddy fields. The use of remote sensing technique has proved to be an appropriate tool in monitoring land use/land cover changes in the study.

36
Nualchawee and Bacareza (1995) prepared a land cover map of the Pa. Wang Phloeng Muang Khoni-Lam National Forest of Thailand using various computers assist classified of Landsat TM digital data scanned on 18 July 1993. The digital analysis was perfumed at the Remote-sensing laboratory at AIT using the ERDAS image processing. PC -based system and CCT was used for data input Based on the field visits to the study area and adopting the US geological survey classification (Anderson, 1967) of 4 land type and software obtained by the digital analysis. The overall classification accuracy divided from supervised classification approach was 80%. Pariyar and Singh (1995) demonstrated a methodology for detecting land use/land cover changes using remote sensing techniques and GIS. On this research the Chitwan district of Nepal was selected for the case study. Landsat TM digital images of 1990 and aerial photographs of 1992 were studies for land use change detection of the study area. Raster based GIS and image processing software ERDAS version 8.0 for the image pre-processing, image enhancement, image analysis and classification of digital images and ARC/INFO version 6.1 for digitizing editing, labeling and edge matching if different maps and production of land use maps were used. A land use classification scheme with 5 land use classes vegetation, cultivated land, forest land, urban land and river bed were successfully identified and the researchers recommended the use of remote sensing data for updating the land use database and for land use planning purpose.
Salem et. al. (1995) detected the current land cover classes of a representative area in the coastal agricultural land of Egypt where change have been observed recently due to the urban planning. The Landsat TM raw data of 15 May 1990 was in band sequential (BSQ) format and all the processing and output images were product by IDRISI software. For the primary inspection and feature identification, the FCC image of the study area was produced from assigning TM-3 to red, TM-2 to green, TM-3 to blue (3-2-1/11-G-13). In the FCC vegetated area appeared on tons of green. For farther different feature in identification Ratio Vegetation Index (RVI), Normalized Difference Vegetation Index (NDVI), Transformed Vegetation Index (TVI), Infrared Index (II) and on linear index Environmental Vegetation Index (EVI) computed from TM bands. Using these five vegetation index, the researchers classified the land use of the study area in six to ten different classes. The result of quantitative and qualitative comparison between these indices indicated that the EVI and the NDVI are the best indices for better expression and to show variation of the study area. The class produced was found to be separable and types and fruit tree types caused by the limitations imposed by the deficiency of crop calendar statistics, mixed cropping of small farm plots, different densities of tree canopies and varying ground moisture conditions. The results demonstrated the land transformation in the area under study. The increase of population was detected as the main cause that influenced the urban expansion which resulted in the transformation of most of the non-agricultural land and considerable parts of the agricultural land to densely habitude urban areas.
Wanpiyarat et. al. (1995) visually interpreted Landsat TM FCC's, band 4-3-2 acquired on 29 May 1989, and band 4-5-3 acquired on 24 September 1991 and of 10 September 1.992 to be used for land use change detection in the coastal area of 340 km in Thailand. The authors aimed to monitor land cover and land use changes especially pertinent mangrove forest and/or paddy to shrimp farm and also estimated shrimp farming area. The methodology included an analysis of temporal Landsat TM images, field verification, polygon overlay and monitoring of land use changes. The hard copy images interpreted by the authors themselves and field verification was

37
carried out to increase the accuracy in interpretation. Land use categories have been distinguished on the FCC's based on differences in color and texture. Those categories are organized as paddy, mixed fruit tree; shrimp farm built-up land, mangrove forest, marshland and others. According to the authors to identify the type of fruit trees from Landsat TM images was not effective without field checking. But shoreline movement and land use change/transformations were successfully detected from the study.
Chowdhury, M. H. (1996) Landuse/land cover mapping and its change monitoring basis a prerequisite for any development planning as well as for resource assessment and management. Landuse features and its change in the rapidly developing district of Gazipur in Bangladesh has been identified, mapped and analyzed using multi dated satellite images and integrated to a data base system to be used for geographical analysis using GIS technology of different types of satellite scanners used, such as Landsat MSS, Landsat TM and SPOT panchromatic. It was possible to detect broad Landuse categories of 5 types. The study covered a period from 1980 to 1996 to identify the land uses of settlement, agricultural land, forest, water bodies and uncovered soil, the features generally considered for analysis in wider regional contest.
Land feature identification and its change detection are very essential to prepare development planning for land resources management and any other regional planning. So, it is essential to find a time add cost-effective technique for land use detection. Remote sensing technique has been proven its effort in this purpose. All the previous Landuse studies in Bangladesh were conducted using low resolution satellite data except Khan (1992) and Jordan et al. (1994) Number of studies were done with Landsat MSS data and the spatial extent of these studies were smaller. Some of the studies identified Landuse features as a by-product of other works. Landuse of wider region such as district label or larger region was not mapped to existing knowledge of the researcher using remotely sensed data in Bangladesh, specially the high resolution satellite data. So the present study is aimed to prepare Landuse map of a rapidly developing area of the country the western Chittagong region using high resolution satellite data Landsat ETM+ and TM. So in this study, it is aimed to assess the applicability of multi date data of different satellite platforms having individual spatial resolution to detect the Landuse pattern and land resource assessment.

38
Charter 4
REMOTE SENSING AND IT’S APPLICATION 4.1 Introduction Remote Sensing is the science and art of obtaining information about an object, area or phenomena through the analysis of data acquired by a device that is not in contact with the object, area or phenomena under investigation. The term "remote sensing" is itself a relatively new addition to the technical dictionary. It was coined by Ms Evelyn Pruitt in the mid-1950 when she (geographer/ oceanographer) was with the U.S. Office of Naval Research (ONR) outside Washington, D.C. In much of remote sensing, the process involves an interaction between incident radiation and the targets of interest. This is exemplified by the use of imaging systems where the following nine elements are involved. Note, however that remote sensing also involves the sensing of emitted energy and the use of non-imaging sensors. The generalized processes and elements involved in electromagnetic remote sensing of earth resources are represented in schematically in Figure 4.1. The two basic processes involved here are data acquisition and data analysis.
Figure 4.1: Electro magnetic Remote Sensing of earth resources Source: Lillesand and Kiefer, 2002.

39
The data acquisition process involves: The data analysis process involves: Ø energy sources Ø propagation of energy through the
atmosphere
Ø energy interactions with the earth surface features
Ø retransmission of the energy through the atmosphere
Ø airborne and/or space borne sensors
Ø generation of sensor data in graphic and/or digital format.
Ø examining the data using various viewing and interpretation devices to analyze pictorial data and/or a computer to analyze digital sensor data
Ø compilation of the information in the form of hard copy, maps and tables or as computer files that can be used for further interpretation
Ø presentation of the information to the users so that they can use it for their decision making process.
Table 4.1: shows the data acquisition and data analysis process. Source: Lillesand and Kiefer, 2002
4.2 The electromagnetic spectrum
Electromagnetic radiation occurs as a continuum of wavelengths and frequencies from short wavelength, high frequency cosmic waves to long wavelength, low frequency radio waves. And this systematic arrangement of these different electromagnetic waves is called electromagnetic spectrum (Figure 4.2). There are several regions of the electromagnetic spectrum which are useful for remote sensing.
Figure 4.2: The electromagnetic spectrum Source: Lillesand and Kiefer, 2002.

40
4.3 Energy interactions with the earth surface features
When electromagnetic energy is incident on any given earth surface feature, three fundamental energy interactions with the feature are possible. This is illustrated in Figure 4.4 for water body. Various fractions of the energy incident on the element are reflected, absorbed, and/or transmitted. Applying the principle of conservation of energy, we can state the interrelationship between these three energy interactions as:
E1 (λ) = ER (λ) + EA (λ) + ET (λ) Where,
E1= Incident energy
ER= Reflected energy
EA= Absorbed energy
ET=Transmitted energy
Figure 4.3: Basic interactions between electromagnetic energy and earth surface feature. Source: Lillesand and Kiefer, 2002. 4.3.1 Interaction with the water bodies Spectral qualities of water bodies are determined by the interaction of several factors, which are: Ø the radiation incident to the water surface Ø optimal properties of water Ø roughness of the surface Ø angles of observation and illumination, and Ø in some extent, reflection of light from the bottom (Figure 4.4)
E1(λ)= Incident energy
E1 (λ) = ER (λ) + EA (λ) + ET (λ)
ER(λ)= Reflected energy

41
Figure 4.4: Major factors influencing spectral characteristics of a water body Source: Campbell, 1996. As the incident light strikes the water surface, some is reflected back to the atmosphere; this reflected radiation carries little information about the water itself. This portion of light can be used to measure the roughness of the surface and therefore, about wind and waves. The spectral properties (i.e., “color”) of the water body are determined largely by energy that is scattered and reflected within the water body itself which is known as volume reflection because it occurs over a range of depths rather than at the surface. Some of this energy is directed back toward the surface, where it again passes through the atmosphere and then is recorded by the sensor (Figure 4.4). This light sometimes known as under light and that is the primary source of color of water body.
4.3.2 Interaction with the vegetation and soil Chlorophyll for example, strongly absorbs energy in the wavelength bands cantered at about 0.45 and 0.67 Am (often called the "chlorophyll absorption bands"). Hence, our eyes perceive healthy vegetation as green in color because of the very high absorption of blue and red energy by plant leaves and the very high reflection of green energy. If a plant is subject to some form of stress that interrupts its normal growth and productivity, it may decrease chlorophyll production. The result is less chlorophyll absorption in the blue and red bands. Often, the red reflectance increases to the point that we see the plant turn yellow (combination of green, red).As we go from the visible to the near-IR portion of the spectrum at about 0.7 Am the reflectance of healthy vegetation increases dramatically. In the range from about 0.7 to 1.3 Am, a plant leaf typically reflects 40 to 50 percent of the energy incident upon it. Most of the remaining energy is transmitted, since absorption in this spectral region in minimal (less than 5 percent). Plant reflectance in the range 0.7 to 1.3 Am results primarily from the internal structure of plant leaves. Because of this structure is highly variable between plant species, reflectance measurements in this range often permit us to discriminate between species, even if they look the same in visible wavelengths. Likewise, many plant stresses alter the reflectance in this region and sensors operating in this range are often used for vegetation stress detection. Also, multiple layers of leaves in a plant canopy provide the opportunity for multiple transmittance and reflectance. Hence, the near-IR reflectance increases with the number of layers of leaves in a canopy, with the reflection maximum achieved at about eight leaf layers (Bauer et al., 1986).

42
4.3.3 Observing the earth’s surface through satellites The earth’s surface features are not unique so to collect data of different earth surface features different types of satellites have been lunched. Some satellites are useful for land, some for weather, some for ice and some for the oceanic and coastal areas. Here in the table shows some satellites images (Landsat MSS bands and Landsat TM bands) their wavelength and their application where we can compare advantages and disadvantages in different satellite images:
Table 4.2: Landsat MSS bands
Channel Wavelength Range (µm)
Applications
Landsat 1,2,3
Landsat 4,5
MSS 4 MSS 1 0.5 – 0.6 (green) Vegetation assessment, useful for the measure -ment of sediment concentrations in water
MSS 5 MSS 2 0.6 - 0.7 (red) Strongly absorbed by chlorophyll; an important band for vegetation discrimination
MSS 6 MSS 3 0.7 - 0.8 (near infrared)
Very strong vegetation reflectance; useful for determining biomass
MSS 7 MSS 4 0.8 - 1.1 (near infrared)
Useful for determining biomass. High land-water contrast so good for determining water bodies and coast lines
Source: Canada Center for Remote Sensing tutorial
Table 4.3: Landsat TM bands
Channel Wavelength Range (µm) Application TM 1 0.45 - 0.52 (blue) soil/vegetation discrimination; bathymetry/
coastal mapping; cultural/urban feature identification
TM 2 0.52-0.60 (green) green vegetation mapping (measures reflectance peak); cultural/urban feature identification
TM 3 0.63 - 0.69 (red) vegetated vs. non-vegetated and plant species discrimination (plant chlorophyll absorption) cultural/urban feature identification
TM 4 0.76 - 0.90 (near IR) identification of plant/vegetation types, health, and biomass content; water body delineation; soil moisture
TM 5 1.55 - 1.75 (short wave IR) sensitive to moisture in soil and vegetation; discriminating snow and cloud-covered areas
TM 6 10.4-12.5 (thermal IR) vegetation stress and soil moisture discrimination related to thermal radiation; thermal mapping (urban, water)
TM 7 2.08 - 2.35 (short wave IR) discrimination of mineral and rock types; sensitive to vegetation moisture content
Source: Canada Center for Remote Sensing tutorial

43
The latest satellite of Landsat series is Landsat ETM+ the new features on Landsat ETM+ are: Ø a panchromatic band with 15m spatial resolution Ø on board, full aperture, 5% absolute radiometric calibration Ø a thermal IR channel with 60m spatial resolution
Data from the ETM+, TM and MSS sensors are used for a wide variety of applications, including resource management, mapping, environmental monitoring and change detection (e.g. monitoring forest clear cutting).
4.4 IRS The Indian Remote Sensing (IRS) satellite series, combines features from both the Landsat MSS/TM sensors and the SPOT HRV sensor. The third satellite in the series, IRS-1C, launched in December, 1995 has three sensors: a single-channel panchromatic (PAN) high resolution camera, a medium resolution four-channel Linear Imaging Self-scanning Sensor (LISS-III) and a coarse resolution two-channel Wide Field Sensor (WiFS). The accompanying table outlines the specific characteristics of each sensor.
Table 4.4: IRS Sensors
Sensor Wavelength Range (µm) Spatial Resolution Swath Width Revisit Period (at equator)
PAN 0.5 - 0.75 5.8 m 70 km 24 days
LISS-II
Green 0.52 - 0.59 23 m 142 km 24 days
Red 0.62 - 0.68 23 m 142 km 24 days
Near IR 0.77 - 0.86 23 m 142 km 24 days
Shortwave IR 1.55 - 1.70 70 m 148 km 24 days
WiFS
Red 0.62 - 0.68 188 m 774 km 5 days
Near IR 0.77 - 0.86 188 m 774 km 5 days
Source: Canada Center for Remote Sensing tutorial
4.5 Application of Remote Sensing 4.5.1 Mapping Mapping constitutes an integrated component of the process of managing land resources and mapped information is the common product of analysis of remotely sensed data. Natural features and manufactured infrastructures, such as transportation networks, urban areas and administrative boundaries can be presented spatially with respect to referenced co-ordinate systems, which may be combined with thematic information. Baseline, thematic and topographic maps are essential for planning, evaluating and monitoring for military or civilian survey or land use management, particularly if digitally integrated into a geographic information system as an information base integrating elevation information is crucial to many applications and is often the key to the potential success of present day mapping programs.

44
Traditionally, information was obtained through surveying and photogrammetric techniques, which have been costly and time consuming, particularly for periodic revision of updated information. Recent advances in computer technology (speed, data handling and storage capability) and a growing demand for digital databases and computer based mapping production capabilities have encouraged the use of remotely sensed information as a data source for cartographic applications (Campbell, J.B., 1996).
There is a growing demand for the utilization of remote sensing data in map production, since the following benefits may be provided: stereo coverage, frequent revisits, timely delivery, wide area coverage, low labour intensity, virtually global coverage and storage in digital format to facilitate subsequent updating and compatibility with current GIS technology.
End users of base maps and mapping products include resource companies (forestry, mining and oil) support and service industries (engineering), utility and infrastructure development agencies (pipelines, telecommunications, transportation and power), government mapping agencies and the military. This diversification from traditionally military users to commercial applications has resulted in a greater demand for a wider range of mapping products with emphasis placed upon the benefits of improved information content and scale and accuracy versus data costs.
Mapping applications of remote sensing include the following:
1. planimetry 2. digital elevation models (DEM's) 3. baseline thematic mapping/topographic mapping
4.5.2 Land Cover & Land Use
Although the terms land cover and Landuse are often used interchangeably, their actual meanings are quite distinct. Land cover refers to the surface cover on the ground, whether vegetation, urban infrastructure, water, bare soil or other. Identifying delineating and mapping land cover is important for global monitoring studies, resource management and planning activities. Identification of land cover establishes the baseline from which monitoring activities (change detection) can be performed and provides the ground cover information for baseline thematic maps.
Land use refers to the purpose the land serves, for example, recreation, wildlife habitat or agriculture. Land use applications involve both baseline mapping and subsequent monitoring, since timely information is required to know what current quantity of land is in what type of use and to identify the land use changes from year to year. This knowledge will help develop strategies to balance conservation, conflicting uses and developmental pressures. Land use studies include the removal or disturbance of productive land, urban encroachment and depletion of forests.
It is important to distinguish the difference between land cover and land use and the information that can be assigned from each. The properties measured with remote sensing techniques relate to land cover from which land use can be contingent and particularly with ancillary data and knowledge.

45
Land cover/use studies are multidisciplinary in nature and the participants involved in such work are numerous, ranging from international wildlife and conservation foundations to government researchers and forestry companies. In addition to facilitating sustainable management of the land, land cover and use information may be used for planning, monitoring, and evaluation of development, industrial activity, or reclamation. Detection of long term changes in land cover may reveal a response to a shift in local or regional climatic conditions, the basis of terrestrial global monitoring (Lo, C.P. and Yeung, A.K.W., 2002).
Land use applications of remote sensing include the following:
• natural resource management • wildlife habitat protection • baseline mapping for GIS input • urban expansion/encroachment • routing and logistics planning for seismic / exploration / resource extraction activities • damage delineation (tornadoes, flooding, volcanic, seismic, fire) • legal boundaries for tax and property evaluation • target detection - identification of landing strips, roads, clearings, bridges, land/water
interface.
4.5.3 Land Use Change (Rural / Urban)
As the Earth's population increases and national economies continue to move away from agriculture based systems, cities will grow and spread. The urbanization often infringes upon viable agricultural or productive forest land, neither of which can resist nor deflect the overwhelming momentum of urbanization. City growth is an indicator of development and generally has a negative impact on the environmental health of a region (Kiefer, 2002).
The change in land use from rural to urban is monitored to estimate populations, predict and plan direction of urbanization for developers and monitor adjacent environmentally sensitive areas or hazards. Also analyzing agricultural vs. urban Landuse is important for ensuring that development does not encroach on valuable agricultural land and to likewise ensure that agriculture is occurring on the most appropriate land and will not degrade due to improper adjacent development or infrastructure.
With multi-temporal analyses, remote sensing gives a unique perspective of how cities change. The key element for mapping rural to urban Landuse change is the ability to discriminate between rural uses (farming, pasture forests) and urban use (residential, commercial and recreational). Remote sensing methods can be employed to classify types of Landuse in a practical, economical and repetitive fashion over large areas (Kiefer, 2002).

46
4.5.4 Forestry Forests are valuable resource providing food, shelter, wildlife habitat, fuel, and daily supplies such as medicinal ingredients and paper. Forests play an important role in balancing the Earth's CO2 supply and exchange, acting as a key link between the atmosphere, lithosphere and hydrosphere. Tropical rainforests in particular house an immense diversity of species, more capable of adapting to and therefore surviving, changing environmental conditions than monoculture forests. This diversity also provides habitat for numerous animal species and it’s an important source of medicinal ingredients. The main issues concerning forest management are depletion due to natural causes (fires and infestations) or human activity (clear-cutting, burning, and land conversion) and monitoring of health and growth for effective commercial exploitation and conservation.
Humans generally consider the products of forests useful, rather than the forests themselves and so extracting wood is a wide-spread and historical practice virtually global in scale. Depletion of forest resources has long term effects on climate, soil conservation, biodiversity and hydrological regimes and that is a vital concern of environmental monitoring activities. Commercial forestry is an important industry throughout the world. With increasing pressure to conserve native and virgin forest areas and unsustainable forestry practices limiting the remaining areas of potential cutting, the companies involved in extracting wood supplies need to be more efficient, economical and aware of sustainable forestry practices. Ensuring that there is a healthy regeneration of trees where forests are extracted will ensure a future for the commercial forestry firms as well as adequate wood supplies to meet the demands of a growing population.
Non-commercial sources of forest depletion include removal for agriculture (pasture and crops), urban development, droughts, desert encroachment, loss of ground water, insect damage, fire and other natural phenomena (disease, typhoons). Forests are burned or clear-cut to facilitate access to and use of the land. International and domestic forestry applications where remote sensing can be utilized include sustainable development, biodiversity, land title and tenure (cadastre), monitoring deforestation, reforestation monitoring and managing, commercial logging operations, shoreline and watershed protection, biophysical monitoring (wildlife habitat assessment) and other environmental concerns.
General forest cover information is valuable to developing countries with limited previous knowledge of their forestry resources. General cover type mapping, shoreline and watershed mapping and monitoring for protection, monitoring of cutting practices and regeneration and forest fire/burn mapping are global needs which are currently being addressed by Canadian and foreign agencies and companies employing remote sensing technology as a part of their information solutions in foreign markets. Forestry applications of remote sensing include the following:

47
4.5.4.1 Reconnaissance mapping: Objectives to be met by national forest/environment agencies include forest cover updating, depletion monitoring, and measuring biophysical properties of forest stands.
• forest cover type discrimination • agroforestry mapping
4.5.4.2 Commercial forestry: The importance to commercial forestry companies and to resource management agencies are inventory and mapping applications: collecting harvest information, updating of inventory information for timber supply, broad forest type, vegetation density and biomass measurements.
• clear cut mapping/regeneration assessment • burn delineation • infrastructure mapping/operations support • forest inventory • biomass estimation • species inventory
4.5.4.3 Environmental monitoring Conservation authorities are concerned with monitoring the quantity, health and diversity of the Earth's forests.
• deforestation (rainforest, mangrove colonies) • species inventory • watershed protection • coastal protection (mangrove forests) • forest health and vigor
The level of accuracy and resolution of data required to address respective forestry issues differs accordingly. Canadian agencies have extensive a priori knowledge of their forestry resources and present inventory and mapping needs are often capably addressed by available data sources.
For forestry mapping and analysis applications requirements are high accuracy (for accurate information content), multispectral information and fine resolution and data continuity are the most important. There are requirements for large volumes of data, and reliable observations for seasonal coverage. There is a need to balance spatial resolution with the required accuracy and costs of the data. Resolution capabilities of 10 m to 30 m are deemed adequate for forest cover mapping, identifying and monitoring clear for burn and fire mapping which is for collecting forest harvest information, and identifying general forest damage. Spatial coverage of 100 - 10000 km2 is appropriate for district to provincial scale forest cover and accurate mapping, whereas 1-100 km2 coverage is the most appropriate for site specific vegetation density and volume studies (Narayan, 1999).
48
4.5.5 Mapping & Deforestation
Deforestation is a global problem, with many implications. In industrialized Europe pollution (acid rain, soot and chemicals from factory smoke plumes) has damaged a large percentage of forested land. In the former Czechoslovakia, one half of the forests are destroyed or damaged from pollutants. Similar effects are felt in Germany, Poland, and even the Scandinavian countries. In tropical countries, valuable rainforest is being destroyed in an effort to clear potentially valuable agricultural and pasture land. This has resulted in huge losses of tropical rainforest throughout Latin America (Central America, southern Mexico, Haiti), South America (Brazil), Africa and Asia. In both Haiti and Madagascar in particular, the results have been devastating. The lost of forests increases soil erosion, river siltation and deposition, affecting navigation, fisheries, wildlife habitat and drinking water supplies as well as farming productivity and self-sufficiency (NOAA, 1999 and marine, 2004).
Sensitive estuarine environments are protected by mangrove forest, which is cut or lost to urban growth, aquaculture, or damaged by pollutants or siltation. Monitoring the health of this forest is a step towards protecting the coastlines from erosion and degradation, and nearby inland areas from flooding. The rate and extent of deforestation as well as monitoring regeneration are the key parameters measured by remote sensing methods.
Remote sensing brings together a multitude of tools to better analyze the scope and scale of the deforestation problem. Multitemporal data provides for change detection analyses. Images of earlier years are compared to recent scenes, to tangibly measure the differences in the sizes and extents of loss of forest. Data from a variety of sources are used to provide complementary information. Radar merged with optical data which can be used to efficiently monitor the status of existing or new one and even assess regeneration condition. In countries where cutting is controlled and regulated by remote sensing that serves as a monitoring tool to ensure people are following the guidelines and specifications.
High resolution data provide a detailed view of forest depletion while radar can provide a view that may otherwise be obscured by clouds. All remote sensing devices however, provide a view of often remote and inaccessible areas where illegal damage could happen or continue which is not noticed for long periods of time if aerial surveillance wasn't possible.

49
Chapter 5
Image Interpretation and Analysis
5.1 Introduction In order to take advantage of and make good use of remote sensing data, we must be able to extract meaningful information from the imagery. This brings us to the topic of discussion in this chapter - interpretation and analysis - the sixth element of the remote sensing process which is defined as Interpretation and analysis of remote sensing imagery involves the identification and/or measurement of various targets in an image in order to extract useful information about them (Edwards, 1999). Targets in remote sensing images may be any feature or object which can be observed in an image and have the following characteristics:
• Targets may be a point, line, or area feature. This means that they can have any form, from a bus in a parking lot or plane on a runway to a bridge or roadway to a large expanse of water or a field.
• The target must be distinguishable; it must contrast with other features around it in the image.
Figure5.1: Remote Sensing working platform. Source: Canada Center for Remote Sensing tutorial
Much interpretation and identification of targets in remote sensing image is performed manually or visually by a human interpreter. In many cases this is done using image displayed in a pictorial or photograph format, independent of what type of sensor was used to collect the data and how the data were collected. In this case we refer to the data as being in analog format. As a basic knowledge we know, remote sensing images can also be represented in a computer as arrays of pixels, with each pixel corresponding to a digital number, representing the brightness level of that pixel in the image. In this case, the data are in a digital format. Visual interpretation may also be performed by examining digital image displayed on a computer screen. Both analogue and digital imagery can be displayed as black and white images and as a colour images by combining different channels or bands representing different wavelengths.

50
When remote sensing data are available in digital format, digital processing and analysis may be performed using computer. Digital processing may be used to enhance data as a prelude to visual interpretation. Digital processing and analysis may also be carried out to automatically identify targets and extract information completely without manual intervention by a human interpreter. However, rarely is digital processing and analysis carried out as a complete replacement for manual interpretation.
Manual interpretation and analysis dates back to the early beginnings of remote sensing for air photo interpretation. Digital processing and analysis is more recent with the beginning of digital recording of remote sensing data and the development of computers. Both manual and digital techniques for interpretation of remote sensing data have their respective advantages and disadvantages (Lillesand and Kiefer, 2000). Manual interpretation is often limited to analyzing only a single channel of data or a single image at a time due to the difficulty in performing visual interpretation with multiple images. The computer environment is more amenable to handling complex images of several or many channels or from several dates. In this sense, digital analysis is useful for simultaneous analysis of many spectral bands and can process large data sets much faster than a human interpreter. Manual interpretation is a subjective process, meaning that the results will vary with different interpreters. Digital analysis is based on the manipulation of digital numbers in a computer and is thus more objective, generally resulting in more consistent results. However, determining the validity and accuracy of the results from digital processing can be difficult (Eastman, 1992).
It is important to reiterate that visual and digital analyses of remote sensing image are not mutually exclusive. Both methods have their merits. In most cases, a mix of both methods is usually employed when analyzing imagery. In fact, the ultimate decision of the utility and relevance of the information extracted at the end of the analysis process still must be made by humans.

51
Figure5.2: The flowchart represents research stages for entire research work
52
5.2 Use of Software Resources In this study different kinds of spatial and non-spatial data collected both from primary or secondary sources have been used. Various computer based software are involved to handle and process these data. The supporting software systems that have been used are as follows, Ø IDRISI Andes: - On the research IDRISI is the main software where the analysis mostly
done. There is other software to do the satellite image analysis but for this research classification of the image was the main task and these kind of work IDRISI Andes is giving the better result. So I used this software for analysis the image.
Ø CartaLinx: - This software the research used for digitizing the LGED map. Ø Arc GIS 9.2: - Arc GIS 9.2 used for converting digitize image to shap file. Also the study
creates the salinity map and the Union maps through Arc GIS 9.2. Ø Arc View 3.2: - By using this software study find out the most effected or environmental
hazard area. Ø SPSS 16: - SPSS 16 used in this research to analysis the survey data. By using the SPSS the
study create the regression analyses which have been used to detect the socio-economic and environmental change in the study area.
Ø Minitab 15: - The IDRISI gave the result of land use types behalf of study area. These results
were analysis in Minitab 15. For the result analysis Minitab is the most useful software where change detection is visible clearly.
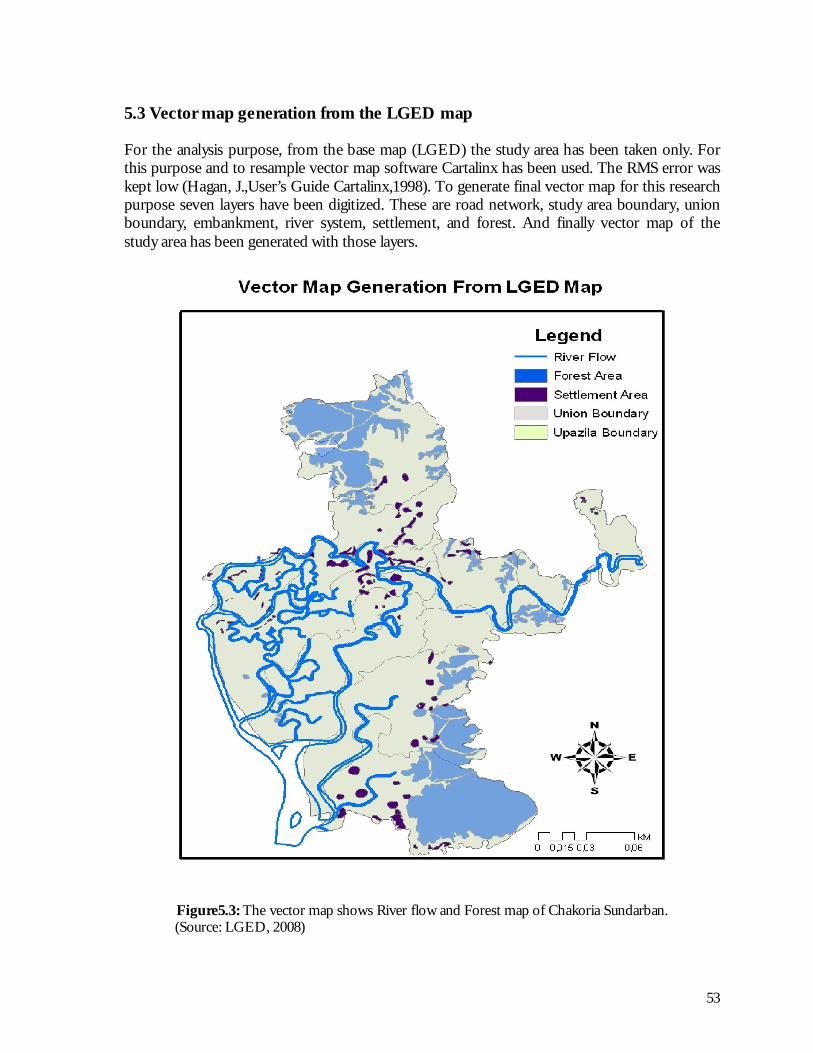
53
5.3 Vector map generation from the LGED map
For the analysis purpose, from the base map (LGED) the study area has been taken only. For this purpose and to resample vector map software Cartalinx has been used. The RMS error was kept low (Hagan, J.,User’s Guide Cartalinx,1998). To generate final vector map for this research purpose seven layers have been digitized. These are road network, study area boundary, union boundary, embankment, river system, settlement, and forest. And finally vector map of the study area has been generated with those layers.
Figure5.3: The vector map shows River flow and Forest map of Chakoria Sundarban.
(Source: LGED, 2008)

54
5.4 Digital Image Processing In today's world of advanced technology where most remote sensing data are recorded in digital format, virtually all image interpretation and analysis involves some element of digital processing. Digital image processing may involve numerous procedures including formatting and correcting of the data, digital enhancement to facilitate better visual interpretation or even automated classification of targets and features entirely by computer. In order to process remote sensing image digitally, the data must be recorded and available in a digital form suitable for storage on a computer tape or disk. Obviously, the other requirement for digital image processing is a computer system, sometimes referred to as an image analysis system with the appropriate hardware and software to process the data. Several commercially available software systems have been developed specifically for remote sensing image processing and analysis.
For discussion purposes, most of the common image processing functions available in image analysis systems can be categorized into the following four categories:
• Preprocessing • Image Enhancement • Image Transformation • Image Classification and Analysis
5.4.1 Preprocessing Preprocessing functions involve those operations that are normally required prior to the main data analysis and extraction of information which are generally grouped as radiometric or geometric corrections. Radiometric corrections include correcting the data for sensor irregularities and unwanted sensor or atmospheric noise and converting the data so they accurately represent the reflected or emitted radiation measured by the sensor. Geometric corrections include correcting for geometric distortions due to sensor-Earth geometry variations and conversion of the data to real world coordinates (e.g. latitude and longitude) on the Earth's surface (Lo, C.P. and Yeung, A.K.W., 2002).
5.4.2 Image Enhancement The raw satellite image cannot be used in research directly. Because, remotely sensed data acquired by satellite sensors are influenced by number of factors, such as atmospheric absorption and scattering (DU, Teillet, & Cihlar, 2002, Song, 2000; Yand & Lo, 2000). In order to detect genuine land use changes as revealed by changes in the spectral surface reflectance from multi date satellite images, it is necessary to carryout geometric and radiometric correction. So for the image analysis the geometric and radiometric correction have been done to remove or decrease the influence of the atmosphere and terrain relief on the remotely sensed data. The objective of the second group of image processing functions grouped under the term of image enhancement is exclusively to improve the appearance of the image to assist in visual interpretation and analysis. Examples of enhancement functions include contrast stretching to increase the tonal distinction between various features in a scene and spatial filtering to enhance (or suppress) specific spatial patterns in image.

55
5.4.3 Image Transformation Image transformations are operations similar in concept to those for image enhancement. However, unlike image enhancement operations which are normally applied only to a single channel of data at a time, image transformations usually involve combined processing of data from multiple spectral bands. Arithmetic operations (i.e. subtraction, addition, multiplication, division) are performed to combine and transform the original bands into "new" images which better display or highlight certain features in the scene. On research we will look at some of these operations including various methods of spectral band in multichannel image.
Figure5.4: Remote Sensing image transformation. Source: Canada Center for Remote Sensing tutorial Image classification and analysis operations are used to digitally identify and classify pixels in the data. Classification is usually performed on multi-channel data sets (A) and this process assigns each pixel in an image to a particular class or theme (B) based on statistical characteristics of the pixel brightness values. There are a variety of approaches taken to perform digital classification on the research.
5.4.4 Image Classification and Analysis
A human analyst attempting to classify features in an image uses the elements of visual interpretation (Lo, C.P. and Yeung, A.K.W., 2002) to identify homogeneous groups of pixels which represent various features or land cover classes of interest. Digital image classification uses the spectral information represented by the digital numbers in one or more spectral bands and attempts to classify each individual pixel based on the spectral information. This type of classification is termed spectral pattern recognition. In either case, the objective is to assign all pixels in the image to particular classes or themes (e.g. water, coniferous forest, deciduous forest, corn, wheat, etc.). The result of classified image is comprised of a mosaic of pixels, each of which belongs to a particular theme and essentially a thematic "map" of the original image.
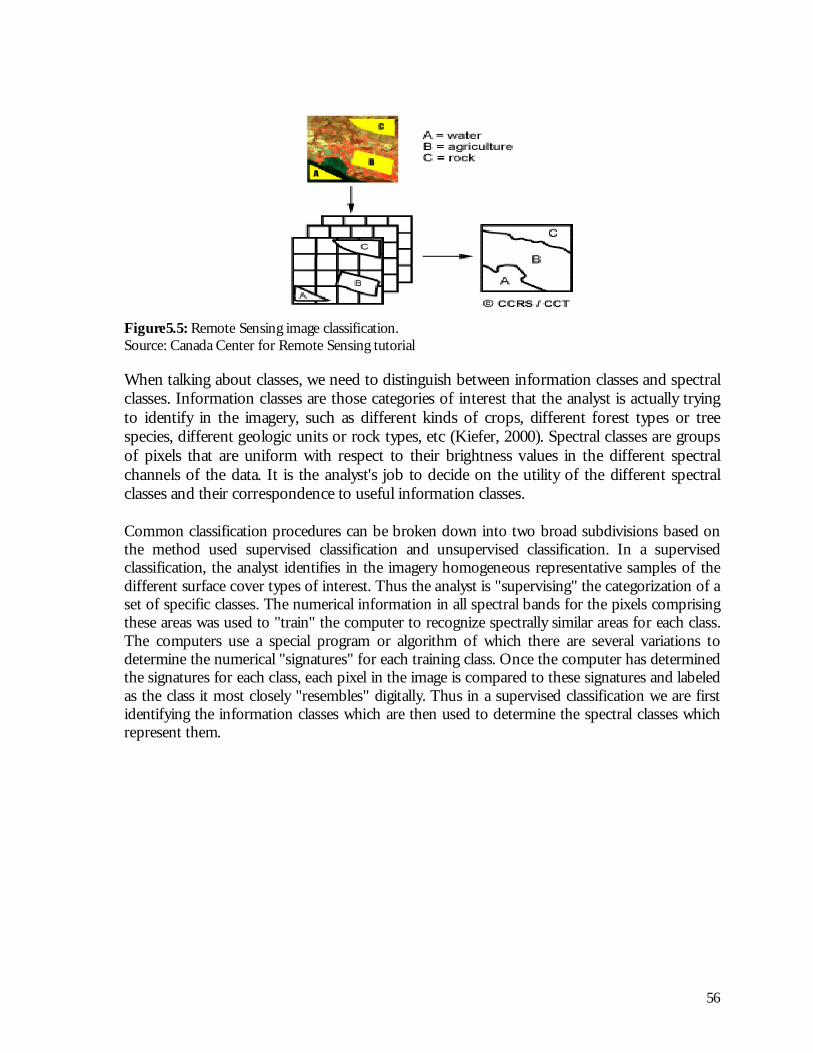
56
Figure5.5: Remote Sensing image classification. Source: Canada Center for Remote Sensing tutorial When talking about classes, we need to distinguish between information classes and spectral classes. Information classes are those categories of interest that the analyst is actually trying to identify in the imagery, such as different kinds of crops, different forest types or tree species, different geologic units or rock types, etc (Kiefer, 2000). Spectral classes are groups of pixels that are uniform with respect to their brightness values in the different spectral channels of the data. It is the analyst's job to decide on the utility of the different spectral classes and their correspondence to useful information classes. Common classification procedures can be broken down into two broad subdivisions based on the method used supervised classification and unsupervised classification. In a supervised classification, the analyst identifies in the imagery homogeneous representative samples of the different surface cover types of interest. Thus the analyst is "supervising" the categorization of a set of specific classes. The numerical information in all spectral bands for the pixels comprising these areas was used to "train" the computer to recognize spectrally similar areas for each class. The computers use a special program or algorithm of which there are several variations to determine the numerical "signatures" for each training class. Once the computer has determined the signatures for each class, each pixel in the image is compared to these signatures and labeled as the class it most closely "resembles" digitally. Thus in a supervised classification we are first identifying the information classes which are then used to determine the spectral classes which represent them.

57
Figure5.6: Remote Sensing image classification. Source: Canada Center for Remote Sensing tutorial.
Unsupervised classification in essence reverses the supervised classification process. Spectral classes are grouped first, based solely on the numerical information in the data and are then matched by the analyst to information classes (if possible). Programs, called clustering algorithms which are used to determine the natural (statistical) groupings or structures in the data. So unsupervised classification is not completely without human intervention however it does not start with a pre-determined set of classes as in a supervised classification. One of the first steps before classifying the image is to enhance the image in a way to provide rough information of land use differentiation. The simplest way is to combine different bands like infrared, red, green for false color composite. The image classification was made with the objective to extract land use pattern information from the image. In this research land use was mapped using the supervised classification method. And to extract land use types WDVI technique has been used.

58
5.5 Weighted difference vegetation Index (WDVI)
It is a slope Based Model of various vegetation indices. Vegetation indices are used to isolate vegetation’s presence and photosynthetic activity from other types of land cover. The vegetation index that is used in this research is the Weighted Difference Vegetation Index (WDVI), which is defined by an algebraic formula: Near IR band - red band Near IR band + red band
=WDVI
Band 3 Red Band
Band 4 Infrared Band Figure 5.7 WDVI mechanisms for 1972

59
Band 3 Red Band
Band 4 Infrared Band Figure 5.8 WDVI mechanisms for 1989
Band 3 Red Band
Figure 5.9 WDVI mechanisms for 1999 Band 4 Infrared Band

60
The WDVI index is more preferable than the simple index [band ratio e.g IR/R] for global vegetation monitoring because the NDVI and WDVI helps compensate for changing illuminations conditions, surface slope, aspect and other extraneous factors” (Lillessand and Kiefer, 1994). This is an important aspect to consider. When the Landsat satellite acquires images of a same reason in different years some of the “illuminations conditions” may be different. The WDVI index improves the comparison between the two or more images. WDVI pixel values created using the above algebraic formula range from -1 to +1. It can be stretched from o to 255. The values for vegetations range from low of 0.05 to high of 0.66 (Lillessand and Kiefer, 1994). Clouds, snow, water and bright non vegetated surfaces have a WDVI value of less than zero. The highest value in the vegetation range represents the maximum “greenness” (Lillessand and Kiefer, 1994). Greenness is a measure of plant biomass that is actively producing Chlorophyll (Green, 1998). The vegetation value range used in the WDVI indices illustrates the state of health and development of vegetation. High values usually shown as dark green areas represent areas of healthy, abundant vegetation in a mature state of development. Lower values usually depicted with lighter green show areas with emerging or lesser amounts of vegetation (Green, 1998). Though it is known that the conventional method of land use pattern deletion by employing vegetation indices has some uncertainties specially discriminating the active agricultural land from forest, vegetation indices (WDVI) have used in this present research due to lack of sufficient data like surface temperature and high resolution satellite image. Though WDVI is a conventional technique it is capable to provide accurate land use pattern also. Besides WDVI, FCC image has been used clarify some land use types, which have appeared hazy in WDVI.
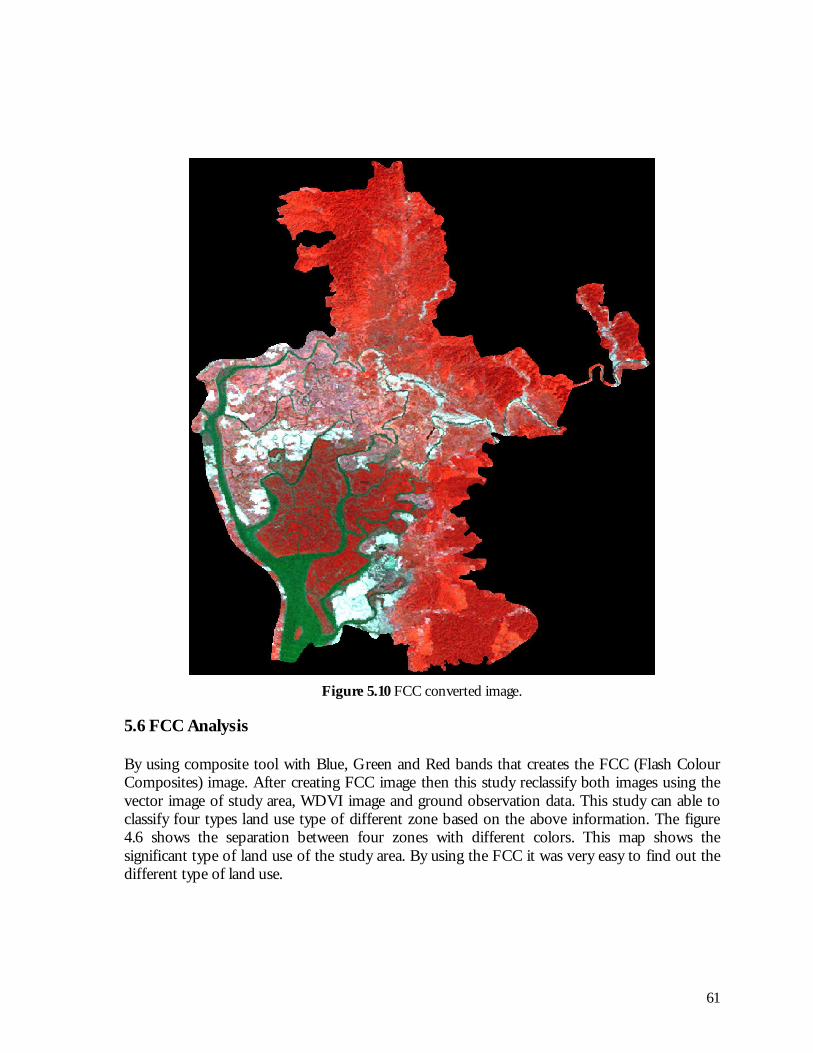
61
Figure 5.10 FCC converted image.
5.6 FCC Analysis By using composite tool with Blue, Green and Red bands that creates the FCC (Flash Colour Composites) image. After creating FCC image then this study reclassify both images using the vector image of study area, WDVI image and ground observation data. This study can able to classify four types land use type of different zone based on the above information. The figure 4.6 shows the separation between four zones with different colors. This map shows the significant type of land use of the study area. By using the FCC it was very easy to find out the different type of land use.
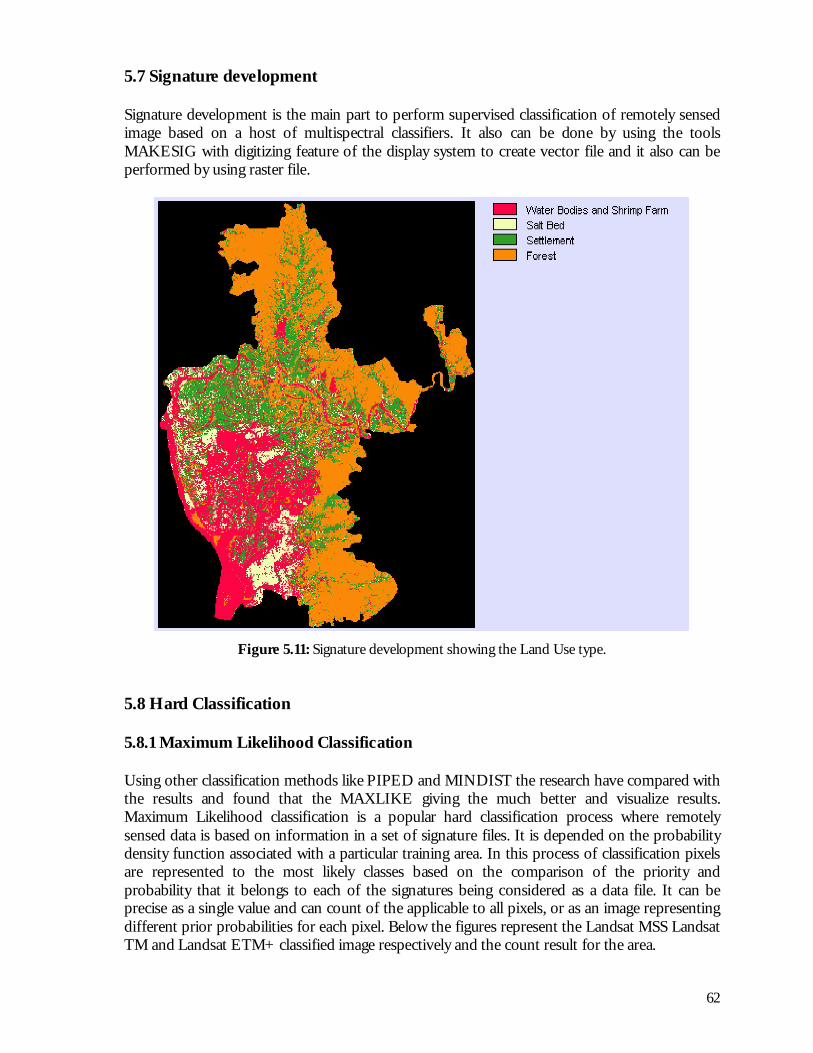
62
5.7 Signature development Signature development is the main part to perform supervised classification of remotely sensed image based on a host of multispectral classifiers. It also can be done by using the tools MAKESIG with digitizing feature of the display system to create vector file and it also can be performed by using raster file.
Figure 5.11: Signature development showing the Land Use type. 5.8 Hard Classification 5.8.1 Maximum Likelihood Classification Using other classification methods like PIPED and MINDIST the research have compared with the results and found that the MAXLIKE giving the much better and visualize results. Maximum Likelihood classification is a popular hard classification process where remotely sensed data is based on information in a set of signature files. It is depended on the probability density function associated with a particular training area. In this process of classification pixels are represented to the most likely classes based on the comparison of the priority and probability that it belongs to each of the signatures being considered as a data file. It can be precise as a single value and can count of the applicable to all pixels, or as an image representing different prior probabilities for each pixel. Below the figures represent the Landsat MSS Landsat TM and Landsat ETM+ classified image respectively and the count result for the area.

63
Figure 5.12: MAXLIKE Hard Classification on MM 1972.
MaxLike Hard Classification (1972)
0
20000
40000
60000
80000
100000
120000
Ma
xLik
e A
rea
In A
cre
s
Land Use Type In Acres 15791,3669 6735,917031 8638,750866 101944,6896
Water & Shrimp Salt Bed Settlement Forest
Figure5.13: The graph shows the Landuse type in the Chakoria using MAXLIKE classification
in Landsat MSS in year 1972.
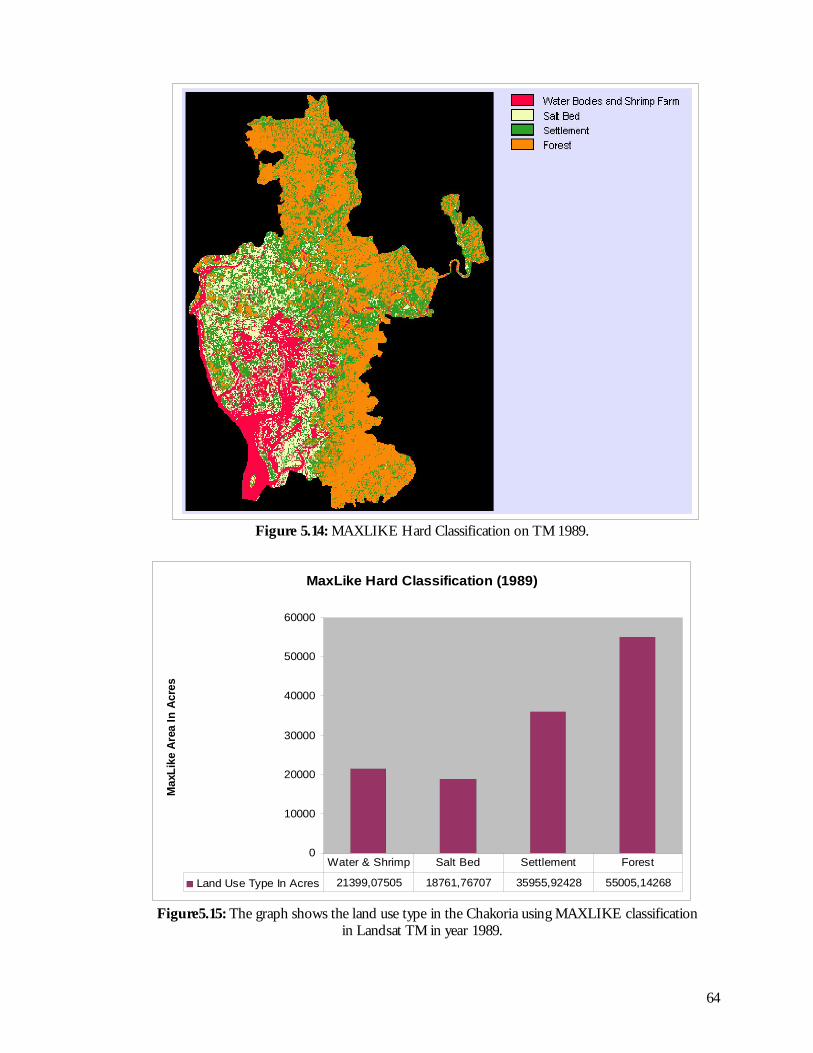
64
Figure 5.14: MAXLIKE Hard Classification on TM 1989.
MaxLike Hard Classification (1989)
0
10000
20000
30000
40000
50000
60000
MaxL
ike A
rea I
n A
cre
s
Land Use Type In Acres 21399,07505 18761,76707 35955,92428 55005,14268
Water & Shrimp Salt Bed Settlement Forest
Figure5.15: The graph shows the land use type in the Chakoria using MAXLIKE classification
in Landsat TM in year 1989.
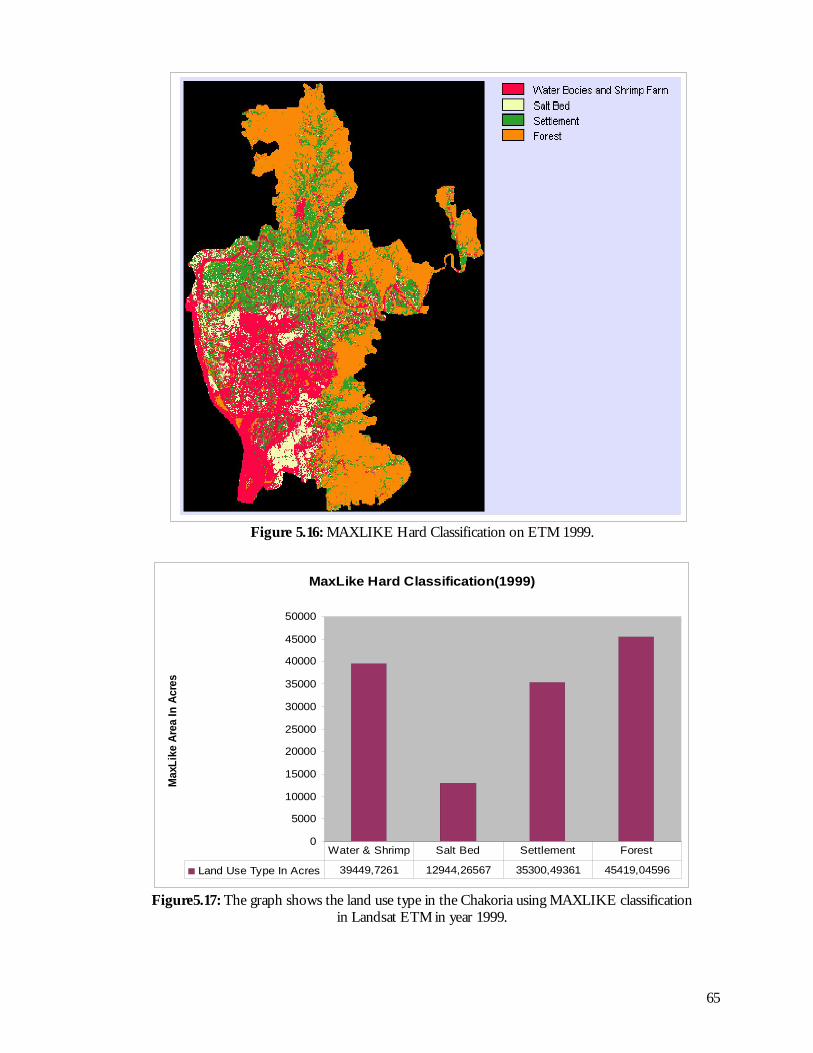
65
Figure 5.16: MAXLIKE Hard Classification on ETM 1999.
MaxLike Hard Classification(1999)
0
5000
10000
15000
20000
25000
30000
35000
40000
45000
50000
Ma
xLik
e A
rea
In A
cre
s
Land Use Type In Acres 39449,7261 12944,26567 35300,49361 45419,04596
Water & Shrimp Salt Bed Settlement Forest
Figure5.17: The graph shows the land use type in the Chakoria using MAXLIKE classification
in Landsat ETM in year 1999.

66
5.9 Soft Classification 5.9.1 MAHALCLASS MAHALCLASS is one of a group of soft classifiers included with IDRISI. On the analysis the research have gone through FUZCLASS classifiers but the results were not that much good as it is showing on MAHALCLASS classifier. This soft classification is making a definitive result of the Landuse type of any pixel in favor of generating a group of statements about the degree of membership of that pixel in each of the possible classes. It is produce separate maps for each class which is followed by signature file.
(2)
(3)
(1)
Figure 5.18: 1, 2, 3 MAHALCLASS on MSS(1972), TM (1989) and ETM(1999) for Forest.
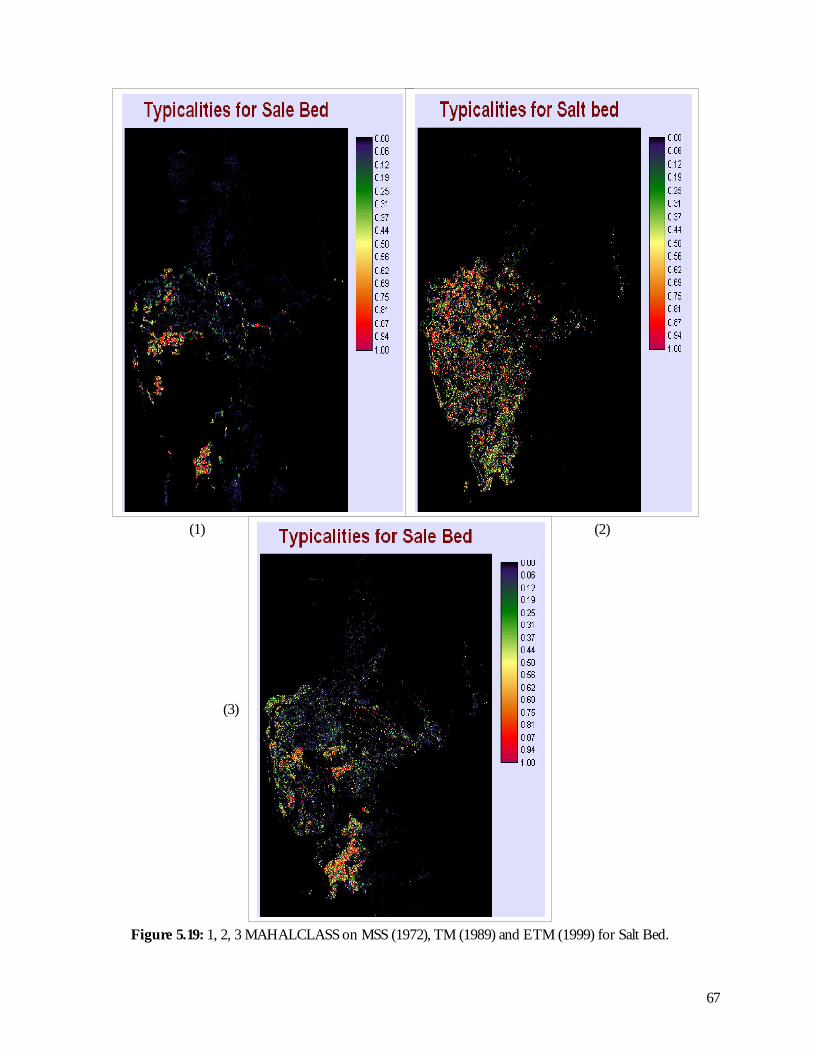
67
(1)
Figure 5.19: 1, 2, 3 MAHALCLASS on MSS (1972), TM (1989) and ETM (1999) for Salt Bed.
(2)
(3)

68
Figure 5.20: 1, 2, 3 MAHALCLASS on MSS (1972), TM (1989) and ETM (1999) for Settlement.
(2)
(3)
(1)

69
Figure 5.21: 1, 2, 3 MAHALCLASS on MSS (1972), TM (1989), ETM (1999) for Water Bodies and Shrimp Farm.
(1) (2)
(3)

70
5.10 Changes in Landuse The classified images of the years 1972, 1989 and 1999 were analysis in the research. Results from image interpretation and field observation shows that in the study area have a vast change has occurred in a particular land use category. Here the changes occurred gradually and the forest land area getting less day by day. Areas under different land use types have been calculated by the digital image processing technique using image processing software IDRISI Andes. This shows that the area under different land use type has been changed during the period to 1972 to 1999. Both the overall and feature wise changes in the different land use types have been discussed in the following analysis stages. 5.11 Time Series Analysis 5.11.1 CROSSTAB CROSSTAB is one of a group of time series analysis in GIS analysis included with IDRISI. In this classification process two different years image can be used to detect the change. The resulted image can visualize the change of the Landuse. This is one of the most dedicated processes in time series analysis. It produces separate maps for each class which is taken form signature file. It is produce separate maps for each class which is taken form signature file and shows the changes of the year to year image. Change detection and comparison between MSS (1972) to TM (1989) and TM (1989) to ETM (1999) using CROSSTAB Time Series Analysis Here in research MSS (1972) to TM (1989) made the CROSSTAB then TM (1989) to ETM (1999) made the CROSSTAB and the result image and graph is showing below.

71
Figure 5.22: Crosstab between MSS (1972) to TM (1989) And TM (1989) to ETM (1999) for Forest of MAHALCLASS Soft Classifiers.
Forest Area (MahalClass)
0
10000
20000
30000
40000
50000
60000
70000
Fo
res
t A
rea I
n A
cre
s
Land Use In Acres 64632,27471 33224,34705 25662,44185
1972 1989 1999
Figure 5.23: The graph shows the Change detection and comparison between MSS (1972) to ETM
(1999) using CROSSTAB Time Series Analysis (Forest Area) for MAHALCLASS soft Classifiers.

72
Figure 5.24: Crosstab between MSS (1972) to TM (1989) And TM (1989) to ETM (1999) for Salt Bed of MAHALCLASS Soft Classifiers.
Salt Bed Area (MahalClass)
0
1000
2000
3000
4000
5000
6000
7000
8000
9000
Sal
t B
ed A
rea
In A
cres
Land Use In Acres 2279,742283 8098,300767 6382,460337
1972 1989 1999
Figure 5.25: The graph shows the Change detection and comparison between MSS (1972) to ETM (1999) using CROSSTAB Time Series Analysis (Salt Bed Area) for MAHALCLASS soft Classifiers.

73
Figure 5.26: Crosstab between MSS (1972) to TM (1989) And TM (1989) to ETM (1999) for Settlement of MAHALCLASS soft Classifiers.
Settlement Area (MahalClass)
0
5000
10000
15000
20000
25000
30000
Se
ttle
me
nt
Are
a I
n A
cre
s
Land Use In Acres 1858,934765 20268,97539 25085,6203
1972 1989 1999
Figure 5.27: The graph shows the Change detection and comparison between MSS (1972) to ETM (1999) using CROSSTAB Time Series Analysis (Settlement Area) for MAHALCLASS Soft Classifiers.
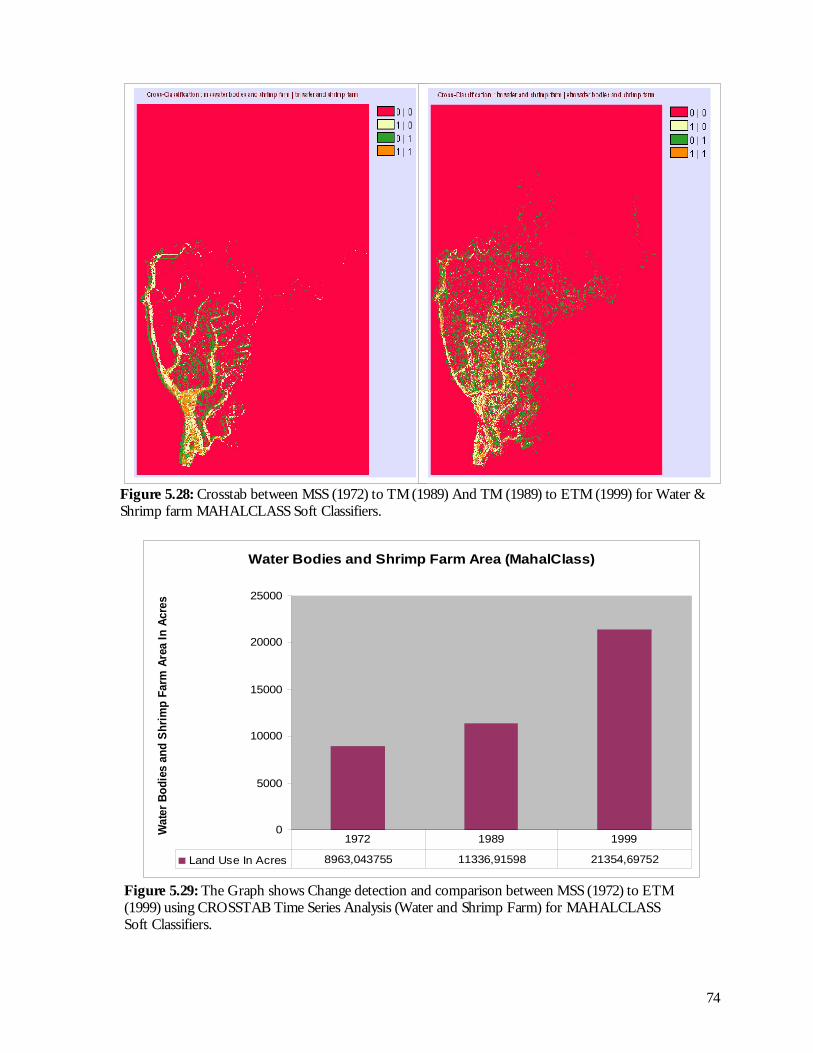
74
Figure 5.28: Crosstab between MSS (1972) to TM (1989) And TM (1989) to ETM (1999) for Water & Shrimp farm MAHALCLASS Soft Classifiers.
Water Bodies and Shrimp Farm Area (MahalClass)
0
5000
10000
15000
20000
25000
Wate
r B
od
ies a
nd
Sh
rim
p F
arm
Are
a I
n A
cre
s
Land Use In Acres 8963,043755 11336,91598 21354,69752
1972 1989 1999
Figure 5.29: The Graph shows Change detection and comparison between MSS (1972) to ETM (1999) using CROSSTAB Time Series Analysis (Water and Shrimp Farm) for MAHALCLASS Soft Classifiers.

75
Figure 5.30: Change detection and comparison result between MSS (1972) to TM (1989) and TM (1989) to ETM (1999) using CROSSTAB Time Series Analysis for MaxLike Hard Classifiers.
Using MaxLike Land Use Change (1972 to 1989)
0
10000
20000
30000
40000
50000
60000
Lan
d U
se C
han
ge I
n A
cre
s
Land Use Type In Acres 21863,35263 1578,920039 2066,677745 49528,01815
Water & Shrimp Salt Bed Settlement Forest
Figure 5.31: Graph shows Change detection and comparison result between MSS (1972) to TM (1989) using CROSSTAB Time Series Analysis for MaxLike Hard Classifiers.

76
Using MaxLike Land use Change (1989 to 1999)
0
5000
10000
15000
20000
25000
30000
35000
40000
45000
Lan
d U
se C
han
ge I
n A
cre
s
Land Use Type In Acres 26327,62379 1168,038847 13563,22306 38292,44183
Water & Shrimp Salt Bed Settlement Forest
Figure 5.32: Graph shows Change detection and comparison result between TM (1989) to ETM (1999) using CROSSTAB Time Series Analysis for MaxLike Hard Classifiers.
5.12 Survey Questionnaires Analysis In this present research satellite image of Landsat MSS of the year 1972 and TM image of 1989 and ETM image of 1999 have been used. In the case of Landuse pattern identification the image of ETM-1999 has been examined first because it is the most recent image available to us and corresponds with the ground verification data. The survey of socio-economic change where statistics for the study area can represent the change easily and visualization of statistical techniques has been used to represent the Landuse change. To show these changes the regression analysis could be the best way to interpret the relationship between the factors related to socio-economic and environmental changes in the study area. Although different statistical techniques were tested to analysis the changes in different Landuse types. Where as the shrimp farm and settlement has increase due to human interference of local people. On the other hand forest/vegetation and mangrove forest has decreased (Somewhere vanished) due to better income source and corruption of the Forest Department. So these types of related analytical survey data of socio-economic changes could be represent by regression analysis. The research survey questionnaires in the study area were for socio-economic and environmental impact on Landuse change in Chakoria Sundarban. The Survey questionnaires are presented in the Appendix section and data analysis results presented with bellows regression analysis.

77
Here we can see that the small family has more educational percentage then the big family of eight members. In X is counting the family members and Y is counting the education percentage of the members.
Here in this regression analysis is related to the previous regression analysis because the small families have more education and more total land area then the big family. Some family members are living in Chakoria more then ten years also representing by this regression analysis.

78
Here in this regression we can see that the study area is much more economical developed. Total income and the expenditure have great co-relation is presenting in this regression analysis. Some of the family dose not has this co-relation which is indicate in this regression analysis.
This regression analysis is a negative regression analysis where representing that the low income people have bad health condition. On this regression variable 1 is used for good health condition of the health and 2 used for bad health conditions of health. The X line showing the less income people have bad health condition. So the relational result is showing average health condition of the study area.

79
This regression is related to the previous regression analysis. Here also 1 variable is used for good house condition and 2 used for bad condition of the house. So in this regression analysis house condition also have a relation with total family income.
In this regression analysis, presenting the relation of total income and total amount of land owned by the household and how long the land owners are living in the study area. From this regression analysis we can understand that most of the people are living here not being for long time. So settlements established mostly in the recent years.

80
Here in this regression showing the percentage of Landuse for homestead and the also showing a relational line between the total amounts of land owned by the household. In this regression analysis X is indicating the amount of land area and Y is indicating the homestead land area.
In this regression is showing the percentage of agricultural Landuse and the also showing a relational line between the total amounts of land owned by the households. Here agricultural land is salt bed, rice, homestead forest and others.

81
Here in this regression showing the percentage of Landuse for vegetable growing area and the also showing the relational line between the total amounts of land owned by the households. From this it is easy that the percentage of vegetable growing area is less then other Landuse type.
Here in this regression showing the percentage of Landuse for ponds area and the regression also showing the relational line between the total amounts of land owned by the households. It is clearly visible that highest area of Landuse is for ponds area for shrimp farming.

82
Here in this regression analysis is showing that the highest land owners have the highest expenditure. So here the expenditure and the highest land owner have a relational line. There is a co-relation between land owner and expenditure which is showing in this regression analysis.
Here in this regression analysis is showing that the highest land owners have the highest income. The study area is mostly economically developed by the shrimp farming. So this regression analysis represent that the land resources have a relation with the income where very less family have the low average income.

83
This regression analysis represent that the total value of land resources and the total land own by the owners. By this we can understand that the very few people have huge amount of land property.
In this regression analysis is showing the educational percentage on the family members and total expenditures of the family members where regression curve indicates the highest and lowest relational curve between total expenditure and the educational percentage.

84
In this regression analysis is showing the total land owned my the family members and total expenditures of the family members where regression curve indicates the highest and lowest relational curve between total expenditure and the total amounts of land owned by the owner.
Here in this regression analysis is showing that how long the house owners are living in the study area and the total land being owned by the owner where there is a clear visible curve here that indicates that the people are living here long time they have highest total land area.

85
This regression analysis is comes from a very important aspect. It is just Yes/No question answer. This regression analysis means that 1 is Increase and 2 is decrease. So the people who are living in Chakoria more than 15 year they are saying that the floral diversity in increase and the curve line showing that the floral diversity is gradually increasing.
Here in this regression analysis is showing that the total land area and the value of that land.

86
The people who are living long time in Chakoria and they had suffering some environmental situation they gave the suitable suggestions about how we should utilize the land area. Here 1 is shrimp farm, 2 is settlement and agriculture, 3 is forest area and 4 is salt bed. The average answer is between forest and agriculture as a build up area.
On this regression it is clear that most of the people in Chakoria is living not for long time. Very less people are living for long time. So it that most of the people are living in Chakoria in recent years with relation of Landuse change as shrimp farming.
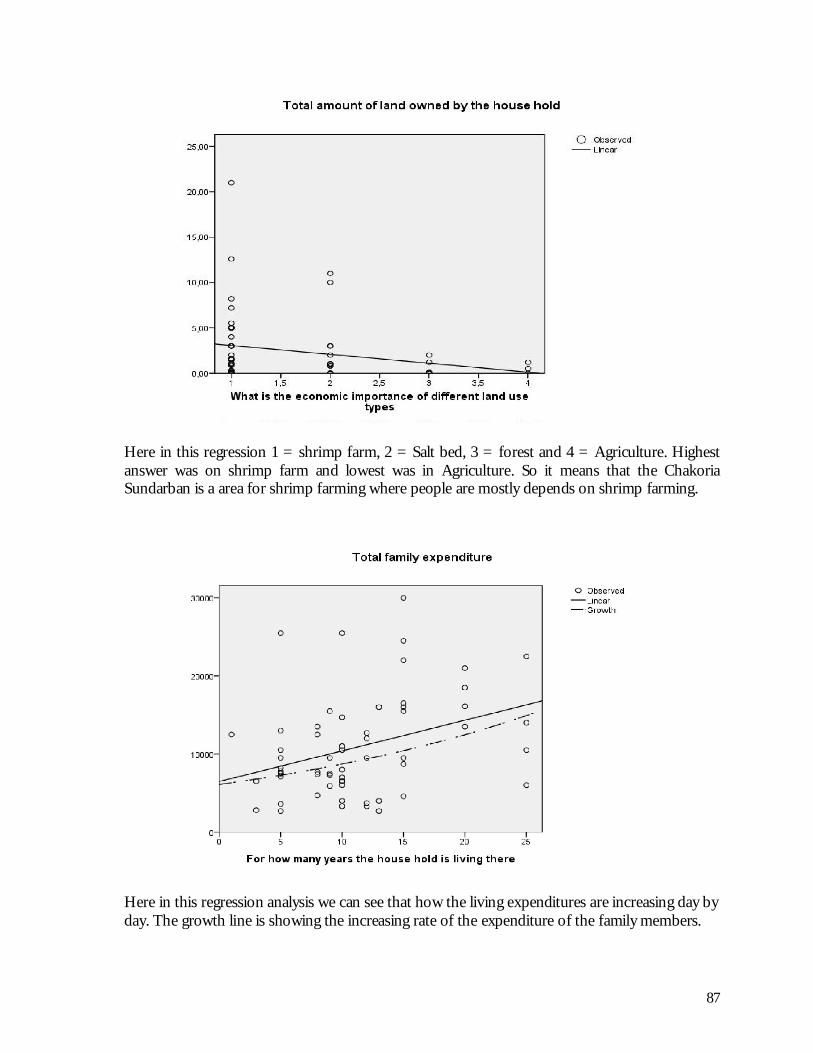
87
Here in this regression 1 = shrimp farm, 2 = Salt bed, 3 = forest and 4 = Agriculture. Highest answer was on shrimp farm and lowest was in Agriculture. So it means that the Chakoria Sundarban is a area for shrimp farming where people are mostly depends on shrimp farming.
Here in this regression analysis we can see that how the living expenditures are increasing day by day. The growth line is showing the increasing rate of the expenditure of the family members.

88
In this growth regression analysis we can see that how the family incomes are increasing year to years. This regression is very important for the socio-economic changes following Landuse changes.
Here in this linear curve showing that how the other land users loss their land area with the replaced of shrimp farm. When the shrimp culture starts in Chakoria there is a huge number of people change their agricultural land to shrimp farming.

89
In this regression curve showing how the family expenditure increase year to year.
In this regression curve showing how the family income increase year to year by changing the land use type. So Landuse change also have a huge impact on socio-economic change. Both are related to each other.

90
Here in this regression analysis 1= Forest, 2= Wild forest, 3= Same as today. The people who are living in Chakoria not more than 10 years they all are saying that the previous land use type was same as today(3). Because last 10 years land use was not that much visible. But the people who are living in Chakoria since last 10 to 15 years they are saying that the previous land use type Forest (1).Because that time the study area mostly covered with Forest (1).And the people who are living up to 25 years in Chakoria they are saying that the previous most land use type was wild forest (2).So from these regression analysis we can understand that the wild mangrove forest changed gradually to forest area and now shrimp culture area. So this Landuse change impact on socio-economic and environmental situation of the study area.

91
5.13 Findings
The prime aim of present study was to determine land use changing of the Chakoria Sundarban using
remotely sensed data for the year of 1972, 1989 and 1999. For this study Landsat MSS, TM and ETM
image and vector map (LGED) have been used. Based on the study, following remarks can be made,
Ø Chakoria Sundarban was a mangrove forest region in Bangladesh where the shrimp farm
and Salt Bed are taking place of mangrove forest area. Remotely sensed data also indicated
this trend and it is evident that significant changes have been taken place in the Chakoria
where shrimp farm, Salt Bed and Settlement played active role. But shrimp culture observed
more dominants over accretion in Chakoria. Due to high rate of mangrove forest vanished
the study area are being a reason for environmental change.
Ø The remote sensing tools are very useful to identify the land features. Time series analysis of
satellite data provided information regarding temporal changes. Uses of remote sensing
techniques are recommended for better planning and sustainable management of
Bangladesh.
Ø The remarkable changes of the land use classes have been occurred, between 1989 to 1999
but the changes was not that much significant during 1972 to 1989.
Ø The most Landuse change was occurred in the southern part of the study area due to
expansions of Shrimp Farm because of salinity water and Landuse changes for settlements
because of road network, administrative and other infrastructures.
Ø It has been found that Landuse changed due to forestation program and corruption of
Bangladesh forest department.

92
Chapter-6
CONCLUSION
6.1 Conclusion
Land use refers to the purpose the land serves, for example wildlife habitat, forest agriculture,
settlement etc. In remote sensing to detect land use change what we do is just classifying the
pixel. That is identifying which pixel belongs to which groups is the main task here. Analysis of
mechanisms of land use changes plays an important role in forecasting, socio-economic and
environmental changes. The mechanism adapted in the present research includes an analysis of
Landsat images and field survey to monitor the land use changes. In the present research both
the physical and cultural factors affecting the land use changes in the study area are considered
during the 27 years observed period. Knowledge of land use changes is an important role for
many planning and management activities concerned with the surface of the earth. The study of
the land use change patterns and the monitoring of changes are very important for economic
planning and country development. Landuse pattern reflect the character of a society’s
interaction with its physical environment, a fact that becomes obvious when it is possible to see
different economic and social systems occupying the same or similar environments.The
advantage of remote sensing is to provide with a sophisticated and reliable tool for making a
rapid survey of any area with reasonable accuracy. In the study the results from digitally
processed Landsat imagery has been used to compare with source of maps of the same place of
different years to change detection of the Chakoria Sundarban. During the period of 1972 to
1999 it is resulted a significant change have taken place in the study area by a massive distraction
of mangrove forest. So using of Remote Sensing methods are becoming increasingly important
in land use and land cover studies because large area can be examined rapidly through this
process and at low cost.

93
6. 2 Recommendations
Following issues can be listed as recommendations for future research:
Ø High resolution remote sensing products and aerial photographs could be used to delivery
Landuse change detection pattern of any expected time period. It can be also possible to
Integrate a Geoinformatic technique for future land use change study.
Ø It is necessary to formulate a national Landuse development policy in the country for
planning and development.
Ø The impact of land use change should be studied and reviewed regularly for the socio-
economic and environmental change detection.
Ø A continuous monitoring system could be possible made to understand the Landuse changes
and to identify the areas under Landuse change.
Ø It may be note that land use change analysis in Chakoria Sundarban with Remote Sensing techniques
may help the policy maker of the government and the local authority for development of the certain
area.
Ø In future same or improved methods could be use to find out the Landuse changes in whole
Bangladesh in the world prospect and the socio-economic and environmental changes in the
underdevelopment country like Bangladesh.
94
REFERENCES
1) Haque, A.K.E., (2003), Sanitary and Phyto-sanitary Barriers to Trade and its Impacts on the Environment: the Cases of Shrimp Farming in Bangladesh, International Institute for Sustainable Development (IISD), Manitoba, Canada. 2) Bhattacharya, A., Sarkar, S.K., (2003), Impact of overexploitation of shellfish: Northeastern coast of India. Ambio 32, pp.70-75. 3) Campbell, J.B., (1996), Introduction to Remote Sensing, Guilford Publications, Inc., New York, pp.519-537. 4) Das, S.C., (2002), Modern oceanography (in bangle), 2nd edition, Mrs. Esa Das, B-16, Jahangirnagar University, Savar, Dhaka-1342, pp. 335-354. 5) Eastman J.R., (2006), IDRISI Andes: Guide to GIS and Image Processing. Clark Labs, Clark University, MA, USA 6) Edwards, A., (1999), The Remote Sensing Handbook for Tropical Coastal Management, UNESCO. 7) Canada Centre for Remote Sensing, Fundamentals of Remote Sensing, National Resources Canada. 8) Lillesand, T.M., Kiefer, R. W., (2002), Remote Sensing and Image Interpretation, John Willy & Sons, Inc., New York, pp. 318, 396 and 415. 9) Lo, C.P., Yeung, A.K.W., (2002), Concepts and Techniques of Geographic Information System, Prentice-Hall, Inc., New Delhi, pp.36-182. 10) Louchard, E.M., Pamela Reid, R., Carol Stephans, F., (2003), Optical remote sensing of benthic habitat and bathymetry in coastal environments at Lee Stocking Island, Bahamas: A comparative spectral classification approach, Limnol. Oceanogr.,48 (1,Part 2), pp.511-521. 11) Bhattacharya, A. and Sarkar, S.K., (2003), Impact of overexploitation of shellfish: Northeastern coast of India, Ambio 32, pp. 70-75. 12) Clark, J. R., (1996), Coastal Zone Management handbook, Boca Raton, Fla.: Leiws pub., 1996. 13) Hill, B., (2002), National and international impacts of white spot disease of shrimp Bulletin of European Association of Fish Pathologiests., 22(2) 2002, pp.58-65. 14) Hossain, M. S., (2001), Biological aspects of the coastal and marine environment of Bangladesh. Ocean and Coastal Management, Vol. 44 (2001). pp. 261-282. 15) Hossain, M. S., Lin, C. K., Hussain, M. Z., (2001), Goodbye Chakoria Sundarban: The Oldest Mangrove Forest, Society of Wetland Scientists, Bulletin, Vol. 18. No 3. pp.19-22. 16) Islam, M. S., (2003), Socio-economic impacts of alternate shrimp-shrimp-crop farming in Bangladesh. pp. 61-78. In: Wahab, M. A. (ed.) Environmental and Socioeconomic Impacts of Shrimp farming in Bangladesh, Technical proc. BAU –NORAD Workshop, 5th March 2002, BRAC Centre, Dhaka, Bangladesh, Bangladesh Agricultural University, Mymensingh, Bangladesh, pp.101.

95
17) Survey of Bangladesh/SOB, (2001), Bangladesh, Local Government Engineering Department (LGED), Dhaka. 18) Rahman, S.M.N., Gafoor, A., Hossain, T.I.M.T., (2002), Coastal Zone Monitoring Using Remote Sensing Techniques, Bangladesh Space Research and Remote Sensing Organization (SPARRSO), Dhaka. 19) Kausher, A., Kay, R.C., Asaduzzaman, M., Paul, S., (1993), Climate Change and Sea-level Rise: the Case of the Coast, Briefing Ducument No.6, Bangladesh Unnayan Parishad (BUP), Dhaka. 20) Mia, A. H., Islam, M. R., (2005), Coastal Land Uses and Indicative Land Zones: the Case of Program Development Office for Integrated Coastal Zone Management Plan (PDO-ICZMP), Dhaka. 21) Islam, M.J., Alam, M.S., Elahi, K.M., (1997), Remote sensing for change detection in the Sunderbans, Bangladesh, Geocarto International, pp.12, 91-100. 22) Ahmed, A.T.A., (1995a), Impact of Shrimp Culture on the Coastal Environment of Bangladesh. Proc. Workshop Coastal Aquaculture Environment Management, Cox's Bazar, Bangladesh, pp 77-82. 23) Ahmed, M., (1995), Biodiversity Conservation of Bangladesh. Compilation of Theme Papers on Environmental Studies, Bangladesh Technical Education Board pp 136-150. Dhaka, Bangladesh. 24) Green, E. P., Clark, C. D., Mumby, P. J., Edwards, A. J., Ellis, A. C., (1998), Remote Sensing techniques for mangrove mapping. Inter. Jour. Remote Sens., 19 (5): pp. 935-956. 25) Husain, K.Z., (1974), An Introduction to the Wildlife of Bangladesh. Dhaka, Bangladesh. 26) Khan, M.S., (1991), Towards Sustainable Development: Conservation of Genetic Resources of Bangladesh, p 35.Ministry of Environment and Forest and National Conservation Strategy of Bangladesh Agricultural Research Council. Dhaka, Bangladesh. 27) Charoen Pokphand Group (CP Group)., (1993), C. P. Shrimp News, a bimonthly publication of C. P. Aquacultural Business Division. 1(1). pp.1-4, Bangkok, Thailand. 28) Encyclopedia Britannica, 2004, Bay of Bengal.(http://www.britannica.com/eb/article? eu=109259) 29) Kelleher, G., Bleakley, C., S. Wells. (eds). (1995) A Global Representative System of Marine Protected Areas Vol. III. Great Barrier Reef Marine ParK Authority, World Bank and World Conservation Union (IUCN), pp. 13, 147. 30) Gong, W.K., Ong, J.E., (2002), Carbon sequestration considerations in the management of mangrove ecosystems. In: Proc. VIII INTECOL International Congress of Ecology on “Ecology in a Changing World”. Seoul, Korea, 11-18 August, 2002. Cho, D.S.(Chief ed.), pp. 67. 31) World Bank (2001), World Development Indicators 2001. World Bank, Washington, pp.396. 32) Chowdhury, A., (1998), Disasters: Issues and Responses, In: Gain, P. (Ed.), Bangladesh Environment: Facing 21st Century, SEHD, Dhaka, Bangladesh. 33) Banglapedia, CD ROM edition, version – 1. 34) Barg, U.C., (1992), Guidelines for the Promotion of Environmental Management of Coastal Aquaculture Development, FAO Fisheries Technical Paper 328. Rome FAO, p.122.

96
35) Shahid, M. A., Hossain, A. Sayeed., Rahman, H., Sarker, M. H., Ahmed, A. N., (1997), Remote Sensing and GIS for Suitable Shrimp Farming Area Selection in Bangladesh, Journal of Remote Sensing and Environment, 1. 36) Shamsul Huda, A.T.M., (1999), Country position paper – Bangladesh. In: Sustainable Development of Deltas, Oudshoorn, H., Schultz, B., Van Urk, A. and Zijderveld, P. (eds), Delft University Press, pp.169-188. 37) Karim, M., (1986), Brackishwater Aquaculture in Bangladesh: A Review FAO/UNDP TA-Project BGD 83-010, Report No. 12, January 1986, p.28. 38) Alam, M.S., Shamsuddin, S.D., Sikder, S., (1990), Application of remote sensing for monitoring shrimp culture development in a coastal mangrove ecosystem in Bangladesh, Twenty-third international symposium on remote sensing of environment, Bangkok, Thailand, April 18-25, pp.109-119. 39) Islam, M.J., Alam, M.S., Elahi, K.M., (1997), Remote sensing for change detection in the Sunderbans, Bangladesh, Geocarto International, 12, pp.91-100. 40) Lillesand, T.M. and Kiefer, R.W., (1994), Remote Sensing and Image Interpretation, John Wiley & Sons, Inc., New York. 41) Shahid, M.A., Pramanik, M.A.H., Jabbar, M.A., Ali, S., (1992), Remote sensing application to study the coastal shrimp farming area in Bangladesh. Geocarto International, pp.2, 5-13. 42) Venkataratnam, L., Thammappa, S.S., Sankar, T.R., Anis, S., (1997), Mapping and monitoring prawn farming areas through remote sensing techniques, Geocarto International pp.12, 23-29. 43) Vibulsresth, S., Ratanasermpong, S., Dowreang, D., Silapathong, C., (1993), Mangrove monitoring using satellite data, TRSC Newsletter pp.10, 12. 45) Chowdhury, A.A.M., (1998), Impact of people participation on coastal forest plantations in the cyclone-prone Bhola island, Bangladesh. Paper presented in Coastal Environmental Improvement in Mangrove/Wetland Ecosystems, 18-23 August 1998, Ranong, Thailand, pp.156-161. 46) Siddiqi, N. A, Shahidullah, M., Hoque, A. K. F., (1994), Present status of Chakoria Sundarban-the oldest mangroves in the sub continent, Bangladesh Journal of Forest Science, Vol. 23(1): pp.26-34. 47) Khan, Y.S.A., Hossain, M.S., Quasem, S., Islam, K.S., (1997), Adaptation of Innovated Technology for Intensive Culture of Shrimp (Penaeus monodon Fabricius, 1798) in Bangladesh. Chittagong University Studies Part II; Science, Vol. 21(1): pp.95-116. 48) SRDI, (1999), Land and Soil Resources utilization index (in Bangla), Chakoria Thana, Cox’s Bazar district, Soil Resources Development Institute, Ministry of Agriculture, Dhaka. 47) Pheng, K.S., Foo L.K., (1989), Detection of Land Use Changes Using Remote Sensing and Proceedings of the Tenth Asian Conference on Remote Sensing, November 23- 29,1989, Kuala Lumpur, Malaysia. 48) Clark, C.D., Ripley, H.T., Green, E.P., Edwards, A.J., Mumby, P.J., (1997), Mapping and measurement of tropical coastal environments with hyperspectral and high spatial resolution data, International Journal of Remote Sensing 18:pp.237-242.

97
49) Born, S.M., Miller, A.H., (1988), Assessing networked coastal zone management programs. Coastal Management, pp.16, 229–243 50) Brammer, H., Asaduzzaman M., Sultana, P., (1993), Effects of Climate and Sea-level Changes on the Natural Resources of Bangladesh. Briefing Ducument No.3, Bangladesh Unnayan Parishad (BUP),Dhaka. 51) Gao, J., (1999), A comparative study on spatial and spectral resolutions of satellite data in mapping mapping mangrove forests. Inter. Jour. Of Remote Sens., 20 (14): pp. 2823-2833. 52) Congalton, R.G., (1991), a review of assessing the accuracy of classifications of remotely sensed data. Remote Sensing of Environment 37: pp.35-46. 53) Gupta, M. C., Krishnarajan, V. P., Nayak, S., (2001), Brackish water aquaculture site selection in coastal tract of Cannore (Kerala) using remote sensing and GIS techniques. Jour. Ind. Soc. Remote Sens., 29 (1&2): pp. 80-83. 54) Mumby, P. J., Clark, C. D., Green, E. P., Edwards, A. J., (1998), Benefits of water column correction and contextual editing for mapping coral reefs. Inter. Jour. Remote Sens. 19 (1): pp.203- 210. 55) Faisal, I.M., Parveen, S., (2004) Food Security in the Face of Climate Change, Population Growth and Resource Constraints: Implications for Bangladesh, Environmental Management 34(4), pp.487-498. 56) Baran, E., (1999), ‘A review of quantified relationships between mangroves and coastal resources’, Phuket Marine Biology Centre Research Bulletin, pp.62, 57–64. 57) Blasco, F., Gauquelin, T., Rasolofoharinoro, M., Denis, J., Aizpuru, M., Caldairou, V., (1998), ‘Recent advances in mangrove studies using remote sensing data’, Marine and Freshwater Research 49(4), pp. 287–296. 58) Salem B. B., El-Cibahy A., El-Raey M., (1995), Detection of land cover classes in agro-ecosystems of northern Egypt by remote sensing, Vol. 16, pp.2581 – 2594. 59) Sharma V. N., Jafrullah, M., Srinivas, U., (2003), GIS in Environmental Studies - An overview, http://www.gisdevelopment.net/application/environment/ Overview/mi03134pf.htm (Acc. Date 2008-03-20) 60) Saravanapavan T., Dennis, G. D., (1995), Satellite Estimation of Environmental Variables by the Contextual Analysis Method: Validation in a Seasonal Tropical Environment, http://www.gisdevelopment.net/aars/acrs/ 1995/ts6/ts6005pf.htm (Acc Date 2008-03-20) 61) Banman, C., (2002), Supervised and Unsupervised Landuse Classification, Emporia State University. 62) Duke, N.C., Pinz´on, Z.S., M., Prada, M.C. T., (1997), ‘Large-scale damage to mangrove forests following two large oil spills in Panama’, Biotropica 29(1), pp.2–14. 63) Ellison, A.M., Farnsworth, E.J., (2001), ‘Mangrove communities’, in M.D. Bertness, S. Gaines and M.E. Hay (eds.), Marine Community Ecology, Sinauer Press, Sunderland, MA, USA, pp.423–442. 64) Pavri, B.E., Chovit, C.J., Solis, M.S., Olah, M.R., Williams, O., (1998), ‘Imaging spectroscopy and the Airborne Visible Infrared Imaging Spectrometer (AVIRIS)’, Remote Sensing of the Environment 65(3),pp. 227–248.

98
65) Alam, M. S., Elahi, K. M., Shamsuddin, S. D., (1989), Remote Sensing for Coastal Land Use Mapping: A Case Study on Shrimp Culture in Paikgacha, Khulna Department of Geography, Jahangirnagar University, Savar, Dhaka, Bangladesh. 66) BBS, (1991), Statistical Year Book of Bangladesh, Dhaka, Government of Bangladesh. 67) Islam, M. S., Islam, M, S., Wahab, M. A., Miah, A. A., Mustafa Kamal, A. H. M., (2003), Pakistan Journal of Biological Sciences 6(24), pp.2058-2067. 68) BBS, (2007), Statistical Year Book of Bangladesh, Dhaka, Government of Bangladesh. 69) Narayan, LRA., (1999), Remote Sensing and it’s Application, University Press (India)
Ltd., pp.1-7.

99
APPENDIX
Questionnaire for the Chakoria Sundarban Household Survey (Purpose of survey: MSc thesis under the department of Computer and Information Science
in the Linköping University, Sweden)
Form Serial Number: ……… Date of Interview: …………………….. Name of Interviewer:……………………. Types of respondent: Farmers/Fisherman/Businessman/Service holder/Housewife/Student 1. Area of interview a. Village: b. Union: c. Upozila: d. District: 2. Respondent’s details a. Name: b. Sex: M/F c. Age: ……. Yrs d. Religion: e. Marital status: Married/Unma./Div/Others f. Education: 3. Details for family members
Sl.No Name Age Sex (M/F) Education Occupation Health 1 2 3 4 5 6 7 8
4. Housing Condition a. Roof: Concrete/Bambooshed/Light fence/Tinshed b. Wall: Concrete/Bamboo/Light fence/Tin/kacha c. Floor: Concrete/Bamboo/kacha/muddy d. Drinking Water Source: Tubewell (Deep/Shallow)/Pond/Sea/River/Rain e. Toilet: Concrete/Kacha/Open/Sanitary Ring. 5. Household Asset a. Total amount of land: .......................... b. Owner of land…………….… c. Lease: b. Landuse category
Sl. No Type of land use Amount How has it been Acquired
Values
1 Homestead area 2 Agricultural area

100
3 Vegetables growing area 4 Pond 5 Barren/Bushes 6 Fallow land 7 Others
c. If landless, please specify the causes (details) ………………………………………………………………………………………………………………………………………………………………………………………………………………………………………………………………………………………………………………………………………………………………………………………………… d. When it (landless) was happen? ………………... yrs. 6. Economic Situation
a. Family expenditure Sl.No Items Economic values
1 Food 2 Cloths 3 Health 4 Education 5 Disaster 6 Recreation 7 Relatives 8 9
b. Family income
Sl. No Sources Amount Economic value Increasing/decreasing 1 Small /Large trade 2 Agricultural 3 Vegetables 4 Services 5 Coral collection 6 Fisheries 7 Daily labour 8 Cattle 9 Poultry 10 Boats 11 Rickshaw 12 Fruits 13 Others

101
c. Yearly income changing rate Sl. No Types 1985 1990 1995 2000 2006 2007
1 Agriculture 2 Fisheries(Natural
/culture)
3 Vegetables 4 Fruits 5 Cattle 6 Poultry 7 WoodCollection 8 Daily labour 9 S/L trade 10 Boats 11 Rickshaw 12 Others
d. If changes occur please specify the causes …………………………………………………………………………………………………………………………………………………………………………………………………………………………………………………………………………… 7. Infrastructures
Sl. No Distance from home km 1 Market 2 Primary School 3 Secondary School 4 College 5 Post office 6 Pacca road 7 Electricity 8
8. Training support
Sl. No Name of training
How many peoples attend
that traning
Duration (M-Day)
Conducted by Incentive Tk./M-Day
1 2 3 4 5
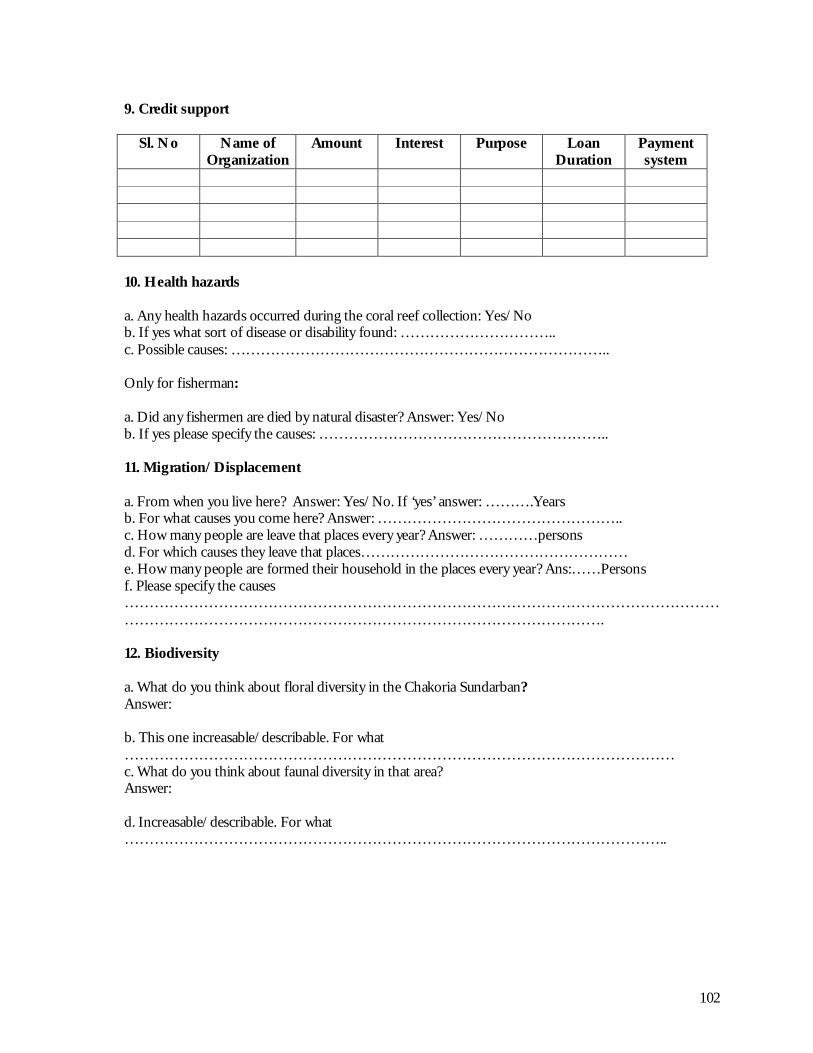
102
9. Credit support
Sl. No Name of Organization
Amount Interest Purpose Loan Duration
Payment system
10. Health hazards a. Any health hazards occurred during the coral reef collection: Yes/No b. If yes what sort of disease or disability found: ………………………….. c. Possible causes: ………………………………………………………………….. Only for fisherman: a. Did any fishermen are died by natural disaster? Answer: Yes/No b. If yes please specify the causes: ………………………………………………….. 11. Migration/Displacement a. From when you live here? Answer: Yes/No. If ‘yes’ answer: ……….Years b. For what causes you come here? Answer: ………………………………………….. c. How many people are leave that places every year? Answer: …………persons d. For which causes they leave that places……………………………………………… e. How many people are formed their household in the places every year? Ans:……Persons f. Please specify the causes ………………………………………………………………………………………………………………………………………………………………………………………………. 12. Biodiversity a. What do you think about floral diversity in the Chakoria Sundarban? Answer: b. This one increasable/describable. For what ………………………………………………………………………………………………… c. What do you think about faunal diversity in that area? Answer: d. Increasable/describable. For what ………………………………………………………………………………………………..
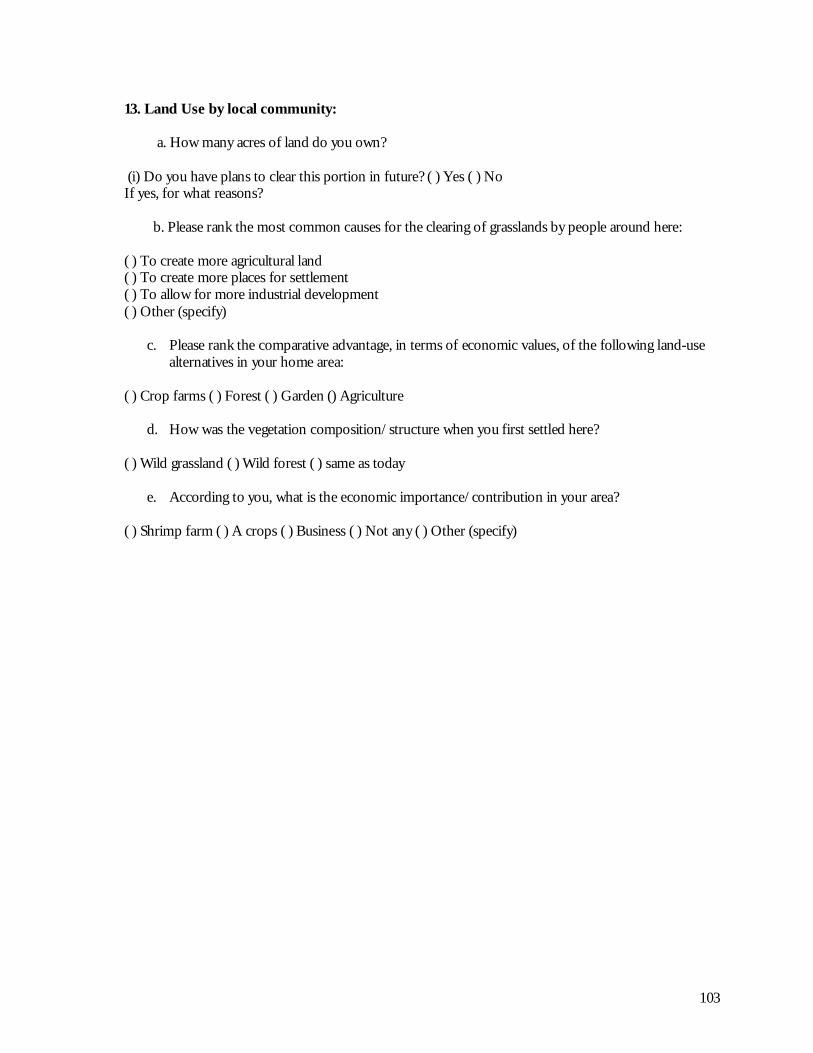
103
13. Land Use by local community: a. How many acres of land do you own? (i) Do you have plans to clear this portion in future? ( ) Yes ( ) No If yes, for what reasons? b. Please rank the most common causes for the clearing of grasslands by people around here: ( ) To create more agricultural land ( ) To create more places for settlement ( ) To allow for more industrial development ( ) Other (specify)
c. Please rank the comparative advantage, in terms of economic values, of the following land-use alternatives in your home area:
( ) Crop farms ( ) Forest ( ) Garden () Agriculture
d. How was the vegetation composition/structure when you first settled here?
( ) Wild grassland ( ) Wild forest ( ) same as today
e. According to you, what is the economic importance/contribution in your area?
( ) Shrimp farm ( ) A crops ( ) Business ( ) Not any ( ) Other (specify)