identifying terms of trade shocks and their transmission … · identifying terms of trade shocks...
TRANSCRIPT

Identifying Terms of Trade Shocks and TheirTransmission to the New Zealand Economy∗
Özer Karagedikli and Gael Price
June 7, 2012
Abstract
Terms of trade shocks are important sources of fluctuations in New Zealandbusiness cycles. In this paper we attempt to identify the drivers of NewZealand’s terms of trade and how those different drivers affect the NewZealand economy. We use a two-block Bayesian structural vector autore-gression to identify shocks to world demand, export and import prices,and commodity prices. We find that export and import prices are mostlyexplained by common shocks that drive them together. We also find thatthe shocks that are specific to New Zealand’s export prices are rare andhave little significant effect on the New Zealand economy. Although eachof the three shocks identified is found to unambiguously increase the termsof trade, the effects of each shock on New Zealand variables are very dif-ferent.
Keywords: terms of trade, VAR, sign restrictions, Bayesian estimation.
JEL classification: E30, F41.
∗The views expressed here are the views of the authors and do not necessarily reflect theviews of our employer, the Reserve Bank of New Zealand. The authors wish to thank HaroonMumtaz, Renee Fry, Konstantinos Theodoridis and seminar participants at the Reserve Bankof New Zealand for helpful comments. All remaining errors are our own. Correspondence:Gael Price, [email protected]
1

1 IntroductionThe swings in New Zealand’s terms of trade have significant implications forthe New Zealand economy both in the medium term and in the longer term.These swings bring a number of challenges for an inflation targeting centralbank. The challenges they bring are further complicated by the so-called ‘com-modity currency’1 nature of the New Zealand dollar, where the New Zealanddollar closely follows the movements in New Zealand’s export commodity prices.
To put in perspective the large swings in New Zealand’s terms of trade overhistory, Figure 1 shows the historical series of the quarterly terms of trade, ex-port and import prices between 1952 and 2011, measured using Statistics NewZealand’s Overseas Trade Indices (OTIs). New Zealand’s terms of trade haveexperienced large cycles as well as some more long-term changes. What is inter-esting, in our view, is the apparent change in the co-movements between exportand import prices. The two series, in US dollar terms, had no apparent co-movement in the 1950s and 1960s, with export prices having huge swings whileimport prices were less volatile. From 1967 onwards the two prices became verysynchronised. Since this co-movement is visible in the world price series, it isalmost independent of changes to the exchange rate regime.2
A 30 quarter moving window correlation between the two prices reveals anegative correlation up until 1967Q3 and then a sudden jump to a positivecorrelation of around 0.65.3 This correlation declines in the second half of the1970s but then rises again in the mid-1980s to around 0.8. Part of this mightbe explained by changes in the composition of the New Zealand’s export andimport price baskets. For example, dairy has become a more important partof the New Zealand’s export price basket than wool and meat, although thisis a recent phenomenon. Nevertheless, we do see the change in the correlationstructure of these two series as an indication of some fundamental change inthe nature of the shocks driving the co-movements in import and export prices.More specifically, we argue that instead of being driven by different and idiosyn-cratic shocks, import and export prices might be driven by common shocks insimilar directions. Our aim is to understand whether this is the case and, if so,what the consequences are for the New Zealand economy.
In this paper we are interested in identifying the drivers of New Zealand’scommodity prices and terms of trade. We would like to understand whether NewZealand’s commodity prices rise and fall due to idiosyncratic shocks specific tocommodities that New Zealand exports, or whether they are driven by somecommon factors that also drive the prices of other commodities, including those
1The term is owed to Chen and Rogoff (2003).
2Our conversion of the New Zealand dollar series, measured by Statistics New Zealand,into US dollars is not perfect. Prices would have been originally measured in foreign-currencyterms, then converted into New Zealand dollars using some prevailing exchange rate. It islikely that the exchange rate then used was not the same as the spot rate series we have usedfor the present conversion. For example, OTI prices today are compiled using New ZealandCustoms Service exchange rates, which are measured with a lag of up to two weeks.
3The apparent structural break in 1967Q4 is robust to a range of currency specifications.
2

that the New Zealand imports. These are important questions since the effectsof changes in export and import prices, and hence the terms of trade, on theNew Zealand economy are dependent on what kinds of shocks are driving suchchanges. Kilian (2009) shows, for example, that in the case of oil prices, theeffects depend on the underlying nature of the shock. For example, the shockmight be a pure New Zealand export price specific shock or a common shockwhere import and export prices increase together.
Figure 1: Terms of Trade, Export and Import Prices
1955 1965 1975 1985 1995 2005 −40
−30
−20
−10
0
10
20
30
40
0.6
0.8
1.0
1.2
1.4
1.6
LevelGrowth rate (RHS)
Ratio Annual %
(a) Terms of trade
1955 1965 1975 1985 1995 2005 −40
−30
−20
−10
0
10
20
30
40
50
60
70
−40
−30
−20
−10
0
10
20
30
40
50
60
70
Export pricesImport prices
Annual % Annual %
(b) Export and import price growth (USD)
For many countries, the most important effects of rising commodity priceswould be about the trade-off between rising inflation and falling output dueto negative income effects. However, for a commodity exporter such as NewZealand the effects are likely to be different and to arrive via different channels.One of the most important effects of a commodity price shock would be felt inexporters’ incomes. This would likely be combined with a negative income ef-
3

fect upon households, particularly if the shock is common to export and importprices. Moreover, New Zealand’s currency is a so-called ‘commodity currency’so shifts in commodity prices and terms of trade may also have significant in-fluence over the exchange rate in New Zealand.
To address these issues we identify three world shocks that, we postulate,drive New Zealand’s export and import prices. Specifically, we estimate a smallopen economy Bayesian vector autoregression (BVAR) to identify the interna-tional shocks with sign restrictions. We identify only international shocks, asNew Zealand is a price taker with its import and export prices determined inthe world market. We find that the most important shocks are the commondemand and supply shocks, with the former being the most dominant. We findthat the shock that is specific to New Zealand’s exports is not a dominant one.Our results indicate that, when thinking about the terms of trade, it is impor-tant to consider how the underlying shocks may affect both export and importprices, as we find that export prices seldom shift in isolation.
The remainder of the paper is structured as follows. Section 2 discussesthe literature and the issue in more detail. Section 3 introduces the empiricalmethodology and the identification strategy. Section 4 presents results and sec-tion 5 concludes.
2 Literature reviewThere has been a long literature on the co-movement of commodity prices (orlack of it), which, to our knowledge, dates back to Pyndyk and Rotemberg (1987)where they term the co-movement in commodity prices “excessive” based on thefundamental drivers of commodity prices. Cashin and McDermott and Scott(1999) on the other hand, by using a concordance measure of co-movement,argue that co-moving commodity prices are a myth, at least in their sample.However, in the last decade or so the co-movement in commodity prices seemsto have been more pronounced. Vansteenkiste (2009) has argued that commod-ity prices do exhibit some strong co-movements, measured using dynamic factormodels wherein a few common factors explain a significant proportion of thevariation across commodity prices.
One of the reasons put forward for the increased co-movement in commod-ity prices over recent years is that they are driven by common factors, possiblylinked to the entry of a number of large emerging economies into the industrial-isation phase, particularly China. The increased dominance of these countriesin world demand for commodities, soft or hard, means that there might well bea shift in the drivers of commodity prices leading to more synchronised pricemovements.
A prototype commodities model would have three fundamental shocks for aparticular commodity (Deaton and Laroque 2003, Kilian 2009): A commodity-specific demand shock, a world demand shock and a commodity-specific supplyshock. A positive commodity-specific demand shock would increase the price of
4
the commodity while having no effect on the prices of other commodities. Inthe case of New Zealand this might be a shock to the demand for dairy productsfrom overseas. Foreign buyers might have a change in their preferences towardsdairy or New Zealand dairy products. This kind of a commodity price shockwould have very different implications for the New Zealand economy from otherkinds of shocks that drive commodity prices.
A world demand shock is a shock to incomes and would also increase theprice of the commodity in question. However, this kind of shock would haveimplications for the prices of all other commodities. In the case of New Zealand,this kind of shock would increase the price of dairy products, for example, andalso increase the prices of imported commodities such as oil. Therefore it is im-portant to empirically find out what would be the likely effects of such a shockon import and export prices, and hence the net effect on the terms of trade.
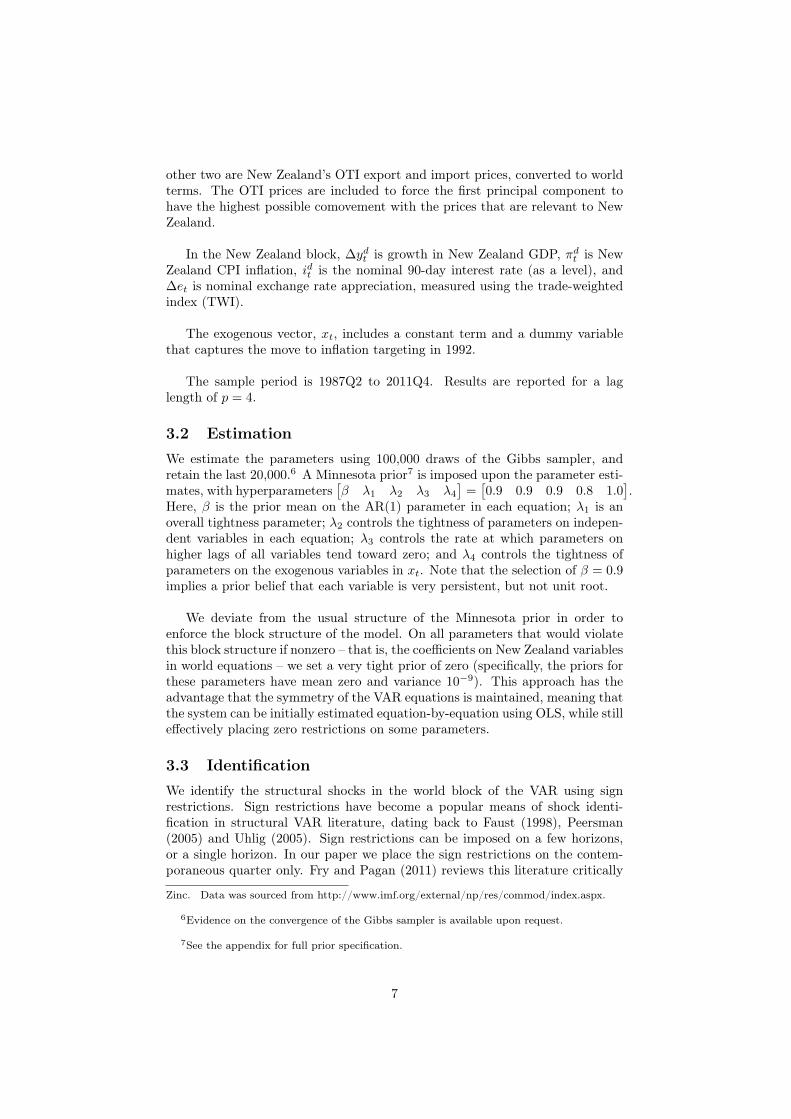
The third shock is on the supply side of the commodity in question. Such ashock is not always easy to identify, mainly due to data restrictions. Data is notavailable on the world production of many commodities at quarterly frequency.The most available production data is for oil, and at monthly frequency this onlygoes back to 1970s. Many metals, minerals and some agricultural commoditieshave production data going back to 1900 at annual frequency, but this is insuf-ficient for detailed commodity supply modelling. As a result, we are unable toidentify a commodity-specific supply shock. Kilian (2009) uses oil productiondata to accurately identify an oil supply shock, but nonetheless finds that worlddemand shocks are dominant.
Jääskelä and Smith (2011) propose an additional shock (or a slight changeto the commodity-specific demand shock) that aims to capture the integrationof emerging economies into the world economy. Such a shock is assumed to putpositive pressure on Australian export prices while putting downward pressureon import prices, due to cheaper imports supplied by these emerging economies,such as China.
3 ModelWe follow the method of Jääskelä and Smith (2011) in estimating the followingsign-restricted VAR:[
wtdt
]= αxt +
p∑k=1
Ak
[wt−kdt−k
]+B
[εwtεdt
]In this notation, wt and dt are respectively vectors of world and domestic
(New Zealand) variables (see section 3.1 below); xt is a vector of exogenousvariables; and B is the contemporaneous impact matrix of the (mutually uncor-related) shock vectors εwt and εdt .
The reduced-form parameter matrices Ak (together with α) are estimatedusing a Bayesian approach with the Gibbs sampler (see section 3.2). Each Ak
5

is restricted to be block lower triangular to enforce the block structure of themodel, so that lags of New Zealand variables do not affect world variables. Thisis to satisfy the assumption that the New Zealand is a price taker and its importand export prices are determined in the world market, with no spillover fromNew Zealand variables to world variables. The impact matrix B is found usinga sign-restriction algorithm, and is also restricted to be block lower triangular,thus extending the small open economy assumption to the contemporaneousperiod (see section 3.3).
3.1 Specification and dataWe specify the data in quarterly growth rates, as follows.
wt = (πct ,∆ywt , π
wt , π
mt , π
xt )′
dt =(∆ydt , π
dt , i
dt ,∆et
)′
xt =
[1 0
]′ before 1992Q1[1 1
]′ subsequently
In the world block, πct is world commodity price inflation, ∆ywt is growth inworld GDP, πwt is world CPI inflation, πmt is import price inflation, and πxt isexport price inflation. For world GDP and world CPI we use the Reserve Bankof New Zealand’s in-house measures, which are constructed using a weighted setof 16 trading partner economies4. Import and export prices are New Zealand’sOTI import and export prices. To abstract from exchange rate fluctuations, weexpress all prices as world prices, with import and export prices deflated by thetrade-weighted index (TWI), and commodity prices by the USD/SDR exchangerate.
Instead of including the terms of trade as variable in its own right, we spec-ify the model to include import and export prices separately. This decision wasmade to reflect our belief that, far from being driven by ‘terms of trade shocks’,the terms of trade are driven by shocks that act independently upon import andexport prices.
For a consistent measure of commodity prices, we use the first principalcomponent extracted from a dataset of 51 price series. Of these, 49 are individ-ual commodity prices measured by the International Monetary Fund5, and the
4The economies used are: United States, euro area, United Kingdom, Canada, Japan,China, India, Philippines, Thailand, Indonesia, Malaysia, Taiwan, Hong Kong, Singapore,Korea, Australia.
5The commodities included are: Aluminum, Bananas, Barley, Beef, Coal, Cocoa beans,Coffee arabica, Coffee robusta, Rapeseed oil, Copper, Cotton, Fishmeal, Groundnuts(peanuts), Hides, Iron ore, Lamb, Lead, Soft Logs, Hard Logs, Maize (corn), Nickel, Oil (av-erage Brent), Crude Oil (petroleum) Brent, Oil (Dubai), Crude Oil (petroleum) WTI, OliveOil, Oranges, Palm oil, Swine (pork), Poultry (chicken), Rice, Rubber, Fish (salmon), HardSawnwood, Soft Sawnwood, Shrimp, Soybean Meal, Soybean Oil, Soybeans, Sugar (free mar-ket), Sugar (U.S. import), Sunflower oil, Tea, Tin, Uranium, Wheat, Wool coarse, Wool fine,
6
other two are New Zealand’s OTI export and import prices, converted to worldterms. The OTI prices are included to force the first principal component tohave the highest possible comovement with the prices that are relevant to NewZealand.
In the New Zealand block, ∆ydt is growth in New Zealand GDP, πdt is NewZealand CPI inflation, idt is the nominal 90-day interest rate (as a level), and∆et is nominal exchange rate appreciation, measured using the trade-weightedindex (TWI).
The exogenous vector, xt, includes a constant term and a dummy variablethat captures the move to inflation targeting in 1992.
The sample period is 1987Q2 to 2011Q4. Results are reported for a laglength of p = 4.
3.2 EstimationWe estimate the parameters using 100,000 draws of the Gibbs sampler, andretain the last 20,000.6 A Minnesota prior7 is imposed upon the parameter esti-mates, with hyperparameters
[β λ1 λ2 λ3 λ4
]=[0.9 0.9 0.9 0.8 1.0
].
Here, β is the prior mean on the AR(1) parameter in each equation; λ1 is anoverall tightness parameter; λ2 controls the tightness of parameters on indepen-dent variables in each equation; λ3 controls the rate at which parameters onhigher lags of all variables tend toward zero; and λ4 controls the tightness ofparameters on the exogenous variables in xt. Note that the selection of β = 0.9implies a prior belief that each variable is very persistent, but not unit root.
We deviate from the usual structure of the Minnesota prior in order toenforce the block structure of the model. On all parameters that would violatethis block structure if nonzero – that is, the coefficients on New Zealand variablesin world equations – we set a very tight prior of zero (specifically, the priors forthese parameters have mean zero and variance 10−9). This approach has theadvantage that the symmetry of the VAR equations is maintained, meaning thatthe system can be initially estimated equation-by-equation using OLS, while stilleffectively placing zero restrictions on some parameters.
3.3 IdentificationWe identify the structural shocks in the world block of the VAR using signrestrictions. Sign restrictions have become a popular means of shock identi-fication in structural VAR literature, dating back to Faust (1998), Peersman(2005) and Uhlig (2005). Sign restrictions can be imposed on a few horizons,or a single horizon. In our paper we place the sign restrictions on the contem-poraneous quarter only. Fry and Pagan (2011) reviews this literature critically
Zinc. Data was sourced from http://www.imf.org/external/np/res/commod/index.aspx.
6Evidence on the convergence of the Gibbs sampler is available upon request.
7See the appendix for full prior specification.
7

and identifies a number of shortcomings, some of which we address in this paper.
We use a sign restriction algorithm similar to that used by Mumtaz andSunder-Plassmann (2010). The identified shocks are specified in terms of theireffects on world-block variables, with the domestic block left unrestricted. Thesign restriction scheme is described in Table 1 below. Although there are fivevariables in the world block, we identify only three shocks. In order to addressthe Fry and Pagan (2011) criticism of multiple shocks, we restrict the otherworld shocks not to have the identical signs to the ones we impose.
Consistent with the small open economy assumption, we restrict the contem-poraneous impact matrix B and lag matrices Ak to be block lower triangular.
Table 1: Sign Restrictions
Commodity World World Import Exportfactor GDP CPI prices prices
World demand + + + + +World supply + – × × +Globalisation × + × – +
The ‘world demand’ shock is a shock that is common to import and exportprices. As discussed in section 1, this shock is specified to increase the prices ofall commodities, as well as New Zealand’s import and export prices. This shockcan be thought of a global business cycle shock: the global economy booms andpositively affects all prices in the contemporaneous period. Consequently, fullspecification of this shock also requires a positive restriction on world activity.
The ‘world supply’ shock is specified in such a way that it may be commonto import and export prices if the data support such commonality. The supplyshock may be thought of as an idiosyncratic shock to commodity prices, whichmay be a commodity supply shock (as discussed in the introduction, commoditysupply shocks cannot be modelled explicitly). This shock increases commodityprices and contemporaneously reduces world GDP via a negative income effect.This shock is also restricted to increase New Zealand’s export prices, while theeffects on world CPI and import prices are left unrestricted.
The third shock drives import and export prices in opposite directions, andhence is the only shock that is specific to New Zealand’s export commodities.This shock, which is labelled a ‘globalisation’ shock by Jääskelä and Smith(2011), attempts to capture the entry of large emerging economies onto theworld stage. Such entry is postulated to have three distinct effects: world GDPincreases as the world economy is now bigger; New Zealand’s export prices in-crease as the new entrant creates excess demand for primary products; NewZealand’s import prices decrease as the new entrant supplies the world with
8

low-cost manufactures. The sign restrictions for this shock are specified accord-ingly, with the other two world variables left unrestricted.
The globalisation shock is the only one that restricts the response of theterms of trade. We remain agnostic on the effect of the other two shocks uponthe terms of trade.
4 ResultsIn this section we discuss the results. We will first look at impulse responses(section 4.1). Then we turn to forecast error variance decompositions (section4.2) and the historical decompositions for selected variables (section 4.3).
4.1 Impulse ResponsesThis section reports impulse responses to the three identified shocks in quar-terly log differences (except for the domestic interest rate, which is reported inpercentage point levels throughout). For each shock and variable we report two‘median’ impulse responses: the pointwise median as a heavy red line, and asa light blue line, the single impulse response nearest to the pointwise medianacross all variables. This is similar to the ‘median target’ measure proposed byFry and Pagan (2011), and is included to ensure that a single model is used tocompare the impulse responses for each shock.
We start with the world demand shock (or world business cycle shock), whichwe identified as a shock that increases world economic activity and prices. Figure2 shows the impulse responses of the world variables to this shock. This shockis associated with an increase in both activity (world GDP) and all the prices:commodity factor, world CPI, and New Zealand’s import and export prices.Interestingly, New Zealand’s import prices rise more than New Zealand’s ex-port prices initially. As a result New Zealand’s terms of trade falls. However,the export price rise is much more persistent, which leads to an increase in theterms of trade in the medium term. This could be due to the fact that NewZealand’s import basket includes oil, which is more volatile in nature and canover-respond to shocks at times.
Figure 3 shows the impulse responses of the domestic New Zealand vari-ables to the same shock. New Zealand’s GDP increases significantly, althoughpossibly not as much as one might have expected. Given New Zealand is acommodity exporter, why is the net effect on New Zealand GDP rather weak?We believe this is due to a few opposing effects. The increase in world prices, aswell as in New Zealand’s own CPI, leads to a negative income effect. Vasishthaand Maier (2011) find evidence for a similar negative income effect in the case ofCanada. Moreover, the increased activity and inflation would lead to a responseby the central bank, as we can see in the rise in domestic interest rates. On topof this, the increased terms of trade and interest rates lead to a rise, althoughshort lived, in the exchange rate, which dampens net exports and puts furtherdownward pressure on GDP.
9

Figure 2: Impulse response functions – World to demand shock
5 10 15 20 25 30−0.2
00.20.40.6
Commodity factor
5 10 15 20 25 30
0
0.5
1
World GDP
5 10 15 20 25 30−0.2
0
0.2
0.4
World CPI
5 10 15 20 25 30−2
02468
Import prices
5 10 15 20 25 30−2
0
2
4
6
Export prices
5 10 15 20 25 30
−2
0
2
Implied ToT
The positive effect coming from a positive demand shock, despite the con-ventional wisdom, is something that has not been found in the data previously.Buckle et al (2002) for example finds a negative terms of trade effect comingfrom the world demand shock, and an insignificant response of New ZealandGDP. Haug and Smith (2007) finds an insignificant response in New ZealandGDP, which becomes significant only after almost 4 years. Karagedikli andThorsrud (2010) finds, by using a factor-augmented VAR, that the net effecton New Zealand GDP was small and negative after the endogenous responsesof the exchange rate and the interest rates in the model. In this paper, on theother hand, we find that the net effect of a world demand shock on New ZealandGDP is positive – but small and short-lived. The weight of evidence, therefore,would appear to indicate that there is little reason to expect a large increase inNew Zealand GDP following a positive world demand shock.
Figure 4 shows the impulse responses to a world supply shock. When there isa world supply shock this is associated with a sharp increase in the commodityfactor and a sharp and persistent fall in world GDP arising from the negativeincome effect. Both import and export prices increase as a result, althoughimport prices were left unrestricted. The world CPI does not increase.
Although the response of world CPI might seem strange, two opposite effectsare in force here. The increased commodity factor would be expected to increaseworld CPI given these items are part of the world CPI basket (although some of
10

the commodity variables we have, such as metals, minerals and energy prices,may not have a direct effect on consumer prices). At the same time, however,the negative income effect shrinks world GDP considerably and hence placesdownward pressure on world CPI from the demand side. Given how persistent isthis fall in world GDP, the almost zero response of world CPI seems reasonable.
Figure 3: Impulse response functions – Domestic to demand shock
5 10 15 20 25 30
−0.5
0
0.5
NZ GDP
5 10 15 20 25 30−0.4
−0.2
0
0.2
0.4
0.6
NZ CPI
5 10 15 20 25 30
−0.5
0
0.5
1
1.5
Interest rate
5 10 15 20 25 30
−2
0
2
4
6
Exchange rate
Figure 5 shows the responses of the domestic New Zealand variables to thesame shock, the supply shock. New Zealand GDP falls sharply in responseto this supply shock. Although New Zealand CPI increases initially, this isvery short lived and the CPI does not change significantly after the first quar-ter. Given there is no persistent inflation effect the central bank lowers interestrates in response to the fall in output.
Figure 6 shows the impulse responses of the world variable to the globalisa-tion shock. This shock increases world activity as well as the commodity factor,although the latter is insignificant. However, the (sign-restricted) changes inexport and import prices are significant, and the net effect on New Zealand’sterms of trade is positive.
11

Figure 4: Impulse response functions – World to supply shock
5 10 15 20 25 30
−1
0
1
Commodity factor
5 10 15 20 25 30
−1.5
−1
−0.5
0
0.5World GDP
5 10 15 20 25 30−1
0
1
World CPI
5 10 15 20 25 30
−5
0
5
Import prices
5 10 15 20 25 30
−5
0
5
10
15Export prices
5 10 15 20 25 30
−5
0
5
10
Implied ToT
Figure 5: Impulse response functions – Domestic to supply shock
5 10 15 20 25 30
−2
−1.5
−1
−0.5
0
0.5
1
NZ GDP
5 10 15 20 25 30−1
−0.5
0
0.5
1
1.5
NZ CPI
5 10 15 20 25 30
−5
−4
−3
−2
−1
0
1
Interest rate
5 10 15 20 25 30
−5
0
5
Exchange rate
12

Figure 6: Impulse response functions – World to globalisation shock
5 10 15 20 25 30−0.1
0
0.1
0.2
Commodity factor
5 10 15 20 25 30
−0.1
0
0.1
0.2
World GDP
5 10 15 20 25 30−0.2
0
0.2
World CPI
5 10 15 20 25 30−1
0
1
Import prices
5 10 15 20 25 30
−0.5
0
0.5
1
1.5
Export prices
5 10 15 20 25 30
0
1
2
Implied ToT
Figure 7 shows the impulse responses of the domestic variables to this shock.Although the signs of the impulse responses seem reasonable, they are all in-significant. Moreover, the magnitudes are very small. As we will see in thehistorical decompositions, this shock does not appear to be supported much inthe data as a key driver of either domestic New Zealand variables or import andexport prices.
Buckle et al (2002) finds that a New Zealand export price shock contributessignificantly to New Zealand’s business cycles. Our results are at odds withtheir results as we find that it is hard to distinguish a shock specific to the NewZealand export prices, as most of the time it is a shock correlated with NewZealand’s import prices. We believe this is one of the distinguishing featuresof our results: one needs to think of the shocks to New Zealand’s export andimport prices as common shocks, as opposed to shocks specific to either importor export prices alone.
4.2 Variance DecompositionWe now turn to forecast error variance decompositions. Figures 8 and 9 showthe contributions of each of the shocks we identified to the unconditional vari-ance of different series in our model. The posterior mode of the retained Gibbs
13

Figure 7: Impulse response functions – Domestic to globalisation shock
5 10 15 20 25 30
−0.1
0
0.1
0.2
NZ GDP
5 10 15 20 25 30−0.15
−0.1
−0.05
0
0.05
0.1
0.15
NZ CPI
5 10 15 20 25 30
−0.2
0
0.2
0.4
Interest rate
5 10 15 20 25 30
−0.5
0
0.5
1Exchange rate
draws is used for the decompositions in both this and the next section.8
There is evidence that the three identified shocks do occur: the shocks weidentified explain about 40 per cent of the variation in the commodity factor.World demand and globalisation shocks explain around 40 and 30 per cent, re-spectively, of the variation in world GDP. The world demand shock also appearsto be the most important shock for both import and export prices, in particularfor import prices (explaining around 60 per cent of the variation).
The identified world shocks are less important for New Zealand variables,as New Zealand shocks have a significant influence in the New Zealand block.For example the world shocks we identified seem to explain only around 20 percent of the variation in the New Zealand GDP, while explaining around 30 percent of the CPI. However, interestingly for the New Zealand dollar exchangerate they account for around 40 per cent of the variation.
8Results for the credible bands are available from the authors upon request.
14

Figure 8: FEVD – World
0 5 10 15 20 25 300
0.2
0.4
0.6
0.8Commodity factor
0 5 10 15 20 25 300
0.1
0.2
0.3
0.4
0.5World GDP
0 5 10 15 20 25 300
0.2
0.4
0.6
0.8World CPI
0 5 10 15 20 25 300
0.2
0.4
0.6
0.8
1Import prices
0 5 10 15 20 25 300
0.2
0.4
0.6
0.8Export prices
World supply World demand Globalisation Other world shocks
Figure 9: FEVD – Domestic
0 5 10 15 20 25 300
0.1
0.2
0.3
0.4
0.5
0.6
0.7
0.8NZ GDP
0 5 10 15 20 25 300
0.1
0.2
0.3
0.4
0.5
0.6
0.7
0.8NZ CPI
0 5 10 15 20 25 300
0.2
0.4
0.6
0.8
1Interest rate
0 5 10 15 20 25 300
0.1
0.2
0.3
0.4
0.5
0.6
0.7Exchange rate
World supply World demand Globalisation Other world shocks NZ shocks
15

4.3 Historical DecompositionsImpulse response functions are useful for understanding the effects of differ-ent shocks in isolation. However, we are also interested in how each of theseshocks might have contributed to the movements of variables at different pointsin history. Historical decompositions are useful in understanding the historicalcontributions of different shocks to each variable.
This section presents decompositions of selected variables over history inquarterly log differences. Again, the draw used is the posterior mode of theretained Gibbs draws. A new identification matrix was re-created from theresiduals of this particular draw, in order to force the decomposed shocks tomatch the residuals in magnitude.
Figure 10 shows the historical decomposition for world GDP. What thisfigure shows is that most of the variation in world GDP over the sample isexplained by two main shocks: world demand and world supply shocks. Inparticular the contribution of world demand shocks to world GDP was verystrong throughout the 1990s and 2000s. The two large global recessions – the1997-1998 recession following the Asian crisis, and the post GFC recession –are both explained by world demand shocks. However, as one would expect,the more recent recession has a large ‘other’ shock element as well, which isprobably due to the financial shocks that we are not taking into account inour model. Moreover, the recoveries from both of these recessions are drivenby world demand shocks. ‘Other shocks’ have been pushing world GDP downin the last year or two, which again we think might be related to financial shocks.
Figure 11 shows the historical decomposition of the terms of trade. Changesin New Zealand’s terms of trade are largely driven by the world demand, worldsupply and globalisation shocks. The strong run-up in New Zealand commod-ity prices prior to the crisis is partly world demand and partly a globalisationstory. However, the fall in the terms of trade following the GFC is largely aworld demand story.
Figure 12 shows the historical decomposition of the commodity factor. In-terestingly this factor is driven by all the shocks we estimate: world demand,world supply and the globalisation shock. The fall in this factor following theAsian crisis recession was mainly due to the world demand factor. However,as with world GDP, the fall in the commodity factor after the GFC is due todemand, globalisation and other shocks as well as some supply shocks.
Finally, in figure 13 we look at the historical decomposition of New ZealandGDP. This would essentially tell us the contributions of the shocks we identi-fied to the New Zealand business cycles over our sample. It appears that theNew Zealand business cycle is driven largely by domestic shocks and partly bythe international shocks we identified. Starting with the 1991 recession NewZealand, we see strong contributions from the domestic shocks and also inter-national shocks. This is consistent with Buckle, Kim and McLellan (2003) thatinternational shocks, domestic non-financial shocks, and monetary policy shockswere the main drivers behind the 1991 recession in New Zealand. The negative
16

role of the domestic shocks can be linked to two major events: one was thedisinflation, the other was the fiscal tightening in the Budget of that year. Thesubsequent recovery also has a significant amount domestic shock component.
Two other interesting episodes are the 1997-1998 and the 2008-2009 reces-sions in New Zealand. The former has a large world demand shock component,which was the fall in demand for New Zealand products in Asia following theAsian crisis. However, at the earlier part of the recession there is also a largeNew Zealand shock element. As discussed in detail in Buckle et al (2002 and2003), these shocks are related to drought and tight monetary policy under theMCI regime.
It is also interesting to see that the boom of the early/mid 2000s is mainlydue to domestic shocks. This is consistent with our belief that the rising houseprices and related wealth effects on consumption, and high inward migration,were the drivers of the domestic economy at the time. These factors werecombined with low interest rates, at least in the earlier part of the boom. Inter-estingly, at the end of the sample, the domestic shocks are pulling New ZealandGDP down while the international shocks are pushing it up. This is consistentwith weakness in the domestic economy stemming from deleveraging, tighterfiscal policy, and natural disasters.
One striking feature of the results as far as the drivers of the New Zealandbusiness cycles are concerned is the large contribution of the domestic shocks,despite New Zealand being a small open economy.
17

Figure10:Historicald
ecom
position
–Termsof
Trade
1989
1991
1993
1995
1997
1999
2001
2003
2005
2007
2009
2011
−3
−2.
5
−2
−1.
5
−1
−0.
50
0.51
1.52
Wor
ld G
DP
Wor
ld s
uppl
yW
orld
dem
and
Glo
balis
atio
nO
ther
wor
ld s
hock
sN
Z s
hock
sIn
itial
con
ditio
n
18

Figure11:Historicald
ecom
position
–Termsof
Trade
1989
1991
1993
1995
1997
1999
2001
2003
2005
2007
2009
2011
−12
−10−
8
−6
−4
−202468
ToT
(im
plie
d)
Wor
ld s
uppl
yW
orld
dem
and
Glo
balis
atio
nO
ther
wor
ld s
hock
sN
Z s
hock
sIn
itial
con
ditio
n
19

Figure12:Historicald
ecom
position
–Com
mod
itiesfactor
1989
1991
1993
1995
1997
1999
2001
2003
2005
2007
2009
2011
−3
−2.
5
−2
−1.
5
−1
−0.
50
0.51
Com
mod
ity fa
ctor
Wor
ld s
uppl
yW
orld
dem
and
Glo
balis
atio
nO
ther
wor
ld s
hock
sN
Z s
hock
sIn
itial
con
ditio
n
20

Figure13:Historicald
ecom
position
–New
Zealan
dGDP
1989
1991
1993
1995
1997
1999
2001
2003
2005
2007
2009
2011
−3
−2
−101234
NZ
GD
P
Wor
ld s
uppl
yW
orld
dem
and
Glo
balis
atio
nO
ther
wor
ld s
hock
sN
Z s
hock
sIn
itial
con
ditio
n
21

5 ConclusionsIn this paper we attempted to identify the drivers of New Zealand’s terms oftrade, and whether those shocks driving New Zealand’s terms of trade are com-mon or idiosyncratic shocks. We found that the common shocks, shocks thatare common to a large number of commodity prices and other prices, are morelikely to be the drivers of the New Zealand’s terms of trade, as opposed to id-iosyncratic shocks. We also find that the world demand shocks are an importantdriver. The globalisation shock, on the other hand, has not played such an im-portant role. This small role for the single export-specific shock highlights thedominance of the co-movement between export and import prices in the data.
Three shocks were identified, all of which have a positive impact upon theterms of trade. However, the effects of the three shocks on New Zealand vari-ables are significantly different: one (world demand) temporarily increases NewZealand’s GDP, another (world supply) temporarily decreases it, and the third(globalisation) has little effect. This divergence of responses, any of which maybe expected if a terms of trade increase is observed in isolation, highlights theimportance of remaining aware of the drivers of terms of trade changes. Noterms of trade increase can be said to unambiguously boost aggregate demandin New Zealand; the effect depends upon the underlying cause of the increasein the terms of trade.
22

AppendixThe Minnesota prior is imposed upon the estimated parameters by setting thefollowing moments for the prior distribution of the parameters:
E[(Ak)ij
]=
{β0
i = j, k = 1otherwise
E [αi] =[0 0
]∀i
V[(Ak)ij
]=
(λ1kλ3
)2
(σiλ1λ2σjkλ3
)2
i = j
i 6= j
V [αi] =
[(σiλ4)
20
0 (σiλ4)2
]∀i
The prior distribution of the parameters is assumed to be normal. We setthe hyperparameters
[β λ1 λ2 λ3 λ4
]=[0.9 0.9 0.9 0.8 1.0
], and
estimate each σi from the residuals of the OLS equations.
The prior distribution of the covariance matrix is assumed to be inverseWishart.
23

ReferencesBuckle, R A, K Kim, H Kirkham, N McLellan and J Sharma (2002), ‘A struc-tural VAR model of the New Zealand business cycle’, New Zealand Treasury,Treasury Working Paper Series 02/26.
Buckle, R A, K Kim and N McLellan (2003), ‘The impact of monetary policy onNew Zealand business cycles and inflation variability’, New Zealand Treasury,Treasury Working Paper Series 03/09.
Cashin, P, C J McDermott and A Scott (1999), ‘The myth of co-moving com-modity prices’, Reserve Bank of New Zealand, Reserve Bank of New ZealandDiscussion Paper Series G99/9.
Chen, Y-C and K Rogoff (2003), ‘Commodity currencies’, Journal of Interna-tional Economics, Elsevier, vol. 60(1), pages 133-160.
Deaton, A and G Laroque (2003), ‘A model of commodity prices after Sir ArthurLewis’, Journal of Development Economics, Elsevier, vol. 71(2), pages 289-310.
Faust, J (1998), ‘Robustness of identified VAR conclusions about money’, Carnegie-Rochester Conference Series on Public Policy, 49, pp 207-244.
Fry, R and A Pagan (2011), ‘Sign restrictions in structural vector autoregres-sions: A critical review’, Journal of Economic Literature, American EconomicAssociation, vol. 49(4), pages 938-60.
Grimes, A (2006), ‘A smooth ride: Terms of trade, volatility and GDP growth’,Journal of Asian Economics 17, 583-600.
Haug, A A and C Smith (2007), ‘Local linear impulse responses for a smallopen economy’, Reserve Bank of New Zealand, Reserve Bank of New ZealandDiscussion Paper Series 07/09.
Jääskelä, J and P Smith (2011), ‘Terms of trade shocks: What are they andwhat do they do?’, Reserve Bank of Australia, Reserve Bank of Australia Re-search Discussion Paper 2011-05.
Karagedikli, O and L A Thorsrud (2010), ‘Shocked by the world: Introducingthe three block open economy FAVAR’, Reserve Bank of New Zealand, mimeo.
Kilian, L (2009), ‘Not all oil price shocks are alike: Disentangling demand andsupply shocks in the crude oil market’, American Economic Review, AmericanEconomic Association, vol. 99(3), pages 1053-69.
Kim, K., 1994. ‘The role of terms of trade shocks in a real business cycle modelof a small open economy’, Victoria University of Wellington, working paper.
Mumtaz, H and L Sunder-Plassman (2010), ‘Time-varying dynamics of the realexchange rate. A structural VAR analysis’, Bank of England, Bank of England
24

Working Paper No. 382.
Peersman, G (2005), ‘What caused the early millennium slowdown? Evidencebased on vector autoregressions’, Journal of Applied Econometrics, vol. 20(2),pages 185-207.
Pyndyk, R S and J Rotemberg (1990), ‘The excess co-movement of commodityprices’, Economic Journal, vol. 100(403), pages 1173-89.
Uhlig, H (2005), ‘What are the effects of monetary policy on output? Resultsfrom an agnostic identification procedure’, Journal of Monetary Economics,52(2a), pp 381-419.
Vansteenkiste, I (2009), ‘How important are common factors in driving non-fuelcommodity prices? A dynamic factor analysis’, European Central Bank, ECBWorking Paper Series No. 1072.
Vasishtha, G and P Maier (2011), ‘The impact of the global business cycle onsmall open economies: A FAVAR approach for Canada’, Bank of Canada, Bankof Canada Working Paper Series 2011-2.
Wells, G and L Evans (1985), ‘The impact of traded good prices on the NewZealand economy’, The Economic Record 61, 421-435.
25