identifying the key characteristics for environmental ...€¦ · call 2014: asset management and...
TRANSCRIPT

Call 2014: Asset Management and Maintenance
Identifying the key characteristics for environmental noise barrier
condition measurements Deliverable D1d and D2d
October 2016
Project Coordinator
Project Partners

Identifying the key characteristics for noise barrier condition measurements, October 2016
Page 2 of 107
Call 2014: Asset Management and Maintenance
Page 3 of 107
Project Nr. 850730
Project acronym: PREMiUM
Project title: Practical Road Equipment Measurement, Understanding and Management
Deliverable D1d and D2d – Identifying the key characteristics for environmental noise barrier measurements
Due date of deliverable: 30.09.2016
Actual submission date: 23.02.2017
Start date of project: 01.10.2015 End date of project: 30.09.2017
Author(s) this deliverable:
R Spielhofer, Denitsa Osichenko (AIT)
D Leal, E Benbow, A Wright, P Morgan (TRL)
Version: draft 1.0

Call 2014: Asset Management and Maintenance
Page 4 of 107
Executive summary
The objective of PREMiUM is to deliver improvements in the ability to manage road equipment by developing guidance that can be implemented by road administrations to improve the management of equipment assets. The types of road equipment that PREMiUM has considered are road markings, road signs, vehicle restraint systems and noise barriers.
This report provides guidance describing the key characteristics of condition that should be monitored and the potential condition monitoring regimes that could be implemented to obtain the data required to understand the condition of noise barriers to support maintenance and asset management decisions at the network level.
Key characteristics and measurement methods for the other three equipment asset types are discussed in separate documents.
PREMiUM wishes to ensure that the proposals for the key survey requirements are aligned with the experience and expectations of stakeholders. Therefore we are issuing this report to stakeholders to invite views on the recommendations that have been made. The project team welcomes comment and views from stakeholders, which will be taken into consideration when confirming the key condition requirements and the survey methodologies.
The PREMiUM project has been let under the CEDR “Call 2014: Asset Management and Maintenance” and funded by the following NRAs: Belgium-Flanders, Finland, Germany, Ireland, Norway, the Netherlands, Sweden, United Kingdom and Austria.
CEDR Call 2014: Asset Management and Maintenance
Page 5 of 107
List of Tables
Table 1: Performance Characteristics .................................................................................. 17
Table 2: Measurements of key condition characteristics for Environmental Noise Barriers .................................................................................................................. 22
Table 3: Recommended measurement methods and recommendations for work required to achieve recommended method ............................................................ 30
Table 4: Standard Requirements ......................................................................................... 33
Table 5: Performance characteristics for noise barriers, associated assessment methods (and related standards) declared values and sample sizes as stated in EN 14388:2005 .................................................................................................. 37
Table 6: Performance characteristics for noise barriers, associated assessment methods (and related standards) declared values and sample sizes as added/updated since EN 14388:2005 .................................................................... 38
Table 7: Categories of airborne sound insulation (as defined in EN 1793-2:2012) ............... 40
Table 8: Categories of airborne sound insulation (as defined in EN 1793-6:2012) ............... 42
Table 9: Characteristic importance ranking, according to the stakeholder review ................ 49
Table 10: Length of each kind of barriers along major roads in Wallonia ............................. 59
List of Figures
Figure 1: Sound reflection / absorption, sound transmission and sound diffraction (Clairbois et al, 2012) ............................................................................................. 17
Figure 2: Methods to monitor environmental noise barriers ................................................. 23
Figure 3: European standards, international standards and UK guidance documents ......... 35
Figure 4: Inventory characteristics results............................................................................ 50
Figure 5: Acoustic ability characteristic results .................................................................... 51
Figure 6: Measurement technologies for monitoring of noise barriers .................................. 56
Figure 7: Inventory of noise barriers using Video (iNovitas, 2017) ....................................... 58
Figure 8: Example for noise barrier, where inspection may be dangerous ........................... 59
Figure 9: Noise barrier protected with VRS .......................................................................... 59
Figure 10: Locations the noise barriers along major roads in Wallonia ................................ 59
Figure 11: List of defects ..................................................................................................... 60
Figure 12: Illustration of the defects ..................................................................................... 60
Figure 13: Working document.............................................................................................. 60
Figure 14: Example of encoding file..................................................................................... 60
Figure 15: Location sheet (left) and Characteristics sheet (right) ......................................... 60
Figure 16: Overview sheet ................................................................................................... 61
CEDR Call 2014: Asset Management and Maintenance
Page 6 of 107
Figure 17: Diagram of the barrier ......................................................................................... 61
Figure 18: In-situ measurement methods of acoustic characteristics of noise barriers ......... 61
Figure 19: Mounting condition for test specimens tested to EN 1793-2 ............................... 62
Figure 20: The ADRIENNE method for measurement of airborne sound insulation ............. 63
Figure 21: Standard set up of the ADRIENNE method for measurement of airborne sound insulation, using a single microphone moved around the 9 microphone positions (source AIT) ............................................................................................ 64
Figure 22: The QUIESST Measurement Method for Airborne Sound Insulation .................. 64
Figure 23: Standard set up of the QUIESST Measurement Method for Airborne Sound Insulation ............................................................................................................... 65
Figure 24: Correlation between laboratory and in-situ method for sound insulation measurements over all barrier types available in in the database for a frequency range according to the standards EN 1793-2 and prEN 1793-6 (top) and for a variable frequency range (bottom). ......................................................... 65
Figure 25: Mounting condition for test specimens tested to EN 1793-1 ............................... 66
Figure 26: The ADRIENNE method for measurement of Sound Reflection according to CEN/TS 1793-5 ..................................................................................................... 67
Figure 27: Standard setup of the Adrienne method: the equipment is shown during the sound absorption measurement (left) and during the free field measurement (right) according to CEN/TS 1793-5 (source AIT) .................................................. 68
Figure 28: The QUIESST Measurement Method for in-situ Sound Reflection ...................... 68
Figure 29: Standard setup of the QUIESST Measurement Method for in-situ Sound Reflection .............................................................................................................. 69
Figure 30: Correlation between laboratory and in-situ method for sound reflection/absorption measurements over all barrier types: frequency range according to the standards EN 1793-1 and CEN/TS 1793-5 (left) and variable frequency range (right). ......................................................................................... 70
Figure 31: Comparison between QUIESST method (red line) and CEN/TS 1793-5 (blue line) for a specific concrete barrier (left), green barrier with absorbing material surface (right); the two measurement methods have been performed on the same barrier. ......................................................................................................... 71
Figure 32: Correlation between single number ratings of the in-situ method CEN/TS 1793-5 and the new QUIESST method (draft standard for EN 1793-5). ................. 71
Figure 33: Comparison between frequency spectra of the in-situ method CEN/TS 1793-5 (blue lines) and the QUIESST method (red lines) for all test samples. ................ 71
Figure 34: The measurement equipment by the new barrier (built 2005, left) and by the old barrier (built 1994, right) ................................................................................... 71
Figure 35: Average of the reflection index RI for all measurements and standard deviation for the new and the old barrier (data and polynomial interpolations) ....... 71
Figure 36: In-situ measurement of sound diffraction ............................................................ 71
Figure 37: Standard set up of the in-situ measurement of sound diffraction......................... 71
CEDR Call 2014: Asset Management and Maintenance
Page 7 of 107
Figure 38: Visual inspection detect obvious defect (left) and dynamic measurement (right) ..................................................................................................................... 71
Figure 39: Damaged noise barrier ....................................................................................... 71
Figure 40: Noise barrier and vehicle restraint system .......................................................... 71
CEDR Call 2014: Asset Management and Maintenance
Page 8 of 107
Table of contents
Executive summary ............................................................................................................... 4
1 Introduction and purpose of this document ................................................................... 10
2 Summary recommendations for the key characteristics of noise barrier condition that should be monitored ............................................................................................................ 13
2.1 Noise Barriers ....................................................................................................... 13
2.2 Knowledge Gathering and Consultation ................................................................ 13
2.3 Key Data - Inventory.............................................................................................. 13
2.4 Key data – condition .............................................................................................. 16
2.5 Key Characteristic 1: Acoustic Ability – In-situ Airborne Sound Insulation ............. 18
2.6 Key Characteristic 2: Acoustic Ability – In-situ Sound Absorption/Reflection ......... 19
2.7 Key Characteristic 3: Structural Integrity – Vibration and Fatigue .......................... 20
2.8 Key Characteristic 5: Safety – Impact from Collision ............................................. 20
2.9 Key Characteristic 6: Structural Integrity – Resistance to Loads ............................ 20
2.10 Characteristic : Acoustic Ability - Sound Diffraction ............................................... 21
2.11 Characteristic: Acoustic Ability – Insertion Loss ..................................................... 21
2.12 Graffiti and Dirt ...................................................................................................... 21
2.13 Summary ............................................................................................................... 22
3 Summary recommendations for potential methods to monitor environmental noise barriers ................................................................................................................................ 23
3.1 Monitoring environmental noise barriers ................................................................ 23
3.2 Knowledge Gathering and Consultation ................................................................ 23
3.3 Key Data - Inventory.............................................................................................. 24
3.4 Key Characteristic: Acoustic Performance – Airborne Sound Insulation ................ 25
3.5 Key Characteristic: Acoustic Performance – Sound Absorption/Reflection ............ 26
3.6 Key Characteristic: Sound diffraction ..................................................................... 27
3.7 Key Characteristic: Structural Integrity – Vibration and Fatigue ............................. 28
3.8 Key Characteristic: Safety – Impact from Collision ................................................ 29
3.9 Key Characteristic: Structural Integrity – Resistance to Loads ............................... 29
Summary .................................................................................................................. 29
3.10 ................................................................................................................................. 29
4 Technical Background – the Current Standards and Approach for understanding Noise Barrier Condition ................................................................................................................. 32
4.1 Information sources ............................................................................................... 32
4.2 Review of standards and guidance documents addressing the performance of noise barriers ............................................................................................................................ 35

CEDR Call 2014: Asset Management and Maintenance
Page 9 of 107
4.3 Review of Practice in the Assessment of the Performance of Noise Barriers ........ 46
4.4 Summary and Recommendations ......................................................................... 52
5 Technical Background – Methods for Measuring the Condition of Noise Barriers ......... 54
5.1 Information Gathering ............................................................................................ 54
5.2 Measuring the inventory of noise barriers .............................................................. 57
5.3 Summary of measuring acoustic performance ....................................................... 61
5.4 Measuring the Acoustic Ability – airborne sound insulation ................................... 62
5.5 Measuring the Acoustic Ability – Sound Reflection ................................................ 66
5.6 Measuring the Acoustic Ability – Sound Diffraction ................................................ 71
5.7 Measuring the Structural Integrity – Vibration and Fatigue .................................... 71
5.8 Measuring the Safety characteristic – Impact from Collision .................................. 71
5.9 Measuring the Structural Integrity – Resistance to Loads ...................................... 71
6 Definitions .................................................................................................................... 71
7 References ................................................................................................................... 71
Appendix A: NRA Questionnaire ......................................................................................... 71
Appendix B: Survey Provider Questionnaire ........................................................................ 71

CEDR Call 2014: Asset Management and Maintenance
Page 10 of 107
1 Introduction and purpose of this document
The trans-national research programme “Call 2014: Asset Management and Maintenance” was launched by the Conference of European Directors of Roads (CEDR). CEDR is an organisation which brings together the road directors of 25 European countries. The aim of CEDR is to contribute to the development of road engineering as part of an integrated transport system under the social, economical and environmental aspects of sustainability and to promote co-operation between the National Road Administrations (NRA).
The participating NRAs in this Call are Belgium-Flanders, Finland, Germany, Ireland, Norway, the Netherlands, Sweden, United Kingdom and Austria. As in previous collaborative research programmes, the participating members have established a Programme Executive Board (PEB) made up of experts in the topics to be covered. The research budget is jointly provided by the NRAs who provide participants to the PEB as listed above.
Road operators draw on their knowledge of their assets to efficiently manage their road networks. This includes information on asset inventory, asset condition and information on the most appropriate maintenance approach to take for those assets. Although there has been significant growth in the use of objective tools to measure and interpret pavement condition at the network level, this has not been matched for the assessment of road equipment. Previous ERANet research on the assessment of equipment assets has found that the management of equipment such as road signs, lighting, markings, restraint systems, noise barriers and Variable Message Signs is often excluded from the integrated management process. There is a clear need to deliver improvements in the ability to manage these assets.
The objective of PREMiUM is to deliver improvements in the ability to manage road equipment by developing guidance that can be implemented by road administrations to improve the management of equipment assets. In summary the underlying objectives of PREMiUM are:
To establish the condition characteristics a road administration should include in their asset management strategy for these road equipment assets in order to manage the risks of loss of performance of these assets;
To help road owners to understand and balance network level and project level management of these assets so that they can establish a practical monitoring regime that enables the condition to be understood and the risks to be managed;
To identify the existing and emerging measurement tools that could be applied by road owners to understand, monitor and manage these assets;
To propose objective measures that could be applied to understand and quantify the performance of these assets, which are feasible for use at the network level;
To hence enable road administrations to establish a maintenance regime that minimises risks and yet enables the road administration to focus maintenance expenditure on these assets in an efficient manner.
The types of road equipment that PREMiUM will consider are road markings, road signs, vehicle restraint systems and noise barriers.
This has been/is being achieved through four technical work packages:

CEDR Call 2014: Asset Management and Maintenance
Page 11 of 107
WP1 Understanding the Asset: The development of better understanding of the equipment asset and the key characteristics of the asset which need to be monitored to manage the asset;
WP2 Monitoring the Asset: How these key characteristics can be monitored across all equipment assets (i.e. on the network level);
WP3 Evaluating Condition: How this data can be translated into the information required to determine the condition and hence evaluate the risk of failure;
WP4 Management of the Asset: How the information can be used within a management strategy.
The approach taken for WP1 has been to combine technical expertise drawn from the project consortium with a direct stakeholder consultation, to establish current practice and existing and emerging standards. A review of these current practices and standards and consideration of what the objective of the monitoring is and how it will contribute to asset management has been used to propose the key characteristics of condition that need to be understood for each of the equipment asset types.
For WP2, the current measurement practice has been reviewed, along with emerging technologies, by liaising with survey consultants and equipment developers/providers. This has been used to determine how the key characteristics of condition could be monitored and measured at a network level, along with the feasibility of applying the monitoring.
This report provides summary guidance describing the key characteristics of condition that should be monitored to understand the condition of noise barriers to support maintenance/asset management decisions at the network level. This summary guidance is presented in section 2, whilst more detailed technical background supporting the recommendations is given in section 4.
This report also provides summary guidance on potential condition monitoring regimes that could be implemented to provide the data required to understand the condition of noise barriers to support maintenance/asset management decisions at the network level. These are discussed in section 3, with more technical background given in section 5.
PREMiUM wishes to ensure that the proposals for the key survey requirements are aligned with the experience and expectations of stakeholders. Therefore we are issuing this report to stakeholders to invite views on the recommendations that have been made. The project team welcomes comment and views from stakeholders, which will be taken into consideration when confirming the key condition requirements summarised in section 2. Comments will also be welcomed on the survey methodologies proposed in section 3, which will be used to support recommendations for implementation trials of these methods.
As a guide to this document, it contains the following key sections:
1. Introduction and purpose of this document: This introduction section.
2. Summary recommendations for the key characteristics of noise barrier condition that should be monitored: Here we present our summary recommendations for the key data required to understand noise barrier condition.
3. Summary recommendations for potential methods to monitor environmental noise barriers: Here we present our summary recommendations on the methods that are/could be used to obtain the key data.

CEDR Call 2014: Asset Management and Maintenance
Page 12 of 107
As noted above, Section 2 and Section 3 present the summary recommendations of this work. Detail on the technical background leading to these recommendations is then presented in Section 4 and Section 5 as follows:
4. Technical Background – the Current Standards and Approach for understanding Noise Barrier Condition: This section presents a review of current standards employed in Europe and elsewhere, which we have drawn upon in developing our recommendations.
5. Technical Background – Methods for Measuring the Condition of Noise Barriers: This section presents a review of current and emerging measurement technique and proposes potential condition monitoring regimes that could be implemented for noise barriers.
Finally, Section 6 (Definitions) presents a summary of the definitions of technical terms used in this document.

CEDR Call 2014: Asset Management and Maintenance
Page 13 of 107
2 Summary recommendations for the key characteristics of noise barrier condition that should be monitored
2.1 Noise Barriers
A noise barrier is a structure placed alongside the edge of a carriageway which obstructs the direct transmission of airborne sound emanating from road traffic. Its primary function is to mitigate the noise exposure, generated by road users, to vulnerable areas such as residential settlements, recreational areas and other environments sensitive to noise pollution. Noise barriers can also act as a visual screen.
A noise barrier is just one type of ‘road traffic noise reducing device’ (NRD); NRDs are devices designed to reduce the propagation of traffic noise away from the road environment. Other types of NRD, as defined in EN 14388 (the European harmonised specification standard for NRDs) include:
Cladding: An NRD attached to a wall or other structure which reduces the amount of reflected sound.
Covers: NRDs which either span or overhang the highway.
Added devices: Added components that enhance the acoustic performance of the original NRD by acting primarily on diffracted sound, i.e. these are typically components mounted close to or on to the top of a conventional noise barrier.
2.2 Knowledge Gathering and Consultation
To understand current industry practice, a survey consultation of strategic road administrators/asset managers and asset inspection survey or equipment providers was proposed and undertaken. Two sets of questionnaire were designed to engage with these two groups of stakeholders (see Appendices A & B for the questionnaires used). A review of standards and guidance documents for noise barriers was undertaken prior to this to identify any objective characteristics that could relate to the performance and condition of the asset (see section 4.2).
The questionnaire for asset managers aimed at understanding their current approach to monitoring and managing their noise barriers (see section 4.3). It also suggested a list of characteristics that are required to be measured, as highlighted in the standards review, and asked participants to rank each one’s importance for efficiently managing the asset. Consultation with these stakeholders, and consultation with experts (in the project team or colleagues), has been used to propose the following key data requirements for a network level noise barrier condition surveys.
The second questionnaire was developed and distributed to survey and equipment providers in order to understand their current method of inspection, what data they record and the technologies they employ to do so. This is discussed further in sections 4 and 5.
2.3 Key Data - Inventory
Throughout the consultation with NRAs it was found that the most fundamental information to effectively manage an asset is that contained within the inventory. A robust and accurate inventory is an essential tool for providing engineers and decision makers with key

CEDR Call 2014: Asset Management and Maintenance
Page 14 of 107
information about the assets on their road network. Up-to-date inventories are a prerequisite, for all types of assets, for ensuring that continual gains in network quality are made in an efficient way. A vigorous and effective asset management strategy cannot be designed nor implemented if a road authority does not have knowledge of the most basic features and records of their assets (i.e. you cannot manage an asset if you don’t know where it is).
If maintenance, renewal or modernisation of an asset is required, decision makers must be able to efficiently evaluate the specific needs of each part of the asset. To achieve this, a complete inventory is the starting point.
2.3.1 What should an Inventory for Noise Barriers contain?
For any particular asset, such as safety barriers, a well-structured inventory should contain a number of key characteristics, such as:
Location Referencing
Acoustic Type (Absorptive/Reflective)
Acoustic Element Composition
Physical description of the barrier: Post Type (if used) and Mounting Description, fitment i.e. panels mounted in between posts or mounted onto posts.
Date of Installation/Contract ID/Scheme
Date and Details of Previous Inspections
Physical Condition Reports
Geometric Properties
Manufacturer Declared Initial Performance Characteristics
Details of Complaints.
The stakeholder consultation highlighted that even though this information is critical for understanding the performance of the asset, inventories remain out-of-date and incomplete. If inventory records are incomplete or out-of-date there are a number of ways to gather the relevant data to populate them.
Whether an inventory needs to be created or updated and developed, there will be a need to obtain the information required for population.
A location reference refers to the physical location of the asset, using geographical co-ordinates (e.g. OSGR longitude and latitude). The inventory should also contain other useful descriptions of the asset’s location, such as: unique network identification code (i.e. area and section marker), road name and number, lane number, carriage way position (nearside or offside), chainage, marker posts, and general geographic references (county/province). The consultation identified a number of high/low speed, office based/on-site techniques available to determine the precise location reference and the type of system and components used, as discussed in section 5. If on-site methods are adopted, these can be combined with detailed inspection to make efficient use of time.
The acoustic element composition refers to the main noise abatement material used in the construction of the noise barrier. Such materials include: timber, metallic, concrete, transparent, plastic/composite, and less commonly may include materials such as soil and vegetation. The material selection can be influenced by: local environmental conditions, location, aesthetics, the barrier’s physical dimensions, and so on.
CEDR Call 2014: Asset Management and Maintenance
Page 15 of 107
It is recommended that the post type, e.g. timber, steel etc. should also be recorded where posts are used, together with details of how the acoustic elements are mounted, e.g. panels mounted in between posts or directly onto posts.
The type of acoustic element used for the noise barrier can be initially inventoried from the construction drawings/documents, if such historical records exist. If records cannot be easily obtained, the site can be visited and manually assessed, however, this may require some form of traffic management to ensure safety and may be more difficult where barriers are installed on the tops of embankments or steep slopes. A less demanding method would be to employ a desk-top survey, exploiting online maps, video footage, satellite imagery (e.g. Google Street View) or perhaps drones fitted with cameras (NB. care would be required in the latter case depending upon the altitude of the drone, its proximity to traffic and overhead structures and/or cables and the relative position of the operator relative to the drone). It is noted that any method using visual imagery may require views of both sides of the noise barrier to accurately determine the type, e.g. to distinguish between single-leaf and double-leaf timber panels).
The date a system was constructed/installed should be held in a standard format (yyyy/mm/dd). If unknown it can be obtained through a review of historical records such as contract document and scheme bids/awards. It may also be possible for an expert to estimate the age of the asset based on a site visit.
The geometric properties are the physical parameters of the noise barrier, such as length, width, height, distance from carriageway, and so on. These characteristics could be inventoried via historical records or on-site inspection. Whilst high-speed options are available it is recommended that the physical parameters are measured during a site visit with the aid of a tape measure, or more accurately by using a total station, which removes the physical impracticalities of a measuring tape.
Physical condition reports are records of previous inspections that concern the barrier’s structural and aesthetic condition. These reports should be compiled on an on-going basis, or obtained from a review of historical records. Records should be updated as often as inspections are carried out. The inventory does not need to hold the full report itself, but instead should hold a reference to the previous report so it can be easily identified and quickly found if needed. It may be useful for the inventory to hold a general rating of the barriers structural condition from its previous inspection, i.e. scored 0-5/Poor-Excellent, so at a glance decision makers have an estimate of the barrier’s structural integrity.
An inventory should also hold a date log of previous maintenance interventions (and provide references to the appropriate documents). Further to this, it should also briefly describe the nature of each intervention. The inventory should also hold details of the contract/scheme ID. The above information can only be compiled, if not already done so, through a review of historical records and documentation.
If records are available, reference should also be made to the manufacturer’s Declaration of Performance (DoP) for the noise barrier. Preparation of such a document by the distributor/importer/manufacturer is required under the Construction Products Regulation 2011 (European Commission, 2011); the DoP contains performance information on the essential performance characteristics as defined in EN 14388 and included as part of the product’s CE mark. However, it must be noted that it is feasible for a manufacturer to declare performance values for only a single essential property and declare all other characteristics as ‘NPD’ (No Performance Determined’); as such it is recommended that the client specify prior to procurement which essential characteristics in EN 14388 performance values are required for, together with any other performance characteristics deemed to be appropriate.
CEDR Call 2014: Asset Management and Maintenance
Page 16 of 107
The inventory should also reference the manufacturer’s installation/inspection/maintenance guidance where appropriate.
An inventory should keep records of complaints that have been lodged against the noise barrier. This inventory characteristic requires a reporting system to be set up by the road administrator. If complaints are made by road users or the general public (i.e. local populations affected by noise pollution) a register should be kept for how many complaints have been received for individual noise barriers. The information held within such complaints could be extremely useful for an authority. Complaints may indicate if the structure has been recently damaged (missing panels affecting noise abatement, graffiti affecting aesthetics). It may also act as an early warning system for acoustic and non-acoustic performance failures. This log should be kept up-to-date and efforts should be made to ensure the issues within the complaint have been addressed. The inventory should hold a brief description of the nature of the complaint: structural damages; excessive noise; aesthetics (graffiti/dirt), etc. It should also highlight the date the complaint was made, the location of the noise barrier the complaint is referring to, and if the complaint has been addressed or not.
2.4 Key data – condition
The assessment of a noise barrier’s condition needs ideally to consider both
Extrinsic characteristics: Whether the noise barrier is doing the job that it was installed for, i.e. whether it is providing adequate noise reduction at those noise-sensitive receivers the barrier was installed to protect.
Intrinsic characteristics: The performance of the individual components or materials; these are the characteristics typically addressed within EN 14388.
Extrinsic characteristics are likely to be less sensitive to changes in condition than intrinsic characteristics, particularly if the noise-sensitive receiver is not in close proximity to the barrier.
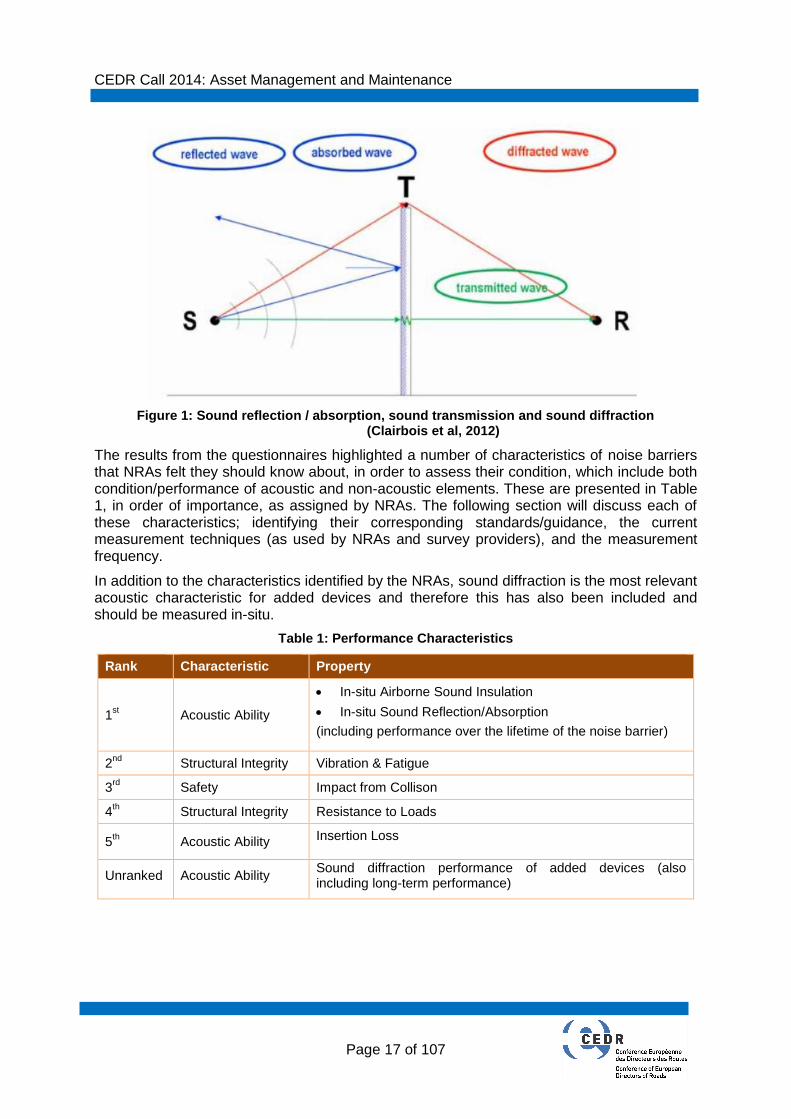
The acoustic performance of noise barriers are affected by various mechanisms, as illustrated in Figure 1.
1. Diffraction: the noise barrier acts as an obstacle to the sound propagation: however, a part of the sound wave passes over the devices: it diffracts on its top edge and then propagates to the protected side of the device. The sound diffracted over the top of the noise barrier is the most important factor limiting its acoustic performance. Path length difference is an important parameter affecting the performance and therefore the height of the barrier relative to the screening position is a significant characteristic.
2. Transmission: where the sound wave reaching the exposed side of the noise barrier transmits through the device itself: the aim of the noise barrier being to play as an obstacle to the sound propagation, this transmitted energy has to be as low as possible.
3.1 Reflection: where the sound wave reaching the exposed side of the noise barrier partly reflects on it, whilst some is absorbed: the reflected sound can the affect the facing areas;
3.2 Absorption: The part of the sound wave that is absorbed by the noise barrier. This property can only be measured in laboratory using a reverberation chamber.
CEDR Call 2014: Asset Management and Maintenance
Page 17 of 107
Figure 1: Sound reflection / absorption, sound transmission and sound diffraction (Clairbois et al, 2012)
The results from the questionnaires highlighted a number of characteristics of noise barriers that NRAs felt they should know about, in order to assess their condition, which include both condition/performance of acoustic and non-acoustic elements. These are presented in Table 1, in order of importance, as assigned by NRAs. The following section will discuss each of these characteristics; identifying their corresponding standards/guidance, the current measurement techniques (as used by NRAs and survey providers), and the measurement frequency.
In addition to the characteristics identified by the NRAs, sound diffraction is the most relevant acoustic characteristic for added devices and therefore this has also been included and should be measured in-situ.
Table 1: Performance Characteristics
Rank Characteristic Property
1st Acoustic Ability
In-situ Airborne Sound Insulation
In-situ Sound Reflection/Absorption
(including performance over the lifetime of the noise barrier)
2nd
Structural Integrity Vibration & Fatigue
3rd
Safety Impact from Collison
4th Structural Integrity Resistance to Loads
5th Acoustic Ability Insertion Loss
Unranked Acoustic Ability Sound diffraction performance of added devices (also including long-term performance)
CEDR Call 2014: Asset Management and Maintenance
Page 18 of 107
2.5 Key Characteristic 1: Acoustic Ability – In-situ Airborne Sound Insulation
Definition: The airborne sound insulation performance of a noise barrier is a measure of its ability to reduce sound transmission through it (see Figure 1 in Section 2.4). Long-term performance addresses how the airborne sound insulation changes over time.
Standard/Guidance Document: EN 1793-6:2012 is the most recently published Standard associated with the assessment of this characteristic. With regards to the assessment of long-term airborne sound insulation performance, EN 14389-1:2015 is the most recently published Standard.
Note: These Standards are not referred to in EN 14388:2005 which is the current legally enforceable edition of the harmonised specifications; that document refers to EN 1793-2:1997 for the assessment of airborne sound insulation performance (which uses a completely different test method to EN 1793-6:2012), and an earlier version of EN 14389-1 (prEN 14389-1, which characterises long-term acoustic performance in a different way); a manufacturer’s Declaration of Performance for their noise barrier product will therefore only be required to address acoustic performance with respect to these older Standards.
Until the next revision of EN 14388 is published (provisionally in 2019), any Client wishing to specify performance requirements to EN 1793-6:2012 and EN 14389-1:2015 would be required to specifically do so in their own specifications, contract documents, etc.
Measurement Technique: Measurements of airborne sound insulation performance in accordance with EN 1793-6:2012 (expressed using the single number rating DLSI) can be performed in situ on roadside noise barriers or (typically for product characterisation) on noise barriers purposely constructed for testing and built as it would be in a real-world application, using an electro-acoustic system. In contrast, measurements in accordance with EN 1793-2:1997 are conducted in a reverberation room using a test specimen assembled in the aperture of the reverberation room.
Assessments of long-term performance in accordance with EN 14389-1:2015 are not typically based on measurements but rather on expert judgement in terms of the change in performance at the end of the barrier’s working life (i.e. the change in DLSI compared to when the barrier is newly installed) for specified sets of environmental conditions, i.e. no information is declared on performance values during the barrier’s working life. In contrast, prEN 14389-1 declares the change in sound insulation performance after 5, 10 15 and 20 years for specified sets of environmental conditions based on expert judgement or measurements using an earlier version of the EN 1793-6:2012 test method.
The accuracy of long-term performance estimates might be, over time, validated by in situ measurements.
Measurement Frequency: Following installation for all barrier types (if required for conformity of production checks/contract compliance checks), then:
1, 3 and 5 years after installation and then every 5 years after that, for timber barriers, or other barriers where performance might be expected to degrade.
1 year after installation and then every 5 years after that for all other barriers.

CEDR Call 2014: Asset Management and Maintenance
Page 19 of 107
2.6 Key Characteristic 2: Acoustic Ability – In-situ Sound Absorption/Reflection
Definition: The sound reflection performance of a barrier is a measure of its ability to reflect the sound energy when sound waves are encountered, as opposed to absorbing the energy. Measuring sound reflection or absorption gives comparable information about a noise barrier (they are complementary measures) and thus these two characteristics have been considered together.
Standard/Guidance Document: EN 1793-5:2016 is the most recently published Standard associated with the assessment of sound reflection. With regards to the assessment of long-term sound reflection performance, EN 14389-1:2015 is the most recently published Standard.
Note: These Standards are not referred to in EN 14388:2005 which is the current legally enforceable edition of the harmonised specifications; that document refers to EN 1793-1:1997 for the assessment of sound absorption (which uses a completely different test method to EN 1793-5:2016), and an earlier version of EN 14389-1 (prEN 14389-1, which characterises long-term acoustic performance in a different way); a manufacturer’s Declaration of Performance for their noise barrier product will therefore only be required to address acoustic performance with respect to these older Standards.
Until the next revision of EN 14388 is published (provisionally in 2019), any Client wishing to specify performance requirements to EN 1793-5:2016 and EN 14389-1:2015 would be required to specifically do so in their own specifications, contract documents, etc.
Measurement Technique: Measurements of sound reflection performance in accordance with EN 1793-5:2016 (expressed using the single number rating DLRI) can be performed in situ on roadside noise barriers or (typically for product characterisation) on noise barriers purposely constructed for testing and built as it would be in a real-world application, using an electro-acoustic system. In contrast, measurements in accordance with EN 1793-1:1997 are conducted in a reverberation room using a test specimen assembled flat on the floor of the reverberation room.
Assessments of long-term performance in accordance with EN 14389-1:2015 are not typically based on measurements but rather on expert judgement in terms of the change in performance at the end of the barrier’s working life (i.e. the change in DLRI compared to when the barrier is newly installed) for specified sets of environmental conditions, i.e. no information is declared on performance values during the barrier’s working life. In contrast, prEN 14389-1 declares the change in sound insulation performance after 5, 10 15 and 20 years for specified sets of environmental conditions based on expert judgement or measurements using an earlier version of the EN 1793-5:2016 test method.
The accuracy of long-term performance estimates might over time be validated by in situ measurements.
Measurement Frequency: Following installation for all barrier types (if required for conformity of production checks/contract compliance checks), then:
1, 3 and 5 years after installation and then every 5 years after that, for absorptive timber barriers, or other barriers where performance might be expected to degrade.
1 year after installation and then every 5 years after that, for all other barriers.
CEDR Call 2014: Asset Management and Maintenance
Page 20 of 107
2.7 Key Characteristic 3: Structural Integrity – Vibration and Fatigue
Definition: Vibration and Fatigue relates to the structural integrity of the barrier over a long period of time. Fatigue is eventually caused by cycles of pressure differences from passing vehicles, relative to the distance to and geometry of the noise barrier, essentially caused by aerodynamic forces.
Standard/Guidance Document: EN 14389-2:2015, EN 1794-1 / Eurocode 2
Measurement Technique: There are currently no direct measurement techniques available to objectively assess fatigue, outside of a subjective visual inspection carried out by a structural engineer. There are indirect methods but these require extensive input data and the results may not reflect the situation in-situ.
Measurement Frequency: In-situ manual visual inspection carried out by a structural engineer should be undertaken routinely, every 2 years. In some cases, where a barrier may pose an additional risk to road users (in cases of collapse onto the carriageway) a more intensive survey frequency may be applied.
2.8 Key Characteristic 5: Safety – Impact from Collision
Definition: This characteristic refers to the level of safety as structure has been designed to meet in terms of vehicle impact. In general, noise barriers are not required to endure vehicle impacts. To reduce the risk of a vehicle impact the noise barrier can be fronted with some form of vehicle restraint, or alternatively the barrier can be placed a sufficient distance from the carriageway.
Standard/Guidance Document: EN 1794-1
Measurement Technique: There is no in-situ measurement or technique that can be applied to assess the noise barrier’s performance with respect to vehicle impact.
Measurement Frequency: None.
2.9 Key Characteristic 6: Structural Integrity – Resistance to Loads
Definition: This characteristic refers to the barrier’s ability to resist a number of typical loads, such as those generated from wind (either natural wind or dynamic wind loading from passing vehicles), snow, static, and the barrier’s self-weight load.
Standard/Guidance Document: EN 1794-1 (also applicable Eurocode depending on construction materials).
Measurement Technique: There is no direct measurement that can be taken in-situ. Loads can be approximated and theoretical computation can be run.
Measurement Frequency: None.
CEDR Call 2014: Asset Management and Maintenance
Page 21 of 107
2.10 Characteristic: Acoustic Ability - Sound Diffraction
Definition: Diffraction describes how waves bend, or change direction as they travel around the edges of obstacles. The amount of diffraction depends on the size of the obstacle or opening in relation to the wavelength of the wave (see Figure 1 and Section 2.4).Standard/Guidance Document: EN 1793-4:2015. (NB: EN 14388:2005 refers to an earlier version of this Standard, CEN/TS 1793-4).
Measurement Technique: In-situ assessment using an electro-acoustic system meeting the specification in EN 1794-4.
Measurement Frequency: Following installation (if required), 1 year after installation and then every 5 years after that. If the added device incorporates sound absorptive materials, then a more frequent monitoring frequency may be adopted if there is a likelihood that those materials might degrade.
2.11 Characteristic: Acoustic Ability – Insertion Loss
Definition: Insertion loss is the difference in noise levels, measured from a noise sensitive receiver, before and after the installation of a noise barrier. This is a direct measure of the in-situ acoustic performance.
Standard/Guidance Document: ISO 10847
Measurement Technique: ISO 10874 sets out two methodologies: direct and indirect. The direct method relies on in-situ measurements which can be continually taken over the service life of the barrier to assess in-situ acoustic performance. The indirect method is often difficult to implement.
Measurement Frequency: Measurements should be taken as soon as possible after the installation is completed, preferably 1-2 months. In cases where barriers receive consistent noise related complaints, further inspections and measurements may be warranted.
Whilst the NRAs felt that it was important to know the difference made by the installation of the noise barrier, this was not a characteristic that was often measured, even when the barrier was first installed. It also cannot be directly measured once the barrier is in-situ, and the noise levels without the barrier in place have to be modelled. Measurement of sound reflection, insulation and diffraction could also be used as a proxy for insertion loss. Therefore it was felt that insertion loss should not be considered to be a key characteristic of the condition of in-situ noise barriers.
2.12 Graffiti and Dirt
Many NRAs regularly clean their noise barriers, to remove dirt and graffiti. The presence of graffiti is unlikely to affect a noise barrier’s performance, in terms of its ability to abate noise, and thus this maintenance is carried out only to maintain the aesthetics of the barrier. Whilst the presence of dirt could affect a noise barrier’s performance, this would be very dependent on the type of barrier and also the type of dirt.
Thus the presence of dirt or graffiti has not been considered within PREMiUM.

CEDR Call 2014: Asset Management and Maintenance
Page 22 of 107
2.13 Summary
The key characteristics, describing the condition of noise barriers, are summarised in Table 2, along with the measurements that can be used to determine the characteristics, the measurement units and also any thresholds that are applied to the measurements.
Table 2: Measurements of key condition characteristics for Environmental Noise Barriers
Characteristics Measurement Units Thresholds applied
Airborne sound insulation
DLR in reverberant fields dB DLR >24 dB is commonly used in
practice for initial performance
DLSI,E, DLSI,P and DLSI,G in non-reverberant fields
dB No thresholds or requirement
currently applied for DLSI,E, DLSI,P and DLSI,G
Sound absorption/ reflection
DLα in reverberant fields dB
DLα between 8-11 dB is commonly used in practice for initial performance for high absorbing barriers (class A3 according to EN 1793-1)
DLα between 4-7 dB is commonly used in practice for initial performance for absorbing barriers (class A2 according to EN 1793-1)
• DLRI in non-reverberant fields
dB
EN standard for measurement of DLRI was introduced in October 2016 so there are no common thresholds from practice yet.
Vibration and Fatigue
Not measured N/A None found for in-service barriers
Impact from Collision
Behaviour under impact N/A Refer to EN 1317–2
Resistance to loads
Self weight of an acoustic element
kN/element
Refer to EN 1794-1
Maximum vertical load an acoustic element can withstand
kN/m
Maximum normal load an acoustic element can withstand
kPa on the element
Maximum normal a structural element can withstand (wind, static load and self weight
kN/m along the structural element
Maximum bending moment a structural element can withstand (dynamic load from snow clearance)
kN/m at ground level
Maximum normal load an acoustic element can withstand
kN/m on a 2m x 2m reference surface on the element
CEDR Call 2014: Asset Management and Maintenance
Page 23 of 107
3 Summary recommendations for potential methods to monitor environmental noise barriers
3.1 Monitoring environmental noise barriers
The condition of noise barriers is very important because they are very expensive devices. Measuring the condition of these assets at the network level is challenging because, as noted in Section 5, there are a number of different key characteristics of the condition which need to be measured, and there are very specific technical requirements given for the way in which these measurements should be collected.
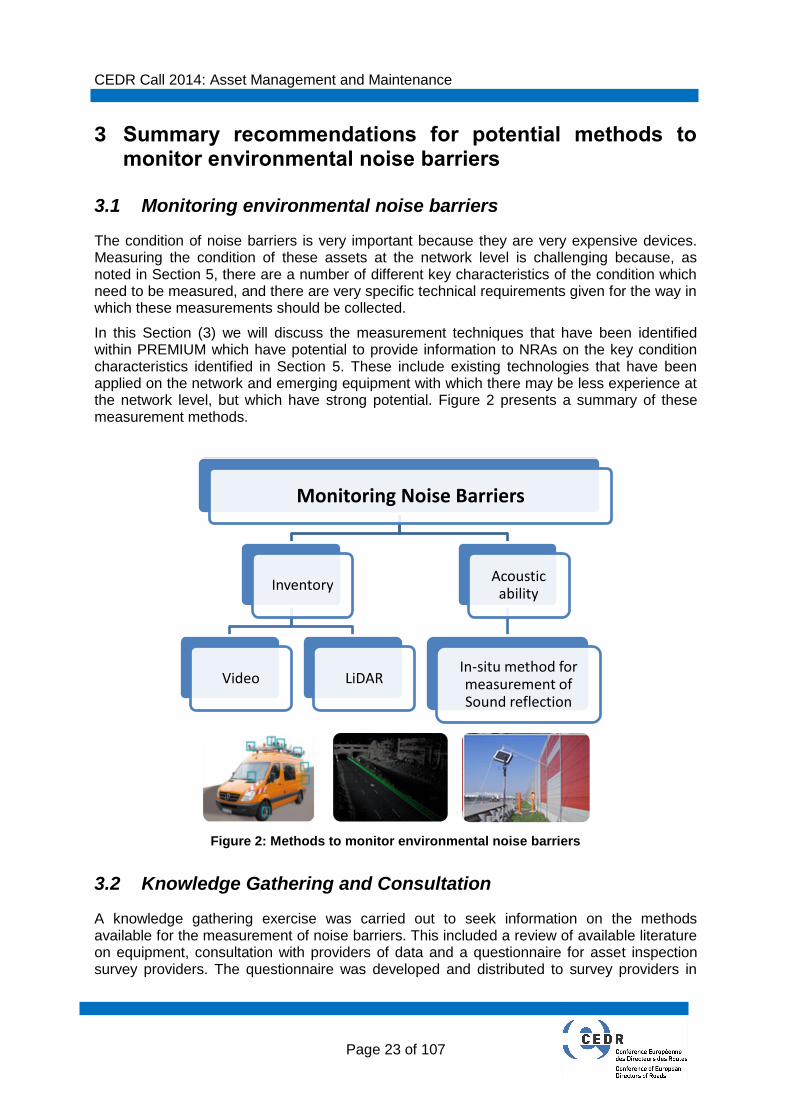
In this Section (3) we will discuss the measurement techniques that have been identified within PREMIUM which have potential to provide information to NRAs on the key condition characteristics identified in Section 5. These include existing technologies that have been applied on the network and emerging equipment with which there may be less experience at the network level, but which have strong potential. Figure 2 presents a summary of these measurement methods.
Figure 2: Methods to monitor environmental noise barriers
3.2 Knowledge Gathering and Consultation
A knowledge gathering exercise was carried out to seek information on the methods available for the measurement of noise barriers. This included a review of available literature on equipment, consultation with providers of data and a questionnaire for asset inspection survey providers. The questionnaire was developed and distributed to survey providers in
Monitoring Noise Barriers
Inventory
Video LiDAR
Acoustic ability
In-situ method for measurement of Sound reflection
CEDR Call 2014: Asset Management and Maintenance
Page 24 of 107
order to understand their current method of inspection, what data they record and the technologies they employ to do so.
Additional consultations with experts from AIT’s acoustic team helped to define the different in-situ methods for measurement the noise barriers. The projects ADRIENNE (ADRIENNE 1997), QUIESST (Conter, 2012) and QUESTIM (Morgan, 2014) were identified as resources for different measurement techniques for monitoring of noise barriers.
The following sections summarise the main observations and recommendations derived from the knowledge gathering and consultation exercise. The recommendations are broken down by key data requirement, as defined in section 5.
3.3 Key Data - Inventory
The following methods were identified as currently being used to measure the inventory of noise barriers. These methods collect information about the inventory characteristics, including type, length, height etc.:
Visual Survey (High-speed): Vehicles enabled with GPS/GNSS recording devices (e.g. Oxford Tracker/Trimble Applanix), forward facing imaging capabilities, and odometer.
Visual Survey (Low-Speed): Field Inventory, a slow speed manual survey utilising a hand-held GPS data logging device.
Historical Record Review: Reference to existing records such as construction drawings, documentation and contracts.
A desktop survey utilising up-to-date satellite and street-view imagery (e.g. Google Earth Pro/StreetView & Ordnance Survey) could also be undertaken to determine the exact geographical location of assets.
The accuracy of GPS devices can vary depending on their quality and signal strength at time of measurement. The accuracy of satellite imagery, such as Google Maps, can also vary; in some cases co-ordinates can be several metres out when compared with measurements taken onsite using a quality GPS device. Considering the dimensions of noise barriers it is appropriate that any location co-ordinates have an accuracy of ±7m. Other descriptions of the location should be to a level of detail that would allow any survey provider to locate the assets without GPS co-ordinates.
In addition, several recent studies were identified that have investigated different assets detection and extraction using LiDAR technology and have shown reliable results. Thus the following new/emerging technology can also be used to provide inventory data for noise barriers:
LiDAR survey (traffic-speed): Vehicles enabled with GPS/GNSS recording devices, LiDAR, and odometer. This method does not require traffic management, and is performed at any time of day, at traffic speed. However, weather conditions should be dry and clear.
For Inventory data PREMIUM therefore recommends that:
NRAs continue to make use of their ongoing maintenance programmes to maximise the accuracy of their databases.
Video and LIDAR based methods should be more widely adopted by NRAs to update and maintain the population of their inventory databases on noise barriers.

CEDR Call 2014: Asset Management and Maintenance
Page 25 of 107
In order to implement a reliable and accurate high-speed, network level survey for inventory of noise barriers, it would be necessary to:
Perform practical trials with different devices to provide more information and obtain better understanding of capability of current systems
o The investigation should provide also specification of minimum technical requirements (image resolution, positioning system) for video surveys.
3.4 Key Characteristic: Acoustic Performance – Airborne Sound Insulation
3.4.1 Measurement techniques
There are two established techniques for measuring the airborne sound insulation of noise barriers:
Laboratory tests according to EN 1793-2 (although the most recent edition of the standard has a revised scope which prohibits use of the method for assessing noise barriers due it being applied under diffuse (reverberant) conditions).
The method is not suitable for assessing long-term performance due to the destructive nature of the test (panels need to be removed from the roadside installation for testing, transported to the laboratory and potentially cut to size to fit the laboratory installation requirements).
In-situ measurements according to EN 1793-6 (based on test methods developed during the ADRIENNE and QUIESST projects); measurement results are comparable but not identical to the laboratory test results since the in-situ method is applied under direct (non-reverberant) conditions. The in situ nature of the test method means it can be applied for determining long-term performance.
Currently, there is no routine method that would enable the practical measurement of airborne sound insulation of noise barriers at a network level. The test method in EN 1793-6 can be applied at the roadside, although this requires staff and equipment to potentially be present on the carriageway, access to both sides of the barrier (the loudspeaker is positioned on the traffic side of the barrier and the microphone array on the receiver side), the need for safe working space between the barrier and the carriageway (e.g. the presence of a hard shoulder) and the potential need for traffic management.
Work has been reported to try to simplify the method by reducing the number of microphones (e.g. Mahon et al, 2012), however this did not resolve the logistical issues described above. AIT in Austria are also working on a national research project to develop a new in-situ procedure for approval testing and quality assurance of the acoustic properties of the complete roadside noise barrier installations. For airborne sound insulation, the procedure is mainly based on both EN 1793-6; the aim is not to substitute the methods but to reach an overall assessment of the whole barrier in a more practicable time (BMVIT, 2014).
3.4.2 Recommendations for measurement of Airborne Sound Insulation
The in-situ measurement of sound insulation of noise barriers using the EN 1793-6 test method is a complicated manual survey method for the reasons described above and is not considered as a practical option to provide data at the network level, unless conditions on the

CEDR Call 2014: Asset Management and Maintenance
Page 26 of 107
network are considered sufficiently acceptable to apply the test method to only a limited sample of panels for any given barrier installation.
No other method or survey was identified that could be practically applied or be developed to provide measurements of airborne sound insulation at the network level. Therefore, if the EN 1793-6 method cannot be used, further work would need to be commissioned to develop a new measurement method that would allow efficient, safe and robust measurements on a large number of panels in a given barrier installation if such a comprehensive level of assessment was deemed necessary. This would not necessarily have to give identical answers to the EN 1793-6 method but merely identify failed barrier sections where detailed inspections using the EN 1793-6 method might be required.
For measurement of Airborne Sound Insulation PREMiUM therefore recommends that:
A new measurement method that could be implemented at a network level be developed for an efficient, safe, robust assessment of in-situ airborne sound insulation.
3.5 Key Characteristic: Acoustic Performance – Sound Absorption/Reflection
3.5.1 Measurement techniques
The review identified two measurement methods, one for determining the sound absorption performance and one for determining the sound reflection performance of noise barriers:
Laboratory test according to EN 1793-1, although the most recent edition of the standard has a revised scope which prohibits use of the method for assessing noise barriers due to it being applied under diffuse (reverberant) conditions.
The method is not suitable for assessing long-term performance due to the potentially destructive nature of the test (panels need to be removed from the roadside installation for testing and transported to the laboratory).
In-situ method according to EN 1793-5 (based on test methods developed during the ADRIENNE and QUIESST projects); measurement results are not directly comparable to the laboratory test results since the in-situ method is applied under direct (non-reverberant) conditions. The in situ nature of the test method means it can be applied for determining long-term performance.
PREMIUM was not able to identify a method or survey, at a ready for market level, which could be practically applied at the network level for the measurement of sound absorption/reflection of noise barriers. The test method in EN 1793-6 can be applied at the roadside, although this requires staff and equipment to potentially be present on the carriageway, the need for safe working space between the barrier and the carriageway (e.g. the presence of a hard shoulder) and the potential need for traffic management.
However, AIT’s acoustic team is currently working on a national research project, whose main topic is to develop a new in-situ procedure for approval testing and quality assurance of the acoustic properties of the whole noise barriers along roads. For sound reflection, the procedure is mainly based on EN 1793-5; the aim is not to substitute those methods but to reach an overall assessment of the whole barrier in a more practicable time (BMVIT, 2014).
CEDR Call 2014: Asset Management and Maintenance
Page 27 of 107
3.5.2 Recommendations for measurement of sound reflection of noise barriers
It would potentially be feasible to collect data for sound reflection over long length of noise barriers, if the in-situ method can provide this information at slow speed, or if conditions on the network are considered sufficiently acceptable to apply the EN 1793-5 method to only a limited number of panels for any given barrier installation. The correlation between in-situ and laboratory methods shows significant difference between the two methods. Currently the in-situ methods are not used for measurements at network level, but only for specific projects and for parts of a noise barrier. A network level method would not necessarily have to give identical answers to the EN 1793-5 method but merely identify failed barrier sections where detailed inspections using the EN 1793-5 method might be required.
For sound reflection of noise barriers PREMiUM therefore recommends:
Investigation of the existence of correlation between in-situ and laboratory methods for sound absorption/reflection of different types of noise barriers.
o The investigation should include comparison between the in-situ ADRIENNE and QUIESST methods for sound absorption/reflection of different types of noise barriers also including the analysis of the frequency spectra.
The main issue of the investigation should consider the potential for in-situ monitoring (i.e. intelligent infrastructure). This will require focused development. Once developed, it will need to be trialled on a large scale for different barrier types and different environments.
Investigate the potential of the new AIT procedure for sound reflection measurements at slow speed and its implementation on a network level, if the EN 1793-5 method cannot be applied.
3.6 Key Characteristic: Sound diffraction
3.6.1 Measurement techniques
The sound diffraction characteristics of added devices fitted to noise barriers are measured in-situ according to the standard EN 1793-4. The equipment is placed in front of and behind the noise barriers, at the time of measurement, and therefore this measurement technique is not ready to be applied on a network level. However, the in situ nature of the test method means it can be applied for determining long-term performance.
The diffraction characteristics of noise barriers themselves are not directly measured, since diffraction performance is a function of barrier height (see Section 4.2.4 and Section 4.4).
Currently, there is no routine method that would enable the practical measurement of sound diffraction of added devices at a network level. The test method in EN 1793-4 can be applied at the roadside, although this requires staff and equipment to potentially be present on the carriageway, access to both sides of the barrier (the loudspeaker is positioned on the traffic side of the barrier and the microphone array on the receiver side), the need for safe working space between the barrier and the carriageway (e.g. the presence of a hard shoulder) and the potential need for traffic management.
CEDR Call 2014: Asset Management and Maintenance
Page 28 of 107
3.6.2 Recommendations for measurement of sound diffraction
No method or survey was identified, that could be practically applied or be developed to be applied at the network level, for the measurement of sound diffraction of noise barriers, unless conditions on the network were such that it is considered acceptable to apply the existing EN 1793-4 test method, to only a limited sample of added devices for any given barrier installation.
If the EN 1793-4 method cannot be used, further work would need to be commissioned to develop a new measurement method that could be implemented at a network level that would allow efficient, safe and robust measurements on a large number of panels in a given barrier installation if such a comprehensive level of assessment was deemed necessary. This would not necessarily have to give identical answers to the EN 1793-4 method but merely identify failed added devices where detailed inspections using the EN 1793-4 method might be required.
For measurement of Sound Diffraction PREMiUM therefore recommends that:
Development work be considered in order to develop a new measurement method of sound diffraction that could be implemented at a network level.
3.7 Key Characteristic: Structural Integrity – Vibration and Fatigue
3.7.1 Measurement techniques
Dynamic measurements using one or two accelerometers at specified height and controlled impact (e.g. impulse hammer) can provide information for fatigue of noise barriers. However it is felt that this method is not a practical option to provide measurement data at the network level, due to being a static in-situ method.
Video-based surveys could be used to investigate obvious defects of the noise barriers. The images are accurately geographically referenced, so that damaged barriers can be identified in the images and their position can be extracted manually. Additional in-situ measurements could then be used to provide more information about the causes of defects.
The video survey does have some limitations though – in some situations it is not possible to see the noise barrier from the road, because of its position and, even if the barrier is visible, only the front can be seen from the road – there may be damage to the reverse. The image quality is an important issue for future research.
3.7.2 Recommendations for measurement of Vibration and Fatigue
PREMIUM was not able to identify a method or survey, at a market ready level, which could be practically applied at the network level for measurement of vibration and fatigue of noise barriers. However, potential dynamic methods exist that may be able to offer this. Therefore we recommend that further work should be commissioned, in order to develop a new measurement or adjust an existing measurement method. This could include:
Investigation of the potential of video and images, from the systems used to collect noise barriers inventory, to determine whether manual analysis of these images could be used to detect damages.
CEDR Call 2014: Asset Management and Maintenance
Page 29 of 107
Practical trials with different devices should provide more information and obtain better understanding of capability of current systems
o The investigation should provide also specification of minimum technical requirements (image resolution, positioning system) for video surveys.
Development of a new measurement method that could be implemented at a network level to measure vibration and fatigue.
3.8 Key Characteristic: Safety – Impact from Collision
3.8.1 Measurement techniques
There is no in-situ measurement or technique that can be applied to assess the noise barrier’s performance with respect to vehicle impact.
3.8.2 Recommendations for measurement of impact from collision
No method or survey was identified, that could be practically applied at the network level for measurement the impact from collision of noise barriers. For measurement of impact from collision PREMiUM therefore recommends:
Development of a new measurement method that could be implemented at a network level
3.9 Key Characteristic: Structural Integrity – Resistance to Loads
3.9.1 Measurement techniques
PREMiUM did not identify any direct measurement of resistance to loads that can be taken in-situ or at a network level.
3.9.2 Recommendations for measurement of resistance to loads
No method or survey was identified, that could be practically applied or be developed at the network level for measurement the resistance to loads of noise barriers.
For measurement of resistance to loads PREMiUM therefore recommends that:
A new measurement method that could be implemented at a network level is developed. Potential for in-situ monitoring (i.e. intelligent infrastructure), which would require focused development.
3.10 Summary
The current measurement and proposed methods are summarized in Table 3. As mentioned in the previous sub-section, potential methods were identified for measurement of characteristics which present the condition of noise barriers. The PREMiUM recommendations for work required to achieve recommended method are also described in the table. For the characteristics highlighted as bold, we believe that if suitable investment is
CEDR Call 2014: Asset Management and Maintenance
Page 30 of 107
made, then network level monitoring of these characteristics could be implemented within 3-5 years.
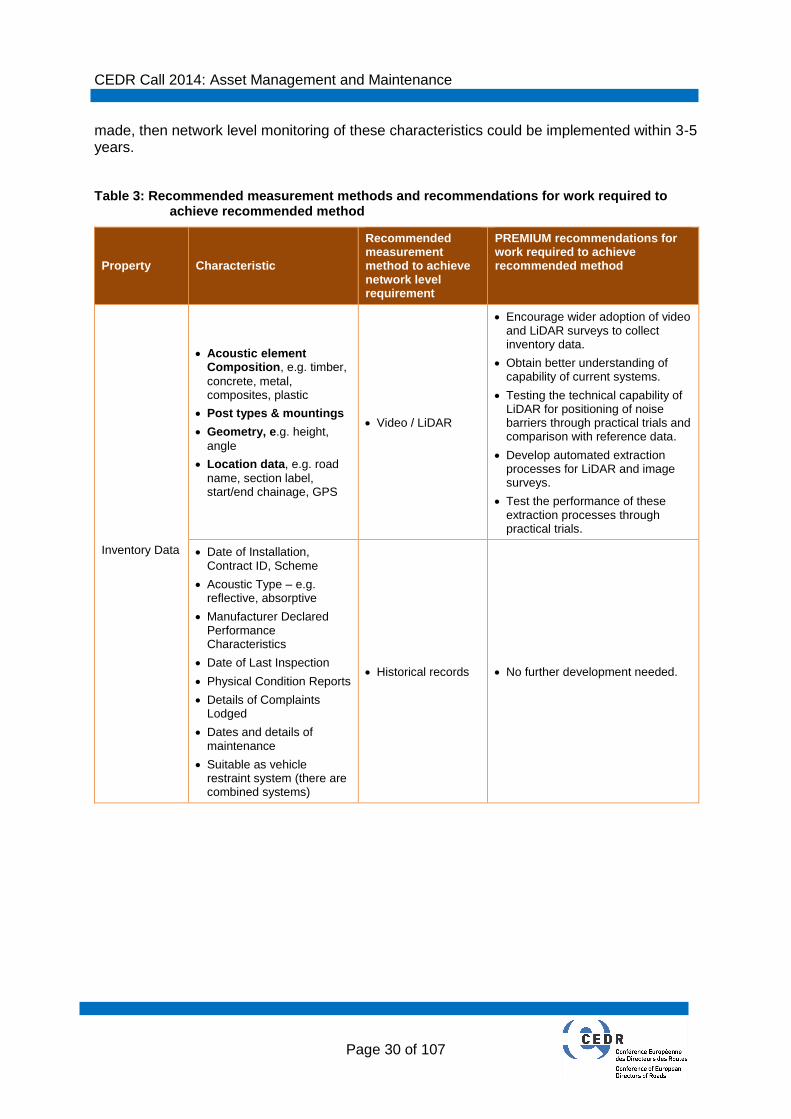
Table 3: Recommended measurement methods and recommendations for work required to achieve recommended method
Property Characteristic
Recommended measurement method to achieve network level requirement
PREMIUM recommendations for work required to achieve recommended method
Inventory Data
Acoustic element Composition, e.g. timber,
concrete, metal, composites, plastic
Post types & mountings
Geometry, e.g. height,
angle
Location data, e.g. road
name, section label, start/end chainage, GPS
Video / LiDAR
Encourage wider adoption of video and LiDAR surveys to collect inventory data.
Obtain better understanding of capability of current systems.
Testing the technical capability of LiDAR for positioning of noise barriers through practical trials and comparison with reference data.
Develop automated extraction processes for LiDAR and image surveys.
Test the performance of these extraction processes through practical trials.
Date of Installation, Contract ID, Scheme
Acoustic Type – e.g. reflective, absorptive
Manufacturer Declared Performance Characteristics
Date of Last Inspection
Physical Condition Reports
Details of Complaints Lodged
Dates and details of maintenance
Suitable as vehicle restraint system (there are combined systems)
Historical records No further development needed.
CEDR Call 2014: Asset Management and Maintenance
Page 31 of 107
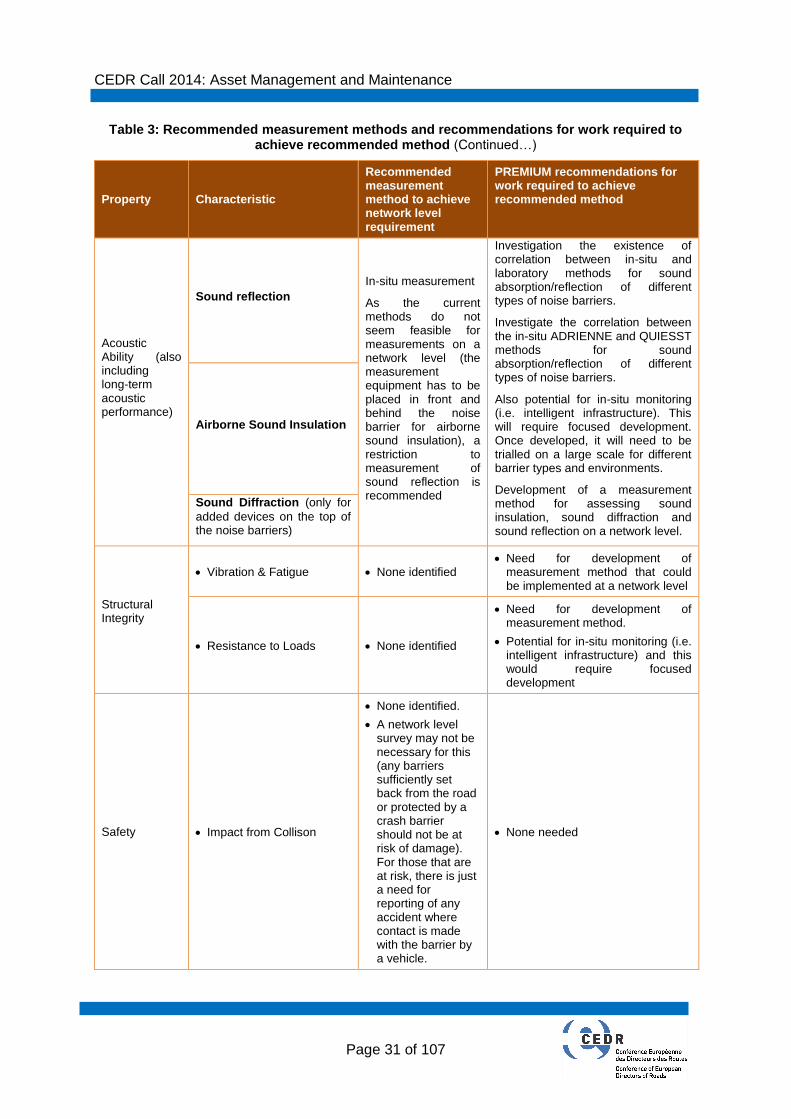
Table 3: Recommended measurement methods and recommendations for work required to achieve recommended method (Continued…)
Property Characteristic
Recommended measurement method to achieve network level requirement
PREMIUM recommendations for work required to achieve recommended method
Acoustic Ability (also including long-term acoustic performance)
Sound reflection
In-situ measurement
As the current methods do not seem feasible for measurements on a network level (the measurement equipment has to be placed in front and behind the noise barrier for airborne sound insulation), a restriction to measurement of sound reflection is recommended
Investigation the existence of correlation between in-situ and laboratory methods for sound absorption/reflection of different types of noise barriers.
Investigate the correlation between the in-situ ADRIENNE and QUIESST methods for sound absorption/reflection of different types of noise barriers.
Also potential for in-situ monitoring (i.e. intelligent infrastructure). This will require focused development. Once developed, it will need to be trialled on a large scale for different barrier types and environments.
Development of a measurement method for assessing sound insulation, sound diffraction and sound reflection on a network level.
Airborne Sound Insulation
Sound Diffraction (only for
added devices on the top of the noise barriers)
Structural Integrity
Vibration & Fatigue None identified Need for development of
measurement method that could be implemented at a network level
Resistance to Loads None identified
Need for development of measurement method.
Potential for in-situ monitoring (i.e. intelligent infrastructure) and this would require focused development
Safety Impact from Collison
None identified.
A network level survey may not be necessary for this (any barriers sufficiently set back from the road or protected by a crash barrier should not be at risk of damage). For those that are at risk, there is just a need for reporting of any accident where contact is made with the barrier by a vehicle.
None needed
CEDR Call 2014: Asset Management and Maintenance
Page 32 of 107
4 Technical Background – the Current Standards and Approach for understanding Noise Barrier Condition
4.1 Information sources
As highlighted in Section 2, a stakeholder engagement exercise was run to understand current industry practice and to find out what authorities believe to be the most important characteristic (data that could plausibly be collected during an inspection/condition survey) for determining the condition of the asset and its current level of performance. Prior to the stakeholder engagement a review of current standards and guidance documents was carried out in order to summarise all of the characteristics a barrier can hold for which measurements could be made against. To support the review, additional information was sourced from the HeRoad report into equipment condition assessment (Casse & Van Geem, 2012).
Table 4, on the following page, identifies the different property groups, and their characteristics, for noise barriers. Project consortium members were also asked to review their national standards and guidance documents to highlight commonalities in the requirement of certain forms of data. The characteristics listed in Table 4 were the findings from the standards review.
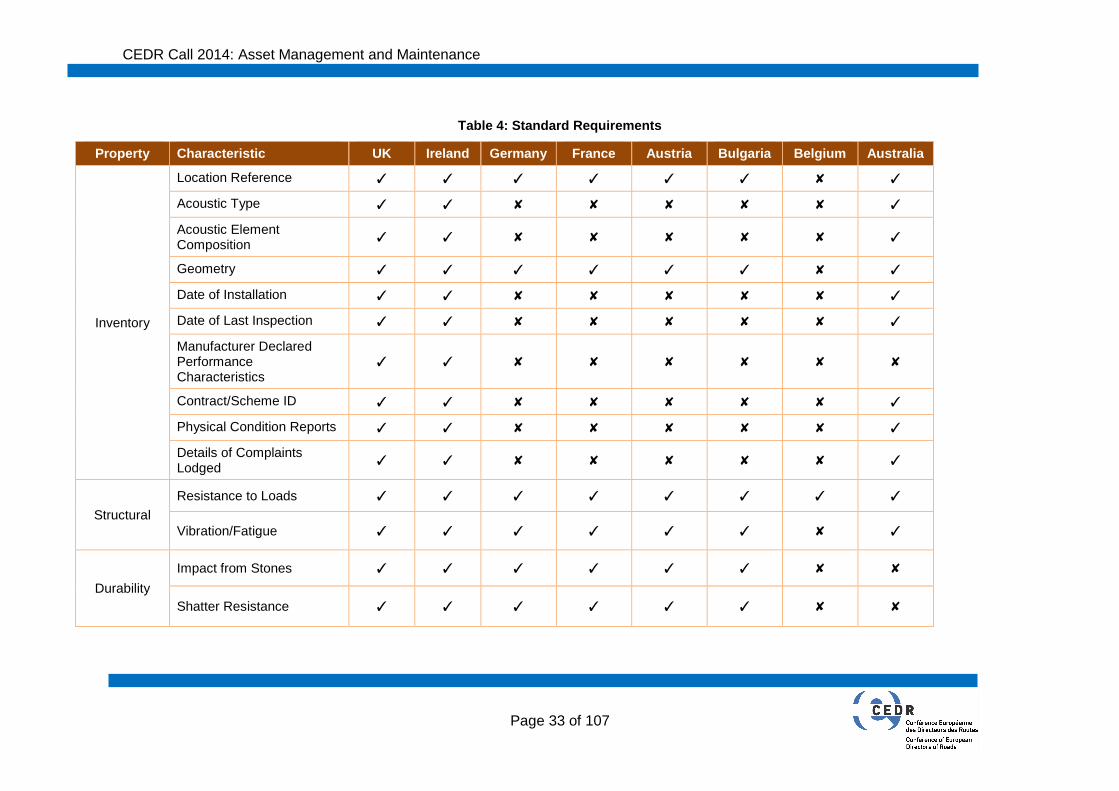
CEDR Call 2014: Asset Management and Maintenance
Page 33 of 107
Table 4: Standard Requirements
Property Characteristic UK Ireland Germany France Austria Bulgaria Belgium Australia
Inventory
Location Reference ✓ ✓ ✓ ✓ ✓ ✓ ✘ ✓
Acoustic Type ✓ ✓ ✘ ✘ ✘ ✘ ✘ ✓
Acoustic Element Composition
✓ ✓ ✘ ✘ ✘ ✘ ✘ ✓
Geometry ✓ ✓ ✓ ✓ ✓ ✓ ✘ ✓
Date of Installation ✓ ✓ ✘ ✘ ✘ ✘ ✘ ✓
Date of Last Inspection ✓ ✓ ✘ ✘ ✘ ✘ ✘ ✓
Manufacturer Declared Performance Characteristics
✓ ✓ ✘ ✘ ✘ ✘ ✘ ✘
Contract/Scheme ID ✓ ✓ ✘ ✘ ✘ ✘ ✘ ✓
Physical Condition Reports ✓ ✓ ✘ ✘ ✘ ✘ ✘ ✓
Details of Complaints Lodged
✓ ✓ ✘ ✘ ✘ ✘ ✘ ✓
Structural
Resistance to Loads ✓ ✓ ✓ ✓ ✓ ✓ ✓ ✓
Vibration/Fatigue ✓ ✓ ✓ ✓ ✓ ✓ ✘ ✓
Durability
Impact from Stones ✓ ✓ ✓ ✓ ✓ ✓ ✘ ✘
Shatter Resistance ✓ ✓ ✓ ✓ ✓ ✓ ✘ ✘
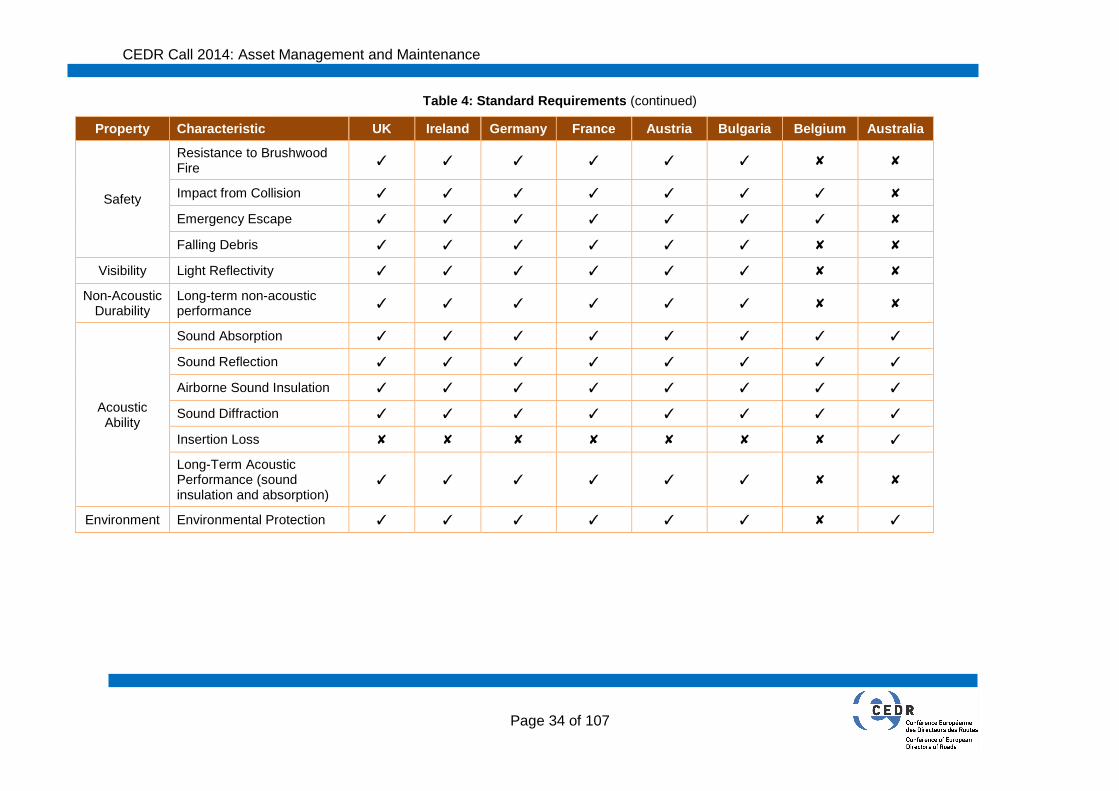
CEDR Call 2014: Asset Management and Maintenance
Page 34 of 107
Table 4: Standard Requirements (continued)
Property Characteristic UK Ireland Germany France Austria Bulgaria Belgium Australia
Safety
Resistance to Brushwood Fire
✓ ✓ ✓ ✓ ✓ ✓ ✘ ✘
Impact from Collision ✓ ✓ ✓ ✓ ✓ ✓ ✓ ✘
Emergency Escape ✓ ✓ ✓ ✓ ✓ ✓ ✓ ✘
Falling Debris ✓ ✓ ✓ ✓ ✓ ✓ ✘ ✘
Visibility Light Reflectivity ✓ ✓ ✓ ✓ ✓ ✓ ✘ ✘
Non-Acoustic Durability
Long-term non-acoustic performance
✓ ✓ ✓ ✓ ✓ ✓ ✘ ✘
Acoustic Ability
Sound Absorption ✓ ✓ ✓ ✓ ✓ ✓ ✓ ✓
Sound Reflection ✓ ✓ ✓ ✓ ✓ ✓ ✓ ✓
Airborne Sound Insulation ✓ ✓ ✓ ✓ ✓ ✓ ✓ ✓
Sound Diffraction ✓ ✓ ✓ ✓ ✓ ✓ ✓ ✓
Insertion Loss ✘ ✘ ✘ ✘ ✘ ✘ ✘ ✓
Long-Term Acoustic Performance (sound insulation and absorption)
✓ ✓ ✓ ✓ ✓ ✓ ✘ ✘
Environment Environmental Protection ✓ ✓ ✓ ✓ ✓ ✓ ✘ ✓
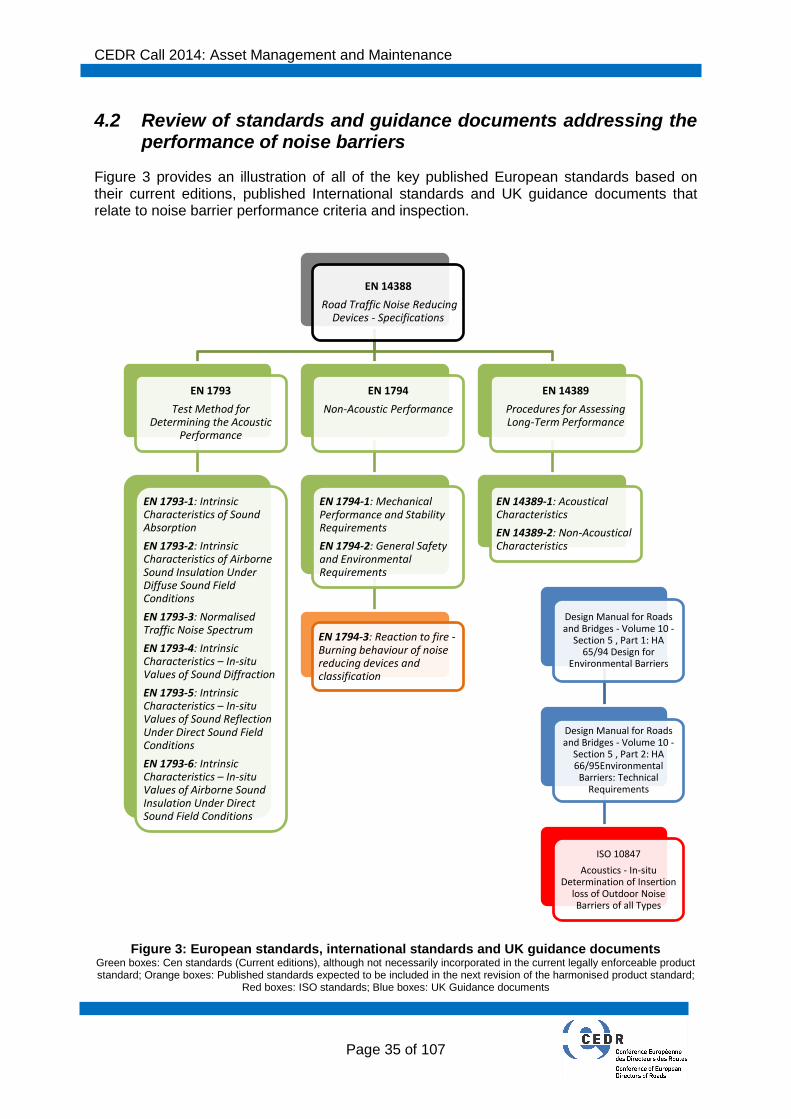
CEDR Call 2014: Asset Management and Maintenance
Page 35 of 107
4.2 Review of standards and guidance documents addressing the performance of noise barriers
Figure 3 provides an illustration of all of the key published European standards based on their current editions, published International standards and UK guidance documents that relate to noise barrier performance criteria and inspection.
Figure 3: European standards, international standards and UK guidance documents Green boxes: Cen standards (Current editions), although not necessarily incorporated in the current legally enforceable product standard; Orange boxes: Published standards expected to be included in the next revision of the harmonised product standard;
Red boxes: ISO standards; Blue boxes: UK Guidance documents
EN 14388
Road Traffic Noise Reducing Devices - Specifications
EN 1793
Test Method for Determining the Acoustic
Performance
EN 1793-1: Intrinsic Characteristics of Sound Absorption
EN 1793-2: Intrinsic Characteristics of Airborne Sound Insulation Under Diffuse Sound Field Conditions
EN 1793-3: Normalised Traffic Noise Spectrum
EN 1793-4: Intrinsic Characteristics – In-situ Values of Sound Diffraction
EN 1793-5: Intrinsic Characteristics – In-situ Values of Sound Reflection Under Direct Sound Field Conditions
EN 1793-6: Intrinsic Characteristics – In-situ Values of Airborne Sound Insulation Under Direct Sound Field Conditions
EN 1794
Non-Acoustic Performance
EN 1794-1: Mechanical Performance and Stability Requirements
EN 1794-2: General Safety and Environmental Requirements
EN 1794-3: Reaction to fire - Burning behaviour of noise reducing devices and classification
EN 14389
Procedures for Assessing Long-Term Performance
EN 14389-1: Acoustical Characteristics
EN 14389-2: Non-Acoustical Characteristics
Design Manual for Roads and Bridges - Volume 10 -
Section 5 , Part 1: HA 65/94 Design for
Environmental Barriers
Design Manual for Roads and Bridges - Volume 10 -
Section 5 , Part 2: HA 66/95Environmental Barriers: Technical
Requirements
ISO 10847
Acoustics - In-situ Determination of Insertion
loss of Outdoor Noise Barriers of all Types
CEDR Call 2014: Asset Management and Maintenance
Page 36 of 107
The following sub-sections will now discuss each of these standards and guidance documents.
4.2.1 EN 14388: Noise reducing device specifications
EN 14388 is the harmonised product standard that identifies the performance requirements that noise reducing devices (such as environmental noise barriers) should be assessed against (Morgan, 2014). This standard identifies the declared values for each of the requirements, whether these are determined by testing or calculation, and the relevant supporting EN standards which set out the methodology for determination; it addresses characteristics relating to acoustic and non-acoustic performance as well as long-term performance for noise reducing devices made from any material. It also identifies those mandated characteristics under the Construction Products Regulation.
The supporting standards comprise three daughter suites of standards as follows:
EN 1793: Test methods for determining Acoustic Performance.
EN 1794: Test methods for determining Non-Acoustic Performance.
EN 14389: Procedures for assessing Long-Term Acoustic Performance.
EN 14388:2015 (CEN, 2015b) is the latest published edition, published in September 2015 and prepared to take account of the recent introduction of the Construction Products Regulations as well as recent developments/ improvements in test methods. However, this edition was rejected during the European Commission’s harmonisation assessment and never appeared in the Official Journal of the European Union (OJEU). Whilst a subsequent revision is ongoing, this means that EN 14388:2005 (CEN, 2005) remains, at the time of writing, the current legally enforceable edition of the Standard. The impact of this affects the test methods that must be used to determine performance characteristics for declaration on a noise barrier’s Declaration of Performance under the Construction Products Regulation.
Therefore, where a Client wishes to include performance characteristics not covered by EN 14388:2005 and/or use different test methods to those in that standard in his specifications/contract requirements, he must state these requirements specifically in those documents.
EN 14388 includes a useful summary table of all of the performance characteristics (mandated or otherwise) and the relevant standards relating to these characteristics. Table 5 presents this information based on EN 14388:2005, including whether the characteristics should be determined by test or calculation and, where applicable, the number of samples to be tested. Table 6 presents the performance requirements for any characteristics introduced/updated since the publication of EN 14388:2005 (based in part on EN 14388:2015), although this does not include any characteristics from standards currently under revision.
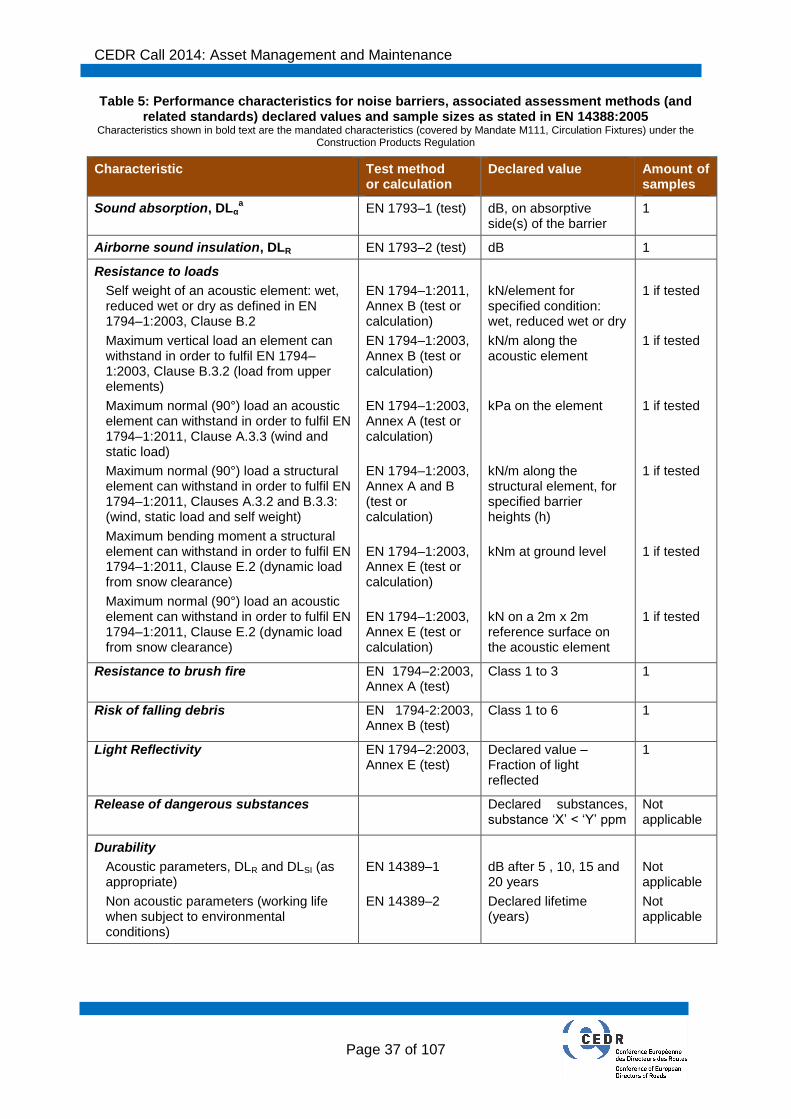
CEDR Call 2014: Asset Management and Maintenance
Page 37 of 107
Table 5: Performance characteristics for noise barriers, associated assessment methods (and related standards) declared values and sample sizes as stated in EN 14388:2005
Characteristics shown in bold text are the mandated characteristics (covered by Mandate M111, Circulation Fixtures) under the Construction Products Regulation
Characteristic Test method or calculation
Declared value Amount of samples
Sound absorption, DLαa EN 1793–1 (test) dB, on absorptive
side(s) of the barrier 1
Airborne sound insulation, DLR EN 1793–2 (test) dB 1
Resistance to loads
Self weight of an acoustic element: wet, reduced wet or dry as defined in EN 1794–1:2003, Clause B.2
Maximum vertical load an element can withstand in order to fulfil EN 1794–1:2003, Clause B.3.2 (load from upper elements)
Maximum normal (90°) load an acoustic element can withstand in order to fulfil EN 1794–1:2011, Clause A.3.3 (wind and static load)
Maximum normal (90°) load a structural element can withstand in order to fulfil EN 1794–1:2011, Clauses A.3.2 and B.3.3: (wind, static load and self weight)
Maximum bending moment a structural element can withstand in order to fulfil EN 1794–1:2011, Clause E.2 (dynamic load from snow clearance)
Maximum normal (90°) load an acoustic element can withstand in order to fulfil EN 1794–1:2011, Clause E.2 (dynamic load from snow clearance)
EN 1794–1:2011, Annex B (test or calculation)
EN 1794–1:2003, Annex B (test or calculation)
EN 1794–1:2003, Annex A (test or calculation)
EN 1794–1:2003, Annex A and B (test or calculation)
EN 1794–1:2003, Annex E (test or calculation)
EN 1794–1:2003, Annex E (test or calculation)
kN/element for specified condition: wet, reduced wet or dry
kN/m along the acoustic element
kPa on the element
kN/m along the structural element, for specified barrier heights (h)
kNm at ground level
kN on a 2m x 2m reference surface on the acoustic element
1 if tested
1 if tested
1 if tested
1 if tested
1 if tested
1 if tested
Resistance to brush fire EN 1794–2:2003, Annex A (test)
Class 1 to 3 1
Risk of falling debris EN 1794-2:2003, Annex B (test)
Class 1 to 6 1
Light Reflectivity EN 1794–2:2003, Annex E (test)
Declared value – Fraction of light reflected
1
Release of dangerous substances Declared substances, substance ‘X’ < ‘Y’ ppm
Not applicable
Durability
Acoustic parameters, DLR and DLSI (as appropriate)
Non acoustic parameters (working life when subject to environmental conditions)
EN 14389–1
EN 14389–2
dB after 5 , 10, 15 and 20 years
Declared lifetime (years)
Not applicable
Not applicable

CEDR Call 2014: Asset Management and Maintenance
Page 38 of 107
Characteristic Test method or calculation
Declared value Amount of samples
Impact of stonesb
Damage caused by controlled impacts
EN 1794–1:2003, Annex C (test)
Succeed or fail
1
Safety in collisionc
Behaviour under impacts specified in EN 1317–2
EN 1794–1:2003, Annex D (test)
Succeed or fail
1
Environmental protection
Identification of constituent materials and breakdown products
EN 1794–2:2003, Annex C
Material details
Not applicable
Means of escape
Assessment in accordance with supporting standard
EN 1794-2:2003, Annex D
Not applicable
Transparencyd
Assessment in accordance with supporting standard
EN 1794–2:2003, Annex F (test and calculation)
Static and/or dynamic
1
Sound diffractione CEN/TS 1793-4
(test) dB 1
a Only applicable if the device is described as sound absorptive
b Optional
c Optional except if combined safety and noise barrier
d Optional
e For added devices only
Table 6: Performance characteristics for noise barriers, associated assessment methods (and related standards) declared values and sample sizes as added/updated since EN 14388:2005
Characteristics shown in bold text are the mandated characteristics (covered by Mandate M111, Circulation Fixtures) under the Construction Products Regulation
Characteristic Test method or calculation
Declared value Amount of samples
Airborne sound insulation
DLR in reverberant fieldsa
DLSI,E, DLSI,P and DLSI,G in non-reverberant fields
b
EN 1793–2 (test)
EN 1793–6 (test)
dB
dB
1
1
Resistance to loads
Self weight of an acoustic element: wet, reduced wet or dry as defined in EN 1794–1:2011, Clause B.2
Maximum vertical load an element can withstand in order to fulfil EN 1794–1:2011, Clause B.3.2 (load from upper elements)
Maximum normal (90°) load an acoustic element can withstand in order to fulfil EN 1794–1:2011, Clause A.3.3 (wind and static load)
EN 1794–1:2011, Annex B (test or calculation)
EN 1794–1:2011, Annex B (test or calculation)
EN 1794–1:2011, Annex A (test or calculation)
kN/element for specified condition: wet, reduced wet or dry
kN/m along the acoustic element
kPa on the element
1 if tested
1 if tested
1 if tested
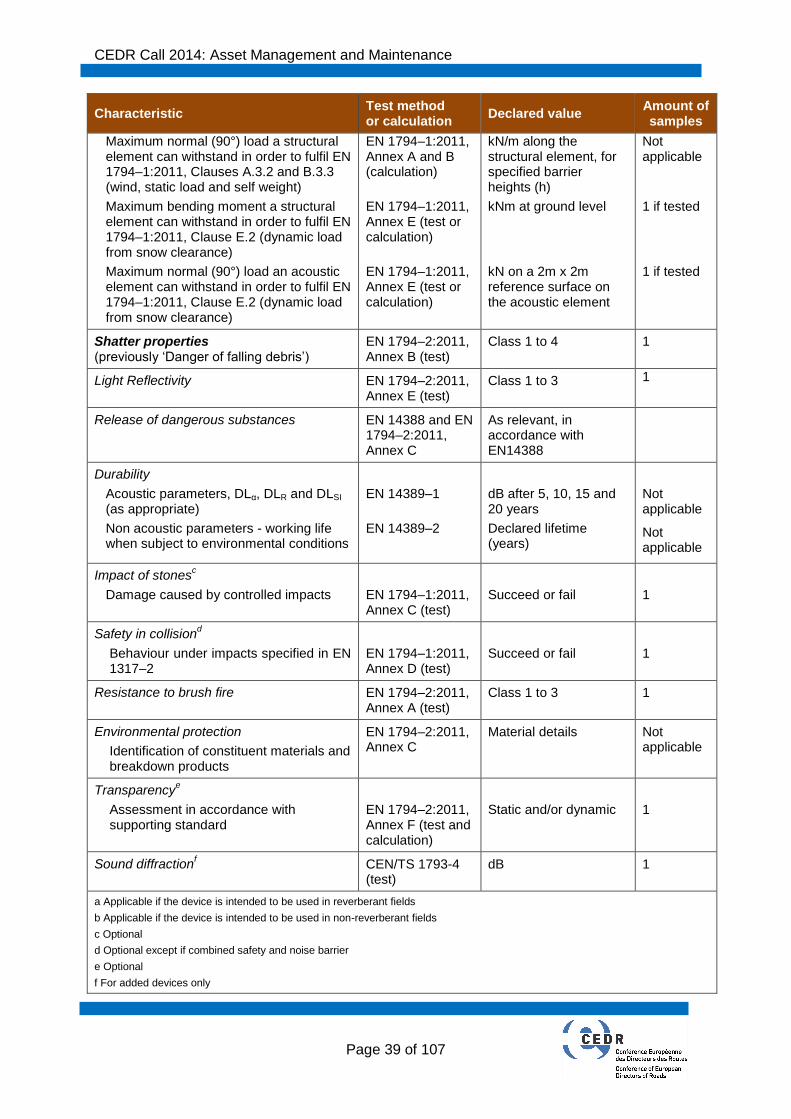
CEDR Call 2014: Asset Management and Maintenance
Page 39 of 107
Characteristic Test method or calculation
Declared value Amount of samples
Maximum normal (90°) load a structural element can withstand in order to fulfil EN 1794–1:2011, Clauses A.3.2 and B.3.3 (wind, static load and self weight)
Maximum bending moment a structural element can withstand in order to fulfil EN 1794–1:2011, Clause E.2 (dynamic load from snow clearance)
Maximum normal (90°) load an acoustic element can withstand in order to fulfil EN 1794–1:2011, Clause E.2 (dynamic load from snow clearance)
EN 1794–1:2011, Annex A and B (calculation)
EN 1794–1:2011, Annex E (test or calculation)
EN 1794–1:2011, Annex E (test or calculation)
kN/m along the structural element, for specified barrier heights (h)
kNm at ground level
kN on a 2m x 2m reference surface on the acoustic element
Not applicable
1 if tested
1 if tested
Shatter properties (previously ‘Danger of falling debris’)
EN 1794–2:2011, Annex B (test)
Class 1 to 4 1
Light Reflectivity EN 1794–2:2011, Annex E (test)
Class 1 to 3 1
Release of dangerous substances EN 14388 and EN 1794–2:2011, Annex C
As relevant, in accordance with EN14388
Durability
Acoustic parameters, DLα, DLR and DLSI (as appropriate)
Non acoustic parameters - working life when subject to environmental conditions
EN 14389–1
EN 14389–2
dB after 5, 10, 15 and 20 years
Declared lifetime (years)
Not applicable
Not applicable
Impact of stonesc
Damage caused by controlled impacts
EN 1794–1:2011, Annex C (test)
Succeed or fail
1
Safety in collisiond
Behaviour under impacts specified in EN 1317–2
EN 1794–1:2011, Annex D (test)
Succeed or fail
1
Resistance to brush fire EN 1794–2:2011, Annex A (test)
Class 1 to 3 1
Environmental protection
Identification of constituent materials and breakdown products
EN 1794–2:2011, Annex C
Material details Not applicable
Transparencye
Assessment in accordance with supporting standard
EN 1794–2:2011, Annex F (test and calculation)
Static and/or dynamic
1
Sound diffractionf CEN/TS 1793-4
(test) dB 1
a Applicable if the device is intended to be used in reverberant fields
b Applicable if the device is intended to be used in non-reverberant fields
c Optional
d Optional except if combined safety and noise barrier
e Optional
f For added devices only

CEDR Call 2014: Asset Management and Maintenance
Page 40 of 107
4.2.2 EN 1793-1: Acoustic performance (sound absorption)
This standard specifies a laboratory test method, using a reverberation chamber, for establishing sound absorption characteristics. This method provides a measure of intrinsic performance, assessing the properties of individual components and materials, rather than how the noise reducing device performs as a whole relative to noise sensitive receivers. Results from measurements using this test method are not directly comparable with those obtained using the in-situ method detailed in EN 1793-5:2016, because EN 1793-1 uses diffuse (reverberant) sound field conditions and EN 1793-5 uses direct (non-reverberant) sound field conditions.
The most recent published edition of the standard is EN 1793-1:2017 (CEN, 2017; published in March 2017); this edition introduces a new sound absorption coefficient specific to noise reducing devices and has also removed the categories of single number rating of performance (as a result of the mandatory declaration of measurement uncertainties). Furthermore, in line with the previous update in 2012, the standard has a scope of application which prohibits use of the method for determining the acoustic sound absorption performance of road traffic noise reducing devices under non-reverberant conditions. This means that the method can no longer be applied for assessing the performance of roadside noise barriers (with the method set out in EN 1793-5:2016 to be used instead).
At the time of writing, EN 14388:2005 remains the legally enforceable edition of the harmonised product standard and this requires determination of the sound absorption performance of roadside noise barriers in accordance with a previous version of EN 1793-1, namely EN 1793-1:1997, rather than EN 1793-5:2016.
4.2.3 EN 1793-2: Acoustic performance (airborne sound transmission)
This standard describes a laboratory test method for qualifying airborne sound insulation characteristics using a reverberation chamber. As above, results using this test method are not directly comparable with those obtained using the in-situ method in EN 1793-6:2012, because EN 1793-2 uses diffuse (reverberant) sound field conditions and EN 1793-6 uses direct (non-reverberant) sound field conditions.
The most recent published edition of the standard is EN 1793-2:2012 (CEN, 2012a; published in November 2012) which saw a change in the scope of application of the standard to restrict applicability; this change prohibited the use of the method for determining acoustic airborne sound insulation performance of road traffic of road traffic noise reducing devices under non-reverberant conditions. This means that the method would no longer be applicable for assessing the performance of roadside noise barriers (with the method currently set out in EN 1793-6:2012 to be used instead).
The standard defines categories of airborne sound insulation (Table 7).
Table 7: Categories of airborne sound insulation (as defined in EN 1793-2:2012)
Category DLR (dB)
B0 Not determined
B1 < 15
B2 15 to 24
B3 25 to 34
D4 > 34
CEDR Call 2014: Asset Management and Maintenance
Page 41 of 107
However, it is noted that a forthcoming revision (expected in 2017) will remove these categories as a result of the mandatory declaration of measurement uncertainties.
At the time of writing, EN 14388:2005 remains the legally enforceable edition of the harmonised product standard and this requires determination of the acoustic airborne sound insulation performance of roadside noise barriers in accordance with the previous version of EN 1793-2, namely EN 1793-2:1997 (CEN, 1997b), rather than EN 1793-6:2012.
4.2.4 EN 1793-4: Acoustic performance (diffraction)
This standard, published in March 2015 (CEN, 2015a), details a non-destructive in-situ method for determining the sound diffraction characteristics of added devices (a device fitted to the top of a noise barrier to improve its performance). The method is used to qualify products prior to their installation; recurrent applications of the method can be used to validate the long-term performance of the added device. Again this method only assesses intrinsic characteristics. The method relies upon the use of an electro-acoustic system, however due to the placement of microphones above and around the noise barrier there may be practical constraints, such as access issues, in employing this technique.
The method is not applied to determine the diffraction performance of noise barriers themselves; diffraction performance is a function of barrier height relative to the source and receiver and is not measured directly. As such, no standards exist for the direct determination of noise barrier sound diffraction efficiency.
At the time of writing, EN 14388:2005 remains the legally enforceable edition of the harmonised product standard and this requires determination of the acoustic diffraction performance of added devices in accordance with an earlier version of EN 1793-4, namely CEN/TS 1793-4:2003 (CEN, 2003a). In principle, this means that is not possible for a manufacturer to produce a Declaration of Performance for an added device, but this does not preclude a Client from including EN 1793-4 in their own specifications.
4.2.5 EN 1793-5: Acoustic performance (sound reflection)
EN 1793-5:2016 (CEN, 2016; published in March 2016) details a non-destructive in-situ test method for the determination of sound reflection characteristics in non-reverberant conditions only. The test is performed using a microphone and loudspeaker set up on the same side of the noise barrier, with the microphone being rotated around the barrier. Results obtained using this test method are not directly comparable with those obtained using the laboratory method detailed in EN 1793-1, because EN 1793-5 uses direct (non-reverberant) sound field conditions and EN 1793-1 uses diffuse (reverberant) sound field conditions.
At the time of writing, EN 14388:2005 remains the legally enforceable edition of the harmonised product standard and this requires determination of the sound absorption performance of roadside noise barriers rather than sound reflection performance, in accordance with EN 1793-1:1997 (CEN, 1997a) rather than EN 1793-5:2016. Should a Client wish performance to be assessed using the in-situ test method, this should be set out in their own specifications
4.2.6 EN 1793-6: Acoustic performance (airborne sound transmission)
EN 1793-6:2012 (CEN, 2012b; published in March 2012) provides a non-destructive in-situ test method for assessing the intrinsic performance characteristics of airborne sound insulation. Similar to EN 1793-5, this method is carried out under directional sound conditions; as such results obtained using this test method are not directly comparable with

CEDR Call 2014: Asset Management and Maintenance
Page 42 of 107
those obtained using the laboratory method set out in EN 1793-2. However, according to the QUIESST project report D4.3 (Conter, 2012) there is a good correlation between the results of the two methods. The test procedure involves the use of a loudspeaker and a microphone (or array of microphones) placed in defined reference locations on opposite sides of the noise barrier.
The standard defines categories of airborne sound insulation (Table 8).
Table 8: Categories of airborne sound insulation (as defined in EN 1793-6:2012)
Category DLSI,E , DLSI,P or DLSI,G, dB
D0 Not determined
D1 < 16
D2 16 to 27
D3 28 to 36
D4 > 36
However, it is noted that a forthcoming revision (expected in 2017) will remove these categories as a result of the mandatory declaration of measurement uncertainties.
At the time of writing, EN 14388:2005 remains the legally enforceable edition of the harmonised product standard and this requires determination of the acoustic airborne sound insulation performance of roadside noise barriers in accordance with the previous version of EN 1793-2, namely EN 1793-2:1997 (CEN 1997b), rather than EN 1793-6:2012. Should a Client wish performance to be assessed using the in-situ test method, this should be set out in their own specifications
4.2.7 EN 1794-1: Non-acoustic performance (mechanical performance and stability)
The “resistance to loads” property encompasses a variety of loads that the structure should be able to withstand without incurring significant damage. These loads, the specification criteria and requirements are defined in EN 1794-1, for the purpose of categorising environmental noise barriers (road traffic noise reducing devices) with respect to their basic mechanical performance. The most recent published edition of the Standard is EN 1794-1:2011 (CEN 2011a; published in January 2011).
The characteristics are as follows:
Wind and static loads (including vibration and fatigue effects)
Self-weight.
Impact of stones.
Safety in collision.
Dynamic load from snow clearance.
A wind load is the force exerted on the structure from the impact of wind. The standard provides the method for calculating various types of wind loading (with reference to EN 1991-1-4) that the structure would likely be subjected to, including the dynamic pressure due to

CEDR Call 2014: Asset Management and Maintenance
Page 43 of 107
passing vehicles. These are theoretical design calculations which cannot be measured on-site.
Vibration and fatigue affect the structural integrity of the barrier over a long period of time. Fatigue is eventually caused by cycles of pressure differences from passing vehicles, relative to the distance to, and geometry of, the noise barrier, essentially caused by aerodynamic forces. Self-weight criteria and methods for determining this are also set out in the standard. These methods use theoretical calculation and laboratory tests.
Noise barriers are subjected to stone impacts from vehicles passing over loose material on the road surface. They have the ability to cause damage; as such noise barriers should be designed so that any impacting stones leave only superficial damage. The standard provides a method for assessing controlled impacts from stones and the specified criteria the structure should meet. The method employs the use of a mechanical hammer. The requirement for the structure to withstand a vehicle impact only apply for systems which cannot be adequately separated in distance from the road or systems that are not protected by vehicle restraint systems. These performance requirements are contained within EN 1317-1 & EN 1317-2; additional considerations for design, with respect to vehicle impacts, are also highlighted in EN 1974-2:2011. These test methods/calculations only focus on the non-acoustic intrinsic properties of the structure.
This standard includes the requirements for some load resistance properties:
For a vertical noise barrier: o The maximum horizontal elastic deflection dhmax, in millimetres, under the
design wind load for a structural element shall be less than
𝑑ℎ𝑚𝑎𝑥 =𝐿𝑆
150, for Hnrd ≤ 3 m
𝑑ℎ𝑚𝑎𝑥=30mm for 3 m ≤ Hnrd ≤ 4,5 m
𝑑ℎ𝑚𝑎𝑥 =𝐿𝑆
150, for Hnrd>4,5m.
o The maximum horizontal elastic deflection dhmax, in millimetres, under the design wind load for an acoustic element shall be less than
𝑑ℎ𝑚𝑎𝑥 = min(𝐿𝐴
150, 50𝑚𝑚), for LA≤5m
𝑑ℎ𝑚𝑎𝑥 =𝐿𝐴
100, for LA>5m.
o When a load factor of SW = 1,5 is applied to the design wind load The acoustic element shall not show any symptoms of failure such as
buckling, permanent displacement of acoustic elements, or cracks greater than acceptable for exposure to a severe corrosive environment;
The element shall not become detached from its supports or fixings; The permanent deformation dhmax, in millimetres, after release of the
load shall be less than 𝑑ℎ𝑚𝑎𝑥 =𝐿𝑆
500 for structural elements, 𝑑ℎ𝑚𝑎𝑥 =
𝐿𝐴
500
for acoustic elements The deflections of structural elements shall not cause acoustic
elements to become permanently displaced.
For non-vertical noise barriers: o The above criteria for vertical barriers apply, plus
o The elastic vertical deflection dvmax, in millimetres, shall be less than 𝐿𝑆
300 for
structural elements, 𝐿𝐴
200 for acoustic elements.
At the time of writing, EN 14388:2005 remains the legally enforceable edition of the harmonised product standard and this requires determination of the mechanical and stability
CEDR Call 2014: Asset Management and Maintenance
Page 44 of 107
performance of roadside noise barriers in accordance with the previous version of EN 1794-1, namely EN 1794-1:2003 (CEN 1793a), rather than EN 1794-1:2011.
4.2.8 EN 1794-2: Non-acoustic performance (general safety and environmental requirements)
The scope of this standard encompasses the minimum design requirements for assessing the overall environmental performance and safety of noise barriers under likely roadside conditions. The most recent published edition of the Standard is EN 1794-2:2011 (CEN, 2011b; published in January 2011).
Within this are the requirements for the following characteristics:
Resistance to brushwood fire
Falling debris.
Environmental protection.
Emergency access
Reflection of light.
Transparency.
Noise barriers (especially those with timber elements) may be exposed to fire caused by dry vegetation or other materials within close proximity. More severe fires can be caused by leaked fuel from traffic accidents. The standard sets out the laboratory method for fire testing on acoustic elements.
Noise reducing devices can be mounted to existing structures or become damaged through vehicle impact consequently posing a hazard to other road users. In these situations there are risks of falling debris (e.g. falling panels/acoustic elements). The standard offers indications of aspects that should be considered in the design of these barriers and details a method to ensure the barrier has adequate resistance to serious blows from traffic accidents. The impactor test set out in the standard, requires the use of a supporting structure holding the test element in place and a falling impactor with a weight of 400kg or 45kg mounted on a pendulum. The test element is then subjected to the swinging load, with any falling debris arising from the first impact only are then assessed. This is then evaluated against a set of criteria relating to the size, weight and impact angle of the debris.
Environmental protection relates to constituent materials and products of their decomposition that could pose a threat to the surrounding environment. It also places consideration on materials which could be recycled or re-used. No test method is prescribed for achieving this, just a list of general requirements. Emergency access through the noise barrier may be required in specific circumstances (i.e. emergency services responding to an accident, barrier/verge maintenance, and as a means of escape from an area affected by a traffic accident). Similar to environmental protection, no test method is prescribed – only a list of minimum requirements, such as access dimensions, self-closing mechanisms, location, and signage. The standard makes reference to light reflectivity, as reflection (either from sunlight or vehicle headlamps) could negatively affect drivers and therefore overall road safety. Classifications of reflectivity are given alongside a test method (with reference to EN ISO 2813). The test method involves measuring the reflectivity of a sample panel at different angles of incidence. Lastly, the standard provides a method for designers to determine the transparency of the barrier. Transparency considers two groups: road users and residents living behind or within viewing distance of the barrier.

CEDR Call 2014: Asset Management and Maintenance
Page 45 of 107
At the time of writing, EN 14388:2005 remains the legally enforceable edition of the harmonised product standard and this requires determination of the general safety and environmental performance of roadside noise barriers in accordance with the previous version of EN 1794-2, namely EN 1794-2:2003 (CEN, 2003b), rather than EN 1794-2:2011.
4.2.9 EN 1794-3: Non-acoustic performance (burning behaviour)
Generally, the brushwood fire test gives enough information for most applications of road traffic noise barriers; however sometimes more stringent information is required. A new standard, EN 1794-3:2016 (CEN, 2016), has recently been published (in July 2016) which addresses both the brushwood fire test from EN 1793-2 and reaction to fire tests (covering smoke density and toxic fumes).
4.2.10 EN 14389-1: Long-term acoustic performance
EN 14389-1 provides a method for assessing the long-term intrinsic acoustic performance relative to a set of defined environmental exposure classes. The most recently published edition of the standard is EN 14389-1:2015 (CEN, 2015c), which requires the declaration of acoustic performance (in terms of DLα, DLR and DLSI) at the end of the working lifetime (with the corresponding working lifetime in years also to be stated). These indices correspond to the test methods in EN 1793-1, EN 1793-2 and an earlier version of EN 1793-6.
The method carries the assumption that the barrier is maintained to the manufacturer’s standards
At the time of writing, EN 14388:2005 remains the legally enforceable edition of the harmonised product standard and this requires determination of the acoustic durability of roadside noise barriers in accordance with an earlier version of EN 14389, namely prEN 14389-1, rather than EN 14389-1:2015. This earlier edition required performance estimates to be made in terms of reductions in performance after 5, 10, 15 and 20 years after installation by means of descriptive solutions or comparative testing (which refers to CEN/TS 1793-5, the predecessor to EN 1793-6:2012).
4.2.11 EN 14389-2: Long-term non-acoustic performance
This standard defines the procedure for declaring the long-term non-acoustical characteristics (i.e. structural) of noise barriers, in terms of working lifetime (in years) as a function of environmental classes of exposure. The most recently published edition of the standard is EN 14389-2:2015 (CEN, 2015d).
At the time of writing, EN 14388:2005 remains the legally enforceable edition of the harmonised product standard and this requires determination of the acoustic durability of roadside noise barriers in accordance with an earlier version of EN 14389, namely EN 14389-2:2004 (CEN, 2004), rather than EN 14389-2:2015.
4.2.12 HA 65/94
HA 65/94 the UK’s design guide for noise barriers (Highways England et al, 2001). The guidance covers a number of topics: design criteria; aesthetics; design in rural, semi-urban, and urban contexts; construction and operational factors; design process; a framework for assessing visual, acoustic and cost considerations; and lastly, extensive coverage of noise barrier case studies in different geographical contexts. The document does not however

CEDR Call 2014: Asset Management and Maintenance
Page 46 of 107
provide any methods for determining the barrier’s intrinsic and extrinsic performance characteristics.
4.2.13 HA 66/95
HA 66/95 provides the technical requirements for noise barriers in the UK (Highways England et al, 2001). The document covers the basic mathematical and physical principles of noise propagation and attenuation in relation to noise barriers. A design method for acoustic screens (in the form of thin panel construction) is also provided. The standard highlights construction/maintenance costs and general considerations for different types of noise barrier. The document does not however provide any methods for determining the barrier’s intrinsic and extrinsic performance characteristics.
4.2.14 ISO 10847
This international standard provides two methods for assessing the in-situ acoustic performance of barriers in terms of insertion loss (ISO, 1997). Insertion loss is simply the difference in noise levels with and without the barrier. These methods, however, do not allow for the direct comparison between the resulting measurements obtained under the methods covered in EN 14388.
The direct method is only applicable for barriers that are yet to be installed. Noise levels are measured at a reference position and a receiver position before and after barrier installation. For in-use barriers the indirect method must be employed. The procedure is the same as the above however in this circumstance the before noise levels are based on taking measurements at a site that is comparably equivalent. Measurements can be carried out over the barrier’s lifetime to gain an understanding of the barriers performance over time.
4.2.15 Other National Standards
The standards review also highlighted a number of equivalent national standards: RVS 13.03.71 (Quality assurance for structural maintenance, monitoring, inspection and investigation of structures noise barrier) in Austria; ZTV-LSW 06 (Technical specifications and guidelines for the design of noise barriers along roads) in Germany; GCW-2012 (Guidelines: Noise abatement structures along roads) in the Netherlands; Tien Meluesteiden Suunittelu (Design of road traffic noise reducing devices) in Finland.
4.3 Review of Practice in the Assessment of the Performance of Noise Barriers
In order to assess current industry practice and understanding of the key requirements relevant for assessing the performance of environmental noise barriers, a stakeholder engagement exercise was run. Two questionnaires, one for NRAs and one for survey/equipment providers, were developed on the basis of the standards review findings and consultations with the consortium partners (the questionnaires used can be found in Appendices A and B). This section will discuss the results from the NRA questionnaire first, whilst those from the survey provider questionnaire are given in section 5.
The questionnaire developed for NRAs was comprised of two sections. The first section contained 10 questions regarding the NRAs current level of understanding of the asset, and their current approach to managing them. The second section contained a list of the
CEDR Call 2014: Asset Management and Maintenance
Page 47 of 107
characteristics, identified from the standards review. For each characteristic, stakeholders were asked:
“If that characteristic was measured or recorded? (yes/no)” “How is the characteristic measured? (method and/or instruments used)” “What level of importance would you assign to this characteristic for the assessment
of its condition? (high, medium, low, neither)”
This allowed the determination of what NRAs judged to be the most and least important characteristics in order to effectively understand and manage the asset. Across the consortium, 84 National Road Authorities (NRAs) (including regional authorities) were identified and approached. An information pack and the questionnaire were then distributed to all 84 potential stakeholders. Of the 84 stakeholders who received the questionnaire and information pack, timely responses were only received from ten participants.
4.3.1 Summary of NRA Questionnaire responses to section 1 (understanding the asset)
Q1. What is the approximate length of your road network?
Q2. What types of noise barriers are present on your network and what is the approximate total length for each type?
Responses were received from ten NRAs from: Sweden, Netherlands, Ireland, Austria, Belgium, Germany, Norway and the UK. The ten respondents manage a total of over 140,000km of motorways, dual and single carriage ways. In total, the ten authorities manage a total of over 2500km of noise barriers; constructed from either metallic, plastic, concrete, timber, and composite materials.
Q3. What is your general approach to managing and understanding the condition of noise barriers?
a. Do you have a clear view of the status of all assets i.e. a regular monitoring regime?
b. Do you perform ad hoc repairs if something goes wrong (is there a reporting system – details?)?
c. Is the approach based on age of the asset?
Eight NRAs stated that they had a monitoring regime in place, with one of these commenting that whilst they had a regime in place they did not have a clear view of the condition status of their noise barriers. One NRA stated that whilst did have a monitoring regime set out, the reporting database in which all of the necessary information was held, was not often populated by contractors, despite this being a requirement of their contract. Further to this two NRAs said they did not have a monitoring regime set in place and did not have a clear view of the status of their noise barrier assets. Again 6 NRAs stated that they had a reporting system in place to highlight areas of barriers where defects/damages were present. One of these commented that although they had a reporting system in place it was not fully complied with. Two NRAs however, did not have any form of defect reporting system in place. Only two NRAs considered the age of the asset in their management approach. The majority of respondents (8) did not base their management approach on the age of the asset.
Q4. Where you have a monitoring regime, what does this measure and what methodology do you use? (e.g. measurement of: noise absorption/reflection, wear, structural integrity etc.)
The majority of respondents (8) did not undertake noise characteristic measurements of any kind on their assets. However, two respondents stated that they did carry out measurements of noise characteristics. Eight of the ten respondents said they did not measure the amount
CEDR Call 2014: Asset Management and Maintenance
Page 48 of 107
of wear their assets have undergone. Only one participant undertook measurements of wear. Five participants did not carry out measurements of the structural integrity of their noise barrier assets. However, three NRAs stated that they did undertake assessments characteristics related to the structural integrity of the barrier.
Q5. Where you do not have a regime, do you feel there is a need for condition monitoring to map the state of these assets? If not, please tell us why not (e.g. the condition cannot be measured, regular replacement removes the need for monitoring).
All participants, including those who already had some form of monitoring regime, said they believed condition monitoring and mapping would be beneficial for managing their assets. Further to this, some responded saying it would also be beneficial for the information contained within the monitoring database to be fed into an asset management system.
Q6. Do you use an asset management system (AMS) for managing noise barriers (maintenance planning and forecasting budgets)?
Currently only two of the participants make use of an asset management system. It was found to be more common for NRAs not to have an asset management system that included noise barriers. Six participants said they did not have an AMS in place. Of these six, one said that whilst they do not have an asset management system they do use a GIS environment, and another stated that whilst they do not currently use one, they are currently in the process of introducing one.
Q7. What methods of maintenance are applied to noise barriers e.g. replacement, repainting, cleaning, patching, post reinforcement?
Positive responses were received for all of the maintenance methods identified in the question, however no additional procedures were identified by the stakeholders. Six participants replaced damaged panels. Six carried out repainting and cleaning, due to the built up of dirt, especially in case of transparent screens, and more often because of graffiti. Three said they patched damages instead of replacing the entire panel and two also conducted post reinforcement works.
Q8. How do you decide if a noise barrier requires each type of maintenance method listed in Q7? I.e. on what criteria are maintenance / repair decisions made: Is the decision based on e.g. the asset’s age, its measured condition etc.? Please give details.
In line with the responses from question 3b, the majority of participants carried out ad hoc maintenance works as a result of recommendations from inspection reports. One stakeholder said they carry out maintenance in accordance with their national standard. Another stated that they currently had no national guidelines regarding the inspection and maintenance of noise barriers.
Q9. If the maintenance is based on measured condition, are thresholds applied to the measurements? If so are these thresholds defined in a standard or just within your organisation?
Only one participant carried out maintenance work based on thresholds set out in national standards, whilst one adhered to thresholds set in their own organisation.
Q10. Do you combine different types of measurements, to make a decision on maintenance e.g. combine measurements of structural integrity and noise absorption?
None of the participants carried out a combination of measurements for different characteristics, i.e. structural integrity and noise characteristics.
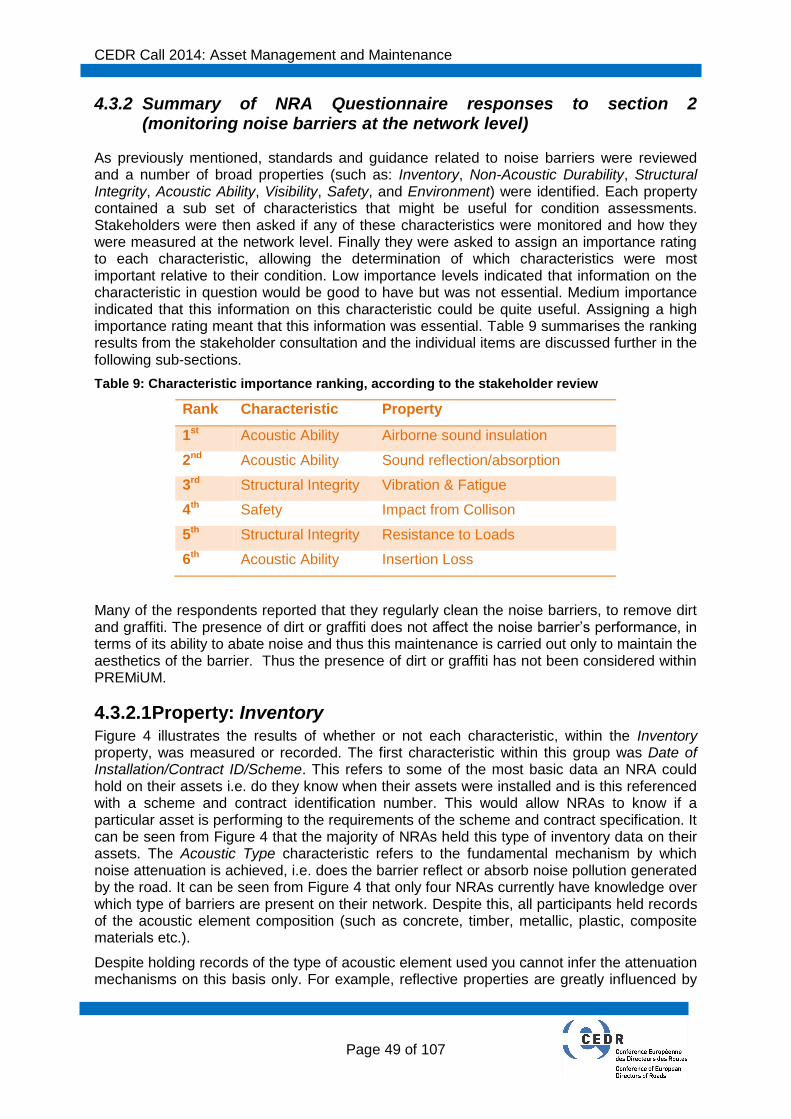
CEDR Call 2014: Asset Management and Maintenance
Page 49 of 107
4.3.2 Summary of NRA Questionnaire responses to section 2 (monitoring noise barriers at the network level)
As previously mentioned, standards and guidance related to noise barriers were reviewed and a number of broad properties (such as: Inventory, Non-Acoustic Durability, Structural Integrity, Acoustic Ability, Visibility, Safety, and Environment) were identified. Each property contained a sub set of characteristics that might be useful for condition assessments. Stakeholders were then asked if any of these characteristics were monitored and how they were measured at the network level. Finally they were asked to assign an importance rating to each characteristic, allowing the determination of which characteristics were most important relative to their condition. Low importance levels indicated that information on the characteristic in question would be good to have but was not essential. Medium importance indicated that this information on this characteristic could be quite useful. Assigning a high importance rating meant that this information was essential. Table 9 summarises the ranking results from the stakeholder consultation and the individual items are discussed further in the following sub-sections.
Table 9: Characteristic importance ranking, according to the stakeholder review
Rank Characteristic Property
1st Acoustic Ability Airborne sound insulation
2nd Acoustic Ability Sound reflection/absorption
3rd Structural Integrity Vibration & Fatigue
4th Safety Impact from Collison
5th Structural Integrity Resistance to Loads
6th Acoustic Ability Insertion Loss
Many of the respondents reported that they regularly clean the noise barriers, to remove dirt and graffiti. The presence of dirt or graffiti does not affect the noise barrier’s performance, in terms of its ability to abate noise and thus this maintenance is carried out only to maintain the aesthetics of the barrier. Thus the presence of dirt or graffiti has not been considered within PREMiUM.
4.3.2.1 Property: Inventory Figure 4 illustrates the results of whether or not each characteristic, within the Inventory property, was measured or recorded. The first characteristic within this group was Date of Installation/Contract ID/Scheme. This refers to some of the most basic data an NRA could hold on their assets i.e. do they know when their assets were installed and is this referenced with a scheme and contract identification number. This would allow NRAs to know if a particular asset is performing to the requirements of the scheme and contract specification. It can be seen from Figure 4 that the majority of NRAs held this type of inventory data on their assets. The Acoustic Type characteristic refers to the fundamental mechanism by which noise attenuation is achieved, i.e. does the barrier reflect or absorb noise pollution generated by the road. It can be seen from Figure 4 that only four NRAs currently have knowledge over which type of barriers are present on their network. Despite this, all participants held records of the acoustic element composition (such as concrete, timber, metallic, plastic, composite materials etc.).
Despite holding records of the type of acoustic element used you cannot infer the attenuation mechanisms on this basis only. For example, reflective properties are greatly influenced by

CEDR Call 2014: Asset Management and Maintenance
Page 50 of 107
the geometrical shape of the barrier; thus for barriers where you do not have a description of the attenuation mechanism on record you would need to examine the geometric profile in order to determine this. It can be seen that all participants do hold records on the geometric properties of their barriers. Further to this, all hold records on the physical location of their assets. While this may be obvious, and of course a critical piece of information for managing an asset (i.e. you cannot manage an asset if you don’t know where it is) it was found that, as with other asset types (such as signs, markings and studs), some NRAs did not hold such records.
Despite all participating NRAs holding full descriptions of the acoustic element composition, geometric properties and location, only four NRAs held data on the manufacturer’s declared performance characteristics. Similarly, only five NRAs knew the date the noise barrier was previously inspected. In contrast five NRAs stated that they did not have physical condition reports from previous inspections. However this may be because the physical condition reports are based on structural integrity assessments, rather than coarse visual inspection reports, which are more common.
Only two parties said they held inventory records of complaints lodged by the general public, such as road users and housing residents who may be affected by underperforming/damaged noise barriers. Five NRAs stated they did not register, or have a reporting mechanism to take account of complaints. Surprisingly only one NRA held records of previous maintenance works. However, as highlighted earlier, this might be due to contractors not populating relevant databases when they complete such maintenance works.
Figure 4: Inventory characteristics results
4.3.2.2 Property: Non-Acoustic Durability None of the participating NRAs measured or monitored the impacts caused by stones. This may be due to a number of reasons; primarily because there is no established methodology to assess the impact from stones in-situ. However there are existing mechanisms amongst most NRAs to report damages to the structure in general. Also the amount of damage that can be caused by stones thrown up by passing traffic is assumed to be minimal, compared by the damage resulting from a traffic collision. In a similar light, none of the NRAs measured
0
1
2
3
4
5
6
7
8
9
No
. of
resp
on
ses
Characteristic
Are these Inventory characteristics measured?
Yes
No
Neither
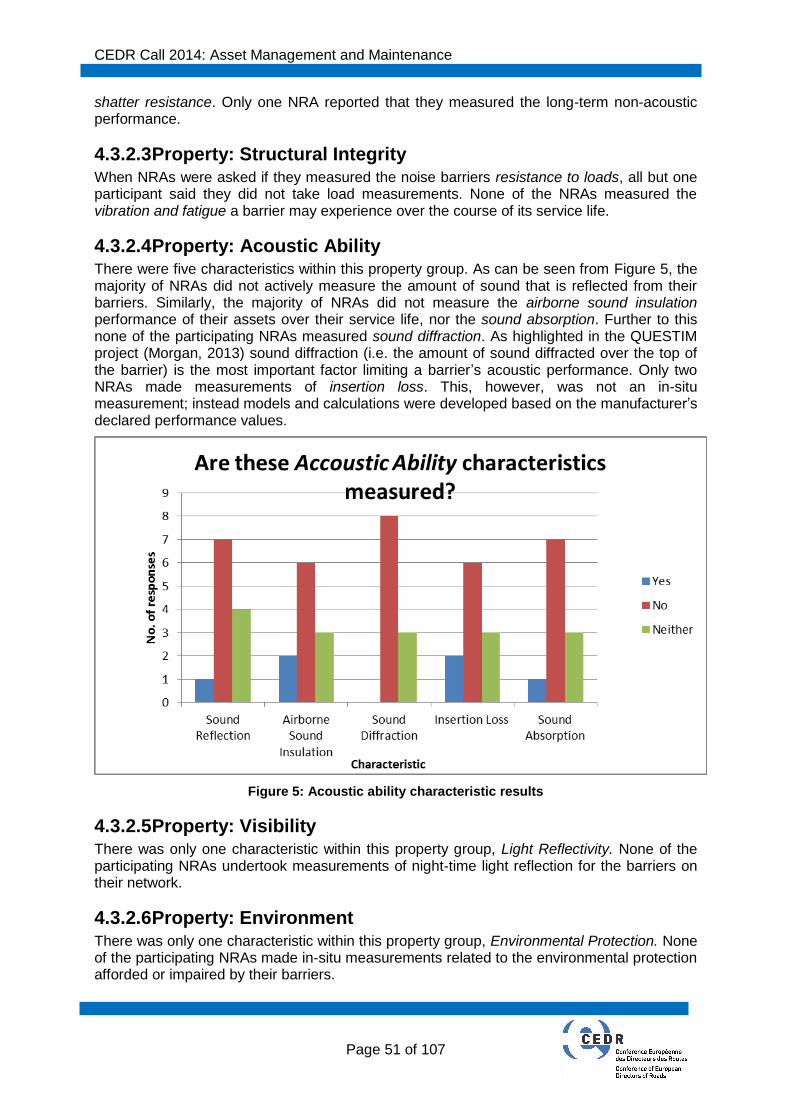
CEDR Call 2014: Asset Management and Maintenance
Page 51 of 107
shatter resistance. Only one NRA reported that they measured the long-term non-acoustic performance.
4.3.2.3 Property: Structural Integrity When NRAs were asked if they measured the noise barriers resistance to loads, all but one participant said they did not take load measurements. None of the NRAs measured the vibration and fatigue a barrier may experience over the course of its service life.
4.3.2.4 Property: Acoustic Ability There were five characteristics within this property group. As can be seen from Figure 5, the majority of NRAs did not actively measure the amount of sound that is reflected from their barriers. Similarly, the majority of NRAs did not measure the airborne sound insulation performance of their assets over their service life, nor the sound absorption. Further to this none of the participating NRAs measured sound diffraction. As highlighted in the QUESTIM project (Morgan, 2013) sound diffraction (i.e. the amount of sound diffracted over the top of the barrier) is the most important factor limiting a barrier’s acoustic performance. Only two NRAs made measurements of insertion loss. This, however, was not an in-situ measurement; instead models and calculations were developed based on the manufacturer’s declared performance values.
Figure 5: Acoustic ability characteristic results
4.3.2.5 Property: Visibility There was only one characteristic within this property group, Light Reflectivity. None of the participating NRAs undertook measurements of night-time light reflection for the barriers on their network.
4.3.2.6 Property: Environment There was only one characteristic within this property group, Environmental Protection. None of the participating NRAs made in-situ measurements related to the environmental protection afforded or impaired by their barriers.
CEDR Call 2014: Asset Management and Maintenance
Page 52 of 107
4.3.2.7 Property: Safety There were three characteristics within this property group: Resistance to Brushwood Fire, Impact from Collision, and Maximum allowable distance between emergency exits. As is the case for most of the characteristics discussed above, none of the NRAs undertook in-situ measurements in order to assess the performance of the asset in relation to resistance to brushwood fire and the maximum allowable distance between emergency exits. Although the guiding standards do offer a method for laboratory based measurements of brushwood fire, they do not offer a non-destructive in-situ method to assess brushwood fire. The maximum allowable distance between emergency exits is a design consideration and once the barrier has been installed this cannot be altered with ease, however post-installation checks should be made to ensure the structure is built in accordance with the designer’s plans.
4.3.3 QUESTIM
The QUESTIM project (Morgan, 2014) asked NRAs about the minimum levels applied to the initial acoustic level of performance for their noise barriers. Of the 19 NRAs responding to the survey, only 6 did not specify any requirements for barriers to meet. Where requirements did exist, these were most commonly category B3 (DLR>24dB) for airborne sound insulation performance and category A3 (DLα between 8 and 11dB) for sound absorption performance.
In terms of lifetime acoustic performance, only eight of the responding NRAs specified any form of requirements for barriers on their networks, with the majority opting for a time-dependent requirement for barriers to maintain acoustic performance (ranging from 10-30 years).
4.4 Summary and Recommendations
The results from the NRA questionnaire suggested that NRAs felt that Inventory was the most important information to collect for noise barriers - without this, collecting condition data is redundant. The inventory should contain information such as location, acoustic type, acoustic element composition, geometric properties, details of complaints and dates/details of installation, maintenance, inspection etc.
Airborne Sound Insulation was the characteristic considered to be most important by the NRAs and was the most measured condition characteristic (joint with insertion loss). Thus this was considered to be the second most important key characteristic for noise barriers.
Sound Reflection was the second most important characteristic to the NRAs. It was measured less by the NRAs than insulation and has therefore been considered to be the third most important key characteristic for noise barriers. Sound Absorption is a complementary measure to Sound Reflection and thus these two characteristics have been considered together.
Another acoustic characteristic, sound diffraction (the amount of sound passing directly over the barrier), was not measured by any of the NRAs nor was it identified as being important to monitor. The QUESTIM project identified this property as the most important factor limiting a noise barrier’s acoustic performance. However, since it is a function determined by geometrical characteristics (the difference between the direct path length from source to receiver and the path length from source to receiver over the top of the noise barrier) and therefore determined by the height of the barrier relative to the source and receiver, it is not a characteristic measured directly or addressed by any standards. EN 1793-4 addresses solely the diffraction performance of added devices and not noise barriers themselves.
CEDR Call 2014: Asset Management and Maintenance
Page 53 of 107
The third most important characteristic identified by the NRAs was the Vibration and Fatigue experienced by noise barriers and this was given a medium to high importance rating. This characteristic was not measured by any of the respondents and thus has been ranked as the fourth most important key characteristic.
Impact from collision was ranked as the fourth most important characteristic by the NRAs. As with vibration and fatigue, this characteristic was not measured by any of the respondents but there was a desire to be able to measure it. It has been considered to be the fifth most important key characteristic.
The fifth most important characteristic identified by the NRAs was Resistance to Loads. Again this was not measured but was considered to be of medium importance. Thus it has been ranked as the sixth most important
Insertion Loss was ranked as the sixth most important characteristic by the NRAs and was measured by two of the respondents. This characteristic can only be measured at the installation of the noise barrier, as it requires knowledge of the noise levels before the noise barrier is present and then once it is installed. Whilst the noise levels without the barrier can be modelled, it is not always possible to do a direct measurement.
Also, insertion loss could be estimated from measurements of sound absorption/reflection, insulation and diffraction and this characteristic is strongly dependent on the location. Insertion Loss is considering the so-called extrinsic characteristics, while in-situ sound reflection and in-situ airborne sound insulation are so-called intrinsic characteristics of the product noise barrier. Thus it is felt that Insertion Loss should not be considered to be a key characteristic.
In summary, the key characteristics of noise barriers that indicate their condition and are considered important by road owners, or by noise experts, are therefore:
Acoustic Ability – Sound diffraction (in particular for added devices placed on the barrier top)
Acoustic Ability - Long-Term Acoustic Performance: Airborne sound insulation
Acoustic Ability – Long-Term Acoustic Performance: Sound absorption
Structural Integrity - Vibration & Fatigue
Safety - Impact from Collison
Structural Integrity - Resistance to Loads.
CEDR Call 2014: Asset Management and Maintenance
Page 54 of 107
5 Technical Background – Methods for Measuring the Condition of Noise Barriers
5.1 Information Gathering
5.1.1 Survey/Equipment Provider Questionnaire
A questionnaire, consisting of 9 questions relating to noise barriers (Appendix B) aimed to understand the current inspection techniques used by survey providers; i.e. what equipment is used for monitoring, what characteristics they measure, what data is delivered, and how this data is then used to assess the asset's condition. In total 16 survey/equipment providers were identified and contacted. Despite repeated efforts to engage with this stakeholder group, only three survey providers submitted completed questionnaires in the allocated time frame. The following summarises the responses received for current surveys.
Q1. For which road network(s) have you had or do you have a contract to provide asset surveys for?
All survey providers carried out assessments of noise barriers located on motorways and strategic roads. One provider stated they also carried out surveys on smaller local roads.
Q2. What survey methods/techniques do you currently use to monitor the condition of noise barriers? What measurements are recorded?
As highlighted in the previous section, the only method currently employed by survey providers is by means of a visual inspection. One provider said they carried out low-speed assessments that paid particular focus to mechanical damage and corrosion. The barrier was then assigned a performance score on this basis. Two survey providers said they carried out traffic speed surveys. The first was DriveBy’s Mobile Mapping product which captured the following: video footage, GNSS data, and inertial data. From this they had a platform that enabled measurements to be made of the assets exact location, height (m), the type of barrier, images, and overall condition. The second traffic speed survey did not employ this above platform but instead relied upon an experienced inspector to perform a coarse visual assessment and manually score the asset, scoring between 0-3.
Q3. Please indicate whether any of the slow speed survey methods listed above could be performed at traffic speed.
With the exception of the two high-speed methods (such as DriveBy’s Mobile Mapping), the survey provider who undertook slow-speed manual surveys did not believe a thorough inspection could take place from a vehicle.
Q4. How is the inspection performed? Please describe how the condition of noise barriers is determined? How do you define the condition of noise barriers? (For example: Scale 1-5; Yes/No; good condition – bad condition)
As stated above the basic visual inspection used a scoring system, 0-3, to generalise the performance of the barrier. The more promising high-speed technique is performed on an individual project basis, depending on the requirements of the client.
Q5. Does the inspection take place according to a standard? If so, please provide details of this.
None of the survey providers carried out their inspections in accordance with any form of standard or national guidance.
Q6. How often does inspection take place?

CEDR Call 2014: Asset Management and Maintenance
Page 55 of 107
The DriveBy Mobile Mapping high speed surveys were rarely undertaken. Manual slow speed inspections were reported to be carried out once per year. While the high speed scoring method was conducted twice per year. However the frequency of inspections is based on the demands and budget set out by the client.
Q7. What are the yearly costs per km for these measures?
The high speed scoring survey costs approximately €1/km for just the measurements. Analysing the collected data and subsequently generating reports incurs further costs. The other two methods did not disclose their costs due to commercially sensitive information.
Q8. Are you aware of any novel or emerging technology that could be used to provide high speed measurements of noise barrier condition? If so, please provide details of this
None of the providers were aware of any novel techniques for assessing any performance characteristics of noise barriers. However DriveBy’s Mobile mapping is relatively novel in comparison to the other survey methodologies.
5.1.2 Information gathering – further consultation and review
In addition to the stakeholder (survey provider) questionnaire discussed above, a further knowledge gathering exercise was carried out to seek information on the methods available for the measurement of noise barriers. This built on the interview provided by the AIT’s acoustic team, combined with a review of available literature on equipment, to identify existing and emerging technologies. PREMIUM also identified previous research projects, including ADRIENNE, QUIESST and QUESTIM as information resources for different measurement techniques for collection data of noise barriers; measurement methods developed within some of these projects form the basis of the measurement methods now in being incorporated into European Standards.
The results of the further information gathering are discussed in the following sections, in which we break down the technologies identified in terms of the key characteristics listed in Section 2:
Inventory
Acoustic ability: Sound Diffraction
Acoustic ability: Airborne sound insulation
Acoustic ability: Sound reflection/absorption
Structural Integrity: Vibration and Fatigue
Safety: Impact from Collision
Structural Integrity: Resistance to Loads
These measurement technologies are shown in Figure 6. The techniques include visual inspections, video surveys, LiDAR technology and in-situ measurements.

CEDR Call 2014: Asset Management and Maintenance
Page 56 of 107
Figure 6: Measurement technologies for monitoring of noise barriers
5.1.3 Summary of Consultation and Review
Long-term acoustic performance The consultation appears to indicate that, whilst an on-site measurement method can be used to measure the acoustic performance of a noise barrier in order to inform on its long-term performance, this is not currently used in practice.
Vibration and fatigue Similarly, the consultation results suggest that there are no methods currently used to determine the effect of vibration and fatigue on the noise barrier.
Impact from collision Damage caused by vehicle impact is currently measured through visual inspection. Some consultees thought that this could only be done via a slow speed manual survey, whilst others felt that the information could be obtained from assessment of a video (collected at traffic speed) or from a vehicle travelling at traffic speed. Both traffic speed assessments require good visibility of the entire noise barrier from the road.
Resistance to loads The consultation appears to indicate that there are no current measurement methods to assess a noise barrier’s resistance to loads, once in-situ.
Insertion loss The consultation results suggest that, whilst an on-site measurement method can be used to measure the reduction in noise, due to the insertion of a noise barrier, this is not currently used in practice.
Mo
nit
ori
ng
No
ise
Bar
rier
s Inventory data
Location,
Details
Visual inspection
Video
LiDAR
Acoustic ability
Sound
Reflection
ADRIENNE
QUIESST
Novel technique
Airborne Sound Insulation
ADRIENNE
QUIESST
Sound
Diffraction In-situ
CEDR Call 2014: Asset Management and Maintenance
Page 57 of 107
5.2 Measuring the inventory of noise barriers
PREMiUM identified the following methods for measuring the inventory of noise barriers:
Historical Record Review: Reference to existing records such as construction drawings, documentation and contracts.
Visual Survey (Low-Speed): Field Inventory, a slow speed manual survey utilising a hand-held GPS data logging device, notepad, measurement equipment, tablet pc/laptop with suitable software (macros). This method requires traffic management (TM) for road closures. These inspections normally occur during night-time hours (8/9pm – 5am). Depending on the extent of the closure, TM time constraints, weather, and general health and safety conditions, a single inspection (carried out by an experienced inspector) could survey 3-5km of barrier on foot per night.
Visual Survey (traffic-speed): Vehicles enabled with GPS/GNSS recording devices (e.g. Oxford Tracker/Trimble Applanix), forward facing imaging capabilities, and odometer. This method does not require traffic management, and is performed during the day-time, at traffic speed. Weather conditions should be dry and clear. The accuracy of GPS devices can vary depending on their quality and signal strength at time of measurement. The accuracy of satellite imagery, such as Google Maps, can also vary; in some cases co-ordinates can be several meters out when compared with measurements taken onsite using a quality GPS device. Considering the narrow dimensions of safety barriers it is appropriate that any location co-ordinates have an accuracy of ±20cm. Other descriptions of the location should be to a level of detail that would allow any survey provider to locate the assets without GPS co-ordinates.
A desktop survey utilising up-to-date satellite and street-view maps/imagery (e.g. Google Earth Pro/StreetView, Ordinance Survey) could also be undertaken to determine the exact geographical location of assets.
As noted in Section 3, it has been generally recognised that information on the asset inventory is important for effective management of the noise barriers. The collection of inventory data forms the basis of road inventory management as it enables the road authority to understand the extent and value of the inventory stock present on their network and can be linked with ongoing condition monitoring. Ideally the inventory should be continuously updated.
As observed in the TRIMM project (Spielhofer, 2014) road authorities commonly collect inventory data using pen and paper and optionally a GPS transmitter. This requires that an inspector walks the network to record the location of assets. As a result TRIMM concluded that the approach to the collection of inventory data in some of the leading industrial countries of the European Union is resulting in limited knowledge about the type, location and condition of road inventory.
However, there are a number of new/emerging recording methods which can be used for inventory data collection:
Photogrammetric, one camera (2D location).
Photogrammetric, panorama (2D location, 360° view).
Photogrammetric, two cameras (stereovision, 3D location).
Photogrammetric, multiple cameras (3D location).
Laser scanning (LIDAR), static (3D Point cloud with intensity/colour information).
Laser scanning (LIDAR), moving (3D Point corridor point cloud with intensity/colour information).
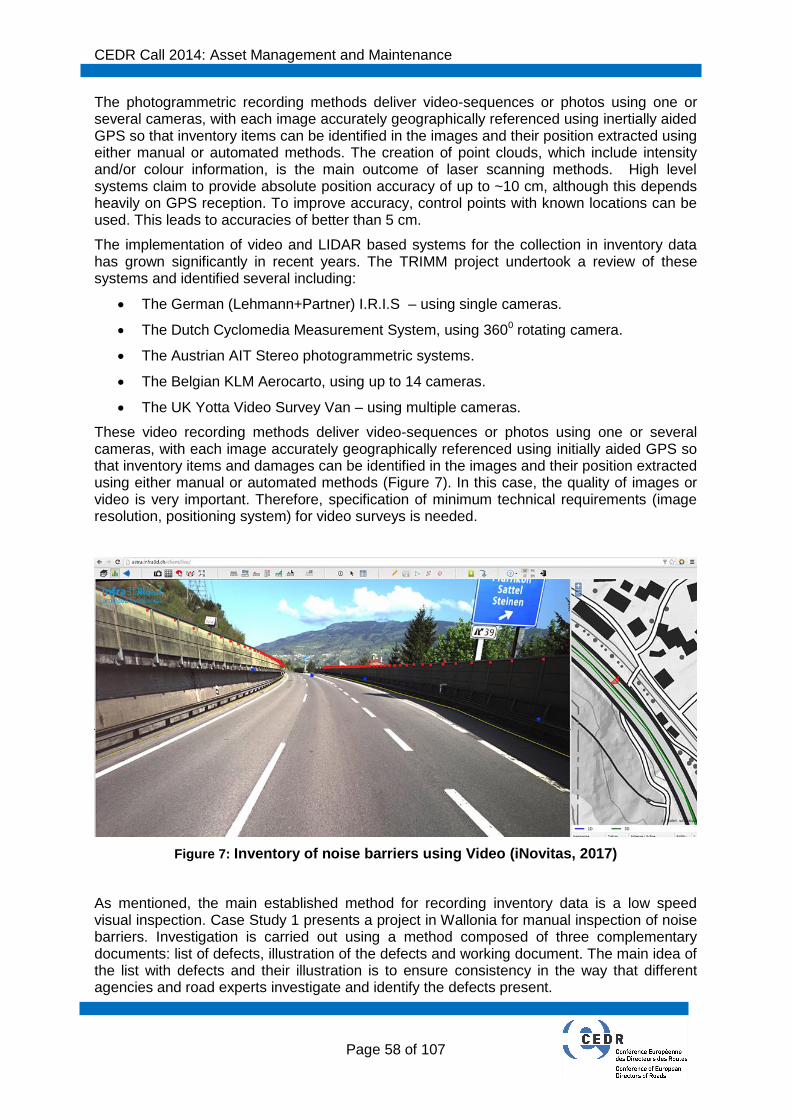
CEDR Call 2014: Asset Management and Maintenance
Page 58 of 107
The photogrammetric recording methods deliver video-sequences or photos using one or several cameras, with each image accurately geographically referenced using inertially aided GPS so that inventory items can be identified in the images and their position extracted using either manual or automated methods. The creation of point clouds, which include intensity and/or colour information, is the main outcome of laser scanning methods. High level systems claim to provide absolute position accuracy of up to ~10 cm, although this depends heavily on GPS reception. To improve accuracy, control points with known locations can be used. This leads to accuracies of better than 5 cm.
The implementation of video and LIDAR based systems for the collection in inventory data has grown significantly in recent years. The TRIMM project undertook a review of these systems and identified several including:
The German (Lehmann+Partner) I.R.I.S – using single cameras.
The Dutch Cyclomedia Measurement System, using 3600 rotating camera.
The Austrian AIT Stereo photogrammetric systems.
The Belgian KLM Aerocarto, using up to 14 cameras.
The UK Yotta Video Survey Van – using multiple cameras.
These video recording methods deliver video-sequences or photos using one or several cameras, with each image accurately geographically referenced using initially aided GPS so that inventory items and damages can be identified in the images and their position extracted using either manual or automated methods (Figure 7). In this case, the quality of images or video is very important. Therefore, specification of minimum technical requirements (image resolution, positioning system) for video surveys is needed.
Figure 7: Inventory of noise barriers using Video (iNovitas, 2017)
As mentioned, the main established method for recording inventory data is a low speed visual inspection. Case Study 1 presents a project in Wallonia for manual inspection of noise barriers. Investigation is carried out using a method composed of three complementary documents: list of defects, illustration of the defects and working document. The main idea of the list with defects and their illustration is to ensure consistency in the way that different agencies and road experts investigate and identify the defects present.

CEDR Call 2014: Asset Management and Maintenance
Page 59 of 107
This manual method is very difficult and complex because it incurs additional health and safety issues – in some cases the noise barrier is very close to the road and the inspector is not protected and may be in danger (Figure 8). Furthermore, the noise barrier can be several kilometres long. Therefore, this method is not practical for network level measurement.
Figure 8: Example for noise barrier, where inspection may be dangerous
Figure 9: Noise barrier protected with VRS
Case Study 1: Management of noise barriers in Wallonia (Marcocci, 2016)
In 2014, the Ministry of public works of Wallonia asked the administration and especially the “Road Noise Division” to establish the state of art of Noise barriers along the roads in Wallonia. After the development of a database including all their characteristics and locations, different ways were explored to define a procedure that could be used to determine the condition of the noise barriers. The “Road Noise Division” defined a method composed of three complementary documents (Figure 11, Figure 12 and Figure 13).
The noise barriers are concentrated near cities as shown in Figure 10. The different types of devices are summarized in Table 10. The results show that most of the barriers, installed in Wallonia, are timber or metal. This information is very important and helpful to inform the way to identify the main defects of the noise barriers.
The first main document (Figure 11) contains a list of the major defects, which are found during
Figure 10: Locations the noise barriers along major roads in Wallonia
Table 10: Length of each kind of barriers along major roads in Wallonia
an investigation of different types of noise barriers. The defects are linked to each part of the barrier with an associated code. A unique colour is attached for each defect, which will be useful in the inspection’s report.
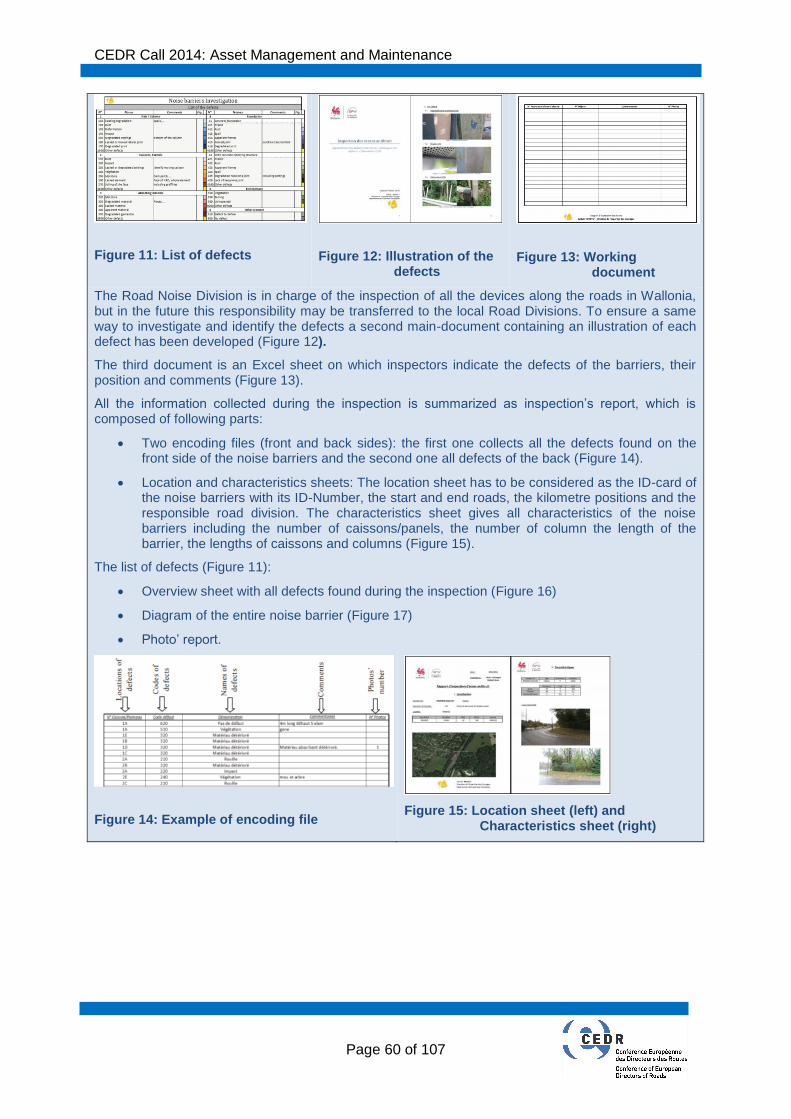
CEDR Call 2014: Asset Management and Maintenance
Page 60 of 107
Figure 11: List of defects
Figure 12: Illustration of the defects
Figure 13: Working document
The Road Noise Division is in charge of the inspection of all the devices along the roads in Wallonia, but in the future this responsibility may be transferred to the local Road Divisions. To ensure a same way to investigate and identify the defects a second main-document containing an illustration of each defect has been developed (Figure 12).
The third document is an Excel sheet on which inspectors indicate the defects of the barriers, their position and comments (Figure 13).
All the information collected during the inspection is summarized as inspection’s report, which is composed of following parts:
Two encoding files (front and back sides): the first one collects all the defects found on the front side of the noise barriers and the second one all defects of the back (Figure 14).
Location and characteristics sheets: The location sheet has to be considered as the ID-card of the noise barriers with its ID-Number, the start and end roads, the kilometre positions and the responsible road division. The characteristics sheet gives all characteristics of the noise barriers including the number of caissons/panels, the number of column the length of the barrier, the lengths of caissons and columns (Figure 15).
The list of defects (Figure 11):
Overview sheet with all defects found during the inspection (Figure 16)
Diagram of the entire noise barrier (Figure 17)
Photo’ report.
Figure 14: Example of encoding file
Figure 15: Location sheet (left) and Characteristics sheet (right)
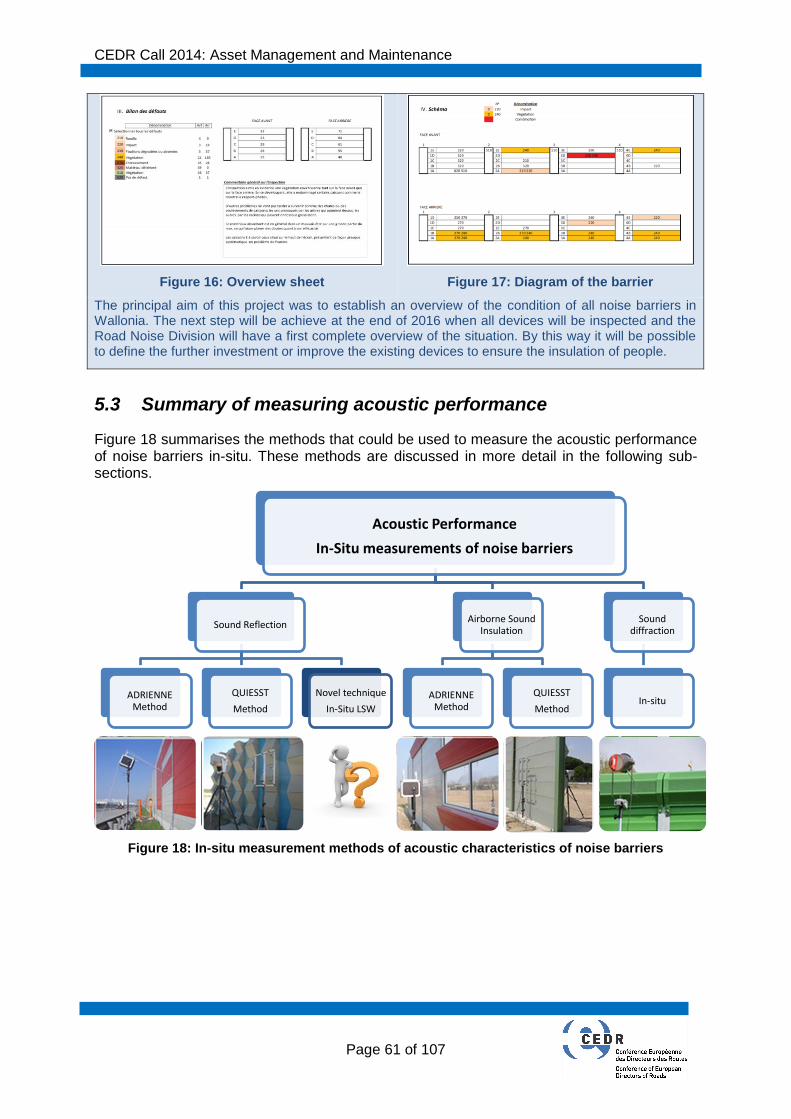
CEDR Call 2014: Asset Management and Maintenance
Page 61 of 107
Figure 16: Overview sheet
Figure 17: Diagram of the barrier
The principal aim of this project was to establish an overview of the condition of all noise barriers in Wallonia. The next step will be achieve at the end of 2016 when all devices will be inspected and the Road Noise Division will have a first complete overview of the situation. By this way it will be possible to define the further investment or improve the existing devices to ensure the insulation of people.
5.3 Summary of measuring acoustic performance
Figure 18 summarises the methods that could be used to measure the acoustic performance of noise barriers in-situ. These methods are discussed in more detail in the following sub-sections.
Figure 18: In-situ measurement methods of acoustic characteristics of noise barriers
Acoustic Performance
In-Situ measurements of noise barriers
Sound Reflection
ADRIENNE Method
QUIESST
Method
Novel technique
In-Situ LSW
Airborne Sound Insulation
ADRIENNE Method
QUIESST
Method
Sound diffraction
In-situ
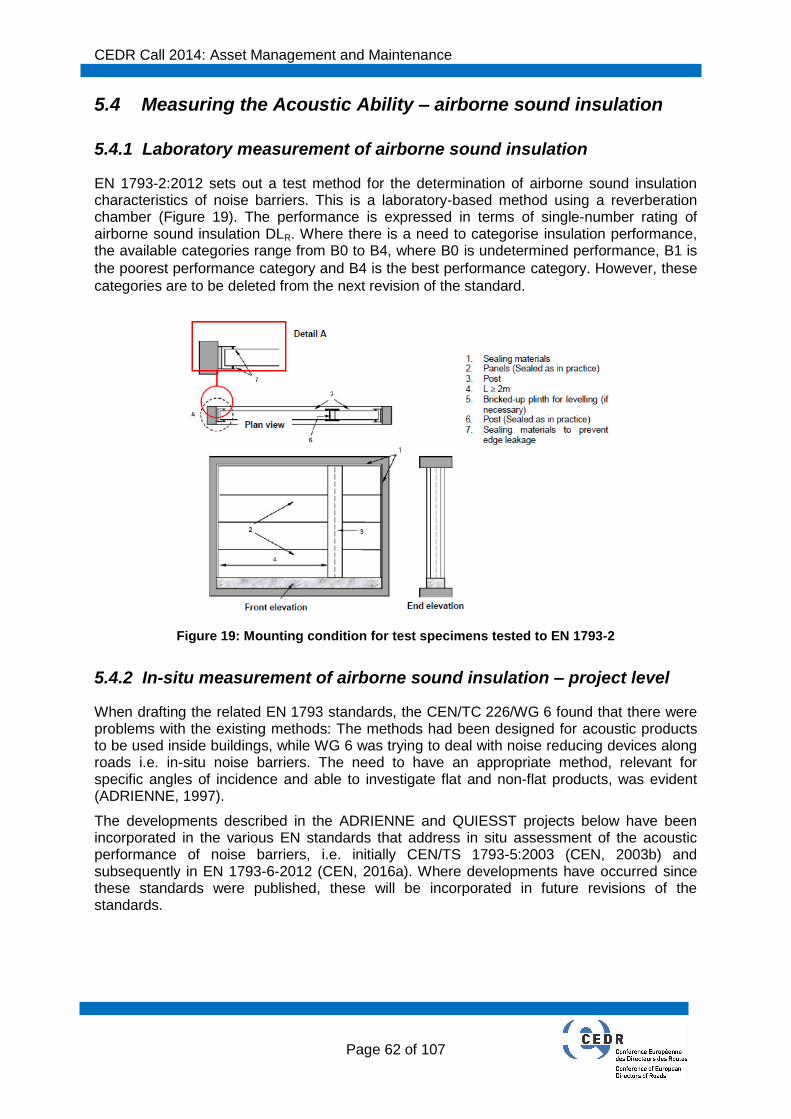
CEDR Call 2014: Asset Management and Maintenance
Page 62 of 107
5.4 Measuring the Acoustic Ability – airborne sound insulation
5.4.1 Laboratory measurement of airborne sound insulation
EN 1793-2:2012 sets out a test method for the determination of airborne sound insulation characteristics of noise barriers. This is a laboratory-based method using a reverberation chamber (Figure 19). The performance is expressed in terms of single-number rating of airborne sound insulation DLR. Where there is a need to categorise insulation performance, the available categories range from B0 to B4, where B0 is undetermined performance, B1 is
the poorest performance category and B4 is the best performance category. However, these
categories are to be deleted from the next revision of the standard.
Figure 19: Mounting condition for test specimens tested to EN 1793-2
5.4.2 In-situ measurement of airborne sound insulation – project level
When drafting the related EN 1793 standards, the CEN/TC 226/WG 6 found that there were problems with the existing methods: The methods had been designed for acoustic products to be used inside buildings, while WG 6 was trying to deal with noise reducing devices along roads i.e. in-situ noise barriers. The need to have an appropriate method, relevant for specific angles of incidence and able to investigate flat and non-flat products, was evident (ADRIENNE, 1997).
The developments described in the ADRIENNE and QUIESST projects below have been incorporated in the various EN standards that address in situ assessment of the acoustic performance of noise barriers, i.e. initially CEN/TS 1793-5:2003 (CEN, 2003b) and subsequently in EN 1793-6-2012 (CEN, 2016a). Where developments have occurred since these standards were published, these will be incorporated in future revisions of the standards.
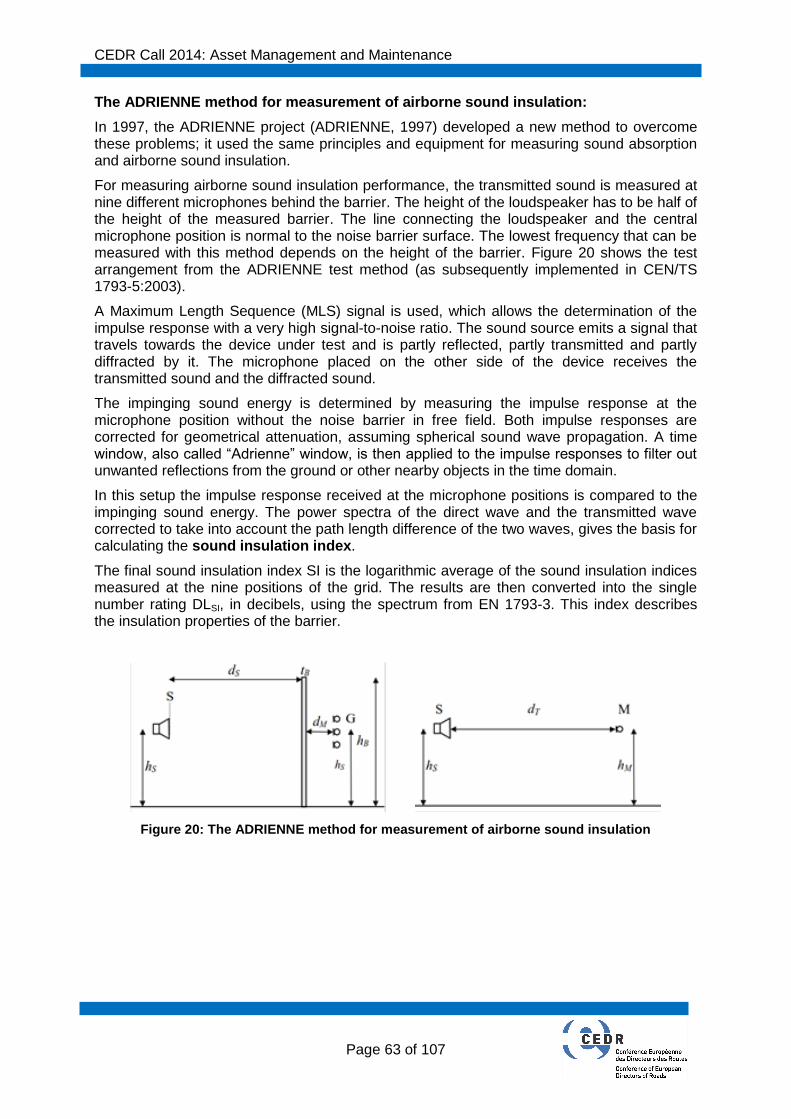
CEDR Call 2014: Asset Management and Maintenance
Page 63 of 107
The ADRIENNE method for measurement of airborne sound insulation:
In 1997, the ADRIENNE project (ADRIENNE, 1997) developed a new method to overcome these problems; it used the same principles and equipment for measuring sound absorption and airborne sound insulation.
For measuring airborne sound insulation performance, the transmitted sound is measured at nine different microphones behind the barrier. The height of the loudspeaker has to be half of the height of the measured barrier. The line connecting the loudspeaker and the central microphone position is normal to the noise barrier surface. The lowest frequency that can be measured with this method depends on the height of the barrier. Figure 20 shows the test arrangement from the ADRIENNE test method (as subsequently implemented in CEN/TS 1793-5:2003).
A Maximum Length Sequence (MLS) signal is used, which allows the determination of the impulse response with a very high signal-to-noise ratio. The sound source emits a signal that travels towards the device under test and is partly reflected, partly transmitted and partly diffracted by it. The microphone placed on the other side of the device receives the transmitted sound and the diffracted sound.
The impinging sound energy is determined by measuring the impulse response at the microphone position without the noise barrier in free field. Both impulse responses are corrected for geometrical attenuation, assuming spherical sound wave propagation. A time window, also called “Adrienne” window, is then applied to the impulse responses to filter out unwanted reflections from the ground or other nearby objects in the time domain.
In this setup the impulse response received at the microphone positions is compared to the impinging sound energy. The power spectra of the direct wave and the transmitted wave corrected to take into account the path length difference of the two waves, gives the basis for calculating the sound insulation index.
The final sound insulation index SI is the logarithmic average of the sound insulation indices measured at the nine positions of the grid. The results are then converted into the single number rating DLSI, in decibels, using the spectrum from EN 1793-3. This index describes the insulation properties of the barrier.
Figure 20: The ADRIENNE method for measurement of airborne sound insulation
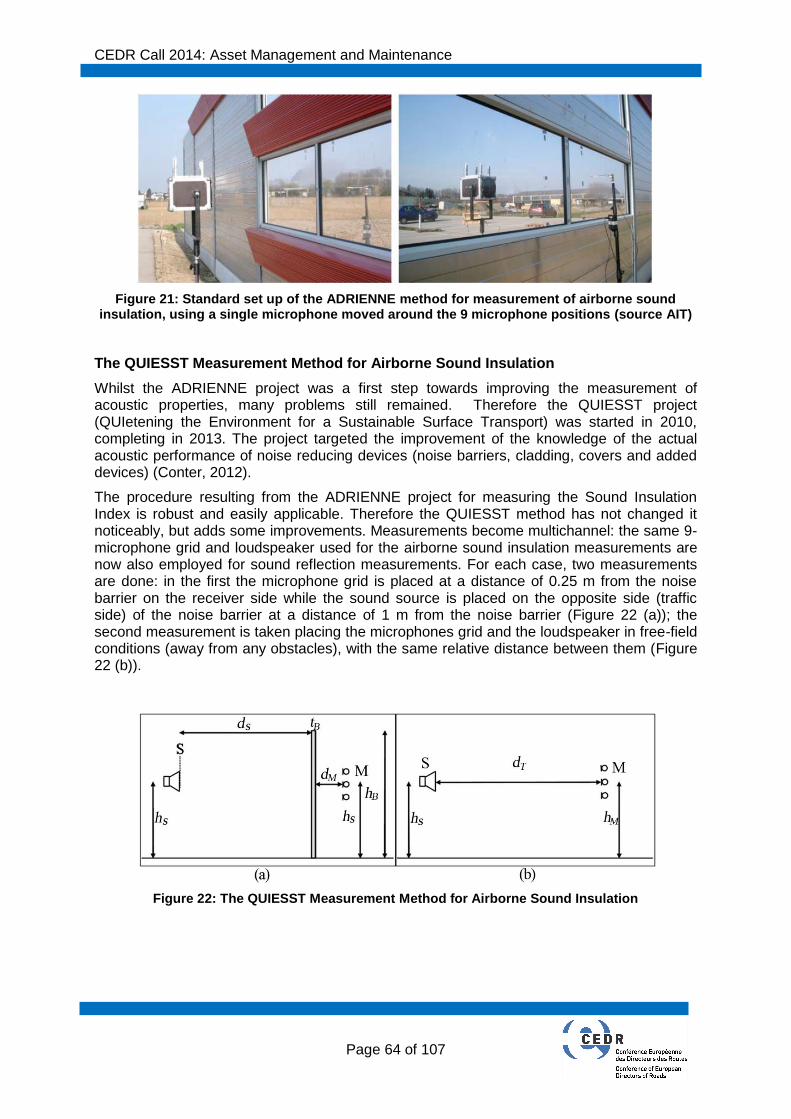
CEDR Call 2014: Asset Management and Maintenance
Page 64 of 107
Figure 21: Standard set up of the ADRIENNE method for measurement of airborne sound insulation, using a single microphone moved around the 9 microphone positions (source AIT)
The QUIESST Measurement Method for Airborne Sound Insulation
Whilst the ADRIENNE project was a first step towards improving the measurement of acoustic properties, many problems still remained. Therefore the QUIESST project (QUIetening the Environment for a Sustainable Surface Transport) was started in 2010, completing in 2013. The project targeted the improvement of the knowledge of the actual acoustic performance of noise reducing devices (noise barriers, cladding, covers and added devices) (Conter, 2012).
The procedure resulting from the ADRIENNE project for measuring the Sound Insulation Index is robust and easily applicable. Therefore the QUIESST method has not changed it noticeably, but adds some improvements. Measurements become multichannel: the same 9-microphone grid and loudspeaker used for the airborne sound insulation measurements are now also employed for sound reflection measurements. For each case, two measurements are done: in the first the microphone grid is placed at a distance of 0.25 m from the noise barrier on the receiver side while the sound source is placed on the opposite side (traffic side) of the noise barrier at a distance of 1 m from the noise barrier (Figure 22 (a)); the second measurement is taken placing the microphones grid and the loudspeaker in free-field conditions (away from any obstacles), with the same relative distance between them (Figure 22 (b)).
Figure 22: The QUIESST Measurement Method for Airborne Sound Insulation
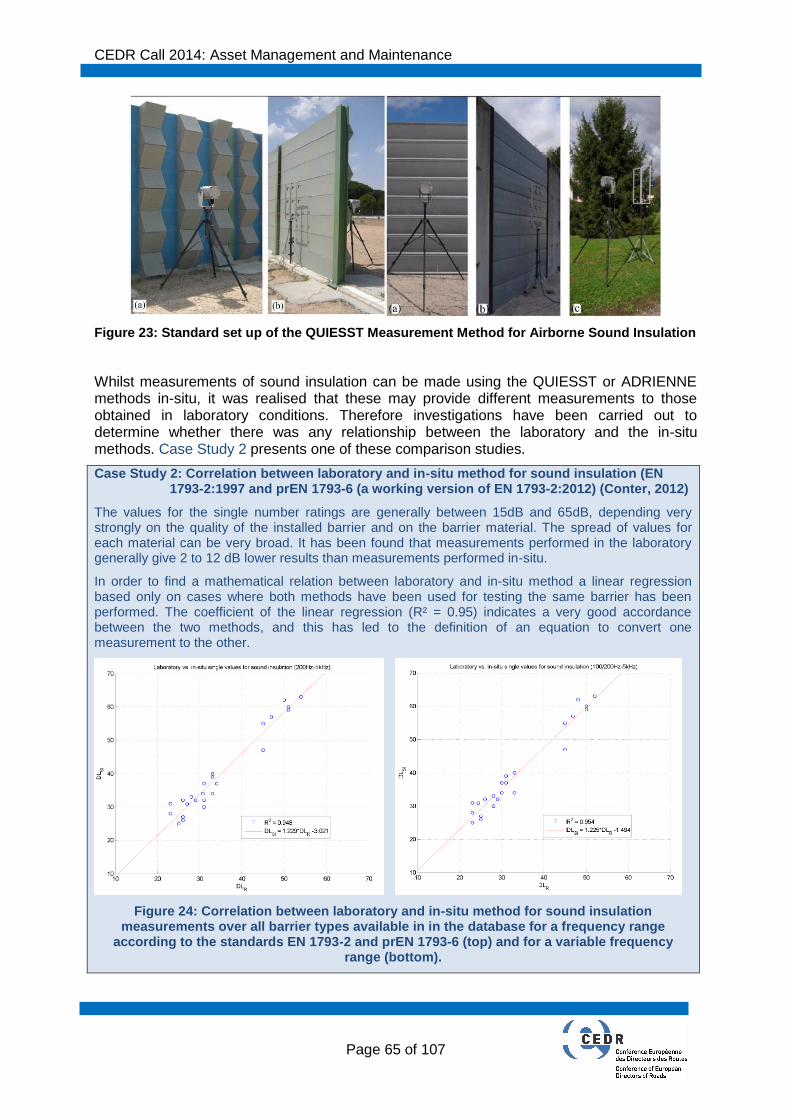
CEDR Call 2014: Asset Management and Maintenance
Page 65 of 107
Figure 23: Standard set up of the QUIESST Measurement Method for Airborne Sound Insulation
Whilst measurements of sound insulation can be made using the QUIESST or ADRIENNE methods in-situ, it was realised that these may provide different measurements to those obtained in laboratory conditions. Therefore investigations have been carried out to determine whether there was any relationship between the laboratory and the in-situ methods. Case Study 2 presents one of these comparison studies.
Case Study 2: Correlation between laboratory and in-situ method for sound insulation (EN 1793-2:1997 and prEN 1793-6 (a working version of EN 1793-2:2012) (Conter, 2012)
The values for the single number ratings are generally between 15dB and 65dB, depending very strongly on the quality of the installed barrier and on the barrier material. The spread of values for each material can be very broad. It has been found that measurements performed in the laboratory generally give 2 to 12 dB lower results than measurements performed in-situ.
In order to find a mathematical relation between laboratory and in-situ method a linear regression based only on cases where both methods have been used for testing the same barrier has been performed. The coefficient of the linear regression (R² = 0.95) indicates a very good accordance between the two methods, and this has led to the definition of an equation to convert one measurement to the other.
Figure 24: Correlation between laboratory and in-situ method for sound insulation measurements over all barrier types available in in the database for a frequency range
according to the standards EN 1793-2 and prEN 1793-6 (top) and for a variable frequency range (bottom).
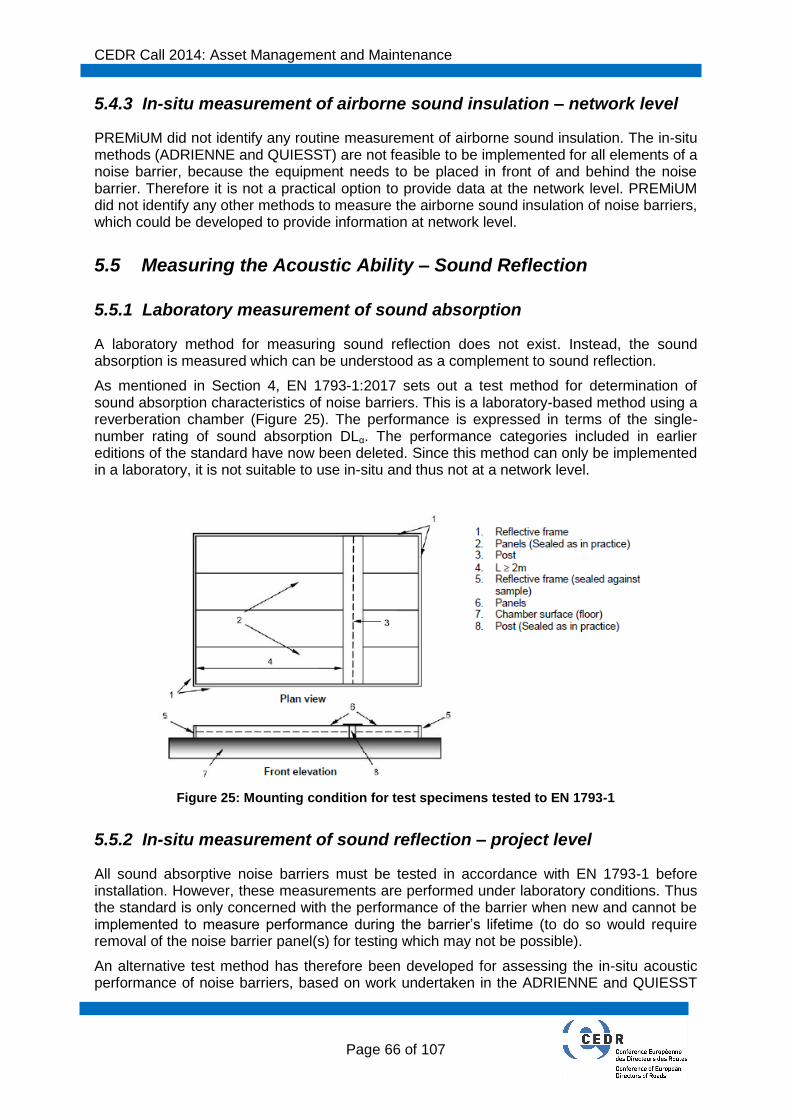
CEDR Call 2014: Asset Management and Maintenance
Page 66 of 107
5.4.3 In-situ measurement of airborne sound insulation – network level
PREMiUM did not identify any routine measurement of airborne sound insulation. The in-situ methods (ADRIENNE and QUIESST) are not feasible to be implemented for all elements of a noise barrier, because the equipment needs to be placed in front of and behind the noise barrier. Therefore it is not a practical option to provide data at the network level. PREMiUM did not identify any other methods to measure the airborne sound insulation of noise barriers, which could be developed to provide information at network level.
5.5 Measuring the Acoustic Ability – Sound Reflection
5.5.1 Laboratory measurement of sound absorption
A laboratory method for measuring sound reflection does not exist. Instead, the sound absorption is measured which can be understood as a complement to sound reflection.
As mentioned in Section 4, EN 1793-1:2017 sets out a test method for determination of sound absorption characteristics of noise barriers. This is a laboratory-based method using a reverberation chamber (Figure 25). The performance is expressed in terms of the single-number rating of sound absorption DLα. The performance categories included in earlier editions of the standard have now been deleted. Since this method can only be implemented in a laboratory, it is not suitable to use in-situ and thus not at a network level.
Figure 25: Mounting condition for test specimens tested to EN 1793-1
5.5.2 In-situ measurement of sound reflection – project level
All sound absorptive noise barriers must be tested in accordance with EN 1793-1 before installation. However, these measurements are performed under laboratory conditions. Thus the standard is only concerned with the performance of the barrier when new and cannot be implemented to measure performance during the barrier’s lifetime (to do so would require removal of the noise barrier panel(s) for testing which may not be possible).
An alternative test method has therefore been developed for assessing the in-situ acoustic performance of noise barriers, based on work undertaken in the ADRIENNE and QUIESST
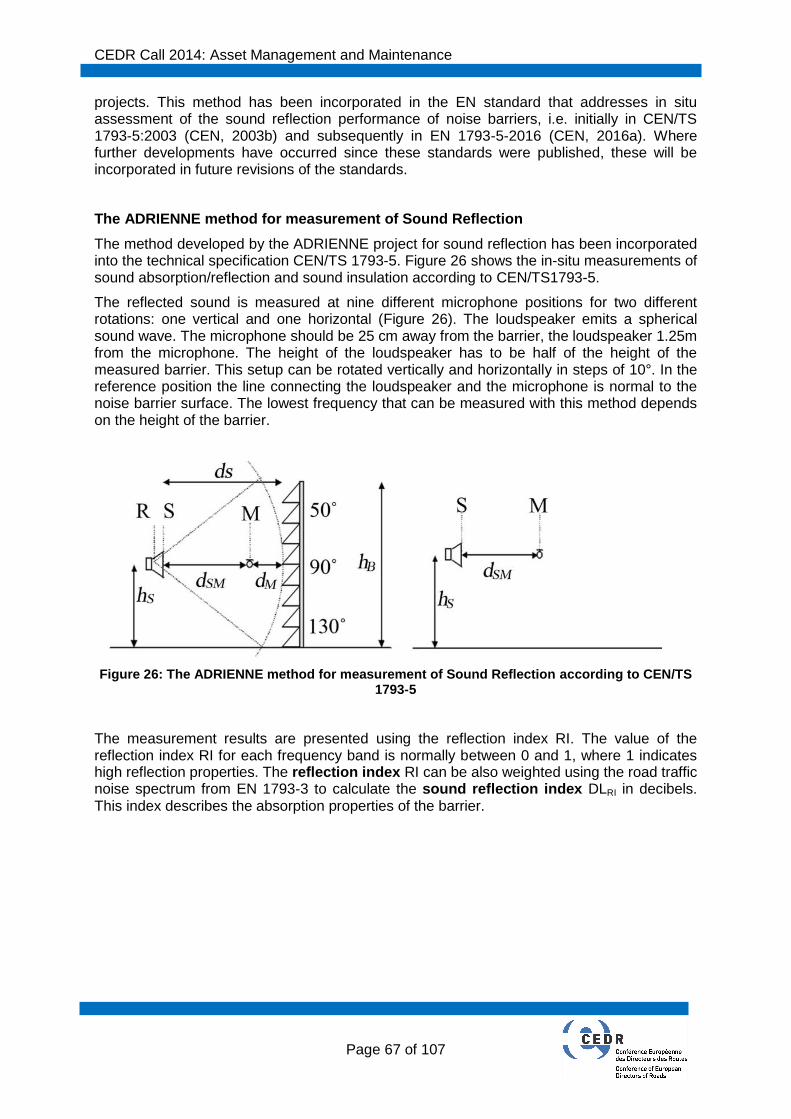
CEDR Call 2014: Asset Management and Maintenance
Page 67 of 107
projects. This method has been incorporated in the EN standard that addresses in situ assessment of the sound reflection performance of noise barriers, i.e. initially in CEN/TS 1793-5:2003 (CEN, 2003b) and subsequently in EN 1793-5-2016 (CEN, 2016a). Where further developments have occurred since these standards were published, these will be incorporated in future revisions of the standards.
The ADRIENNE method for measurement of Sound Reflection
The method developed by the ADRIENNE project for sound reflection has been incorporated into the technical specification CEN/TS 1793-5. Figure 26 shows the in-situ measurements of sound absorption/reflection and sound insulation according to CEN/TS1793-5.
The reflected sound is measured at nine different microphone positions for two different rotations: one vertical and one horizontal (Figure 26). The loudspeaker emits a spherical sound wave. The microphone should be 25 cm away from the barrier, the loudspeaker 1.25m from the microphone. The height of the loudspeaker has to be half of the height of the measured barrier. This setup can be rotated vertically and horizontally in steps of 10°. In the reference position the line connecting the loudspeaker and the microphone is normal to the noise barrier surface. The lowest frequency that can be measured with this method depends on the height of the barrier.
Figure 26: The ADRIENNE method for measurement of Sound Reflection according to CEN/TS 1793-5
The measurement results are presented using the reflection index RI. The value of the reflection index RI for each frequency band is normally between 0 and 1, where 1 indicates high reflection properties. The reflection index RI can be also weighted using the road traffic noise spectrum from EN 1793-3 to calculate the sound reflection index DLRI in decibels. This index describes the absorption properties of the barrier.
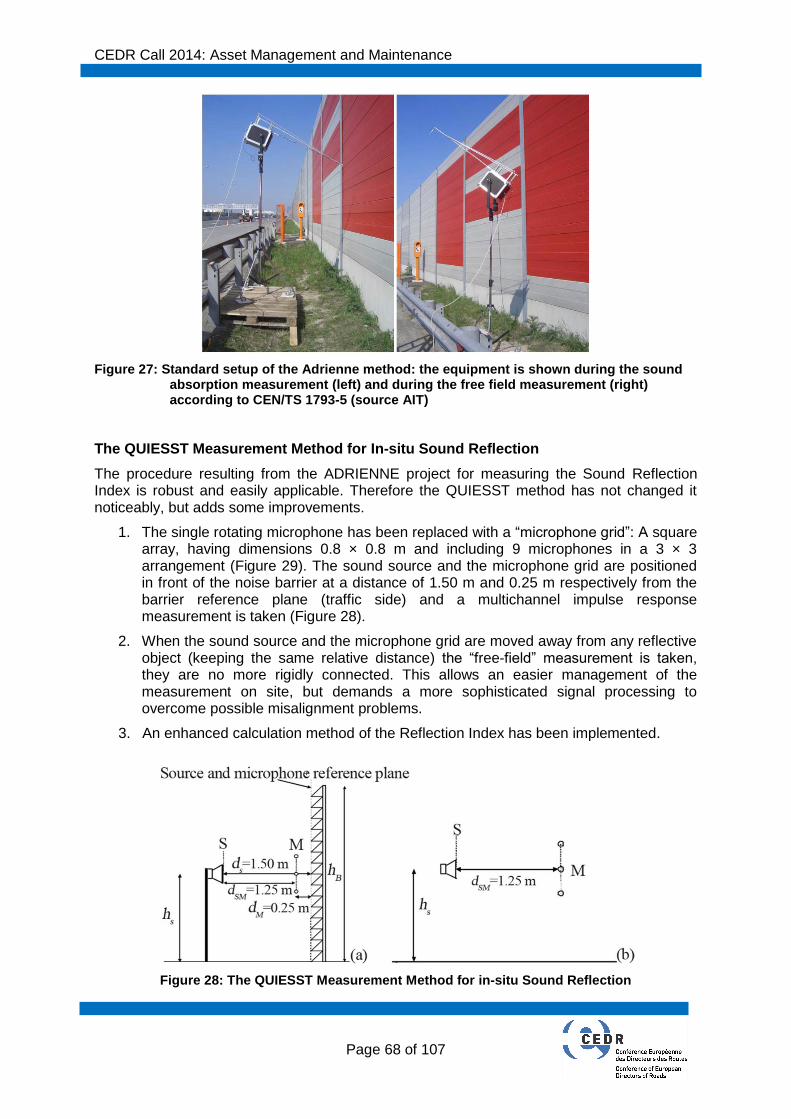
CEDR Call 2014: Asset Management and Maintenance
Page 68 of 107
Figure 27: Standard setup of the Adrienne method: the equipment is shown during the sound absorption measurement (left) and during the free field measurement (right) according to CEN/TS 1793-5 (source AIT)
The QUIESST Measurement Method for In-situ Sound Reflection
The procedure resulting from the ADRIENNE project for measuring the Sound Reflection Index is robust and easily applicable. Therefore the QUIESST method has not changed it noticeably, but adds some improvements.
1. The single rotating microphone has been replaced with a “microphone grid”: A square array, having dimensions 0.8 × 0.8 m and including 9 microphones in a 3 × 3 arrangement (Figure 29). The sound source and the microphone grid are positioned in front of the noise barrier at a distance of 1.50 m and 0.25 m respectively from the barrier reference plane (traffic side) and a multichannel impulse response measurement is taken (Figure 28).
2. When the sound source and the microphone grid are moved away from any reflective object (keeping the same relative distance) the “free-field” measurement is taken, they are no more rigidly connected. This allows an easier management of the measurement on site, but demands a more sophisticated signal processing to overcome possible misalignment problems.
3. An enhanced calculation method of the Reflection Index has been implemented.
Figure 28: The QUIESST Measurement Method for in-situ Sound Reflection
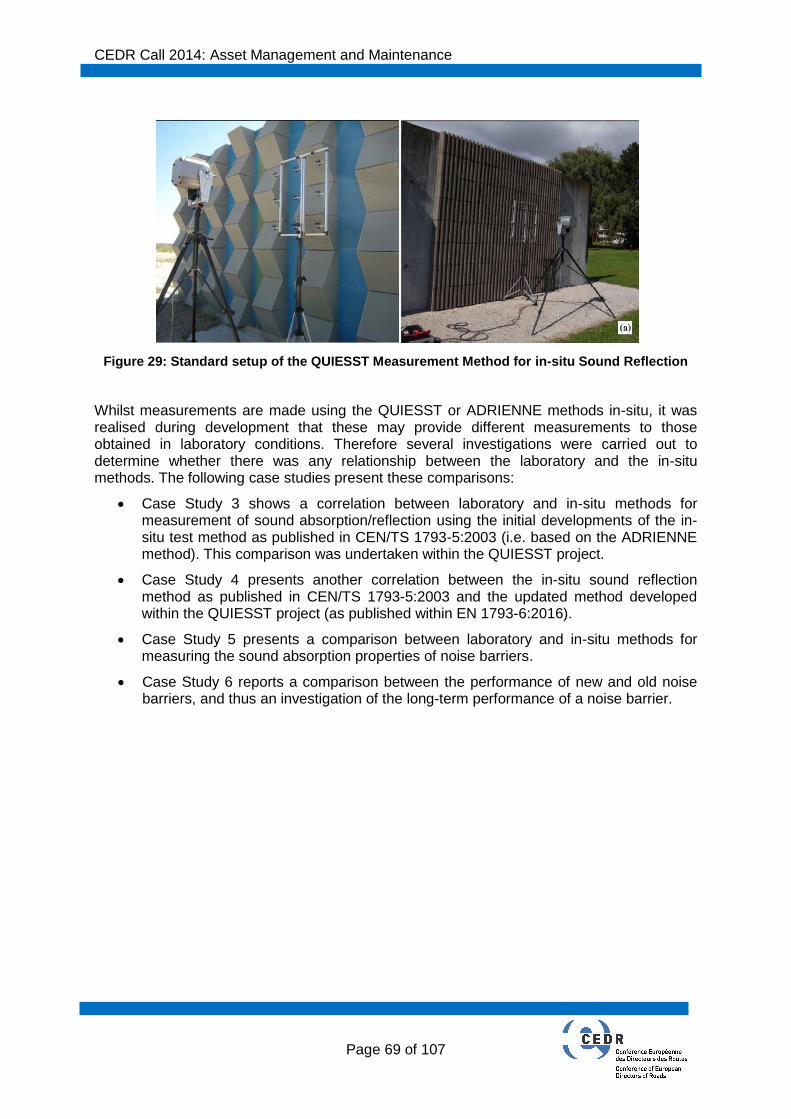
CEDR Call 2014: Asset Management and Maintenance
Page 69 of 107
Figure 29: Standard setup of the QUIESST Measurement Method for in-situ Sound Reflection
Whilst measurements are made using the QUIESST or ADRIENNE methods in-situ, it was realised during development that these may provide different measurements to those obtained in laboratory conditions. Therefore several investigations were carried out to determine whether there was any relationship between the laboratory and the in-situ methods. The following case studies present these comparisons:
Case Study 3 shows a correlation between laboratory and in-situ methods for measurement of sound absorption/reflection using the initial developments of the in-situ test method as published in CEN/TS 1793-5:2003 (i.e. based on the ADRIENNE method). This comparison was undertaken within the QUIESST project.
Case Study 4 presents another correlation between the in-situ sound reflection method as published in CEN/TS 1793-5:2003 and the updated method developed within the QUIESST project (as published within EN 1793-6:2016).
Case Study 5 presents a comparison between laboratory and in-situ methods for measuring the sound absorption properties of noise barriers.
Case Study 6 reports a comparison between the performance of new and old noise barriers, and thus an investigation of the long-term performance of a noise barrier.

CEDR Call 2014: Asset Management and Maintenance
Page 70 of 107
Case Study 3: Correlation between laboratory and in-situ test methods for sound absorption/reflection (test methods as published in EN 1793-1:1997 and CEN/TS 1793-5:2003) (Conter, 2012)
The values for the single number ratings can reach a maximum possible value of 20 dB. Depending on the quality of the installed barrier and on the barrier material the spread of values for each material can be very broad. Measurement results obtained with the laboratory method are in general considerably higher than the results obtained with the in-situ method. In fact in several cases laboratory results reach the maximum value of 20 dB, while in-situ results in general reach values of only up to 12 dB.
The analysis of the data leads to the conclusion that the laboratory method in general overestimates the acoustic performance in real conditions. Due to the fact that several barriers reach the same maximum level of 20 dB the laboratory method doesn’t really permit differentiation between these different barriers, whereas the in-situ method is able to do this.
In order to find a mathematical relation between the laboratory and in-situ method a linear regression, based only on cases where both methods have been used for testing the same barrier, has been performed. The coefficient of the linear regression (R² = 0.67) indicates moderate accordance between the two methods. This is mainly due to the fact that several barriers obtain the same maximum level of 20 dB for sound absorption in the laboratory. Nevertheless a new version of the relation between the two methods has been defined in an equation.
Several results obtained in the laboratory reach the same maximum level of 20 dB while the in-situ results of those barriers show different values. Due to this fact those formulae can represent only a rough estimation of the relation between laboratory and in-situ method showing only the trend of the relation between those methods and cannot be used in general for prediction.
Nevertheless the defined formulae confirm that the laboratory method drastically overestimates the absorption properties of NRD when tested in real conditions measured with the in-situ method.
Figure 30: Correlation between laboratory and in-situ method for sound reflection/absorption measurements over all barrier types: frequency range according to the standards EN 1793-1
and CEN/TS 1793-5 (left) and variable frequency range (right).
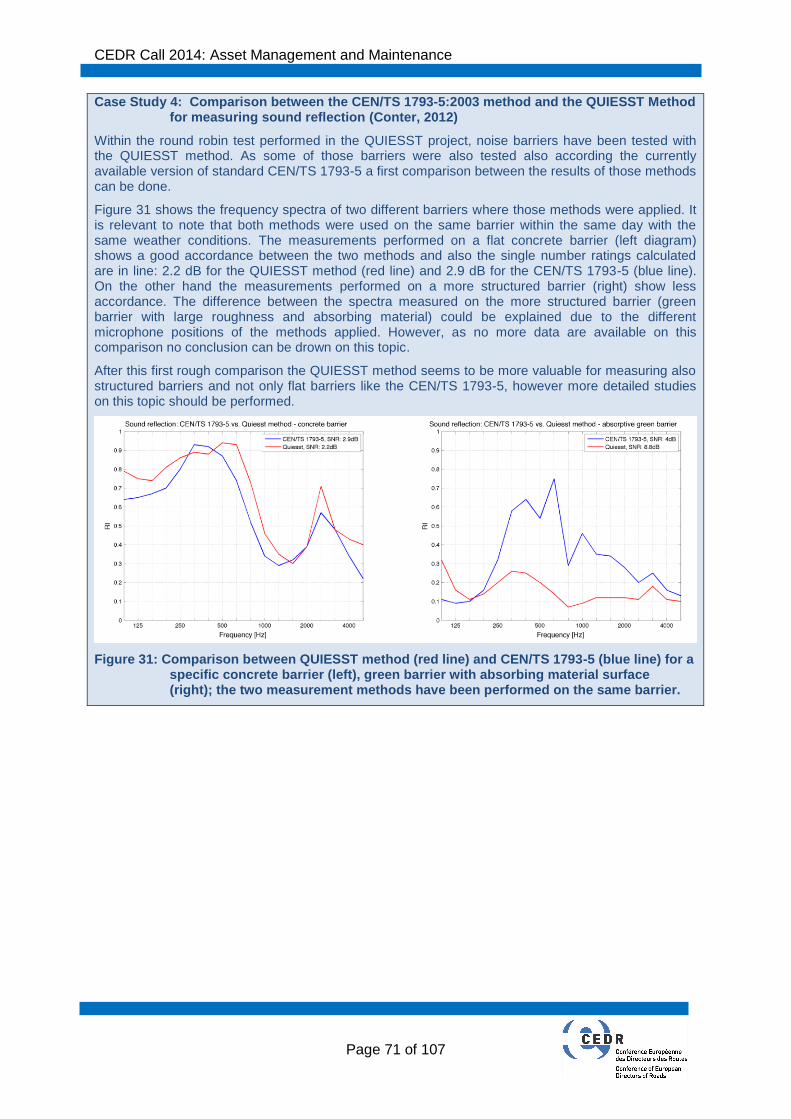
CEDR Call 2014: Asset Management and Maintenance
Page 71 of 107
Case Study 4: Comparison between the CEN/TS 1793-5:2003 method and the QUIESST Method for measuring sound reflection (Conter, 2012)
Within the round robin test performed in the QUIESST project, noise barriers have been tested with the QUIESST method. As some of those barriers were also tested also according the currently available version of standard CEN/TS 1793-5 a first comparison between the results of those methods can be done.
Figure 31 shows the frequency spectra of two different barriers where those methods were applied. It is relevant to note that both methods were used on the same barrier within the same day with the same weather conditions. The measurements performed on a flat concrete barrier (left diagram) shows a good accordance between the two methods and also the single number ratings calculated are in line: 2.2 dB for the QUIESST method (red line) and 2.9 dB for the CEN/TS 1793-5 (blue line). On the other hand the measurements performed on a more structured barrier (right) show less accordance. The difference between the spectra measured on the more structured barrier (green barrier with large roughness and absorbing material) could be explained due to the different microphone positions of the methods applied. However, as no more data are available on this comparison no conclusion can be drown on this topic.
After this first rough comparison the QUIESST method seems to be more valuable for measuring also structured barriers and not only flat barriers like the CEN/TS 1793-5, however more detailed studies on this topic should be performed.
Figure 31: Comparison between QUIESST method (red line) and CEN/TS 1793-5 (blue line) for a specific concrete barrier (left), green barrier with absorbing material surface (right); the two measurement methods have been performed on the same barrier.
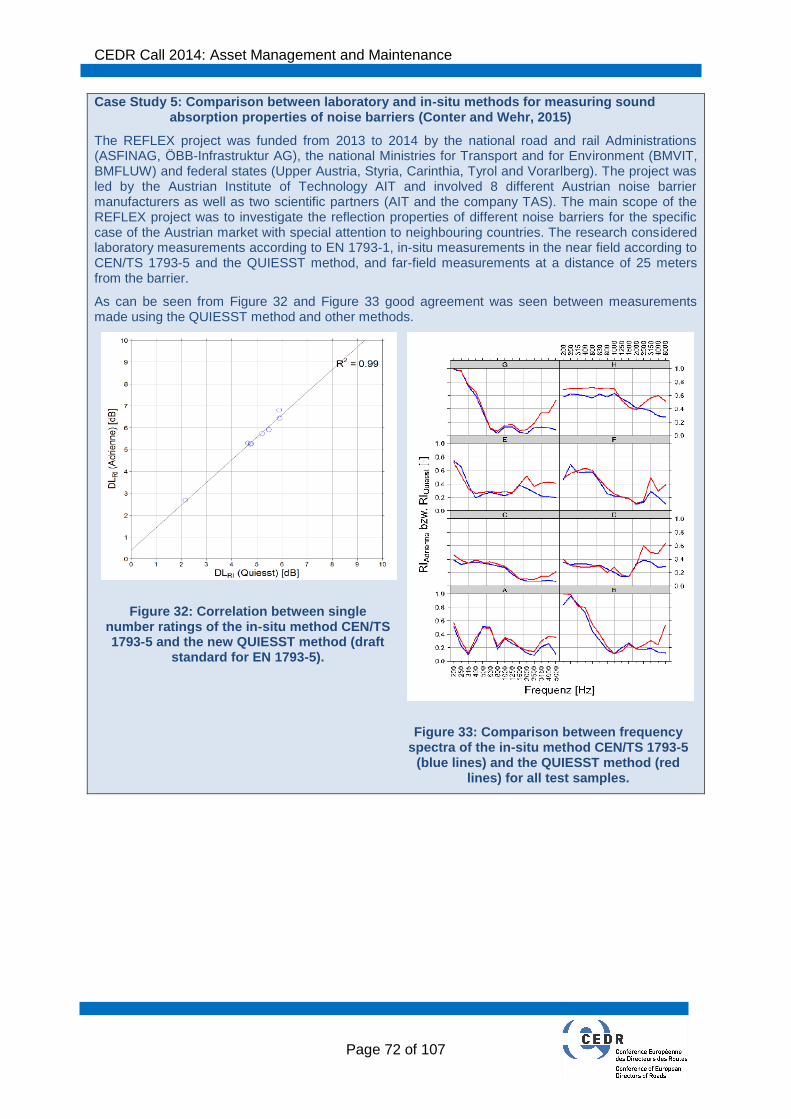
CEDR Call 2014: Asset Management and Maintenance
Page 72 of 107
Case Study 5: Comparison between laboratory and in-situ methods for measuring sound absorption properties of noise barriers (Conter and Wehr, 2015)
The REFLEX project was funded from 2013 to 2014 by the national road and rail Administrations (ASFINAG, ÖBB-Infrastruktur AG), the national Ministries for Transport and for Environment (BMVIT, BMFLUW) and federal states (Upper Austria, Styria, Carinthia, Tyrol and Vorarlberg). The project was led by the Austrian Institute of Technology AIT and involved 8 different Austrian noise barrier manufacturers as well as two scientific partners (AIT and the company TAS). The main scope of the REFLEX project was to investigate the reflection properties of different noise barriers for the specific case of the Austrian market with special attention to neighbouring countries. The research considered laboratory measurements according to EN 1793-1, in-situ measurements in the near field according to CEN/TS 1793-5 and the QUIESST method, and far-field measurements at a distance of 25 meters from the barrier.
As can be seen from Figure 32 and Figure 33 good agreement was seen between measurements made using the QUIESST method and other methods.
Figure 32: Correlation between single number ratings of the in-situ method CEN/TS 1793-5 and the new QUIESST method (draft
standard for EN 1793-5).
Figure 33: Comparison between frequency spectra of the in-situ method CEN/TS 1793-5
(blue lines) and the QUIESST method (red lines) for all test samples.
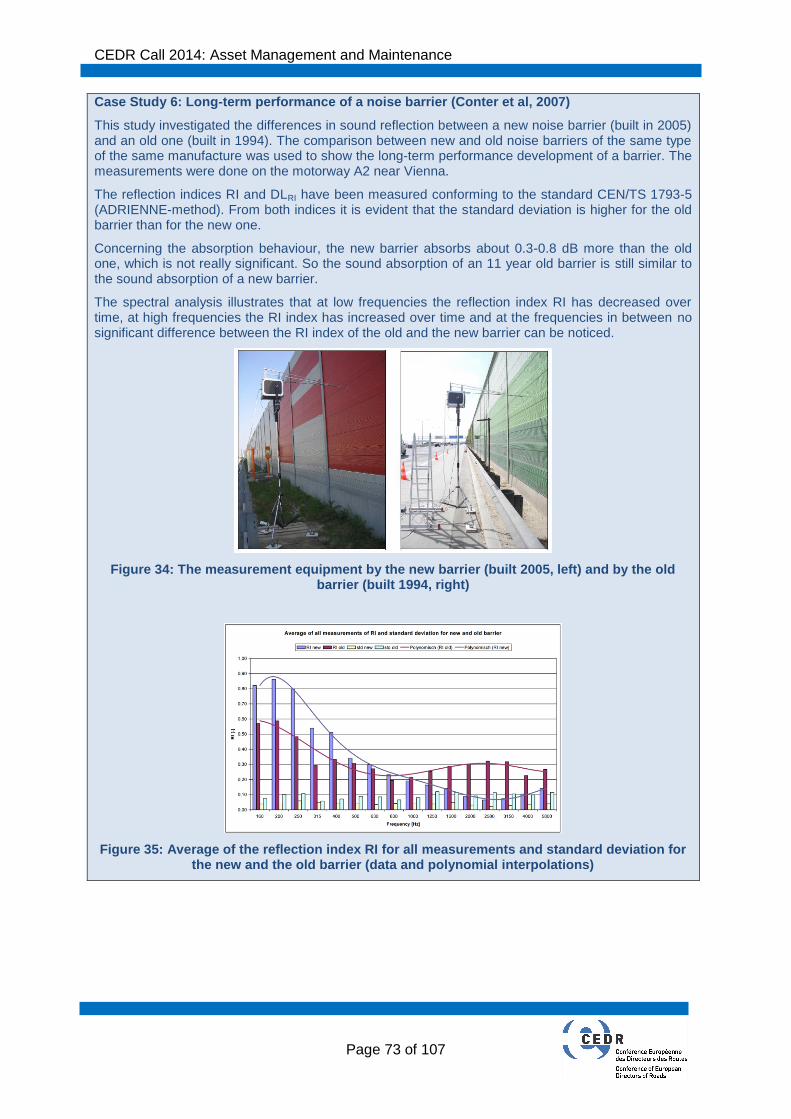
CEDR Call 2014: Asset Management and Maintenance
Page 73 of 107
Case Study 6: Long-term performance of a noise barrier (Conter et al, 2007)
This study investigated the differences in sound reflection between a new noise barrier (built in 2005) and an old one (built in 1994). The comparison between new and old noise barriers of the same type of the same manufacture was used to show the long-term performance development of a barrier. The measurements were done on the motorway A2 near Vienna.
The reflection indices RI and DLRI have been measured conforming to the standard CEN/TS 1793-5 (ADRIENNE-method). From both indices it is evident that the standard deviation is higher for the old barrier than for the new one.
Concerning the absorption behaviour, the new barrier absorbs about 0.3-0.8 dB more than the old one, which is not really significant. So the sound absorption of an 11 year old barrier is still similar to the sound absorption of a new barrier.
The spectral analysis illustrates that at low frequencies the reflection index RI has decreased over time, at high frequencies the RI index has increased over time and at the frequencies in between no significant difference between the RI index of the old and the new barrier can be noticed.
Figure 34: The measurement equipment by the new barrier (built 2005, left) and by the old barrier (built 1994, right)
Figure 35: Average of the reflection index RI for all measurements and standard deviation for the new and the old barrier (data and polynomial interpolations)
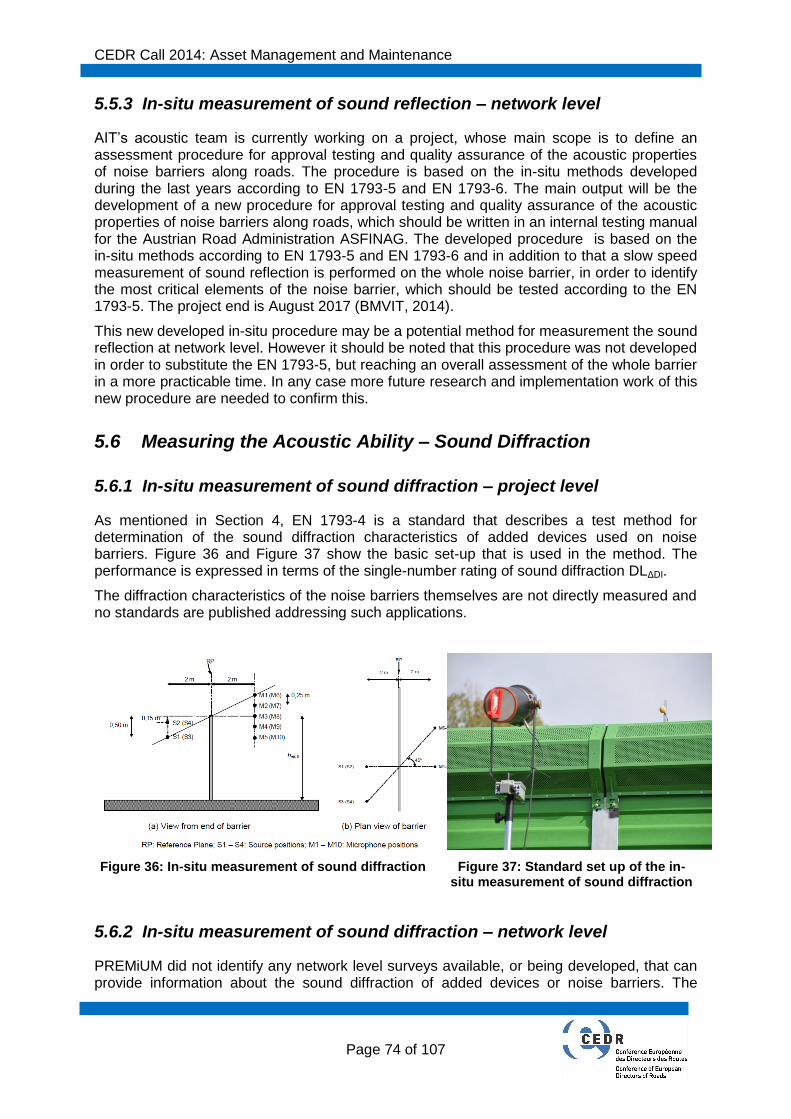
CEDR Call 2014: Asset Management and Maintenance
Page 74 of 107
5.5.3 In-situ measurement of sound reflection – network level
AIT’s acoustic team is currently working on a project, whose main scope is to define an assessment procedure for approval testing and quality assurance of the acoustic properties of noise barriers along roads. The procedure is based on the in-situ methods developed during the last years according to EN 1793-5 and EN 1793-6. The main output will be the development of a new procedure for approval testing and quality assurance of the acoustic properties of noise barriers along roads, which should be written in an internal testing manual for the Austrian Road Administration ASFINAG. The developed procedure is based on the in-situ methods according to EN 1793-5 and EN 1793-6 and in addition to that a slow speed measurement of sound reflection is performed on the whole noise barrier, in order to identify the most critical elements of the noise barrier, which should be tested according to the EN 1793-5. The project end is August 2017 (BMVIT, 2014).
This new developed in-situ procedure may be a potential method for measurement the sound reflection at network level. However it should be noted that this procedure was not developed in order to substitute the EN 1793-5, but reaching an overall assessment of the whole barrier in a more practicable time. In any case more future research and implementation work of this new procedure are needed to confirm this.
5.6 Measuring the Acoustic Ability – Sound Diffraction
5.6.1 In-situ measurement of sound diffraction – project level
As mentioned in Section 4, EN 1793-4 is a standard that describes a test method for determination of the sound diffraction characteristics of added devices used on noise barriers. Figure 36 and Figure 37 show the basic set-up that is used in the method. The performance is expressed in terms of the single-number rating of sound diffraction DLΔDI.
The diffraction characteristics of the noise barriers themselves are not directly measured and no standards are published addressing such applications.
Figure 36: In-situ measurement of sound diffraction
Figure 37: Standard set up of the in-situ measurement of sound diffraction
5.6.2 In-situ measurement of sound diffraction – network level
PREMiUM did not identify any network level surveys available, or being developed, that can provide information about the sound diffraction of added devices or noise barriers. The

CEDR Call 2014: Asset Management and Maintenance
Page 75 of 107
indirect method is often difficult to implement, because the equipment has to be placed in front of and behind the noise barrier and is thus not a practical option to provide data at the network level.
5.7 Measuring the Structural Integrity – Vibration and Fatigue
5.7.1 Theoretical calculation of fatigue
There currently no direct measurement techniques available to objectively assess fatigue, outside of a subjective visual inspection carried out by a structural engineer. However, there may be alternative ways to assess this, depending on the material. For steel structures Eurocode 3 (Design of Steel Structures) presents methods for calculating fatigue. For concrete barriers, there are two methods set out in Eurocode 2 (Design of Concrete Structures) to estimate structural fatigue which may be applicable. These are the Cumulative Damage method and the λ-Coefficient method. Both assess the cyclic loading the structure will endure over its service life. The first method calculates a damage factor, expressed from the damage the structure has actually undergone during its current working life, and is compared to the fatigue design life. The second method is simply a double-check that the barrier is meeting the design requirements for a given service life. The problem with both of these design methods is that they require extensive input data, such as geometries, material properties and the loading (which will constantly change depending on the magnitude and direction of passing winds generated naturally and by passing vehicles). In many cases an NRA may not hold such data, and in general it is based on design assumptions which may not reflect the situation in-situ. Therefore these methods could not be implemented at a network level.
5.7.2 In-situ measurement of vibration and fatigue – project level
A quick assessment of noise barrier posts can be conducted by a combination of:
visual inspection for obvious defects and
assessment of deviations in the dynamic properties in comparison with preceding measurements
Dynamic measurements can be conducted rapidly and inexpensively by using one or two accelerometers at specified height and excitation of the structure using a known and controlled impact (e.g. impulse hammer).
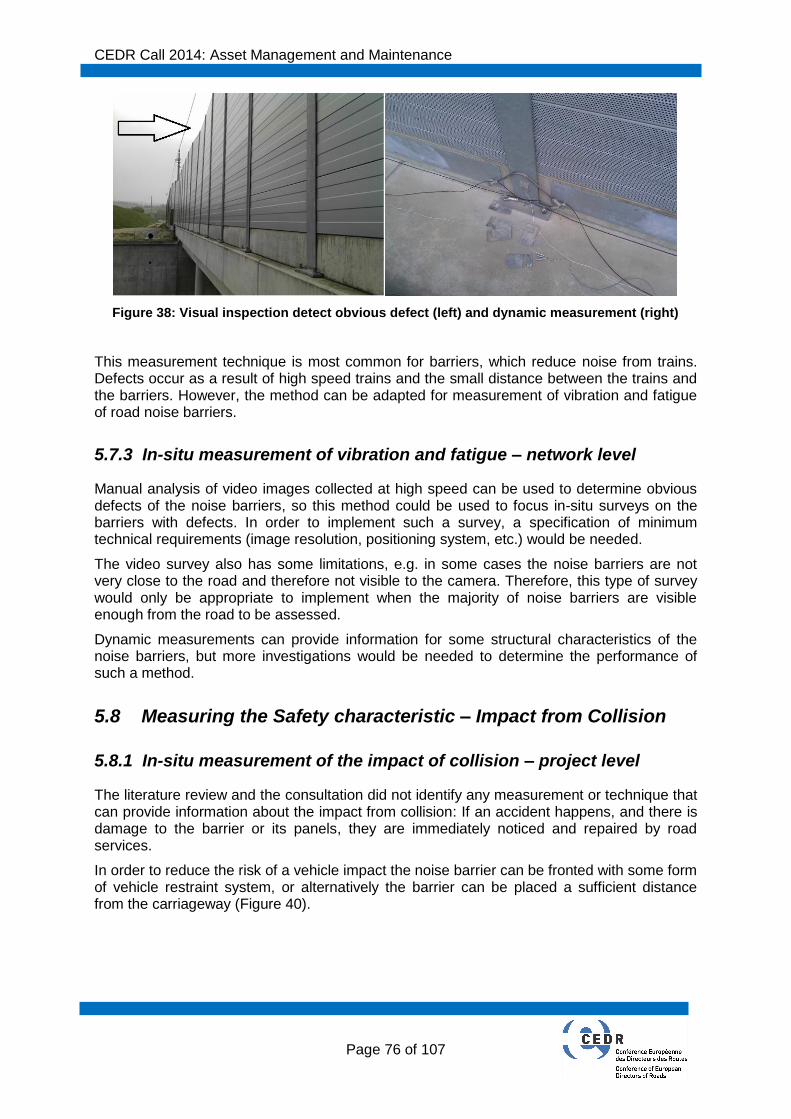
CEDR Call 2014: Asset Management and Maintenance
Page 76 of 107
Figure 38: Visual inspection detect obvious defect (left) and dynamic measurement (right)
This measurement technique is most common for barriers, which reduce noise from trains. Defects occur as a result of high speed trains and the small distance between the trains and the barriers. However, the method can be adapted for measurement of vibration and fatigue of road noise barriers.
5.7.3 In-situ measurement of vibration and fatigue – network level
Manual analysis of video images collected at high speed can be used to determine obvious defects of the noise barriers, so this method could be used to focus in-situ surveys on the barriers with defects. In order to implement such a survey, a specification of minimum technical requirements (image resolution, positioning system, etc.) would be needed.
The video survey also has some limitations, e.g. in some cases the noise barriers are not very close to the road and therefore not visible to the camera. Therefore, this type of survey would only be appropriate to implement when the majority of noise barriers are visible enough from the road to be assessed.
Dynamic measurements can provide information for some structural characteristics of the noise barriers, but more investigations would be needed to determine the performance of such a method.
5.8 Measuring the Safety characteristic – Impact from Collision
5.8.1 In-situ measurement of the impact of collision – project level
The literature review and the consultation did not identify any measurement or technique that can provide information about the impact from collision: If an accident happens, and there is damage to the barrier or its panels, they are immediately noticed and repaired by road services.
In order to reduce the risk of a vehicle impact the noise barrier can be fronted with some form of vehicle restraint system, or alternatively the barrier can be placed a sufficient distance from the carriageway (Figure 40).

CEDR Call 2014: Asset Management and Maintenance
Page 77 of 107
Figure 39: Damaged noise barrier
Figure 40: Noise barrier and vehicle restraint system
5.8.2 In-situ measurement of the impact of collision – network level
PREMiUM did not identify any methods to measure the impact from collision of noise barriers that could be developed to provide information at network level. It is unlikely that development of such a measure would be very useful – a requirement that any accident, where contact between a vehicle and the barrier is made, be reported should be sufficient. This information can then be used to schedule an on-site inspection to determine damage and appropriate maintenance/replacement.
5.9 Measuring the Structural Integrity – Resistance to Loads
5.9.1 In-situ measurement of resistance to loads – project level
Loads generated from wind (either natural wind or dynamic wind loading from passing vehicles), snow, static, and the barrier’s self-weight load can influence the condition of noise barriers. There is no direct measurement that can be taken in-situ, but obvious defects may are visible from video images collected at high speed.
5.9.2 In-situ measurement of resistance to loads – network level
PREMiUM did not identify any methods to measure the resistance to loads of noise barriers, which could be developed to provide information at network level.

CEDR Call 2014: Asset Management and Maintenance
Page 78 of 107
6 Definitions
The following subsections list the technical terms to be used, along with the definitions of the terms as they will be used within the PREMiUM project.
Acoustic Element Composition: The acoustic element composition refers to the main noise abatement material used in the construction of the noise barrier. Such materials include: timber, metallic, concrete, transparent, plastic/composite, and less commonly may include materials such as soil and vegetation.
Airborne Sound Insulation: The ability of the noise barrier to reduce the sound transmission through it.
Acoustic Performance: A noise barrier’s ability to reduce sound levels; this may
Acoustic Type: This refers to the fundamental mechanism by which noise attenuation is achieved, i.e. does the barrier reflect or absorb noise pollution generated by the road.
Date of Installation/Contract ID/Scheme: This refers to when the asset was installed and a reference for a scheme or contract identification number.
Geometric Properties: The geometric properties are the physical parameters of the noise barrier, such as length, width, height, distance from carriageway, and so on.
Insertion Loss: Insertion loss is the difference in noise levels, measured from a noise sensitive receiver, before and after the installation of a noise barrier. This is a direct measure of the in-situ acoustic performance.
Location Reference: The location of the asset.
Long-term acoustic performance: Long-term acoustic performance refers to a noise barrier’s ability to reduce sound levels over the course of its lifetime. It is a measure of change in the barrier’s airborne sound insulation and sound absorption properties over time.
Long-term non-acoustic performance: This refers to how the structural performance of a noise barrier changes over the course of its lifetime.
Manufacturer Declared Initial Performance Characteristics: Characteristics included on the product’s CE marking.
National Road Authority (NRA): The state body responsible for the management of national motorways, and strategic dual and single carriageways. In this study NRAs also include local authorities and private road operators who have responsibility for large amounts of a strategic network.
Noise Reducing Device (NRD): This is a device designed to reduce the propagation of traffic noise away from the road environment. This may be a noise barrier, cladding, road cover or added device. These devices may include both acoustic and structural elements.
Physical Condition Reports: are records of previous inspections that concern the barrier’s structural and aesthetic condition.
Slow speed survey: A slow speed survey is any survey that cannot be performed at traffic speed e.g. manual or in-situ surveys.
Sound absorption: This is a measure of a noise barrier’s ability to take in sound energy when sound waves are encountered, as opposed to reflecting the energy. The measurement of sound absorption gives essentially the same indication of condition as the measurement of sound reflection.
Sound reflection: This is a measure of how much sound is reflected by a noise barrier.

CEDR Call 2014: Asset Management and Maintenance
Page 79 of 107
Traffic speed survey: A traffic speed or high speed survey is performed at, or slightly below prevailing traffic speeds and, in general, does not require traffic management or road closures to perform. For example, a traffic speed survey on a motorway might be performed at speeds of 80km/h or at 45km/h on a residential road.
CEDR Call 2014: Asset Management and Maintenance
Page 80 of 107
7 Sources
Note: Where multiple editions of a European Standard are referenced, this is a result of the 2015 edition of the harmonised product standard, EN 14388, being rejected during the European Commission’s harmonisation acceptance review, meaning that a withdrawn version of the standard is still legally enforceable.
ADRIENNE (1997). Noise barriers: ADRIENNE project (1995-1997). Available from World Wide Web: http://acustica.ing.unibo.it/Researches/barriers/adrienne.html (Accessed May 2017)
BMVIT (2014). Iv2splus INFONET: in-situ LSW. In-situ Verfahren zur akustischen Abnahmeprüfung und Qualitätssicherung von Lärmschutzwänden. Vienna, Austria: Bundesministerium für Verkehr, Innovation und Technologie Available from World Wide Web: https://www2.ffg.at/verkehr/projektpdf.php?id=1348&lang=en (Accessed May 2017)
Casse, C. and van Geem, C. (2012). HeRoad Deliverable 3.1 “Equipment performance assessment”.
CEN (1997a) 1793-1:1997. Road traffic noise reducing devices ― Test method for determining the acoustic performance ― Part 1: Intrinsic characteristics of sound absorption. Brussels, Belgium: Comité Européen de Normalisation.
CEN (1997b). EN 1793-2:1997. Road traffic noise reducing devices ― Test method for determining the acoustic performance ― Part 2: Intrinsic characteristics of airborne sound insulation. Brussels, Belgium: Comité Européen de Normalisation.
CEN (2003a) CEN/TS 1793-4:2003. Road traffic noise reducing devices ― Test method for determining the acoustic performance ― Part 4: Intrinsic characteristics ― In situ values of sound diffraction. Brussels, Belgium: Comité Européen de Normalisation.
CEN (2003b) CEN/TS 1793-5:2003. Road Traffic Noise Reducing Devices ― Test Method for Determining the Acoustic Performance ― Part 5: Intrinsic Characteristics ― In Situ values of sound reflection and airborne sound insulation. Brussels, Belgium: Comité Européen de Normalisation.
CEN (2003c). EN 1794-1:2003. Road traffic noise reducing devices ― Non-acoustic performance ― Part 1: Mechanical performance and stability requirements. Brussels, Belgium: Comité Européen de Normalisation.
CEN (2003d). EN 1794-2:2011. Road traffic noise reducing devices ― Non-acoustic performance ― Part 2: General safety and environmental requirements. Brussels, Belgium: Comité Européen de Normalisation.
CEN (2004). EN 14389-1:2004. Road traffic noise reducing devices ― Procedures for assessing long term performance ― Part 2: Non-acoustical characteristics. Brussels, Belgium: Comité Européen de Normalisation.
CEN (2005). EN 14388:2005. Road traffic noise reducing devices – Specifications. Brussels, Belgium: Comité Européen de Normalisation.
CEN (2007). EN 14389-1:2007. Road traffic noise reducing devices ― Procedures for assessing long term performance ― Part 1: Acoustical characteristics. Brussels, Belgium: Comité Européen de Normalisation.
CEN (2011a). EN 1794-1:2011. Road traffic noise reducing devices ― Non-acoustic performance ― Part 1: Mechanical performance and stability requirements. Brussels, Belgium: Comité Européen de Normalisation.
CEN (2011b). EN 1794-2:2011. Road traffic noise reducing devices ― Non-acoustic performance ― Part 2: General safety and environmental requirements. Brussels, Belgium: Comité Européen de Normalisation.
CEDR Call 2014: Asset Management and Maintenance
Page 81 of 107
CEN (2012a). EN 1793-2:2012. Road traffic noise reducing devices ― Test ,method for determining the acoustic performance ― Part 2: Intrinsic characteristics of airborne sound insulation under diffuse sound field conditions. Brussels, Belgium: Comité Européen de Normalisation.
CEN (2012b). EN 1793-6:2012. Road traffic noise reducing devices ― Test method for determining the acoustic performance ― Part 6: Intrinsic characteristics ― In situ values of airborne sound insulation under direct sound field conditions. Brussels, Belgium: Comité Européen de Normalisation.
CEN (2015a). EN 1793-4:2015. Road traffic noise reducing devices ― Test method for determining the acoustic performance ― Part 4: Intrinsic characteristics ― In situ values of sound diffraction. Brussels, Belgium: Comité Européen de Normalisation.
CEN (2015b). EN 14388:2015. Road traffic noise reducing devices – Specifications. Brussels, Belgium: Comité Européen de Normalisation.
CEN (2015c) EN 14389-1:2015. Road traffic noise reducing devices ― Procedures for assessing long term performance ― Part 1: Acoustical characteristics. Brussels, Belgium: Comité Européen de Normalisation.
CEN (2015d) EN 14389-2:2015. Road traffic noise reducing devices ― Procedures for assessing long term performance ― Part 2: Non-acoustical characteristics. Brussels, Belgium: Comité Européen de Normalisation.
CEN (2016a) EN 1793-5:2016. Road Traffic Noise Reducing Devices ― Test Method for Determining the Acoustic Performance ― Part 5: Intrinsic Characteristics ― In situ values of sound reflection under direct sound field conditions. Brussels, Belgium: Comité Européen de Normalisation.
CEN (2016b). EN 1794-3:2016. Road traffic noise reducing devices ― Non-acoustic performance ― Part 3: Reaction to fire – Burning behaviour of noise reducing devices and classification. Brussels, Belgium: Comité Européen de Normalisation.
CEN (2017). EN 1793-1:2017. Road traffic noise reducing devices ― Test method for determining the acoustic performance ― Part 1: Intrinsic characteristics of sound absorption under diffuse sound field conditions. Brussels, Belgium: Comité Européen de Normalisation.
Clairbois J-P, de Roo F, Garai M, Conter M, Defrance J, Oltean-Dumbrava C A and Durso C (2012). Guidebook to noise reducing devices optimisation. (QUIESST project deliverable). Brussels, Belgium: A-Tech.
Conter M. (Editor) (2012). Final procedural report on WP4 activities: Including public database of European NRD, data analysis and definition of NRD families (QUIESST Deliverable D.4.3). Vienna, Austria: Austrian Institute of Technology. Available from World Wide Web: http://www.quiesst.eu/images/QUIESST_D4.3_MS4.2.pdf (Accessed May 2017).
Conter M and Wehr R (2015). Comparison between laboratory and in-situ methods for measuring sound absorption properties of noise barriers (REFLEX project). Proceedings of Euronoise 2015 Maastricht, Belgium. Available from World Wide Web: www.conforg.fr/euronoise2015/proceedings/data/articles/000148.pdf (Accessed May 2017).
Conter M, Haider M, Bohrn J and Lechner A (2007). Investigation of the long-time performance of a noise barrier and statistical stability of the reflection index with the ADRIENNE method. Proceedings of the 3rd Congress of the Alps Adria Acoustics Association, Graz, Austria, 2007.
European Commission (2011). Regulation (EU) No 305/2011 of the European Parliament and of the Council of 9 March 2011 laying down harmonised conditions for the marketing of construction products and repealing Council Directive 89/106/EEC Text with EEA relevance.

CEDR Call 2014: Asset Management and Maintenance
Page 82 of 107
Official Journal of the European Union, L 88, 04 April 2011. Brussels, Belgium: European Commission.
Highways England (formerly Highways Agency), Transport Scotland, Welsh Assembly Government and Department for Regional Development, Northern Ireland (various dates). Design Manual for Roads and Bridges [online]. [Accessed May 2017]. London: TSO (The Stationary Office). Available from World Wide Web: www.dft.gov.uk/ha/standards/dmrb/index.htm
HA 65/94 (DMRB Volume 10, Section 5, Part 1): Design for environmental noise barriers.
HA 66/95 (Volume 10, Section 5, Part 2): Environmental barriers: Technical requirements.
HiSPEQ: “Key requirements…” Available on HiSPEQ website www.hispeq.com
iNovitas (2017). infra3DRoad: Der infra3D Service, der Strassen-Infrastrukturbetreiber effizienter macht. Available from World Wide Web: http://www.inovitas.ch/produktportfolio/produkte-detail/pdt/p/s/Infra3D_Road/ (Accessed May 2017).
ISO (1997). ISO 10847:1997. Acoustics – In-situ determination of insertion loss of outdoor noise barriers of all types. Geneva, Switzerland: International Organisation for Standardisation.
Marcocci S (2016). Management of noise barriers in Wallonia. Proceedings of Internoise 2016, Hamburg, Germany. Available from World Wide Web: http://pub.dega-akustik.de/IN2016/data/articles/000551.pdf (Accessed May 2017).
Morgan, P. (2014) QUESTIM: Assessing the Acoustic Durability of Noise Barriers on NRA Road Networks
Roland Spielhofer (2014): “Monitoring of Road Inventory”. TRIMM Deliverable 4.2. Available http://trimm.fehrl.org/?m=3&id_directory=7539

CEDR Call 2014: Asset Management and Maintenance
Page 83 of 107
Appendix A: NRA Questionnaire
Stakeholder consultation
Introduction to the PREMiUM project
PREMiUM (Practical Road Equipment Measurement Understanding and Management) has been let under the CEDR 2014 call for Asset Management and Maintenance and is being funded by the National Road Authorities in Austria, Belgium (Flanders), Finland, Germany, Ireland, Netherlands, Norway, Sweden and UK. It is a 2 year project that commenced in October 2015.
Compared to the management of pavement and bridge/structures assets, the approach to the management of road equipment assets is less well developed. Inspections are often carried out of these assets but the approaches to inspection regimes and the inspection methods vary e.g. regular condition assessment surveys versus replacement based on life expectancy with monitoring undertaken during safety inspections (which focus only on damage and failures that impact the safety of the road user). The inspections are often manual visual assessments, although there are examples of traffic-speed survey methods in some countries for the assessment of, for example, the visibility of road markings.
Even where a regime exists for the collection of information on equipment assets there is then a need to consider how this information is managed by a road authority. Many national authorities now operate powerful asset management systems, which allow data to be collated on road assets. Again, in comparison with road pavements, there is evidence of significant gaps in this area for road equipment.
Finally, where data do exist, and are accessible to the road owner, there is a need to be able to analyse and interpret this information to determine condition, identify maintenance needs and prioritise maintenance. For the equipment asset types under consideration in this work there is a range of experience in the application of analysis and interpretation methods that could allow the asset to be understood at the network level. Through the development of suitably focussed regimes and the development of appropriate indicators, there is potential to improve the ability to manage these assets
We envisage that the PREMiUM project will help road administrations to establish a maintenance regime that minimises the risk of failure of the asset and yet enables the road administration to focus maintenance expenditure on these assets in an efficient manner.
We have established a project team that includes representatives from the UK, Austria, Belgium, Ireland and Sweden. To help ensure our project outputs are relevant and focussed we are also trying to establish a “PREMiUM Reference Group” containing stakeholders from National Road Authorities; equipment manufacturers and users; researchers and users of the data.
The purpose of this questionnaire is to determine what asset properties you feel are important to know about, in order to assess asset condition, for the following assets:
Road markings and studs
Road signs
Noise barriers
Vehicle restraint systems.
We would then like to know what surveys are carried out currently, whether these are on a scheme/project level, or whether they are performed at network level. We are also seeking to know what equipment is used for monitoring, what is measured; what data is delivered, and how this data is then used to assess condition.
We will use the information, provided by stakeholders, to identify the key characteristics that need to be monitored, how these key characteristics can be monitored at a network level, and how the data can be translated into the information required to determine the condition.

Stakeholder details
Organisation……………………………………………………………………………………………
Country in which organisation based…………………………………………………………………
Contact person: ………………………………………………………………………………………
Function/job title: ………………………………………………………………………………………
Email: ……………………………………………………………………………………………………
In order to fully understand the answers given to the questionnaire, we may wish to conduct a short follow up interview, conducted via ‘phone. If you would be willing to participate in this, please provide your telephone number:……………………………………………………… (Note that you will be asked via email for a convenient time to conduct this interview).
Definitions
Network level monitoring/surveys: A network level survey or monitoring regime provides data for each length of asset or each individual asset on the road network. This may be achieved in just one year, or it may be organised over a number of years.
Noise Barrier A noise barrier is a structure, usually erected at the side of a carriageway, designed to reduce the noise level experienced by neighbouring properties.
Project level surveys A project or scheme level survey provides detailed data for a specific length (or lengths) on the road network. Project level surveys are usually performed when a need for maintenance has been identified, or where a network level survey has suggested that further investigation is requirement.
Road marking A road marking is any kind of device or material that is used on a road surface in order to convey official information. They can be used to delineate traffic lanes, inform motorists and pedestrians or serve as noise generators when run across a road (rumble strips), or attempt to wake a sleeping driver when installed in the shoulders of a road. Road surface markings can also indicate regulation for parking and stopping.
Centre lines are the most common forms of road markings, providing separation between traffic moving in opposite directions, or between traffic moving in separate lanes. In PREMiUM, we will only be considering lane separating markings.
Retroreflective road stud A road stud is a safety device used on roads, usually made with plastic, ceramic, thermoplastic paint or occasionally metal, and come in a variety of shapes and colours. Retroreflective studs include a lens or sheeting that enhances their visibility by reflecting vehicle headlights.

Vehicle Restraint System A vehicle restraint system is a structure, usually fixed at the side of a carriageway, designed to prevent vehicles from leaving the carriageway
Road network
Question Answer
1
What is the approximate length of your road network, split by road type (e.g. motorway, strategic dual carriageway, strategic single carriageway)?
Please answer the questions below for the assets for which you have knowledge. For those for which you don’t have knowledge, please can you suggest who we might contact, who may be able to answer the questions, or please ask them directly.

Road Markings and Studs
Knowledge of Assets
Question Answer
2 What is the approximate length of your network for which road markings are present?
3 What is the approximate length of your network for which retroreflective studs are present?
Current Approach to Monitoring and Maintaining Assets and Asset Management
In this section of the questionnaire, we would like to find out whether monitoring of the assets’ condition is carried out, and if it is what asset properties are monitored and how they’re monitored. We would also like to know, if monitoring is not carried out, why it is not e.g. it is cheaper just to replace road markings every 3 years on a rolling basis than to monitor them and only replace those that are inadequate.
We are also seeking to find out how the assets are managed and what maintenance methods are applied to the assets and what triggers this maintenance e.g. asset age, measured condition.
Question Answer
4
What is your general approach to managing and understanding the condition of road markings (lane separating lines) and studs? For example
Do you have a clear view of the status of all assets i.e. a regular monitoring regime?
Do you perform ad hoc repairs if something goes wrong (is there a reporting system - details?)?
Is the approach based on age of the asset?
5
Where you have a monitoring regime, what does this measure and what methodology do you use? E.g.
Measurement of retroreflectivity using retroreflectometer (hand held or attached to a vehicle travelling at traffic speed)
Measurement of wear or corrosion.
6
Where you do not have a regime, do you feel there is a need for condition monitoring to map the state of these assets? If not, please tell us why not (e.g. the condition cannot be measured, regular replacement removes the need for monitoring).
7 Do you use an asset management system for managing road markings and studs (maintenance planning and forecasting

budgets)?
8 What methods of maintenance are applied to road markings and studs e.g. replacement, cleaning?
9
How do you decide if a road marking or stud requires each type of maintenance method listed in Q8? I.e. on what criteria are maintenance / repair decisions made: Is the decision based on e.g. the asset’s age, its measured condition etc.? Please give details.
10
If the maintenance is based on measured condition, are thresholds applied to the measurements? If so are these thresholds defined in a standard or just within your organisation?
11
Do you combine different types of measurements, to make a decision on maintenance e.g. combine measurements of marking retro-reflectivity and wear?
Monitoring Assets at a network level
We have reviewed the standards relating to road markings and studs and have identified a number of properties that might be used for condition assessment. These are listed in the following tables. Please indicate whether any of these measures are currently monitored for your road network. We are particularly interested in whether the measures can be monitored at a network level or not, so please indicate whether the monitoring is carried out by slow speed surveys e.g. manual inspection of road signs, push-pull test for the posts of vehicle restraint systems, or whether they could be achieved at high speed e.g. from a vehicle travelling at traffic speed.
We would then like to know which asset properties are considered to be most important to determine their condition, so please indicate this in the “Level of importance” column by rating each property as either:
High importance – essential information to have for all assets on the network;
Medium importance – quite useful to have this information ; or
Low importance – nice to have but not essential information.
Property Characteristic
Is this measured
or recorded?
(Yes/No)
How is it measured?
(Type of instrument/test
method)
What level of importance would you assign to this characteristic for
assessment of condition?
(Low, Medium, High)
Inventory
Location e.g. start/end chainage (m), section label, marker post, GPS, spacing/gap, length, direction, etc.
Type of marking/stud

Inventory
Road Markings Details - e.g. dimensions, class, colour, material, etc.
Date of Construction
Date of Last Inspection
Dates and details of maintenance
Other (please give details)
Visibility
Night-time visibility (e.g. proportion of light reflected back to light source)
Day-time visibility (e.g. Luminance Coefficient under Diffuse Illumination, brightness (Luminous Intensity) of a surface in a given direction per unit area, ratio of the luminance of the marking or stud to that of a perfect diffuser)
Colour (e.g. chromaticity co-ordinates)
Wear Index (e.g. amount of erosion)
Other (please give details)
Durability
Skid Resistance
Removability – e.g. ease of removing the line/stud
Hiding Power of Paint – e.g. a measure of the paint’s ability to obscure a background of contrasting colour
UV Ageing of the Paint
Resistance to UV Exposure
Rate of Degradation
Other (please give details)
Novel techniques for measuring condition
What “novel” methods, i.e. not covered by existing standards, for measuring conditions have you tried on a project level?
Were you satisfied with the results?
Do you see the potential to use this method on network level?

Road Signs
Knowledge of Assets
Question Answer
12 Roughly how many road signs do you have on your network?
Current Approach to Monitoring and Maintaining Assets and Asset Management
In this section of the questionnaire, we would like to find out whether monitoring of the assets’ condition is carried out, and if it is what asset properties are monitored and how they’re monitored. We would also like to know, if monitoring is not carried out, why it is not e.g. it is cheaper just to replace road markings every 3 years on a rolling basis than to monitor them and only replace those that are inadequate.
We are also seeking to find out how the assets are managed and what maintenance methods are applied to the assets and what triggers this maintenance e.g. asset age, measured condition.
Question Answer
13
What is your general approach to managing and understanding the condition of road signs? For example
Do you have a clear view of the status of all assets i.e. a regular monitoring regime?
Do you perform ad hoc repairs if something goes wrong (is there a reporting system - details?)?
Is the approach based on age of the asset?
14
Where you have a monitoring regime, what does this measure and what methodology do you use? E.g.
Measurement of retroreflectivity using retroreflectometer (hand held or attached to a vehicle travelling at traffic speed)
Measurement of wear or corrosion.
Measurement of structural integrity
15
Where you do not have a regime, do you feel there is a need for condition monitoring to map the state of these assets? If not, please tell us why not (e.g. the condition cannot be measured, regular replacement removes the need for monitoring).
16 Do you use an asset management system for managing road signs (maintenance planning and forecasting budgets)?
17 What methods of maintenance are applied to road signs e.g. replacement, cleaning, rust treatment, post reinforcement?
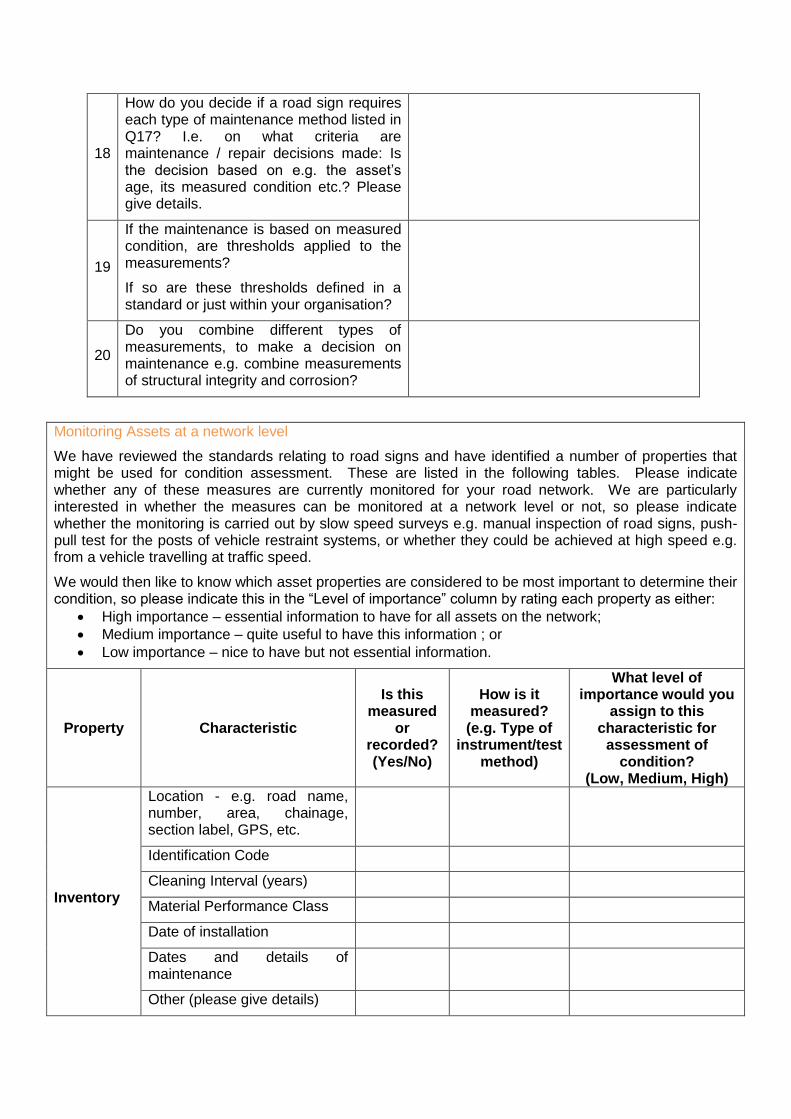
18
How do you decide if a road sign requires each type of maintenance method listed in Q17? I.e. on what criteria are maintenance / repair decisions made: Is the decision based on e.g. the asset’s age, its measured condition etc.? Please give details.
19
If the maintenance is based on measured condition, are thresholds applied to the measurements?
If so are these thresholds defined in a standard or just within your organisation?
20
Do you combine different types of measurements, to make a decision on maintenance e.g. combine measurements of structural integrity and corrosion?
Monitoring Assets at a network level
We have reviewed the standards relating to road signs and have identified a number of properties that might be used for condition assessment. These are listed in the following tables. Please indicate whether any of these measures are currently monitored for your road network. We are particularly interested in whether the measures can be monitored at a network level or not, so please indicate whether the monitoring is carried out by slow speed surveys e.g. manual inspection of road signs, push-pull test for the posts of vehicle restraint systems, or whether they could be achieved at high speed e.g. from a vehicle travelling at traffic speed.
We would then like to know which asset properties are considered to be most important to determine their condition, so please indicate this in the “Level of importance” column by rating each property as either:
High importance – essential information to have for all assets on the network;
Medium importance – quite useful to have this information ; or
Low importance – nice to have but not essential information.
Property Characteristic
Is this measured
or recorded? (Yes/No)
How is it measured?
(e.g. Type of instrument/test
method)
What level of importance would you
assign to this characteristic for
assessment of condition?
(Low, Medium, High)
Inventory
Location - e.g. road name, number, area, chainage, section label, GPS, etc.
Identification Code
Cleaning Interval (years)
Material Performance Class
Date of installation
Dates and details of maintenance
Other (please give details)
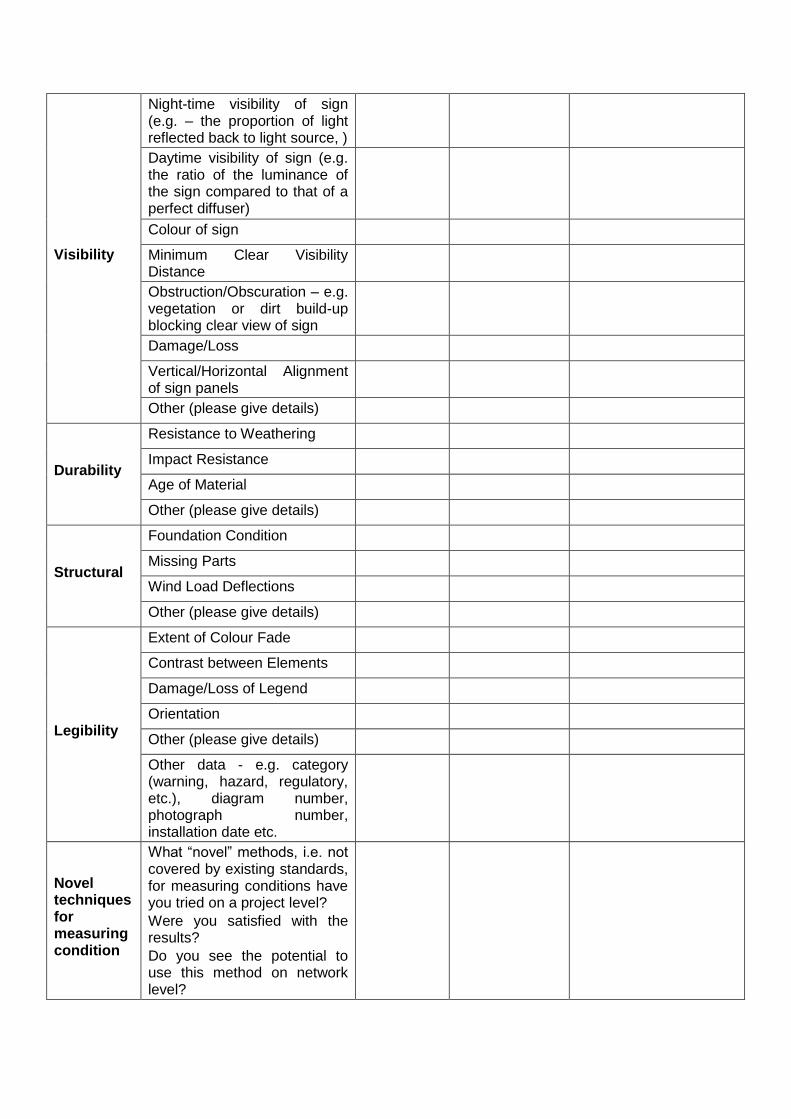
Visibility
Night-time visibility of sign (e.g. – the proportion of light reflected back to light source, )
Daytime visibility of sign (e.g. the ratio of the luminance of the sign compared to that of a perfect diffuser)
Colour of sign
Minimum Clear Visibility Distance
Obstruction/Obscuration – e.g. vegetation or dirt build-up blocking clear view of sign
Damage/Loss
Vertical/Horizontal Alignment of sign panels
Other (please give details)
Durability
Resistance to Weathering
Impact Resistance
Age of Material
Other (please give details)
Structural
Foundation Condition
Missing Parts
Wind Load Deflections
Other (please give details)
Legibility
Extent of Colour Fade
Contrast between Elements
Damage/Loss of Legend
Orientation
Other (please give details)
Other data - e.g. category (warning, hazard, regulatory, etc.), diagram number, photograph number, installation date etc.
Novel techniques for measuring condition
What “novel” methods, i.e. not covered by existing standards, for measuring conditions have you tried on a project level?
Were you satisfied with the results?
Do you see the potential to use this method on network level?

Noise Barriers
Knowledge of Assets
Question Answer
21 What types of noise barriers are present on your network and what is the approximate total length for each type?
Current Approach to Monitoring and Maintaining Assets and Asset Management
In this section of the questionnaire, we would like to find out whether monitoring of the assets’ condition is carried out, and if it is what asset properties are monitored and how they’re monitored. We would also like to know, if monitoring is not carried out, why it is not e.g. it is cheaper just to replace road markings every 3 years on a rolling basis than to monitor them and only replace those that are inadequate.
We are also seeking to find out how the assets are managed and what maintenance methods are applied to the assets and what triggers this maintenance e.g. asset age, measured condition.
Question Answer
22
What is your general approach to managing and understanding the condition of noise barriers? For example
Do you have a clear view of the status of all assets i.e. a regular monitoring regime?
Do you perform ad hoc repairs if something goes wrong (is there a reporting system – details?)?
Is the approach based on age of the asset?
23
Where you have a monitoring regime, what does this measure and what methodology do you use? E.g.
Measurement of noise absorption or reflection
Measurement of wear
Measurement of structural integrity
24
Where you do not have a regime, do you feel there is a need for condition monitoring to map the state of these assets? If not, please tell us why not (e.g. the condition cannot be measured, regular replacement removes the need for monitoring).
25 Do you use an asset management system for managing noise barriers (maintenance planning and forecasting budgets)?
26
What methods of maintenance are applied to noise barriers e.g. replacement, repainting, cleaning, patching, post reinforcement?

27
How do you decide if a noise barrier requires each type of maintenance method listed in Q26? I.e. on what criteria are maintenance / repair decisions made: Is the decision based on e.g. the asset’s age, its measured condition etc.? Please give details.
28
If the maintenance is based on measured condition, are thresholds applied to the measurements?
If so are these thresholds defined in a standard or just within your organisation?
29
Do you combine different types of measurements, to make a decision on maintenance e.g. combine measurements of structural integrity and noise absorption?
Monitoring Assets at a network level
We have reviewed the standards relating to noise barriers and have identified a number of properties that might be used for condition assessment. These are listed in the following tables. Please indicate whether any of these measures are currently monitored for your road network. We are particularly interested in whether the measures can be monitored at a network level or not, so please indicate whether the monitoring is carried out by slow speed surveys e.g. manual inspection of road signs, push-pull test for the posts of vehicle restraint systems, or whether they could be achieved at high speed e.g. from a vehicle travelling at traffic speed.
We would then like to know which asset properties are considered to be most important to determine their condition, so please indicate this in the “Level of importance” column by rating each property as either:
High importance – essential information to have for all assets on the network;
Medium importance – quite useful to have this information ; or
Low importance – nice to have but not essential information.
Property Characteristic
Is this measured
or recorded? (Yes/No)
How is it measured? (i.e. Type of
instrument/test method)
What level of importance would you assign to this characteristic for
assessment of condition?
(Low, Medium, High)
Inventory
Date of Installation, Contract ID, Scheme
Acoustic Type – e.g. reflective, absorptive
Acoustic Element Composition e.g. timber, concrete, metal, composites, plastic
Geometry – e.g. height, angle
Location Data - e.g. road name, section label, start/end chainage, GPS etc.
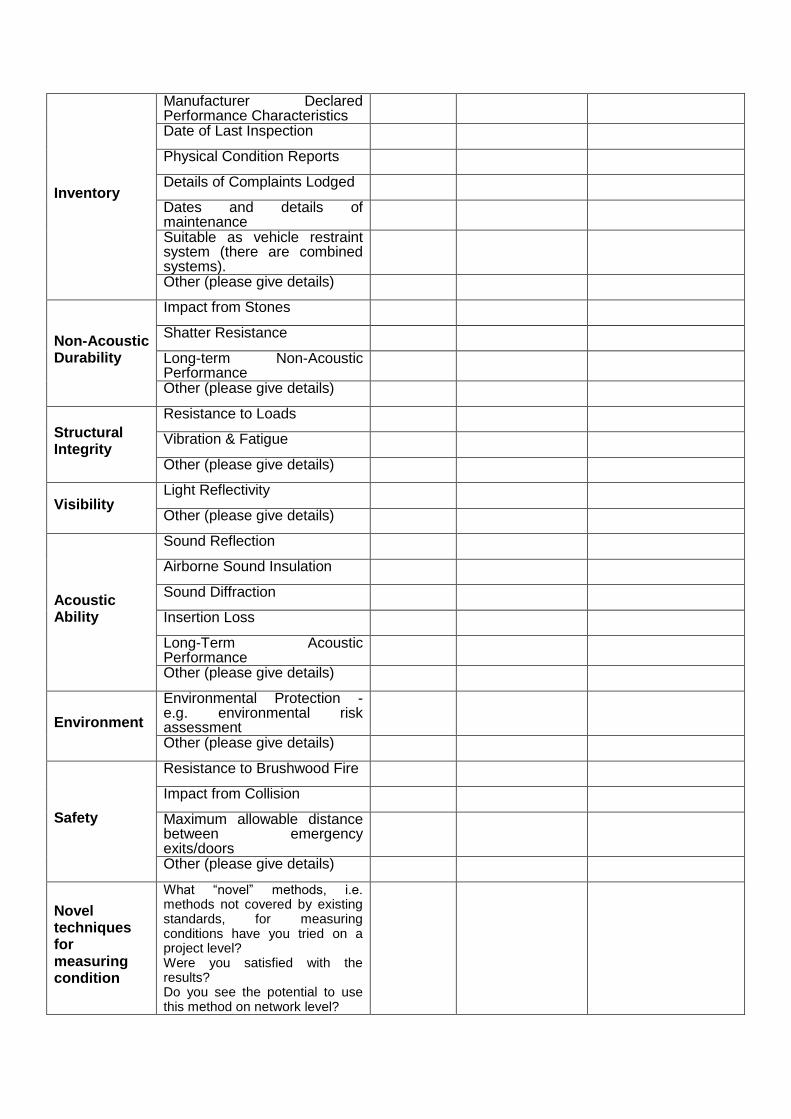
Inventory
Manufacturer Declared Performance Characteristics
Date of Last Inspection
Physical Condition Reports
Details of Complaints Lodged
Dates and details of maintenance
Suitable as vehicle restraint system (there are combined systems).
Other (please give details)
Non-Acoustic Durability
Impact from Stones
Shatter Resistance
Long-term Non-Acoustic Performance
Other (please give details)
Structural Integrity
Resistance to Loads
Vibration & Fatigue
Other (please give details)
Visibility Light Reflectivity
Other (please give details)
Acoustic Ability
Sound Reflection
Airborne Sound Insulation
Sound Diffraction
Insertion Loss
Long-Term Acoustic Performance
Other (please give details)
Environment
Environmental Protection - e.g. environmental risk assessment
Other (please give details)
Safety
Resistance to Brushwood Fire
Impact from Collision
Maximum allowable distance between emergency exits/doors
Other (please give details)
Novel techniques for measuring condition
What “novel” methods, i.e. methods not covered by existing standards, for measuring conditions have you tried on a project level? Were you satisfied with the results? Do you see the potential to use this method on network level?

Vehicle Restraint Systems
Knowledge of Assets
Question Answer
30
What types of vehicle restraint systems are present on your network and what is the approximate total length for each type?
Current Approach to Monitoring and Maintaining Assets and Asset Management
In this section of the questionnaire, we would like to find out whether monitoring of the assets’ condition is carried out, and if it is what asset properties are monitored and how they’re monitored. We would also like to know, if monitoring is not carried out, why it is not e.g. it is cheaper just to replace road markings every 3 years on a rolling basis than to monitor them and only replace those that are inadequate.
We are also seeking to find out how the assets are managed and what maintenance methods are applied to the assets and what triggers this maintenance e.g. asset age, measured condition.
Question Answer
31
What is your general approach to managing and understanding the condition of vehicle restraint systems? For example Do you have a clear view of the status
of all assets i.e. a regular monitoring regime?
Do you perform ad hoc repairs if something goes wrong (is there a reporting system – details?)?
Is the approach based on age of the asset?
32
Where you have a monitoring regime, what does this measure and what methodology do you use? E.g.
Measurement of wear or corrosion (slow speed or traffic speed test).
Measurement of height
Measurement of structural integrity
33
Where you do not have a regime, do you feel there is a need for condition monitoring to map the state of these assets? If not, please tell us why not (e.g. the condition cannot be measured, regular replacement removes the need for monitoring).
34
Do you use an asset management system for managing vehicle restraint systems (maintenance planning and forecasting budgets)?
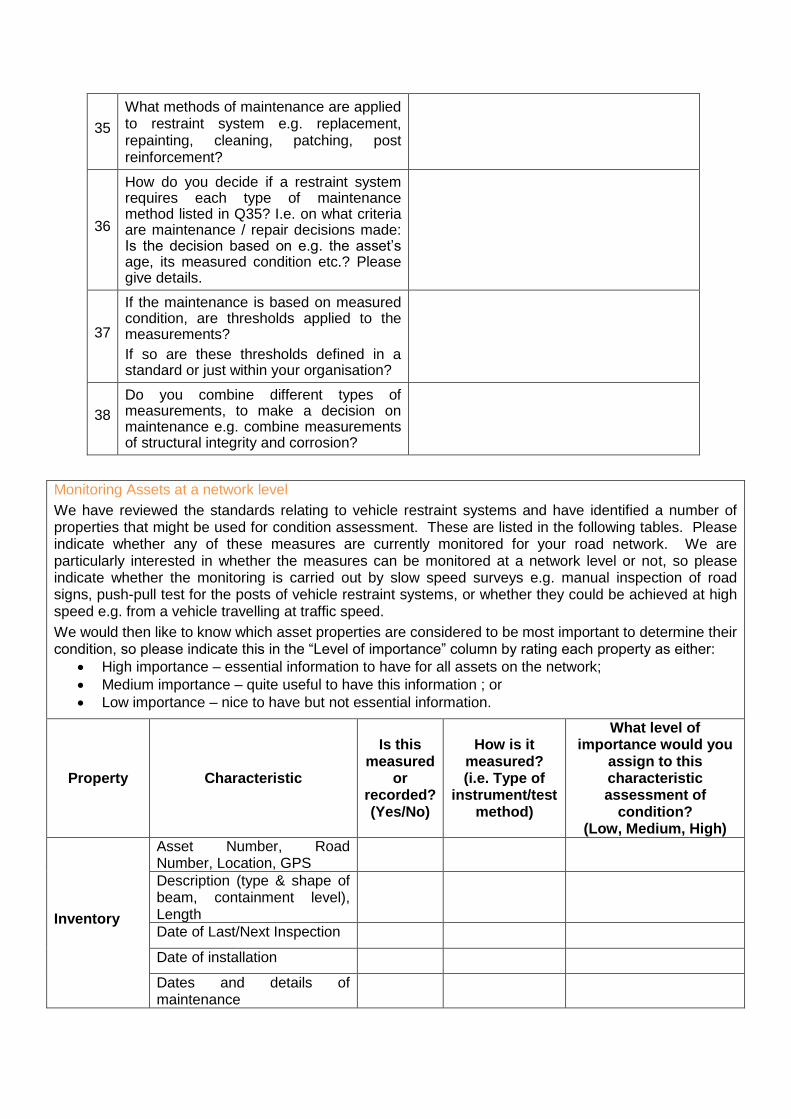
35
What methods of maintenance are applied to restraint system e.g. replacement, repainting, cleaning, patching, post reinforcement?
36
How do you decide if a restraint system requires each type of maintenance method listed in Q35? I.e. on what criteria are maintenance / repair decisions made: Is the decision based on e.g. the asset’s age, its measured condition etc.? Please give details.
37
If the maintenance is based on measured condition, are thresholds applied to the measurements?
If so are these thresholds defined in a standard or just within your organisation?
38
Do you combine different types of measurements, to make a decision on maintenance e.g. combine measurements of structural integrity and corrosion?
Monitoring Assets at a network level
We have reviewed the standards relating to vehicle restraint systems and have identified a number of properties that might be used for condition assessment. These are listed in the following tables. Please indicate whether any of these measures are currently monitored for your road network. We are particularly interested in whether the measures can be monitored at a network level or not, so please indicate whether the monitoring is carried out by slow speed surveys e.g. manual inspection of road signs, push-pull test for the posts of vehicle restraint systems, or whether they could be achieved at high speed e.g. from a vehicle travelling at traffic speed.
We would then like to know which asset properties are considered to be most important to determine their condition, so please indicate this in the “Level of importance” column by rating each property as either:
High importance – essential information to have for all assets on the network;
Medium importance – quite useful to have this information ; or
Low importance – nice to have but not essential information.
Property Characteristic
Is this measured
or recorded? (Yes/No)
How is it measured? (i.e. Type of
instrument/test method)
What level of importance would you
assign to this characteristic assessment of
condition? (Low, Medium, High)
Inventory
Asset Number, Road Number, Location, GPS
Description (type & shape of beam, containment level), Length
Date of Last/Next Inspection
Date of installation
Dates and details of maintenance
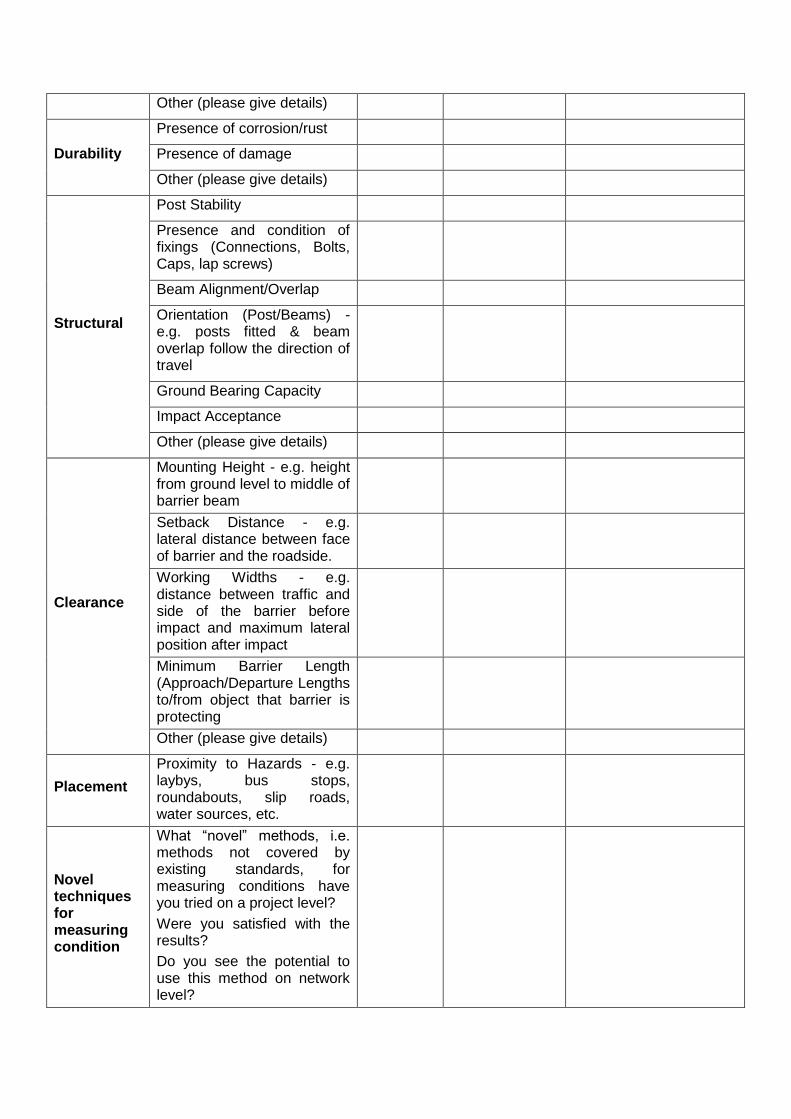
Other (please give details)
Durability
Presence of corrosion/rust
Presence of damage
Other (please give details)
Structural
Post Stability
Presence and condition of fixings (Connections, Bolts, Caps, lap screws)
Beam Alignment/Overlap
Orientation (Post/Beams) - e.g. posts fitted & beam overlap follow the direction of travel
Ground Bearing Capacity
Impact Acceptance
Other (please give details)
Clearance
Mounting Height - e.g. height from ground level to middle of barrier beam
Setback Distance - e.g. lateral distance between face of barrier and the roadside.
Working Widths - e.g. distance between traffic and side of the barrier before impact and maximum lateral position after impact
Minimum Barrier Length (Approach/Departure Lengths to/from object that barrier is protecting
Other (please give details)
Placement
Proximity to Hazards - e.g. laybys, bus stops, roundabouts, slip roads, water sources, etc.
Novel techniques for measuring condition
What “novel” methods, i.e. methods not covered by existing standards, for measuring conditions have you tried on a project level?
Were you satisfied with the results?
Do you see the potential to use this method on network level?

CEDR Call 2014: Asset Management and Maintenance
Page 99 of 107
Appendix B: Survey Provider Questionnaire

Stakeholder consultation
Introduction to the PREMiUM project
PREMiUM (Practical Road Equipment Measurement Understanding and Management) has been let under the CEDR 2014 call for Asset Management and Maintenance and is being funded by the National Road Authorities in Austria, Belgium (Flanders), Finland, Germany, Ireland, Netherlands, Norway, Sweden and UK. It is a 2 year project that commenced in October 2015.
Compared to the management of pavement and bridge/structures assets, the approach to the management of road equipment assets is less well developed. Inspections are often carried out of these assets but the approaches to inspection regimes and the inspection methods vary e.g. regular condition assessment surveys versus replacement based on life expectancy with monitoring undertaken during safety inspections (which focus only on damage and failures that impact the safety of the road user). The inspections are often manual visual assessments, although there are examples of traffic-speed survey methods in some countries for the assessment of, for example, the visibility of road markings.
Even where a regime exists for the collection of information on equipment assets there is then a need to consider how this information is managed by a road authority. Many national authorities now operate powerful asset management systems, which allow data to be collated on road assets. Again, in comparison with road pavements, there is evidence of significant gaps in this area for road equipment.
Finally, where data do exist, and are accessible to the road owner, there is a need to be able to analyse and interpret this information to determine condition, identify maintenance needs and prioritise maintenance. For the equipment asset types under consideration in this work there is a range of experience in the application of analysis and interpretation methods that could allow the asset to be understood at the network level. Through the development of suitably focussed regimes and the development of appropriate indicators, there is potential to improve the ability to manage these assets
We envisage that the PREMiUM project will help road administrations to establish a maintenance regime that minimises the risk of failure of the asset and yet enables the road administration to focus maintenance expenditure on these assets in an efficient manner.
We have established a project team that includes representatives from the UK, Austria, Belgium, Ireland and Sweden. To help ensure our project outputs are relevant and focussed we are also trying to establish a “PREMiUM Reference Group” containing stakeholders from National Road Authorities; equipment manufacturers and users; researchers and users of the data.
The purpose of this questionnaire is to determine what asset properties you feel are important to know about, in order to assess asset condition, for the following assets:
Road markings and studs
Road signs
Noise barriers
Vehicle restraint systems.
We would then like to know what surveys are carried out currently, whether these are on a scheme/project level, or whether they are performed at network level. We are also seeking to know what equipment is used for monitoring, what is measured; what data is delivered, and how this data is then used to assess condition.

We will use the information, provided by stakeholders, to identify the key characteristics that need to be monitored, how these key characteristics can be monitored at a network level, and how the data can be translated into the information required to determine the condition.

Stakeholder details
Organisation……………………………………………………………………………………………
Country in which organisation based………………………………………………………………
Contact person: ……………………………………………………………………………………
Function/job title: ……………………………………………………………………………………
Email: …………………………………………………………………………………………………
In order to fully understand the answers given to the questionnaire, we may wish to conduct a short follow up interview, conducted via ‘phone. If you would be willing to participate in this, please provide your telephone number:………………………………………………………………………………………………… (Note that you will be asked via email for a convenient time to conduct this interview).
Definitions
Network level monitoring/surveys:
A network level survey or monitoring regime provides data for each length of asset or each individual asset on the road network. This may be achieved in just one year, or it may be organised over a number of years.
Noise Barrier
A noise barrier is a structure, usually erected at the side of a carriageway, designed to reduce the noise level experienced by neighbouring properties.
Project level surveys
A project or scheme level survey provides detailed data for a specific length (or lengths) on the road network. Project level surveys are usually performed when a need for maintenance has been identified, or where a network level survey has suggested that further investigation is requirement.
Road marking
A road marking is any kind of device or material that is used on a road surface in order to convey official information. They can be used to delineate traffic lanes, inform motorists and pedestrians or serve as noise generators when run across a road (rumble strips), or attempt to wake a sleeping driver when installed in the shoulders of a road. Road surface markings can also indicate regulation for parking and stopping.
Centre lines are the most common forms of road markings, providing separation between traffic moving in opposite directions, or between traffic moving in separate lanes. In PREMiUM, we will only be considering lane separating markings.
Retroreflective road stud
A road stud is a safety device used on roads, usually made with plastic, ceramic, thermoplastic paint or occasionally metal, and come in a variety of shapes and colours. Retroreflective studs include a lens or sheeting that enhances their visibility by reflecting vehicle headlights.

Vehicle Restraint System
A vehicle restraint system is a structure, usually fixed at the side of a carriageway, designed to prevent vehicles from leaving the carriageway
Please answer the questions below for the assets for which you have knowledge.
General
Question Answer
1 For which road network(s) have you had or do you have a contract to provide asset surveys for?
2 For which of the four assets do you provide survey/monitoring services?

Please answer the following questions, for the assets for which you provide survey services.
Road Markings and Studs
Question Answer
3
What survey methods/techniques do you currently use to monitor the condition of road markings or studs? What measurements are recorded?
Please list all methods and all relevant measurements.
Please indicate whether the methods are carried out at high speed, whether they are manual etc.
4 Please indicate whether any of the slow speed survey methods listed above could be performed at traffic speed.
5
How is the inspection performed? Please describe how the condition of road markings and studs is determined? How do you define the condition of road markings and studs? (For example: Scale 1-5; Yes/No; good condition – bad condition)
6 Does the inspection take place according to a standard? If so, please provide details of this.
7 How often does inspection take place?
8
Do you register the type/position of the road markings/studs (e.g. transverse position, spacing, width, construction etc.)? If so, please provide details of this.
9 What are the yearly costs per km for these measures?
10
Are you aware of any novel or emerging technology that could be used to provide high speed measurements of road marking or stud condition? If so, please provide details of this

Road Signs
Question Answer
11
What survey methods/techniques do you currently use to monitor the condition of road signs? What measurements are recorded?
Please list all methods and all relevant measurements.
Please indicate whether the methods are carried out at high speed, whether they are manual etc.
12 Please indicate whether any of the slow speed survey methods listed above could be performed at traffic speed.
13
How is the inspection performed? Please describe how the condition of road signs is determined? How do you define the condition of road signs? (For example: Scale 1-5; Yes/No; good condition – bad condition)
14 Does the inspection take place according to a standard? If so, please provide details of this.
15 How often does inspection take place?
16 What are the yearly costs per km for these measures?
17
Are you aware of any novel or emerging technology that could be used to provide high speed measurements of road sign condition? If so, please provide details of this

Noise barriers
Question Answer
18
What survey methods/techniques do you currently use to monitor the condition of noise barriers? What measurements are recorded?
Please list all methods and all relevant measurements.
Please indicate whether the methods are carried out at high speed, whether they are manual etc.
19 Please indicate whether any of the slow speed survey methods listed above could be performed at traffic speed.
20
How is the inspection performed? Please describe how the condition of noise barriers is determined? How do you define the condition of noise barriers? (For example: Scale 1-5; Yes/No; good condition – bad condition)
21 Does the inspection take place according to a standard? If so, please provide details of this.
22 How often does inspection take place?
23 What are the yearly costs per km for these measures?
24
Are you aware of any novel or emerging technology that could be used to provide high speed measurements of noise barrier condition? If so, please provide details of this

Vehicle Restraint Systems
Question Answer
25
What survey methods/techniques do you currently use to monitor the condition of vehicle restraint systems? What measurements are recorded?
Please list all methods and all relevant measurements.
Please indicate whether the methods are carried out at high speed, whether they are manual etc.
26 Please indicate whether any of the slow speed survey methods listed above could be performed at traffic speed.
27
How is the inspection performed? Please describe how the condition of restraint systems is determined? How do you define the condition of restraint systems? (For example: Scale 1-5; Yes/No; good condition – bad condition)
28 Does the inspection take place according to a standard? If so, please provide details of this.
29 How often does inspection take place?
30 What are the yearly costs per km for these measures?
31
Are you aware of any novel or emerging technology that could be used to provide high speed measurements of vehicle restraint system performance or condition? If so, please provide details of this.