identifying the water sources consumed by bison: …s/nippert et al...special feature: isoscapes...
TRANSCRIPT

SPECIAL FEATURE: ISOSCAPES
Identifying the water sources consumed by bison:implications for large mammalian grazers worldwide
JESSE B. NIPPERT,1,� TEALL S. F. CULBERTSON,1 GRACIELA L. OROZCO,1 TROY W. OCHELTREE,1,2
AND BRENT R. HELLIKER3
1Division of Biology, Kansas State University, Manhattan, Kansas 66506 USA2Department of Forest Resources, University of Minnesota, St. Paul, Minnesota 55108 USA3Department of Biology, University of Pennsylvania, Philadelphia, Pennsylvania 19104 USA
Citation: Nippert, J. B., T. S. F. Culbertson, G. L. Orozco, T. W. Ocheltree, and B. R. Helliker. 2013. Identifying the water
sources consumed by bison: implications for large mammalian grazers worldwide. Ecosphere 4(2):23. http://dx.doi.org/
10.1890/ES12-00359.1
Abstract. The sources of drinking water consumed by grazers vary over time and may be highly
selective, similar to choices in diet. Water sources consumed by large grazers in natural populations are not
typically measured directly. Instead, consumption is inferred based on animal proximity to water sources.
Here, we analysed the stable isotopic signature of water (d18O and dD) extracted from fecal samples from a
herd of bison in mesic grassland as a direct estimation of the water sources consumed over time. Bison at
this site have their choice of a range of habitats and drinking water sources. Potential source-water samples
measured had a large range of isotopic signatures, allowing the isotopic composition of water from bison
fecal samples to be proportionally estimated based on varying sources. Results indicate bison have low
reliance on multiple streams on site; rather, the majority of water consumed was from rainfall-fed sources
(puddles and wallows) and from forage. Our research suggests that source-water analysis from fecal
samples is a robust technique when samples from large grazers can be collected soon after production.
These results have implications for analyses of the foraging patterns and landscape utilization by this and
other large grazers, because hotter and drier future conditions are likely to reduce the frequency and
amount of rainfall-fed puddles available for consumption in many grassland systems worldwide.
Key words: Bison bison; dD; d18O; grassland; isoscape; mixing models; Special Feature: Isoscapes; water.
Received 20 November 2012; revised and accepted 17 January 2013; published 18 February 2013. Corresponding Editor:
J. West.
Copyright: � 2013 Nippert et al. This is an open-access article distributed under the terms of the Creative Commons
Attribution License, which permits unrestricted use, distribution, and reproduction in any medium, provided the
original author and sources are credited. http://creativecommons.org/licenses/by/3.0/
� E-mail: [email protected]
INTRODUCTION
Large herbivore diversity and density are keydrivers of ecosystem structure and function ingrasslands and savannas worldwide (Collins etal. 1998, Holdo et al. 2007, Riginos and Grace2008). At the landscape-scale, the often patchydistribution of resource availability over timedrives distribution patterns of large herbivores
(Fryxell 1991, Bailey et al. 1996, Wilmshurst et al.1999, Allred et al. 2011, Smit 2011). Foragequality for large herbivores can be constrainedby access to reliable water sources (Bailey et al.1996, Redfern et al. 2003). As such, access towater imposes a limitation on herd distributionsacross the landscape and regulates an animal’sability to access both high quality and quantitiesof forage (Redfern et al. 2003). Limitations on
v www.esajournals.org 1 February 2013 v Volume 4(2) v Article 23

grazing distances from water sources varyamong ungulate species according to digestivethroughput rate, fecal moisture content, urinevolume and osmolality and other physiologicaland morphological characteristics associatedwith the grazer’s ability to maintain an optimaltemperature and water balance (Cain et al. 2012).Some ruminants (e.g., African buffalo, Synceruscaffer) may be especially sensitive to the foragingconstraints set by access to surface water avail-ability, because trade-offs between forage qualityand water availability are manifest duringperiods when forage quantity is low (Redfern etal. 2003, Smit et al. 2007, Smit 2011) and when themoisture content of grasses decreases followingsenescence (Western 1975).
Most evidence for the drinking-water sourcesconsumed by large grazers has been anecdotal orinferential based on proximity to water sources.For example, presumed drinking water sourceshave been reported using visual observations ofherd habitat selection (Coppock et al. 1983,Bergstrom and Skarpe 1999, de Leeuw et al.2001), camera traps (Whiting et al. 2010), aerialcensus (Western 1975, Redfern et al. 2003), anddistances to water calculated using GPS collars(Fortin et al. 2003, Allred et al. 2011, Dancose etal. 2011, Cain et al. 2012). These techniquesprovide a template for presumed water-use bygrazers based on the assumption that the waterconsumed comes from either the most abundantor most proximal water source to the animal’slocation. Fewer studies have linked drinkingwater sources using the stable isotopic signatureof body water and final deposition in animaltissues (Kohn 1996, McKechnie et al. 2004,Podlesak et al. 2008, Kirsanow and Tuross2011). Using rodents, Podlesak et al. (2008)showed that the half-life turnover of body-waterwas 3–6 days, but only ;50% of the stableisotopic signature of oxygen in blood samplesoriginated from drinking water (the other ;50%was from atmospheric oxygen and food). Thestable isotopic signature of water from fecalsamples has been measured using the doubly-labelled water method to quantify the free- livingenergy exchange of reindeer (Rangifer tarandus)(Gotaas et al. 1997, Haggarty 1999, Gotaas et al.2000). Water extracted from fecal samples mayprovide direct evidence of drinking-water sourc-es selected by free-ranging species without the
need for an introduced isotopic tracer if thepotential drinking-water sources in an environ-ment have a range of distinct isotopic signatures.Compared to body water analyses using blood orplasma, water from fecal samples should directlyreflect drinking water sources because the diges-tive system is anaerobic, and thus reduces thepotential for isotopic exchange of water withatmospheric sources of O2 following consump-tion. Additionally, the residence time of water inthe digestive system can be relatively short (;10hours in cattle) before being metabolized orexcreted (Seo et al. 2006).
To identify how the drinking-water sourcesmay vary for large grazers, we studied theAmerican bison (Bison bison), a species with ahistoric continental-wide distribution in NorthAmerica (Hall and Kelson 1959, Shaw 2000,Anderson 2006, List et al. 2007), similar to thatseen in the large grassland and savanna land-scapes still available for grazers in Africa. Bisoncurrently occur within constrained and managedgeographic ranges, yet seasonal patterns ofresource availability are likely to drive resourceselection, consumption, and energetics (Rutleyand Hudson 2000, Bergman et al. 2001, Allred etal. 2011). Bison movements across the landscapecommonly reflect selective grazing preferences tomaximize forage quality (Coppock et al. 1983,Coppedge et al. 1998, Coppedge and Shaw 1998,Knapp et al. 1999). Similar to selective grazingpreferences, seasonal and spatial dynamics ofwater availability impact bison movements onthe landscape (Coppedge and Shaw 1998). Forexample, bison in Prince Albert National Park,Saskatchewan were more likely to graze inmeadows within 2 km of water during thesummer than areas at greater distances fromwater sources (Fortin et al. 2003). Dancose et al.(2011) reported varying seasonal habitat selectionby bison, corresponding with avoidance of waterholes during the summer and selection ofmeadow habitat with water available duringwinter and spring. Similarly, stream corridors canmodify travel routes and habitat accessibilitythrough changes in landscape connectivity, in-fluencing bison movements on the landscape(Bruggeman et al. 2007). While water availabilitycan influence patterns of bison movements,many landscapes with bison either have uniformdistributions of water sources (natural or artifi-
v www.esajournals.org 2 February 2013 v Volume 4(2) v Article 23
SPECIAL FEATURE: ISOSCAPES NIPPERT ET AL.

cial), are of insufficient size to detect an effect ofdistance to water, or methods of source-waterdetection are ineffective, expensive, or labor-intensive.
In this study, we measured the sources ofwater consumed using bison fecal samplescollected for 14 months (January 2010–March2011) in mesic grassland (tallgrass prairie) ineastern Kansas, USA. Water sources includedseveral grassland streams (Gray and Dodds1998), rainfall collected in puddles and wallows,and water consumed from forage. We hypothe-sized that (1) water extracted from fecal samplesof bison would provide a reliable proxy of thewater consumed, and this technique may beadvantageous compared to inferential studies ofdrinking-water sources, because selection may beinfluenced by behavior, demography and herdsocial structure rather than proximity alone, (2)while stream-water is the most reliable andabundant source of water available for bisonconsumption at this site, seasonal rainfall pat-terns are likely to impact the sources of waterconsumed, and (3) sources of water consumedwould vary based on herd demography. Bisonmaintain mixed-herd groups with females,calves, and immature males forming large herds,and mature males forming separate small groups(Schuler et al. 2006). For these reasons, source-water consumption was presumed to vary basedon gender and age-class.
MATERIALS AND METHODS
Site descriptionResearch was performed at the Konza Prairie
Biological Station (KPBS), a 3,487-ha nativetallgrass prairie located in the Flint Hills ofnortheast Kansas, USA (408 N, 99.58 W). Regionalclimate for KPBS is characterized as mid-conti-nental, with warm-wet summers, and cool drywinters. Daily mean air temperature (1982–2011)varies between the coolest (�1.4 6 0.58C inJanuary) and warmest (26.1 6 0.38C in July)months. From 1982–2011, mean annual rainfall(61 SE) for the site was 805 6 35 mm, with 75% ofthe total amount occurring during the growingseason (April–September). Total precipitation for2010 was 843 mm, with a mean event size of 2.3 6
0.92 mm. The mean and median number of daysbetween rain events varied based on season. From
January-February 2010, the mean and mediannumber of days between rain events was 7.1 and 5days, respectively. The frequency of events in-creased from April–October, with mean andmedian number of days between events of 3.3and 2 days. During the seasonal temperaturetransitions (March, November–December), themean and median number of days betweenrainfall events was 4.7 and 2 days, respectively.
KPBS is divided into watershed units formanagement, with varying intervals of firefrequency (1, 2, 4, or 20 years) and the majorityof burn treatments occurring in spring. KPBSmaintains a bison herd within the central 1012 hasection of the site. The bison herd on KPBS wasestablished in 1987, and has grown in size sincethat time to a herd size of 300–400 individuals,with a male to female ratio of 1:5 (Craine et al.2013). Bison at KPBS are not managed forproduction, and thus animal movements on siteare unrestricted and time spent in variouslocations is directed by the herd, and not sitepersonnel.
Data collectionStarting in January, 2010, fecal samples were
collected approximately every 10 to 14 dayscontinuing to March, 2011. At each collectiondate, a herd of individuals on the landscape wasmonitored, and 2–5 fecal samples were collectedwithin minutes of being produced. At this time,the animal ID was recorded, and samples weretransferred into a 12 mL glass exetainer with aseptum (Labco, UK). Samples were stored priorto analysis in a cold freezer (�78C). In total, 90bison samples were collected during the 14 mo.study. Of these samples, 48% were from adultfemales, 32% from adult males, 8% from juvenilefemales (less than 3 years old) and 12% fromjuvenile males. Fecal samples were collected ineach of the watersheds available to bison onKPBS, reflecting the full-range of burn frequen-cies and landscape composition available on site(1, 2, 4, and 20-year).
Water samples were collected on site foranalysis as potential drinking-water sources.Within the area available to bison at KPBS, over3000 bison wallows exist (A. Joern, unpublisheddata). These wallows vary in size (from 2 to 10 mdiameter), their frequency of utilization, and inthe duration of time with standing water
v www.esajournals.org 3 February 2013 v Volume 4(2) v Article 23
SPECIAL FEATURE: ISOSCAPES NIPPERT ET AL.

following a rainfall event (typically 1–5 days). Tobest characterize recent rainfall-fed sources avail-able to the entire herd, precipitation was collect-ed at KPBS following each rain event (.5 mm)from January, 2010 through March, 2011 as partof the NADP sample collection protocol (Nation-al Atmospheric Deposition Program; http://nadp.sws.uiuc.edu). Streamwater samples were col-lected weekly from the lower reach of King’sCreek (the major stream that flows through thegrazed section of KPBS) over the same timeperiod (n¼38). Water samples were filtered at 0.2micron using a Whatman Puradisc PES filter.
Isotopic analysisWater was extracted from fecal samples using
cryogenic vacuum distillation (Nippert andKnapp 2007) using an extraction line operatedin the Stable Isotope Mass Spectrometry Labora-tory at KSU. Water samples from bison, rainfall,and stream-water were analyzed for their stableisotopic composition using a Picarro WS-CRDSisotopic water analyzer using ChemCorrectsoftware to identify possible interference orsample contamination. The stable isotopic ratiosof water samples (d18O and dD) are reported asdeviations from international standards using d-notation in parts per thousand (%):
d ¼ Rsample
Rstandard
� 1
� �3 1000
� �ð1Þ
where R is the absolute ratio of the rare tocommon isotope, respectively. Working in-housestandards were calibrated to the recommendedprimary water standards: GISP, SLAP, V-SMOW(Coplen 1995). Repeated measurements of work-ing standards within each run were ,0.2% and0.5% (for d18O and dD) and analysis of QA/QCstandards were within 0.1% of calibrated value.
Leaf-water modellingLeaf water enrichment was predicted using the
Craig-Gordon model (Craig and Gordon 1965)modified for plant water loss (Flanagan et al.1991):
RL ¼ a�½aKRSwi � ws
wi
� �þ aKBRS
ws � wa
wi
� �
þRawa
wi
� �� ð2Þ
where Rs is the isotope ratio of water enteringplant roots, Ra is atmospheric water vapor, a* isthe temperature-dependent equilibrium fraction-ation factor (Majoube 1971), aK and aKB are thefractionation factors for diffusion through sto-mata and the leaf-boundary layer, respectively.For the diffusional fractionation factors, thevalues of Merlivat were used (Merlivat 1978,Luz et al. 2009). w is the mixing ratio of watervapor in air (a), the substomatal cavity (i ) and theleaf surface (s). Ra was assumed to be inequilibrium with Rs at air temperature, leaftemperature was assumed to be equal to airtemperature. wa and wi were calculated usingrelative humidity measurements and ws wasdetermined iteratively (Ball 1987, Roden andEhleringer 1999) using a constant stomatalconductance of 300 mmol m�2 s�1 and aboundary layer conductance of 2000 mmol m�2
s�1. The model was run each growing-season dayand parameterized with daily mean air temper-ature and relative humidity. Rs was assumed tobe equal to the most recent precipitation eventand updated for each new event. We made noadjustments for potential differences in enrich-ment between C3 grasses or forbs and C4 grasses,because seasonal differences in VPD and precip-itation at KPBS have a much greater impact onleaf water enrichment than differences in leafwater d18O by photosynthetic pathway. Similarly,differences in leaf water d18O between photosyn-thetic pathways are less distinct at sites (e.g.,KPBS) with high growing-season relative humid-ity (Helliker and Ehleringer 2002).
Statistical analysisAll statistical analyses were performed using
the R statistical package (R Development CoreTeam 2007). A mixed-effects model ANOVA(from the ‘nlme’ library in R) was used toidentify statistical differences in bison d18O anddD as a function of bison age and gender,location sampled, time since last rainfall, andsample date as fixed effects. Bison are weanedbetween ages 2–3 years, so individuals wereclassified as ‘adults’ (þ3 years) or ‘juvenile’ (�3years) in the analysis.
To quantify the proportional contribution ofmultiple drinking water sources in the bison’sdiet, a Bayesian isotopic mixing model analysiswas performed using the SIAR package in R
v www.esajournals.org 4 February 2013 v Volume 4(2) v Article 23
SPECIAL FEATURE: ISOSCAPES NIPPERT ET AL.

(Parnell et al. 2010). This type of analysisproduced similar mean source proportions as asimple linear mixing model approach (Phillipsand Gregg 2001), but allows for the incorporationof greater uncertainty in all parameters and thegeneration of true probability distributions. Datawere classified into 3 temporal periods foranalysis, based on observed seasonal phenologyduring 2010: herbaceous growing season, April–October; winter, January–February; and seasonaltransition, March, November–December. Analy-sis of water-source data in winter included onlytwo sources (precipitation and streamwater),because live grass tissue was not available forconsumption during this period.
RESULTS
The stable isotopic signature of precipitation atKPBS from January 2010 to March 2011 rangedfrom 2.3 to �19.9% for d18O and 19 to �150.8%for dD (Fig. 1A). Precipitation samples fell on themeteoric water line (MWL), an equation describ-ing the relationship between hydrogen andoxygen isotope ratios in terrestrial water samples(Fig. 1A). Changes in precipitation d18O over thetime period studied reflect changes in rainfallamount and seasonal air temperature recorded atKPBS (Fig. 2). The range of measured values forstream-water samples was lower (�4.5 to �6.8%for d18O, and �32 to �39% for dD) compared toprecipitation samples (Fig. 1A, inset). Stream-water isotopic samples had values near the MWL,but also showed evaporative enrichment duringwarm periods when values fell below the MWL.Water extracted from bison fecal samples spanneda broad range of d18O and dD values, similar toprecipitation samples (Fig. 1B). Fecal samples fellon the MWL up to values of �4/�25% for d18Oand dD, respectively, at which point water fromfecal samples were evaporatively enriched.
When analyzed for demographic differences inbison d18O or dD, no statistically significantdifferences (P . 0.05) were present for gender,age class or their interaction (Table 1). However,the date of sample collection was a statistically-significant (P , 0.05) predictor of d18O and dDfrom fecal water samples (Table 1).
The d18O composition from bison fecal sam-ples, stream-water and precipitation were com-pared over time (Fig. 3). Stream-water samples
showed very little seasonal trend, with valuesnear �5% for the entire period of study. Fecalsamples and precipitation samples showed sim-ilar seasonal patterns with the lowest values inthe coolest portions of the year and the highestd18O values in the growing season (April–October). Modeled values of leaf-water d18Oshow considerable temporal variation, but noseasonal trends.
The mean monthly d18O from precipitationand fecal samples were statistically correlated (r2
¼ 0.83) across the year (Fig. 4). Fecal sampleswere consistently enriched (higher d18O) com-pared to the corresponding mean precipitationd18O value, but the magnitude of enrichmentvaried over an annual time course with the meand18O from fecal samples from January–May at�2.5% below the trendline compared to þ1.8%above the trendline from June–November (Fig.4). Mean monthly values in precipitation andfecal sample d18O grouped according to theobserved seasonal transitions in phenology dur-ing the time sampled: April–October, March andNovember–December, and January–February(Fig. 4).
The mixing-model analysis partitioning sourc-es of water consumed by bison showed distinctdifferences in d18O over an annual timeframe(Fig. 5). During the time period with livevegetation (April–October), precipitation sourceshad the highest contribution to the waterconsumed (77.1%), compared to 18.9% fromleaf-water and 4% from streams (Fig. 5A).Estimates of source consumption during thisperiod had minimal overlap for the 95% credi-bility intervals of the posterior density estimates(Fig. 5A). During seasonal transitions (March,November–December), bison had the greatestreliance on streamwater (62.7%) compared toprecipitation (11.9%) or leaf-water (25.4%, Fig.5B). During the coldest period of the year(January–February), drinking-water sources bybison were similar between stream (52.5%) andprecipitation (47.5%), with considerable overlapin the 95% credibility intervals of the posteriordensity estimates (Fig. 5C).
DISCUSSION
Access to drinking water is an importantconstraint on grazer distribution and landscape
v www.esajournals.org 5 February 2013 v Volume 4(2) v Article 23
SPECIAL FEATURE: ISOSCAPES NIPPERT ET AL.

utilization in grassland and savanna ecosystems(Redfern et al. 2003). In this study, we used thestable isotopic composition of water from bisonfecal samples as an indicator of the temporalpattern of water-sources consumed over time. AtKPBS, the stream network represents the mostpermanent and accessible source of water for thebison herd, and yet these data show that theprimary source of water consumed originatedfrom rainfall-fed sources including puddles andbison wallows. Thus, proximity of this bison herdto semi-permanent water sources (stream-water)was not a reliable predictor of water consump-
tion for a large portion of the year.Within this bison herd, the isotopic composi-
tion of water from fecal samples varied signifi-cantly over time (Fig. 3) reflecting changes in thesource-water consumed by bison (Figs. 3, 5). Ofthe water sources available for consumption atKPBS, bison showed the greatest reliance onrecent rainfall for the majority of the year (Fig.5A). This is surprising, given the stochasticnature of rainfall events and the uncertainty offinding these ephemeral water sources comparedto the greater permanence of water in streams.Bison on KPBS utilize the entire area available, so
Fig. 1. Sample distribution on the meteoric water line. (A) Measured source-water samples across the entire
study period. The solid black line is the global MWL (dD¼8.03d18Oþ10). Inset panel has a constrained range of
values on both axes to show stream water samples. (B) Bison fecal-water samples measured.
v www.esajournals.org 6 February 2013 v Volume 4(2) v Article 23
SPECIAL FEATURE: ISOSCAPES NIPPERT ET AL.

choices for water were not restricted by accessi-bly or long-travel times to water sources. Thereliance of these bison on wallows, puddles andephemeral water sources likely reflects thegreater proximity of these sources to the locationswhere bison spend the majority of time grazing.In a study focused on African grazers, infrequentrainfall events and low-water content in forageduring the dry season resulted in increasedreliance by grazers on permanent water sources(Smit 2011). Indeed, we found the greatestreliance on stream-water during seasonal transi-tions (Fig. 5B) as well as the coldest periods ofwinter (Fig. 5C) when precipitation-based sourc-es are less available and water content of foragewould be low. Thus, for this bison population,the source of water consumed varied seasonally,with the isotopic composition of water frombison fecal samples matching trends for precip-itation (Fig. 4). The water source with thegreatest permanence (stream-water) was usedpredominantly when grasses do not have livingaboveground tissue (November–March).
The isotopic composition of water consumeddid not vary according to demography (gender
or age class; Table 1). We hypothesized that the
source of water consumed would vary based on
known differences in herd structure and age,
because gender by season differences in water
use have been shown for other grazing species
(Whiting et al. 2010), and bison calves typically
nurse for the first 7–12 months (Green et al. 1993).
In addition, it has been previously shown that
lactation has the potential for body water isotopic
Fig. 2. Measured d18O in precipitation samples collected at KPBS from January 2010 to March 2011 (left y-axis).
Rainfall event sizes (mm) are described on the lower right y-axis, while changes in mean daily air temperature
(8C) are described on the upper right y-axis.
Table 1. Results from a mixed-effects model ANOVA
assessing differences in bison sample d18O and d2Has a function of sample date, animal gender and age
class.
Variable df F P
d18OSample date 32, 47 5.60 ,0.0001Gender 1, 76 0.27 0.61Age class 1, 76 0.69 0.40Gender 3 Age 1, 76 0.08 0.77
d2HSample date 32, 47 5.30 ,0.0001Gender 1, 76 0.08 0.77Age class 1, 76 0.30 0.58Gender 3 Age 1, 76 0.21 0.65
v www.esajournals.org 7 February 2013 v Volume 4(2) v Article 23
SPECIAL FEATURE: ISOSCAPES NIPPERT ET AL.

Fig. 3. Changes in fecal water samples and source-water d18O values over the time period studied. Fecal water
samples (filled circle) are means 6 1 SE. Source water samples (precipitation, short dash; stream, solid line;
modeled leaf water, long dash) are fit using a smoothed spline to measured observations.
Fig. 4. Simple linear regression fit to the relationship between mean monthly precipitation d18O and mean
monthly bison fecal water d18O. Error bars represent 61 SE. Data points are identified according to month
observed. No precipitation events occurred in December 2010. The dashed blue ellipse shows the monthly
temporal sequence for this relationship.
v www.esajournals.org 8 February 2013 v Volume 4(2) v Article 23
SPECIAL FEATURE: ISOSCAPES NIPPERT ET AL.
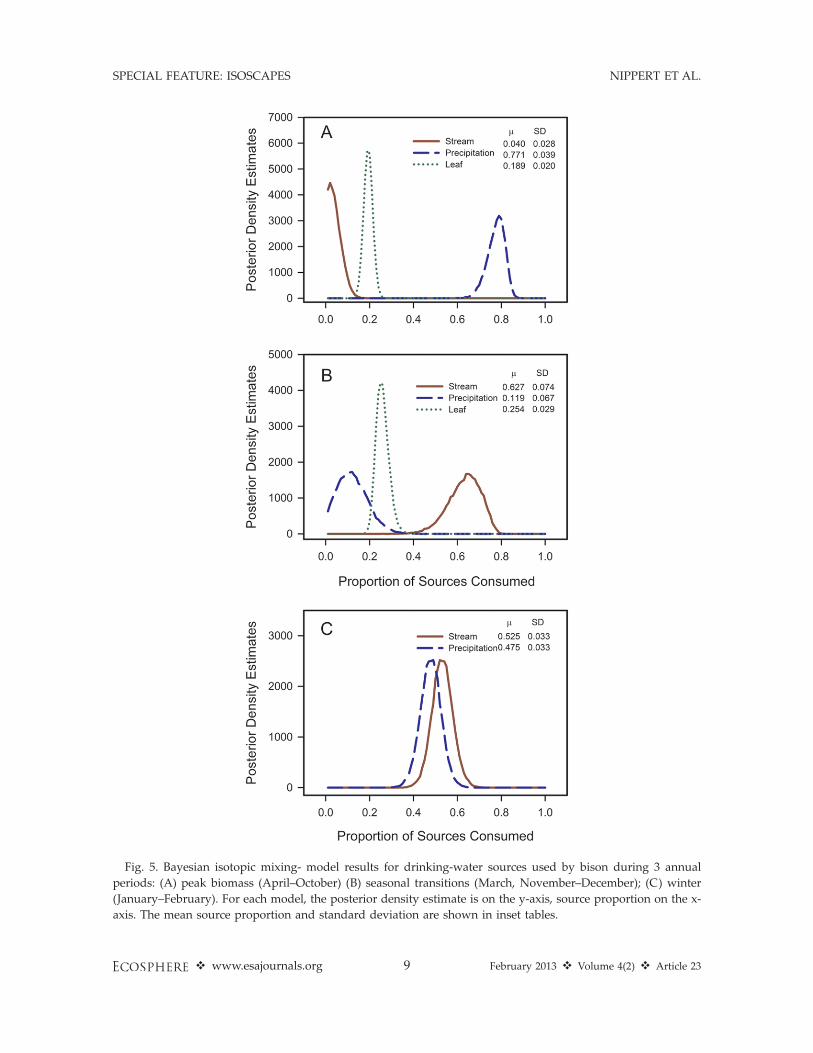
Fig. 5. Bayesian isotopic mixing- model results for drinking-water sources used by bison during 3 annual
periods: (A) peak biomass (April–October) (B) seasonal transitions (March, November–December); (C) winter
(January–February). For each model, the posterior density estimate is on the y-axis, source proportion on the x-
axis. The mean source proportion and standard deviation are shown in inset tables.
v www.esajournals.org 9 February 2013 v Volume 4(2) v Article 23
SPECIAL FEATURE: ISOSCAPES NIPPERT ET AL.

fractionation (Haggarty 1999). Demographic dif-ferences in either stable isotope of water were notstatistically different (Table 1), suggesting similarsources of water consumed within the herd,when assessed infrequently (;2 weeks) over theentire space available to this herd at KPBS. Thus,if within-population dynamics of water-use exist,it will require a greater temporal and spatialsampling frequency for identification.
These results show that water from bison fecalsamples provide a robust indicator for partition-ing drinking-water sources over time. This studyutilized ambient temporal variability in theisotopic signature of water sources, rather thana tracer technique as originally described byGotaas et al. (1997), using doubly-labeled waterto estimate energy expenditure in reindeer.Utilizing the natural variability in the isotopicsignatures of water is preferred over tracertechniques, which are typically more time-con-suming and expensive to employ at the land-scape-scale. Here, no evidence exists to suggestisotopic fractionation in water from bison fecalsamples compared to potential drinking watersources. The distribution of fecal samples fallupon the meteoric water line (MWL) up to thelocal hydrologic inflow flux signature (at KPBSinflow represents groundwater recharged byprecipitation: �6% for d18O, �37% for dD[Nippert and Knapp 2007]). At this point on theMWL, the isotopic composition of water fromfecal samples deviated from the MWL (Fig. 1B).If fractionation had occurred between waterconsumption and fecal deposition by bison, it isunlikely that the data in Fig. 1B would fall uponthe MWL up to the inflow flux signature, andthen deviate from the MWL with a similar slopeas measured in local stream water samples (insetpanel, Fig. 1A).
The fecal sampling technique has promise fordiscerning water sources among natural popula-tions of other large grazers, especially whencoupled with data collected using inferentialtechniques (observed, remotely-sensed, or GPScollars) when water-use is based on proximity towater sources (Redfern et al. 2003, Cain et al.2012). Inferential analyses cannot discriminatebetween the possibility that resource-proximitymay not equate to resource-use. Combining thisisotopic approach with an inferential approachhas the potential for even greater insight into
subtle population-level decisions (e.g., herdchoices) that may vary in time and space. Inaddition, this technique using water from fecalsamples is more suitable for ecological fieldstudies than other isotopic techniques usingblood or plasma samples (Podlesak et al. 2008)because the influence of atmospheric oxygen onfecal-derived d18O is low, and the use of fecalsamples does not require animal capture toacquire samples for analysis. For this approachto be utilized in other locations and other grazingspecies requires prompt collection of fecal sam-ples following production to minimize evapora-tive enrichment, as well as using locations wheredrinking-water sources have distinct isotopiccomposition. For example, the monthly valuesof bison/precipitation d18O form an ellipticaltemporal sequence (Fig. 4), a pattern that mostlikely reflects seasonal evaporatively-enrichedsources (e.g., forage or rain-fed puddles), withgreater enrichment during the hottest/driestportion of the year (June–November).
The amount of water required for bison andseasonal changes in water demand by bisonremains to be determined. Previously, estimatesof the annual water supply were calculated forcattle in the Flint Hills region of Kansasconsidering seasonal evaporation and through-flow (Duesterhaus et al. 2008). For an animalwith a mean weight of 250 kg, cattle require onaverage 30 L per day per individual, but thisamount varied over time (Duesterhaus et al.2008). In a study of the comparative ecology ofcattle and bison in tallgrass prairie in Oklahoma,USA, Allred et al. (2011) showed cattle foragingclose to permanent water sources, while bisonspent more time at greater distances frompermanent water sources. These authors con-cluded that ephemeral water sources may con-stitute an important fraction of the total drinkingwater consumed by bison (Allred et al. 2011).Our results support Allred et al. (2011) andhighlight the significance of bison wallows asrainfall catchments. Wallow creation and usedistributed across the landscape enhances theavailability of drinking water sources in thelocations where bison spend the majority of theirtime grazing. In addition, our results also suggestwater from forage may constitute a significantfraction of the water budget for bison. On KPBS,;85–98% of the fresh weight of grasses is water
v www.esajournals.org 10 February 2013 v Volume 4(2) v Article 23
SPECIAL FEATURE: ISOSCAPES NIPPERT ET AL.

when soil moisture is readily available (T.Ocheltree, unpublished data), and live grass tissueis generally available for consumption during thegrassland growing season (April to October).Results from the mixing model analysis (Fig. 5)suggest that water from forage was ;19–25% ofthe total consumed depending on month. Theincreased use of streamwater in the winter andduring seasonal transitions by bison may reflectthe low water content of forage during coldperiods and lower availability of rainfall-fedephemeral water sources.
Our analysis demonstrates that ephemeralwater sources on the landscape and water fromforage are the key components of the waterbudget for this grazer in the year studied. Inaddition, the sources of drinking-water for thispopulation of bison were seasonally-dependentwith shifting reliance on multiple sources ac-cording to seasonal availability. The year ofresearch for this study (2010) had similar rainfallto the long-term mean precipitation measured atKPBS. Forecasted climate changes for the GreatPlains region of North America include increasedair temperatures and increased variability inprecipitation patterns (Christensen et al. 2007),increasing the likelihood of droughts during thevegetative growing season (Easterling et al. 2000,Meehl et al. 2005). With increased droughtfrequency and severity, ephemeral water sourcesare likely to be less available for consumption bybison during the vegetative growing season, theimpacts of which are likely to alter decisions ofresource-use and landscape utilization by bisonin this system. With fewer puddles and wallowscontaining water in the areas grazed, bison arelikely to spend more time travelling to perma-nent water sources (rivers) at the expense of timespent foraging and resting, similar to resultslinking access to drinking-water sources andforage for sable antelope (Hippotragus niger) andzebra (Equus grevyi ) in South Africa (Cain et al.2012). The consequences of modified landscapeutilization by large grazers, driven by reducedwater availability and climate change, have thepotential to impact conservation efforts (Sander-son et al. 2008), predator-prey dynamics (McClu-ney et al. 2012), forage quality and availability(Craine et al. 2009), migratory behavior (Fryxelland Sinclair 1988) and overall grassland structureand function (Collins et al. 1998).
ACKNOWLEDGMENTS
We thank the Konza Prairie Biological Station forlogistical support and the continued maintenance ofthe bison herd. The Konza Prairie LTER Program (NSFDEB-0823341) and the Division of Biology at K-Stateprovided financial support. We thank Gene Towne forassistance with sample collection, and Eva Horne,Anthony Joern, Anthony Swemmer, Joseph Craine,Zak Ratajczak and two anonymous reviewers forcomments that improved this manuscript.
LITERATURE CITED
Allred, B. W., S. D. Fuhlendorf, and R. G. Hamilton.2011. The role of herbivores in Great Plainsconservation: comparative ecology of bison andcattle. Ecosphere 2(3):26.
Anderson, R. C. 2006. Evolution and origin of theCentral Grassland of North America: climate, fire,and mammalian grazers. Journal of the TorreyBotanical Society 133:626–647.
Bailey, D. W., J. E. Gross, E. A. Laca, L. R. Rittenhouse,M. B. Coughenour, D. M. Swift, and P. L. Sims.1996. Mechanisms that result in large herbivoregrazing distribution patterns. Journal of RangeManagement 49:386–400.
Ball, J. T. 1987. Calculations related to gas exchange.Pages 445–476 in E. Zeiger, G. D. Farquhar, andI. R. Cowan, editors. Stomatal function. UniversityPress, Stanford, California, USA.
Bergman, C. M., J. M. Fryxell, C. C. Gates, and D.Fortin. 2001. Ungulate foraging strategies: energymaximizing or time minimizing? Journal of AnimalEcology 70:289–300.
Bergstrom, R., and C. Skarpe. 1999. The abundance oflarge wild herbivores in a semi-arid savanna inrelation to season, pan and livestock. AfricanJournal of Ecology 37:12–26.
Bruggeman, J. E., R. A. Garrott, P. J. White, F. G. R.Watson, and R. Wallen. 2007. Covariates affectingspatial variability in bison travel behavior inYellowstone National Park. Ecological Applications17:1411–1423.
Cain, J. W. III, N. Owen-Smith, and V. A. Macandza.2012. The costs of drinking: comparative waterdependency of sable antelope and zebra. Journal ofZoology 286:58–67.
Christensen, J. H., et al. 2007. Regional climateprojections. Climate change 2007: the physicalscience basis. Pages 887–892 in S. Solomon, D.Qin, M. Manning, Z. Chen, M. Marquis, K. B.Avery, M. Tignor, and M. L. Miller, editors.Contribution of Working Group I to the FourthAssessment Report of the IPCC. Cambridge Uni-versity Press, Cambridge, UK.
Collins, S. L., A. K. Knapp, J. M. Briggs, J. M. Blair, andE. L. Seinauer. 1998. Modulation of diversity by
v www.esajournals.org 11 February 2013 v Volume 4(2) v Article 23
SPECIAL FEATURE: ISOSCAPES NIPPERT ET AL.

grazing and mowing in native tallgrass prairie.Science 280:745–747.
Coplen, T. B. 1995. New IUPAC guidelines for thereporting of stable hydrogen, carbon, and oxygenisotope-ratio data. Journal of Research of theNational Institute of Standards and Technology100:285.
Coppedge, B. R., D. M. Leslie, and J. H. Shaw. 1998.Botanical composition of bison diets on tallgrassprairie in Oklahoma. Journal of Range Manage-ment 51:379–382.
Coppedge, B. R., and J. H. Shaw. 1998. Bison grazingpatterns on seasonally burned tallgrass prairie.Journal of Range Management 51:258–264.
Coppock, D. L., J. E. Ellis, J. K. Detling, and M. I. Dyer.1983. Plant-herbivore interactions in a NorthAmerican mixed-grass prairie. II. Responses ofbison to modification of vegetation by prairie dogs.Oecologia 56:10–15.
Craig, H., and L. I. Gordon. 1965. Deuterium andoxygen 18 variations in the ocean and marineatmosphere. Pages 9–130 in E. Tongiorigi, editor.Stable isotopes in oceanographic studies andpaleotemperatures. Consiglio Nazionale Delle Ri-cerche Laboratorio di Geologia Nucleare, Pisa,Italy.
Craine, J. M., E. G. Towne, D. Tolleson, and J. B.Nippert. 2013. Precipitation timing and grazerperformance in a tallgrass prairie. Oikos 122:191–198.
Craine, J. M., E. G. Towne, A. Joern, and R. G.Hamilton. 2009. Consequences of climate variabil-ity for the performance of bison in tallgrass prairie.Global Change Biology 15:772–779.
Dancose, K., D. Fortin, and X. Guo. 2011. Mechanismsof functional connectivity: the case of free-rangingbison in a forest landscape. Ecological Applications21:1871–1885.
de Leeuw, J., M. N. Waweru, O. O. Okello, M. Maloba,P. Nguru, M. Y. Said, H. M. Aligula, M. A.Heitkonig, and R. S. Reid. 2001. Distribution anddiversity of wildlife in northern Kenya in relationto livestock and permanent water points. BiologicalConservation 100:297–306.
Duesterhaus, J. L., J. M. Ham, C. E. Owens, and J. T.Murphy. 2008. Water balance of a stock-wateringpond in the Flint Hills of Kansas. RangelandEcology and Management 61:329–338.
Easterling, D. R., G. A. Meehl, C. Parmesan, S. A.Changnon, T. R. Karl, and L. O. Mearns. 2000.Climate extremes: observations, modeling, andimpacts. Science 289:2068–2074.
Flanagan, L. B., J. P. Comstock, and J. R. Ehleringer.1991. Comparison of modeled and observedenvironmental influences on the stable oxygenand hydrogen isotope composition of leaf waterin Phaseolus vulgaris L. Plant Physiology 96:588–596.
Fortin, D., J. M. Fryxell, L. O’Brodovich, and D.Frandsen. 2003. Foraging ecology of bison at thelandscape and plant community levels: the appli-cability of energy maximization principles. Oeco-logia 134:219–227.
Fryxell, J. M. 1991. Forage quality and aggregation bylarge herbivores. American Naturalist 138:478–498.
Fryxell, J. M., and A. R. E. Sinclair. 1988. Causes andconsequences of migration by large herbivores.Trends in Ecology and Evolution 3:237–241.
Gotaas, G., E. Milne, P. Haggarty, and N. J. C. Tyler.1997. Use of feces to estimate isotopic abundance indoubly-labeled water studies in reindeer in sum-mer and winter. American Journal of Physiology42:R1451–R1456.
Gotaas, G., E. Milne, P. Haggarty, and N. J. C. Tyler.2000. Energy expenditure of free-living reindeerestimated by the doubly-labeled water method.Rangifer 20:211–219.
Gray, L. J., and W. K. Dodds. 1998. Structure anddynamics of aquatic communities. In A. K. Knapp,J. M. Briggs, D. C. Hartnett, and S. L. Collins,editors. Grassland dynamics: long-term ecologicalresearch in tallgrass prairie. Oxford UniversityPress, New York, New York, USA.
Green, W. C. H., A. Rothstein, and J. G. Griswold. 1993.Weaning and parent–offspring conflict: variationrelative to interbirth interval in bison. Ethology95:105–125.
Haggarty, P. 1999. Quantifying the free living energyexchange of Arctic ungulates with stable isotopes.Rangifer 20:59–70.
Hall, E. R., and K. R. Kelson. 1959. The mammals ofNorth America. Ronald Press, New York, NewYork, USA.
Helliker, B. R., and J. R. Ehleringer. 2002. Differential18O enrichment of leaf cellulose in C3 versus C4
grasses. Functional Plant Biology 29:435–442.Holdo, R. M., R. D. Holt, M. B. Coughenour, and M. E.
Ritchie. 2007. Plant productivity and soil nitrogenas a function of grazing, migration, and fire in anAfrican savanna. Journal of Ecology 95:115–128.
Kirsanow, K., and N. Tuross. 2011. Oxygen andhydrogen isotopes in rodent tissues: Impact of diet,water, and ontogeny. Palaeogeography, Palaeocli-matology, Palaeoecology 310:9–16.
Knapp, A. K., J. M. Blair, J. M. Briggs, S. L. Collins,D. C. Hartnett, L. C. Johnson, and E. G. Towne.1999. The keystone role of bison in North Americantallgrass prairie. BioScience 49:39–50.
Kohn, M. J. 1996. Predicting animal d18O: Accountingfor diet and physiological adaptation. Geochimicaet Cosmochimica Acta 60:4811–4829.
List, R., G. Ceballos, C. Curtin, P. J. P. Gogan, J.Pacheco, and J. Truett. 2007. Historic distributionand challenges to bison recovery in the northernChihuahuan desert. Conservation Biology 21:1487–1494.
v www.esajournals.org 12 February 2013 v Volume 4(2) v Article 23
SPECIAL FEATURE: ISOSCAPES NIPPERT ET AL.

Luz, B., E. Barkan, R. Yam, and A. Shemesh. 2009.Fractionation of oxygen and hydrogen isotopes inevaporating water. Geochimica et CosmochimicaActa 73:6697–6703.
Majoube, M. 1971. Fractionnement en oxygene 18 et endeuterium entre l’eau et savapeur. Journal deChimie et Physique 68:1423–1436.
McCluney, K. E., J. Belnap, S. L. Collins, A. L.Gonzalez, E. M. Hagen, J. N. Holland, B. P. Kotler,F. T. Maestre, S. D. Smith, and B. O. Wolf. 2012.Shifting species interactions in terrestrial drylandecosystems under altered water availability andclimate change. Biological Reviews 87:563–582.
McKechnie, A. E., B. O. Wolf, and C. Martinez del Rio.2004. Deuterium stable isotope ratios as tracers ofwater resource use: an experimental test with rockdoves. Oecologia 140:191–200.
Meehl, G. A., J. M. Arblaster, and C. Tebaldi. 2005.Understanding future patterns of increased precip-itation intensity in climate model simulations.Geophysical Research Letters 32:L18719.
Merlivat, L. 1978. Molecular diffusivities of H216O,
HD16O and H218O in gases. Journal of Chemical
Physics 69:2864–2871.Nippert, J. B., and A. K. Knapp. 2007. Linking water
uptake with rooting patterns in grassland species.Oecologia 153:261–272.
Parnell, A. C., R. Inger, S. Bearhop, and A. L. Jackson.2010. Source partitioning using stable isotopes:Coping with too much variation. PLOS One5(3):e9672.
Phillips, D. L., and J. W. Gregg. 2001. Uncertainty insource partitioning using stable isotopes. Oecologia127:171–179.
Podlesak, D. W., A.-M. Torregrossa, J. R. Ehleringer,M. D. Dearing, B. H. Passey, and T. E. Cerling. 2008.Turnover of oxygen and hydrogen isotopes in thebody water, CO2, hair, and enamel of a smallmammal. Geochimica et Cosmochimica Acta72:19–35.
R Development Core Team. 2007. R: a language andenvironment for statistical computing. R Founda-tion for Statistical Computing, Vienna, Austria.
Redfern, J. V., R. Grant, H. Biggs, and W. M. Getz. 2003.Surface-water constraints on herbivore foraging inthe Kruger National Park, South Africa. Ecology84:2092–2107.
Riginos, C., and J. B. Grace. 2008. Savanna tree density,
herbivores, and the herbaceous community: bot-tom-up vs. top-down effects. Ecology 89:2228–2238.
Roden, J. S., and J. R. Ehleringer. 1999. Observations ofhydrogen and oxygen isotopes in leaf waterconfirm the Craig-Gordon model under wide-ranging environmental conditions. Plant Physiolo-gy 120:1165–1173.
Rutley, B. D., and R. J. Hudson. 2000. Seasonalenergetic parameters of free-grazing bison (Bisonbison) Canadian Journal of Animal Science 80:663–671.
Sanderson, E. W., et al. 2008. The ecological future andthe North American bison: Conceiving long-term,large-scale conservation of wildlife. ConservationBiology 22:252–266.
Schuler, K. L., D. M. Leslie, Jr., J. H. Shaw, and E. J.Maichak. 2006. Temporal-spatial distribution ofAmerican bison (Bison bison) in a tallgrass prairiefire mosaic. Journal of Mammalogy 87:539–544.
Seo, S., L. O. Tedeschi, C. Lanzas, C. G. Schwab, andD. G. Fox. 2006. Development and evaluation ofempirical equations to predict feed passage rate incattle. Animal Feed Science and Technology128:67–83.
Shaw, J. H. 2000. How many bison originally populat-ed western rangelands? Bison World 25:38–41.
Smit, I. P. J. 2011. Resources driving landscape-scaledistribution patterns of grazers in an Africansavanna. Ecography 34:67–74.
Smit, I. P. J., C. C. Grant, and B. J. Devereux. 2007. Doartificial waterholes influence the way herbivoresuse the landscape? Herbivore distribution patternsaround rivers and artificial surface water sources ina large African savanna park. Biological Conserva-tion 136:85–99.
Western, D. 1975. Water availability and its influenceon the structure and dynamics of a savannah largemammal community. East Africa Wildlife Journal3:265–286.
Whiting, J. C., R. T. Bowyer, J. T. Flinders, V. C. Bleich,and J. G. Kie. 2010. Sexual segregation and use ofwater by bighorn sheep: implications for conserva-tion. Animal Conservation 13:541–548.
Wilmshurst, J. F., J. M. Fryxell, B. P. Farm, A. R. E.Sinclair, and C. P. Henschel. 1999. Spatial distribu-tions of Serengeti wildebeest in relation to resourc-es. Canadian Journal of Zoology 77:1223–1232.
SUPPLEMENTAL MATERIAL
SUPPLEMENT
Water isotope data collected from bison fecal samples, streamwater samples, and precipitationsamples from January 2010 to March 2011 on the Konza Prairie, Kansas USA (Ecological ArchivesC004-001-S1).
v www.esajournals.org 13 February 2013 v Volume 4(2) v Article 23
SPECIAL FEATURE: ISOSCAPES NIPPERT ET AL.