idescat. figures of catalonia 201380 100 120 140 2008 2009 2010 2011 economy 2011 catalonia spain...
TRANSCRIPT
Generalitat de CatalunyaGovernment of Catalonia
2013
www.idescat.cat
Figures of Catalonia

Belgium
Slovakia
France
Spain Catalonia
Portugal
Ireland
Poland
Lithuania
Latvia
Estonia
Finland
Sweden
Denmark
Czech Rep.
Austria Hungary
SloveniaRomania
Greece
Bulgaria
Luxembourg
Cyprus
Italy
Germany
Malta
UnitedKingdom
Netherlands
6 5 4 3 2 1 10 0 2 3 4 5 6
% %0 - 4
5 - 9
10 - 14
15 - 19
20 - 24
25 - 29
30 - 34
35 - 39
40 - 44
45 - 49
50 - 54
55 - 59
60 - 64
65 - 69
70 - 74
75 - 79
80 - 84
85 and over
Density of population (inhab./km2)
DENSITY OF POPULATION 2011
POPULATION STRUCTURE 2011
age
EU-27Spain
POPULATION 2011Catalonia Spain EU-27
Population (1 000)(1) 7 436 46 196 503 680males 49.3 49.1 48.8females (%) 50.7 50.9 51.2
Structure (%) 0-14 years 15.9 14.9 15.615-24 years 9.5 10.1 12.125-49 years 39.9 39.6 35.850-64 years 17.7 18.0 19.165-79 years 11.8 12.1 12.7≥ 80 years 5.2 5.3 4.7
Foreigners (%) 15.6 12.1 6.6
Net migration(2) -2.7 -0.9 1.7Natural increase(2) 2.9 1.8 0.8Total increase(2) 0.2 0.9 2.5
Birth rate(2) 10.9 10.2 10.4Children per woman 1.43 1.36 1.59(4)
Marriage rate(2) 3.5 3.4 4.5(4)
Divorce rate(2) 2.5 2.2(3) 2.0(5)
Death rate(2) 8.0 8.3 9.6Life expectancy (years) 82.5 82.5 79.7(4)
males 79.5 79.4 76.7females 85.3 85.4 82.6
(1) 1/01/2012 (estimation). (2) Per 1 000 inhabitants. (3) 2010(4) 2009 (5) 2008
ENVIRONMENT 2011Catalonia Spain EU-27
Municipal waste (1 000 t) 4 067 24 692(2) 252 207(2)
landfilled (%) 26.2 57.9 37.1incinerated (%) 11.8 9.2 21.5recycling and others (%) 62.0 32.9 41.4
Municipal waste per person (kg) 547 535(2) 502(2)
kg per person per day 1.48 1.47 1.38Grennhouse gases(1)(2) 124 123 89(3)
Electricity generated from renewable sources% of gross electricity consumption 12.5(4) 33.6(2) 19.9(2)
(1) 1990=100 (nicht fluorierte Gase) und 1995=100 (fluorierte Gase). (2) 2010(3) UE-15 (4) 2009
Catalonia Spain EU-27Area (1 000 km2) 32 506 4 403Density (inh/km2) 232 92(1) 117(1)
(1) 2010
< 50≥ 50 and < 100≥ 100 and < 150≥ 150 and < 200≥ 200 and < 250≥ 250
80
100
120
140
2008 2009 2010 2011
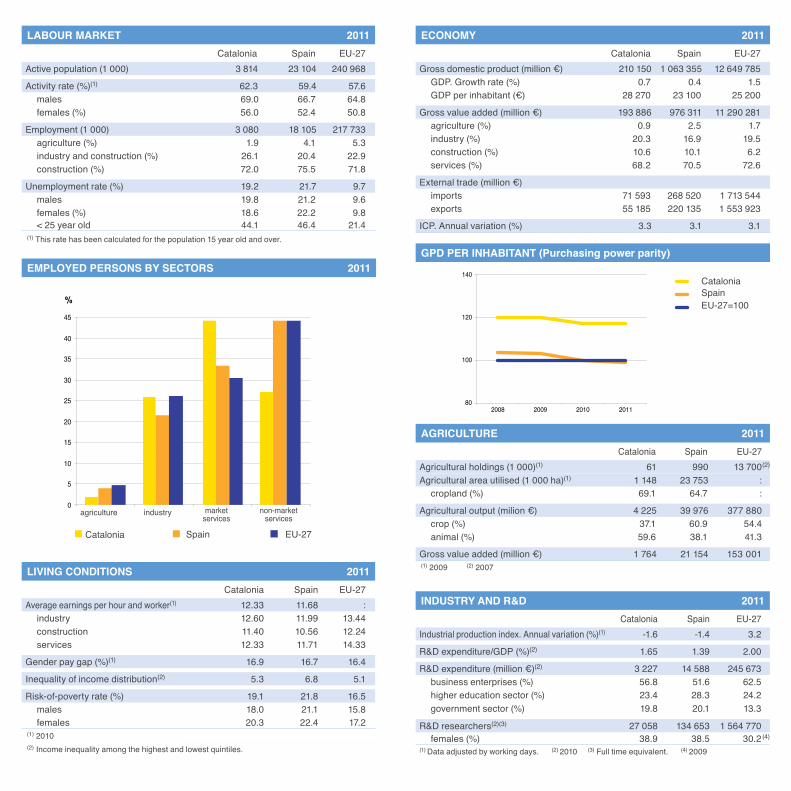
ECONOMY 2011Catalonia Spain EU-27
Gross domestic product (million €) 210 150 1 063 355 12 649 785GDP. Growth rate (%) 0.7 0.4 1.5GDP per inhabitant (€) 28 270 23 100 25 200
Gross value added (million €) 193 886 976 311 11 290 281agriculture (%) 0.9 2.5 1.7industry (%) 20.3 16.9 19.5construction (%) 10.6 10.1 6.2services (%) 68.2 70.5 72.6
External trade (million €)imports 71 593 268 520 1 713 544exports 55 185 220 135 1 553 923
ICP. Annual variation (%) 3.3 3.1 3.1
AGRICULTURE 2011Catalonia Spain EU-27
Agricultural holdings (1 000)(1) 61 990 13 700(2)
Agricultural area utilised (1 000 ha)(1) 1 148 23 753 :cropland (%) 69.1 64.7 :
Agricultural output (milion €) 4 225 39 976 377 880crop (%) 37.1 60.9 54.4animal (%) 59.6 38.1 41.3
Gross value added (million €) 1 764 21 154 153 001(1) 2009 (2) 2007
INDUSTRY AND R&D 2011Catalonia Spain EU-27
Industrial production index. Annual variation (%)(1) -1.6 -1.4 3.2
R&D expenditure/GDP (%)(2) 1.65 1.39 2.00
R&D expenditure (million €)(2) 3 227 14 588 245 673business enterprises (%) 56.8 51.6 62.5higher education sector (%) 23.4 28.3 24.2government sector (%) 19.8 20.1 13.3
R&D researchers(2)(3) 27 058 134 653 1 564 770females (%) 38.9 38.5 30.2 (4)
(1) Data adjusted by working days. (2) 2010 (3) Full time equivalent. (4) 2009
GPD PER INHABITANT (Purchasing power parity)
EU-27=100SpainCatalonia
0
5
10
15
20
25
30
35
40
45
%
LABOUR MARKET 2011Catalonia Spain EU-27
Active population (1 000) 3 814 23 104 240 968
Activity rate (%)(1) 62.3 59.4 57.6males 69.0 66.7 64.8females (%) 56.0 52.4 50.8
Employment (1 000) 3 080 18 105 217 733agriculture (%) 1.9 4.1 5.3industry and construction (%) 26.1 20.4 22.9construction (%) 72.0 75.5 71.8
Unemployment rate (%) 19.2 21.7 9.7males 19.8 21.2 9.6females (%) 18.6 22.2 9.8< 25 year old 44.1 46.4 21.4
(1) This rate has been calculated for the population 15 year old and over.
LIVING CONDITIONS 2011Catalonia Spain EU-27
Average earnings per hour and worker(1) 12.33 11.68 :industry 12.60 11.99 13.44construction 11.40 10.56 12.24services 12.33 11.71 14.33
Gender pay gap (%)(1) 16.9 16.7 16.4
Inequality of income distribution(2) 5.3 6.8 5.1
Risk-of-poverty rate (%) 19.1 21.8 16.5males 18.0 21.1 15.8females 20.3 22.4 17.2
(1) 2010(2) Income inequality among the highest and lowest quintiles.
EMPLOYED PERSONS BY SECTORS 2011
Catalonia EU-27Spain
marketservices
non-marketservices
industryagriculture

INFORMATION SOCIETY 2011Catalonia Spain EU-27
Internet. Households with acces (%) 71.0 64.0 73.0
Internet. Regular users (%)(1) 67.5 62.0 68.0males 72.3 65.0 70.0females 62.7 59.0 65.0
Individuals who have purchased by Internet (%) 23.6 18.9 34.0Enterprises having received orders on-line (%)(2) 14.8 11.0 13.0E-government. Usage (%)
individuals(1) 35.4 32.0(2) 32.0(2)
enterprises 82.4 67.0(2) 76.0(2)
(1) Population aged 16 to 74 who access at least once a week. (2) 2010
EDUCATION Academic year 2011/12Catalonia Spain(1) EU-27(1)
Students (1 000) 1 514 9 701 108 010pre-primary education (%) 22.4 18.8 13.8primary education (%) 30.3 29.0 25.9secondary education (%) 31.4 32.8 41.9tertiary (%) 15.9 19.4 18.4
University. Students (1 000) 241(2) 1 879 19 847art and humanities (%) 10.0 10.7 12.5social and legal science (%) 49.7 42.5 42.8science (%) 5.8 9.3 10.2health (%) 11.6 12.6 13.9engineering and architecture (%) 22.9 24.9 20.6
(1) 2010/11 (2) Advance data.
Government of Catalonia. Expenditure (million €) 29 727
Parliament (%) 0.2Presidential Department (%) 1.6Governance and Institutional Relations (%) 1.1Economy and Knowledge (%) 4.0Education (%) 15.5Health (%) 29.2Home Affairs (%) 3.9Territory and Sustainability (%) 5.3
Culture (%) 1.0Agriculture. Livestock. Fisheries. Food and Natural Enviroment (%) 1.7Social Welfare and Family (%) 7.0Enterprise and Labour (%) 3.8Justice (%) 3.0Public Debt (%) 12.4Local entities (%) 9.0
BUDGET 2012
HEALTH 2011Catalonia Spain EU-27
Hospital beds (per 1 000 inhabitants) 4.8 3.2(1) 5.4(1)
Infant mortality rate (per 1 000 live births) 2.8 3.2 4.1(1)
Main causes of death (per 100 000 inhabitants)(1)
circulatory system 233.5 258.6 379.0neoplasia 226.1 224.2 249.9transport accidents 4.7 5.6 7.0
(1) 2010
ELECTIONS TO THE PARLAMENT OF CATALONIA 11/25/2012
ENERGY 2010Catalonia(1) Spain EU-27
Production of primary energy (1 000 toe) 5 974 34 072 830 868
Primary energy consumption (1 000 toe) 24 297 130 224 1 759 015coal (%) 0.6 6.0 16.0oil and petroleum products (%) 47.2 46.3 35.4natural gas (%) 24.6 23.8 25.2nuclear energy (%) 20.1 12.3 13.5renewable sources and others (%) 7.5 11.6 9.9
Final energy consumption (1 000 toe) 14 548 90 599 1 153 312industry (%) 26.9 25.8 25.3transport (%) 41.0 41.1 31.7domestic and others (%) 32.1 33.1 43.0
Energy consumption per inhabitant (1 000 toe) 3.3 2.8 3.5(1) 2009
TOURISM 2011Catalonia Spain EU-27
Tourist establishments 5 982 44 397 478 758(1)
hotels (%) 47.5 43.4 42.5others (%) 52.5 56.6 57.5
Bed-places (1 000) 745 3 391 27 763(1)
hotels (%) 42.5 54.2 44.9others (%) 57.5 45.8 55.1
Nights spent (1 000) 69 302 389 858 2 233 514(2)
hotels (%) 69.5 73.6 67.6others (%) 30.5 26.4 32.4
(1) 2010 (2) 2009
TRANSPORT 2011Catalonia Spain EU-27
Passenger cars per 1 000 inhabitants 453 483 473(1)
Inland freight transport (t/km)road (%) 99.1 95.8(2) 76.4(2)
rail and waterway (%) 0.9 4.2(2) 23.6(2)
Railways. Passengers (1 000) 208 331 578 940 8 187 151(3)
Airports. Passengers (1 000) 32 096 165 153 821 574
Road accidents. Killed people(4) 352 2 060 34 500(1)
(1) 2009 (2) 2010 (3) 2007 (4) At 30 days.
CiU
ERCCat Sí PSC
PP
ICV EUiA
C's
CUP(AE)
30.68%
13.68% 14.43%
12.99%
9.89%
7.58%
3.48%
50
21 20
19
1393
Provisional data on 11/26/2012.
number of seats

EVOLUTION OF INDICATORS1980 1991 2001 2011
PopulationPopulation density (inhab./km2) 187 190 204 232Population (1 000) 5 956 6 059 6 506 7 436(1)
< 15 years (%) 25.0 17.8 13.8 15.915-64 years (%) 64.0 67.9 68.8 67.1≥ 65 years (%) 11.0 14.3 17.4 17.0
Birth rate (per 1 000 inhabitants) 13.4 9.3 10.4 10.9Infant mortality rate(2) 11.3 6.7 3.2 2.8Active population (1 000) 2 249 2 533 3 092 3 814Activity rate (%) 51.0 52.5 57.9 62.3Employment (1 000) 1 940 2 223 2 826 3 080Unemployment rate (%) 12.6 12.2 8.6 19.2
EconomyGDP (million €) 17 309 61 865 135 709 210 150GDP per inhabitant (€) 2 909 10 190 20 353(3) 28 270Exports (million €) 2 073 8 729 36 695 55 185External trade ratio (Exp. + Imp./GDP) (%) 34.8 42.6 68.9 60.3Cement consumption per inhabitant (kg) 392 715 883 369Vehicles (per 1 000 inhabitants) 370 504 663 678Vehicles registrations (1 000) 147 240 319 173Credit institutions. Local units 4 391 6 850 7 181 7 418(4)
Deposits (million €) 14 863 54 033 93 442 194 333Visitors (1 000) 11 830 16 547 20 931 27 869Hotel bed-places (1 000) 168 189 235 292
SocietyUniversity. Students (1 000) 96 165 220 241Inhabitants per doctor 398 245 213 196Municipal waste (kg/inh./day) 0.8 1.22 1.63 1.48Protected areas (km2) 303 1 816 6 514 10 658(1) 01/01/2012 (estimation). (2) Per 1 000 live births.(3) 2000 (4) 2010
Edited by:
Statistical Institute of Catalonia
www.idescat.catGeneralitat de Catalonia is the national selft-government of Catalonia made up of the three institutions: the Parliament, the President and the Executive Council or Government.
Sources:Government of Catalonia, Idescat, National Statistics Institute, ministries and Eurostat.
Updated: 11/26/2012
© Generalitat de Catalonia Institut d'Estadística de Catalonia ISSN: 2014-8593 Legal deposil B-33522-2012