idh q3 2014 summary report final
TRANSCRIPT
SUMMARY REPORT
Q3/2014
2
IDH, the Sustainable Trade Initiative (IDH), together with Dell, HP, Philips, Apple, Microsoft, ELEVATE, ERI and
civil society organizations, has developed a program to improve the working conditions and environmental
impact of over 75 electronics factories in China, reaching over 200,000 workers. A wide variety of training on
labor, health & safety and environmental performance is being offered, however the innovative focus of the
IDH Electronics Program is the development of effective worker-management dialogue to strengthen the
‘continuous improvement muscle’ of local manufacturers, as a prerequisite to addressing the root causes of
social and environmental performance issues.
ELEVATE believes sustained, impactful improvement in social and environmental performance requires
sincerity of intent and a responsible balance between maximizing financial return and meeting supplier
responsibility requirements. We call this Business Driven Sustainability. ELEVATE’s mission is to help our clients
design and implement customized programs that provide complete insight into risk and improve supply chain
social, environmental and business performance. Within the IDH Electronics Program ELEVATE is responsible
for the executive facilitation of the program as well as the implementation of the ‘non-dialogue’ (business
performance) curriculum.
The Economic Rights Institute (ERI) is a non-profit organization, registered in Hong Kong, with a mission to
support alliances of stakeholders to actualize economic development that respects the rights of all. Within the
IDH Electronics Program, ERI is responsible for designing the methodology to promote worker-management
(employer employee) dialogue, for support to service providers who implement this methodology and for
appraisals of the evolution of dialogue and where this promotes wider enterprise improvements.
3
Index of Contents:
Supplier uptake
Comments on program progress (Q3 ’14)
Progress status overview on supplier implementation
Work-plan completion vs work-plan agreed timelines by supplier
Program trend analysis KPI’s
Appendix 1: Worker satisfaction index
Appendix 2: Worker management dialogue maturity index
4
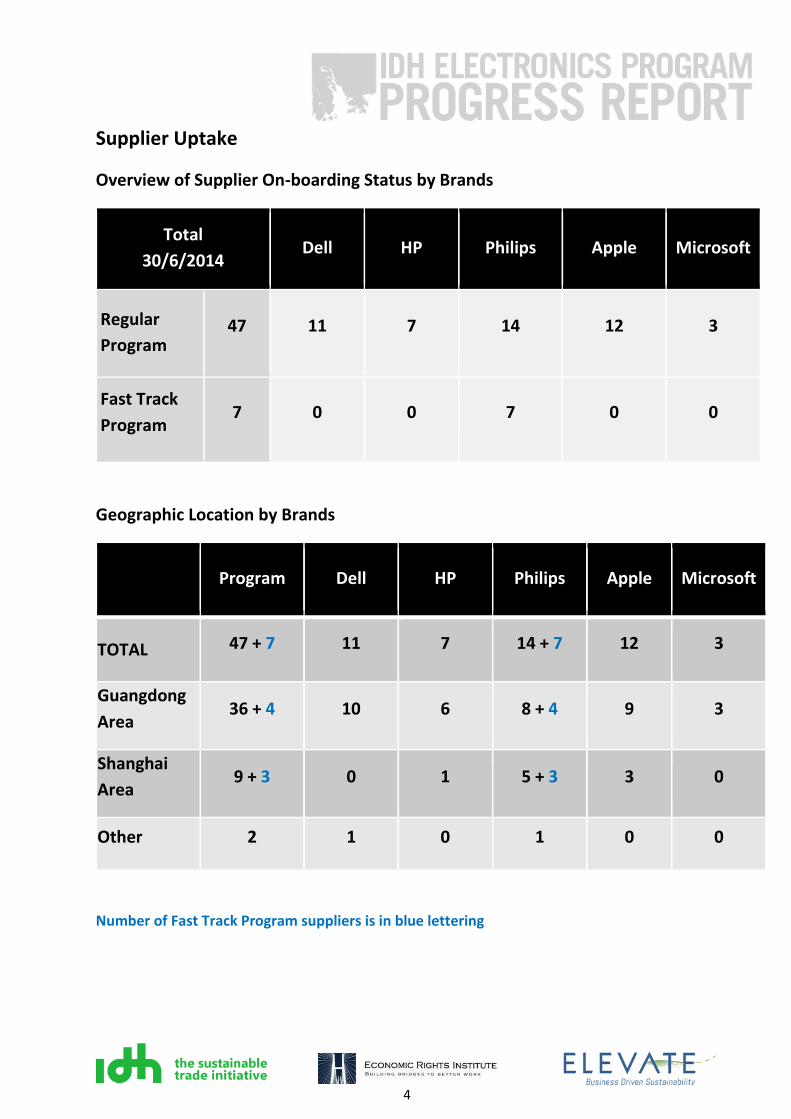
Supplier Uptake
Overview of Supplier On-boarding Status by Brands
Total
30/6/2014 Dell HP Philips Apple Microsoft
Regular
Program 47 11 7 14 12 3
Fast Track
Program 7 0 0 7 0 0
Geographic Location by Brands
Program Dell HP Philips Apple Microsoft
TOTAL 47 + 7 11 7 14 + 7 12 3
Guangdong
Area 36 + 4 10 6 8 + 4 9 3
Shanghai
Area 9 + 3 0 1 5 + 3 3 0
Other 2 1 0 1 0 0
Number of Fast Track Program suppliers is in blue lettering
5
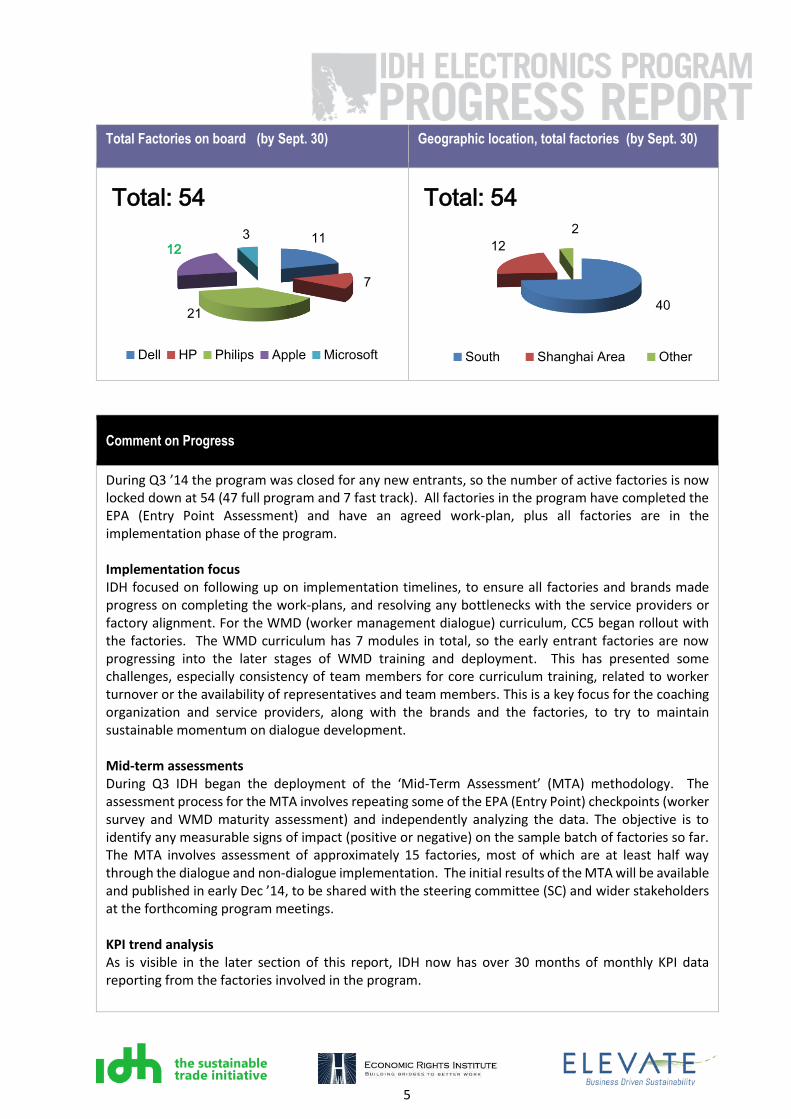
Total Factories on board (by Sept. 30) Geographic location, total factories (by Sept. 30)
Comment on Progress
During Q3 ’14 the program was closed for any new entrants, so the number of active factories is now locked down at 54 (47 full program and 7 fast track). All factories in the program have completed the EPA (Entry Point Assessment) and have an agreed work-plan, plus all factories are in the implementation phase of the program. Implementation focus IDH focused on following up on implementation timelines, to ensure all factories and brands made progress on completing the work-plans, and resolving any bottlenecks with the service providers or factory alignment. For the WMD (worker management dialogue) curriculum, CC5 began rollout with the factories. The WMD curriculum has 7 modules in total, so the early entrant factories are now progressing into the later stages of WMD training and deployment. This has presented some challenges, especially consistency of team members for core curriculum training, related to worker turnover or the availability of representatives and team members. This is a key focus for the coaching organization and service providers, along with the brands and the factories, to try to maintain sustainable momentum on dialogue development. Mid-term assessments During Q3 IDH began the deployment of the ‘Mid-Term Assessment’ (MTA) methodology. The assessment process for the MTA involves repeating some of the EPA (Entry Point) checkpoints (worker survey and WMD maturity assessment) and independently analyzing the data. The objective is to identify any measurable signs of impact (positive or negative) on the sample batch of factories so far. The MTA involves assessment of approximately 15 factories, most of which are at least half way through the dialogue and non-dialogue implementation. The initial results of the MTA will be available and published in early Dec ’14, to be shared with the steering committee (SC) and wider stakeholders at the forthcoming program meetings. KPI trend analysis As is visible in the later section of this report, IDH now has over 30 months of monthly KPI data reporting from the factories involved in the program.
11
7
21
123
Total: 54
Dell HP Philips Apple Microsoft
40
12
2
Total: 54
South Shanghai Area Other
6
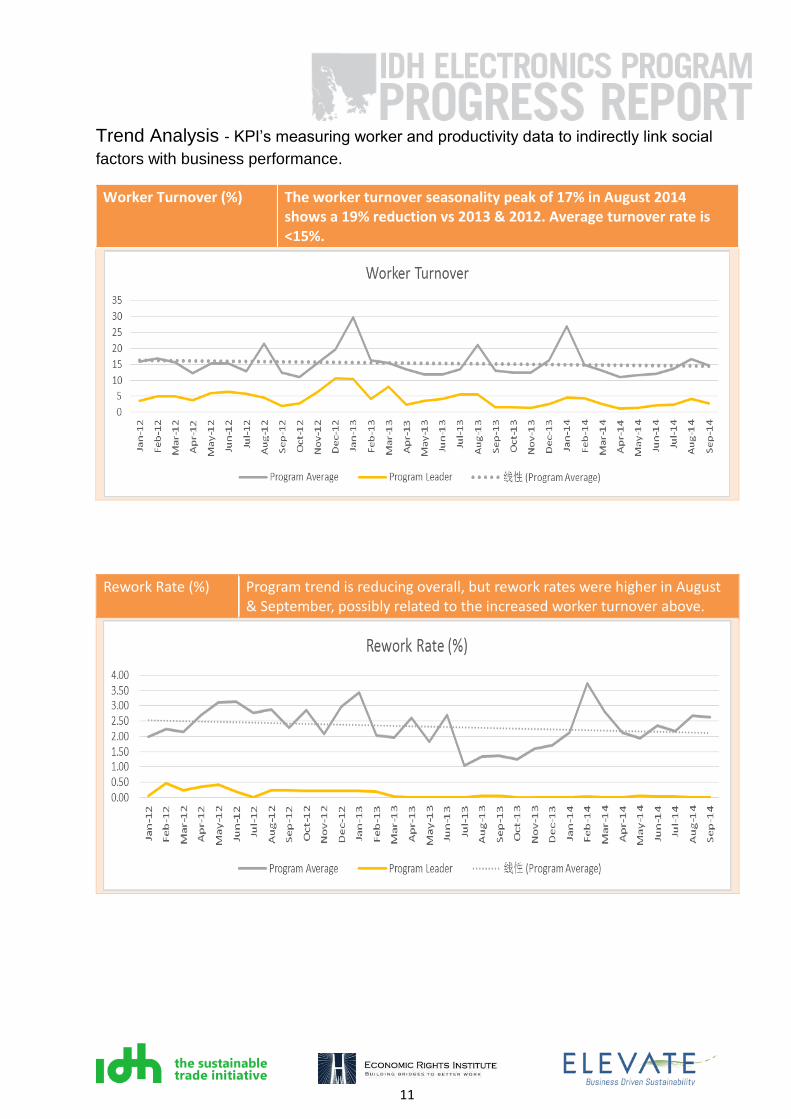
(1) Worker turnover trend in Q3 ’14 shows a seasonality peak for worker turnover in August, which is normally related to temporary student labor turnover. However, there was a 20% reduction in worker turnover in August 2014 (17%) vs the turnover in August during the previous two years (21%).
(2) Rework rates increased in August & Sept, which is possibly related to the increased worker turnover, noted above. A similar increase in rework can be seen in Feb 2014, after the increased worker turnover in Jan 2014.
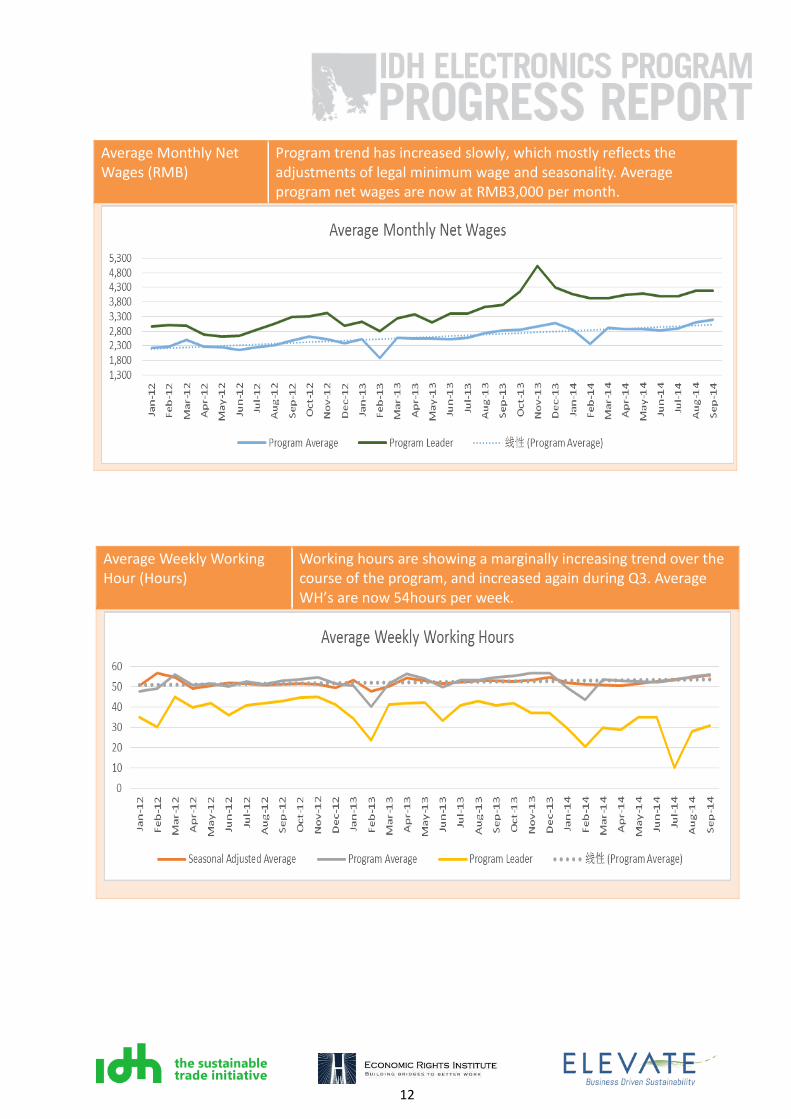
(3) Average salaries and working hours show some increase again in Q3, with the average WH’s in Q3 reaching 54 hours per week. This is likely to be related to high seasonal workloads.
Key Focus Points: 1) The program closed for new factories to join (including the Fast Track) at the end of Q2’14, focus
shifted in Q3 onto completing implementation by end of Q2 ’15. 2) 17 factories, plus the new fast track factories, did not report KPI’s during Q3 (down from 19 in Q2).
IDH will continue to jointly review this with the brands to try and ensure maximum data collection.
7
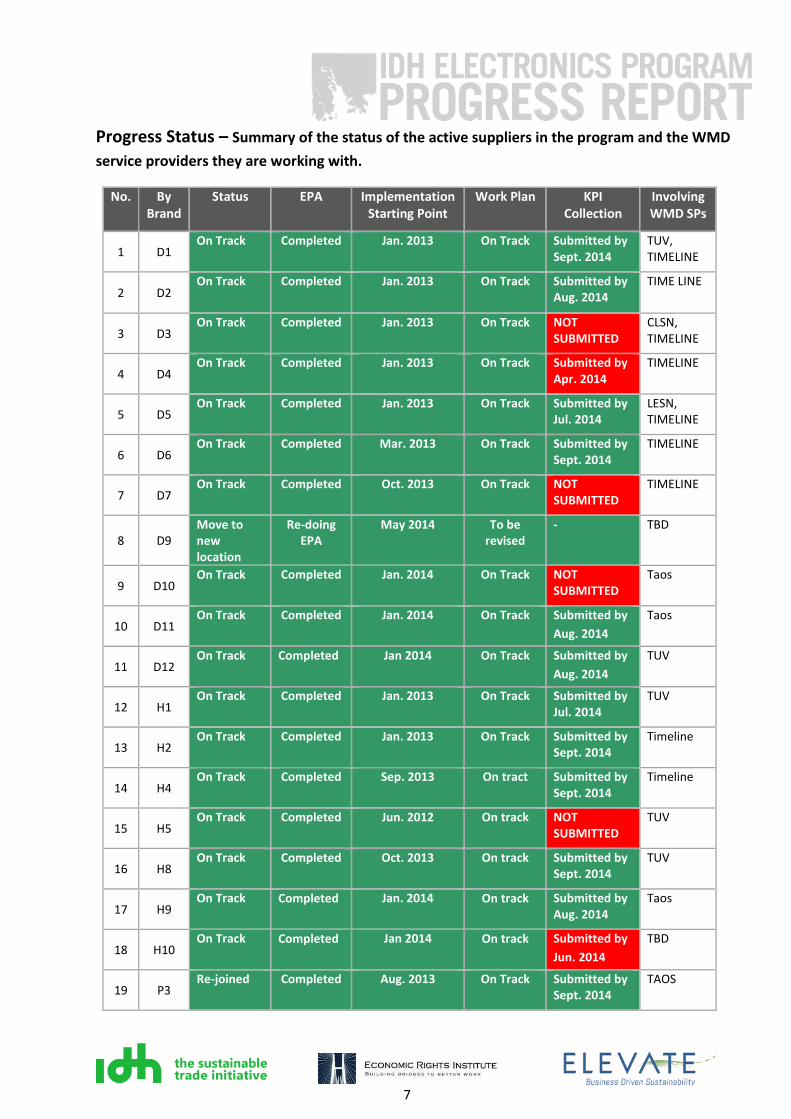
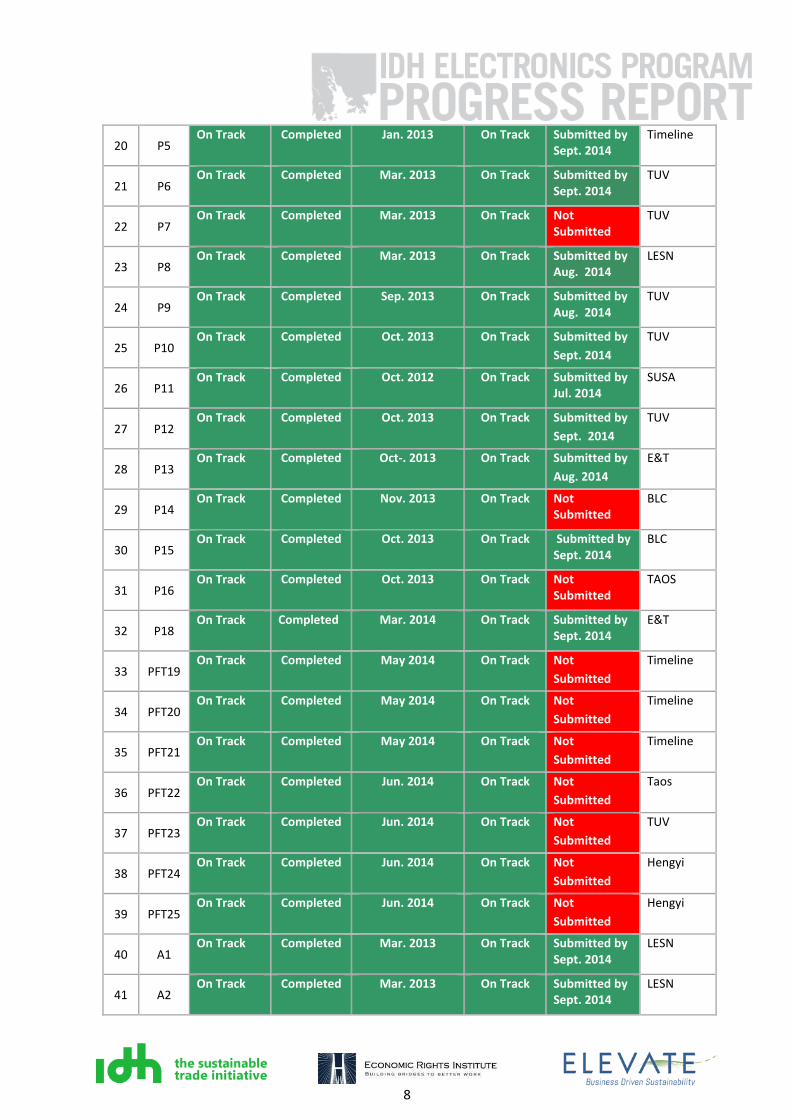
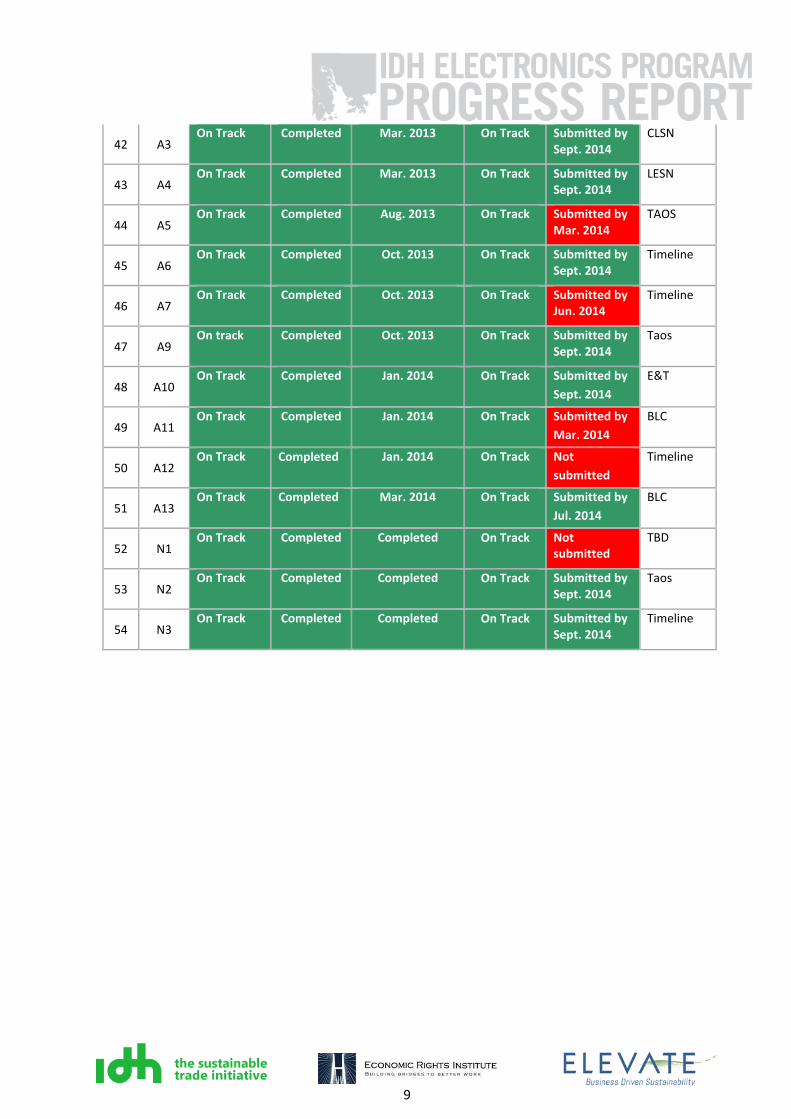
Progress Status – Summary of the status of the active suppliers in the program and the WMD
service providers they are working with.
No. By Brand
Status EPA Implementation Starting Point
Work Plan KPI Collection
Involving WMD SPs
1 D1 On Track Completed Jan. 2013 On Track Submitted by
Sept. 2014 TUV, TIMELINE
2 D2 On Track Completed Jan. 2013 On Track Submitted by
Aug. 2014 TIME LINE
3 D3 On Track Completed Jan. 2013 On Track NOT
SUBMITTED CLSN, TIMELINE
4 D4 On Track Completed Jan. 2013 On Track Submitted by
Apr. 2014 TIMELINE
5 D5 On Track Completed Jan. 2013 On Track Submitted by
Jul. 2014 LESN, TIMELINE
6 D6 On Track Completed Mar. 2013 On Track Submitted by
Sept. 2014 TIMELINE
7 D7 On Track Completed Oct. 2013 On Track NOT
SUBMITTED TIMELINE
8 D9 Move to new location
Re-doing EPA
May 2014 To be revised
- TBD
9 D10 On Track Completed Jan. 2014 On Track NOT
SUBMITTED Taos
10 D11 On Track Completed Jan. 2014 On Track Submitted by
Aug. 2014
Taos
11 D12 On Track Completed Jan 2014 On Track Submitted by
Aug. 2014
TUV
12 H1 On Track Completed Jan. 2013 On Track Submitted by
Jul. 2014 TUV
13 H2 On Track Completed Jan. 2013 On Track Submitted by
Sept. 2014 Timeline
14 H4 On Track Completed Sep. 2013 On tract Submitted by
Sept. 2014 Timeline
15 H5 On Track Completed Jun. 2012 On track NOT
SUBMITTED TUV
16 H8 On Track Completed Oct. 2013 On track Submitted by
Sept. 2014 TUV
17 H9 On Track Completed Jan. 2014 On track Submitted by
Aug. 2014 Taos
18 H10 On Track Completed Jan 2014 On track Submitted by
Jun. 2014
TBD
19 P3 Re-joined Completed Aug. 2013 On Track Submitted by
Sept. 2014 TAOS
8
20 P5 On Track Completed Jan. 2013 On Track Submitted by
Sept. 2014 Timeline
21 P6 On Track Completed Mar. 2013 On Track Submitted by
Sept. 2014 TUV
22 P7 On Track Completed Mar. 2013 On Track Not
Submitted TUV
23 P8 On Track Completed Mar. 2013 On Track Submitted by
Aug. 2014 LESN
24 P9 On Track Completed Sep. 2013 On Track Submitted by
Aug. 2014 TUV
25 P10 On Track Completed Oct. 2013 On Track Submitted by
Sept. 2014
TUV
26 P11 On Track Completed Oct. 2012 On Track Submitted by
Jul. 2014 SUSA
27 P12 On Track Completed Oct. 2013 On Track Submitted by
Sept. 2014
TUV
28 P13 On Track Completed Oct-. 2013 On Track Submitted by
Aug. 2014
E&T
29 P14 On Track Completed Nov. 2013 On Track Not
Submitted BLC
30 P15 On Track Completed Oct. 2013 On Track Submitted by
Sept. 2014 BLC
31 P16 On Track Completed Oct. 2013 On Track Not
Submitted TAOS
32 P18 On Track Completed Mar. 2014 On Track Submitted by
Sept. 2014 E&T
33 PFT19 On Track Completed May 2014 On Track Not
Submitted
Timeline
34 PFT20 On Track Completed May 2014 On Track Not
Submitted
Timeline
35 PFT21 On Track Completed May 2014 On Track Not
Submitted
Timeline
36 PFT22 On Track Completed Jun. 2014 On Track Not
Submitted
Taos
37 PFT23 On Track Completed Jun. 2014 On Track Not
Submitted
TUV
38 PFT24 On Track Completed Jun. 2014 On Track Not
Submitted
Hengyi
39 PFT25 On Track Completed Jun. 2014 On Track Not
Submitted
Hengyi
40 A1 On Track Completed Mar. 2013 On Track Submitted by
Sept. 2014 LESN
41 A2 On Track Completed Mar. 2013 On Track Submitted by
Sept. 2014 LESN
9
42 A3 On Track Completed Mar. 2013 On Track Submitted by
Sept. 2014 CLSN
43 A4 On Track Completed Mar. 2013 On Track Submitted by
Sept. 2014 LESN
44 A5 On Track Completed Aug. 2013 On Track Submitted by
Mar. 2014 TAOS
45 A6 On Track Completed Oct. 2013 On Track Submitted by
Sept. 2014 Timeline
46 A7 On Track
Completed Oct. 2013 On Track Submitted by Jun. 2014
Timeline
47 A9 On track Completed Oct. 2013 On Track Submitted by
Sept. 2014 Taos
48 A10 On Track Completed Jan. 2014 On Track Submitted by
Sept. 2014
E&T
49 A11 On Track Completed Jan. 2014 On Track Submitted by
Mar. 2014
BLC
50 A12 On Track Completed Jan. 2014 On Track Not
submitted
Timeline
51 A13 On Track Completed Mar. 2014 On Track Submitted by
Jul. 2014
BLC
52 N1 On Track Completed Completed On Track Not
submitted TBD
53 N2 On Track Completed Completed On Track Submitted by
Sept. 2014 Taos
54 N3 On Track Completed Completed On Track Submitted by
Sept. 2014 Timeline
10
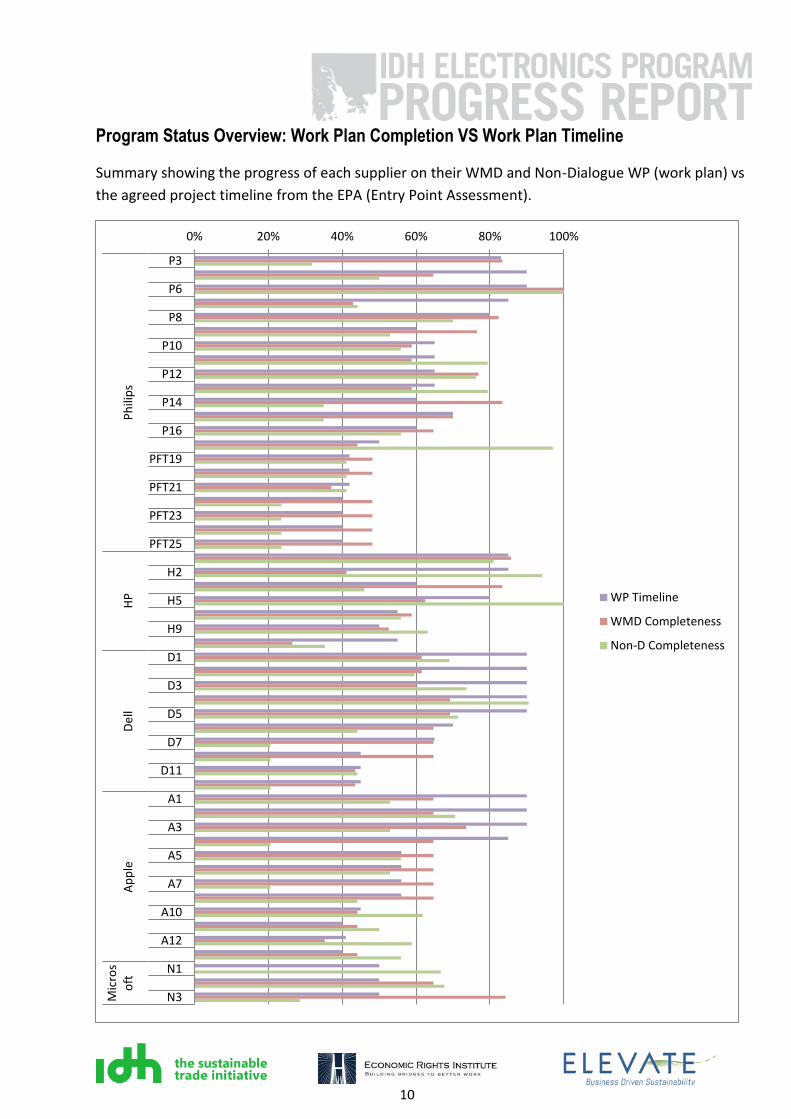
Program Status Overview: Work Plan Completion VS Work Plan Timeline
Summary showing the progress of each supplier on their WMD and Non-Dialogue WP (work plan) vs
the agreed project timeline from the EPA (Entry Point Assessment).
0% 20% 40% 60% 80% 100%
P3
P6
P8
P10
P12
P14
P16
PFT19
PFT21
PFT23
PFT25
H2
H5
H9
D1
D3
D5
D7
D11
A1
A3
A5
A7
A10
A12
N1
N3
Ph
ilip
sH
PD
ell
Ap
ple
Mic
ros
oft
WP Timeline
WMD Completeness
Non-D Completeness
11
Trend Analysis - KPI’s measuring worker and productivity data to indirectly link social
factors with business performance.
Worker Turnover (%) The worker turnover seasonality peak of 17% in August 2014 shows a 19% reduction vs 2013 & 2012. Average turnover rate is <15%.
Rework Rate (%) Program trend is reducing overall, but rework rates were higher in August & September, possibly related to the increased worker turnover above.
12
Average Monthly Net Wages (RMB)
Program trend has increased slowly, which mostly reflects the adjustments of legal minimum wage and seasonality. Average program net wages are now at RMB3,000 per month.
Average Weekly Working Hour (Hours)
Working hours are showing a marginally increasing trend over the course of the program, and increased again during Q3. Average WH’s are now 54hours per week.
13
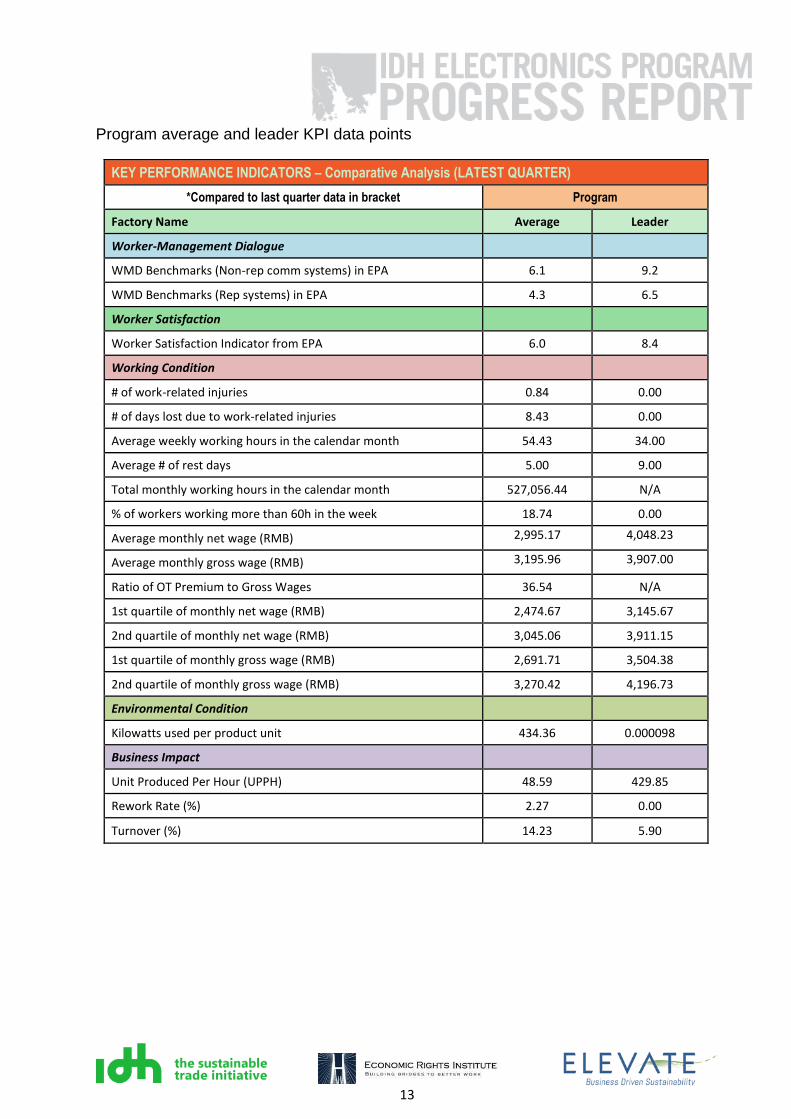
Program average and leader KPI data points
KEY PERFORMANCE INDICATORS – Comparative Analysis (LATEST QUARTER)
*Compared to last quarter data in bracket Program
Factory Name Average Leader
Worker-Management Dialogue
WMD Benchmarks (Non-rep comm systems) in EPA 6.1 9.2
WMD Benchmarks (Rep systems) in EPA 4.3 6.5
Worker Satisfaction
Worker Satisfaction Indicator from EPA 6.0 8.4
Working Condition
# of work-related injuries 0.84 0.00
# of days lost due to work-related injuries 8.43 0.00
Average weekly working hours in the calendar month 54.43 34.00
Average # of rest days 5.00 9.00
Total monthly working hours in the calendar month 527,056.44 N/A
% of workers working more than 60h in the week 18.74 0.00
Average monthly net wage (RMB) 2,995.17 4,048.23
Average monthly gross wage (RMB) 3,195.96 3,907.00
Ratio of OT Premium to Gross Wages 36.54 N/A
1st quartile of monthly net wage (RMB) 2,474.67 3,145.67
2nd quartile of monthly net wage (RMB) 3,045.06 3,911.15
1st quartile of monthly gross wage (RMB) 2,691.71 3,504.38
2nd quartile of monthly gross wage (RMB) 3,270.42 4,196.73
Environmental Condition
Kilowatts used per product unit 434.36 0.000098
Business Impact
Unit Produced Per Hour (UPPH) 48.59 429.85
Rework Rate (%) 2.27 0.00
Turnover (%) 14.23 5.90
14
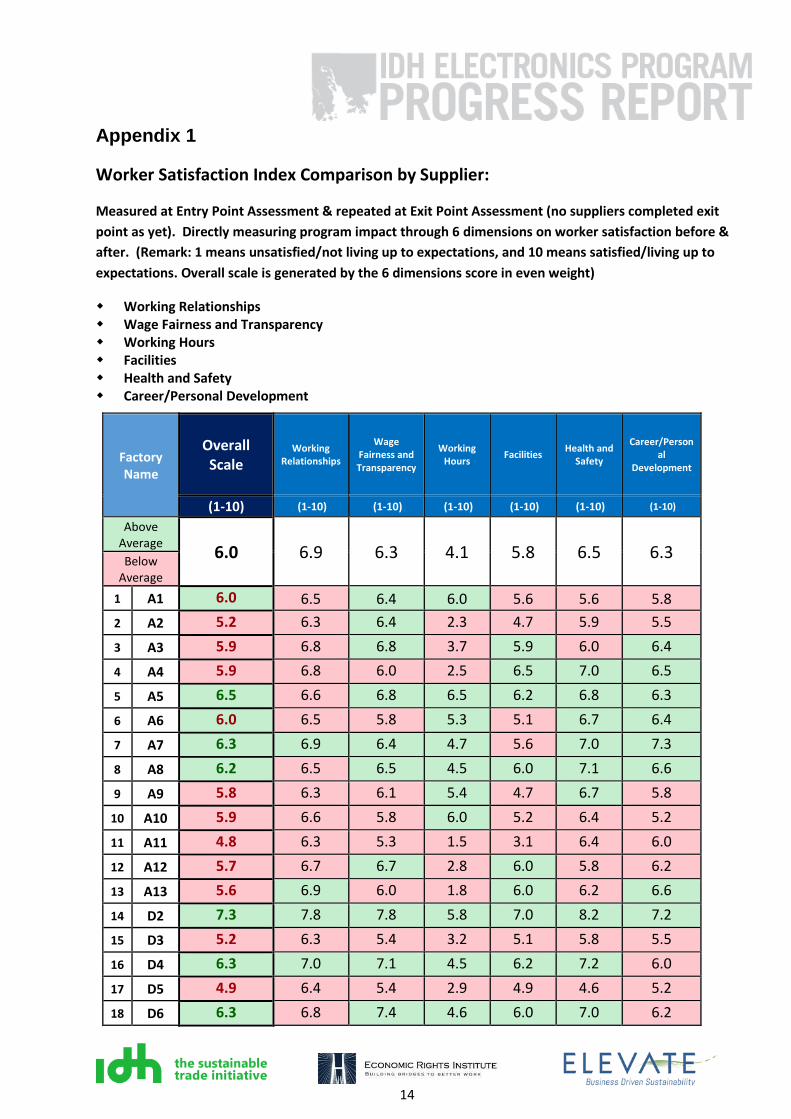
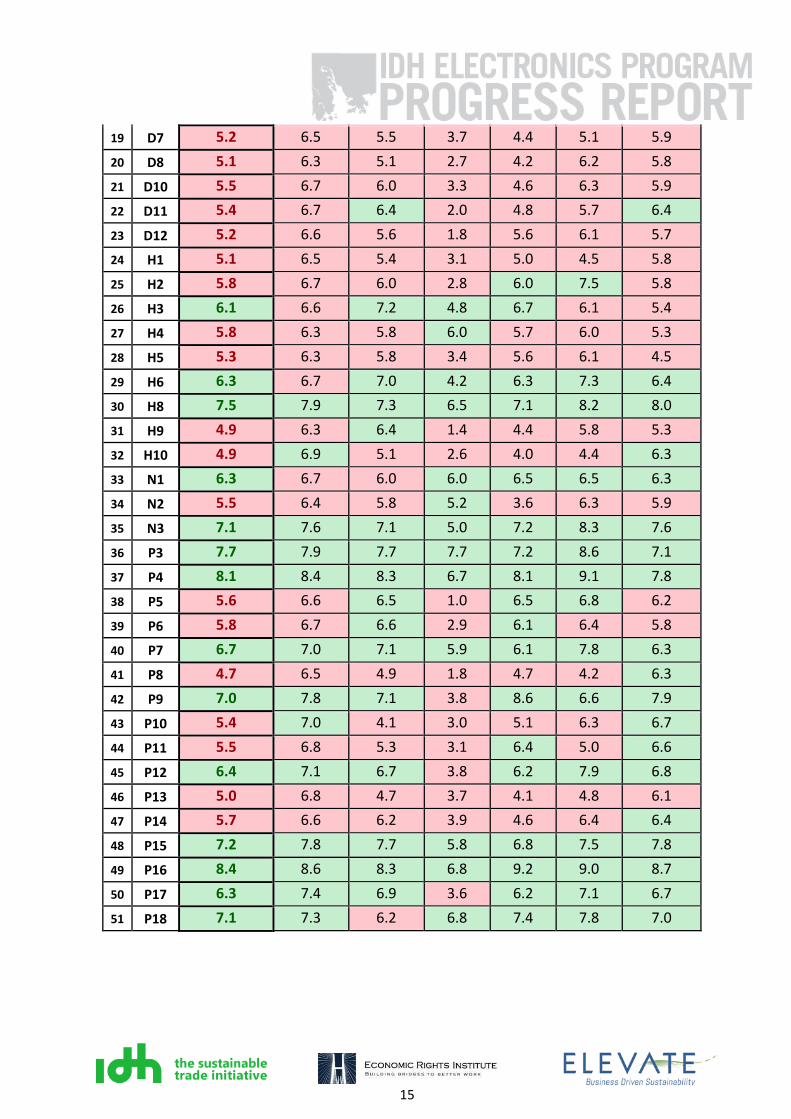
Appendix 1
Worker Satisfaction Index Comparison by Supplier:
Measured at Entry Point Assessment & repeated at Exit Point Assessment (no suppliers completed exit
point as yet). Directly measuring program impact through 6 dimensions on worker satisfaction before &
after. (Remark: 1 means unsatisfied/not living up to expectations, and 10 means satisfied/living up to
expectations. Overall scale is generated by the 6 dimensions score in even weight)
Working Relationships Wage Fairness and Transparency Working Hours Facilities Health and Safety Career/Personal Development
Factory Name
Overall Scale
Working Relationships
Wage Fairness and Transparency
Working Hours
Facilities Health and
Safety
Career/Personal
Development
(1-10) (1-10) (1-10) (1-10) (1-10) (1-10) (1-10)
Above Average
6.0 6.9 6.3 4.1 5.8 6.5 6.3 Below
Average
1 A1 6.0 6.5 6.4 6.0 5.6 5.6 5.8
2 A2 5.2 6.3 6.4 2.3 4.7 5.9 5.5
3 A3 5.9 6.8 6.8 3.7 5.9 6.0 6.4
4 A4 5.9 6.8 6.0 2.5 6.5 7.0 6.5
5 A5 6.5 6.6 6.8 6.5 6.2 6.8 6.3
6 A6 6.0 6.5 5.8 5.3 5.1 6.7 6.4
7 A7 6.3 6.9 6.4 4.7 5.6 7.0 7.3
8 A8 6.2 6.5 6.5 4.5 6.0 7.1 6.6
9 A9 5.8 6.3 6.1 5.4 4.7 6.7 5.8
10 A10 5.9 6.6 5.8 6.0 5.2 6.4 5.2
11 A11 4.8 6.3 5.3 1.5 3.1 6.4 6.0
12 A12 5.7 6.7 6.7 2.8 6.0 5.8 6.2
13 A13 5.6 6.9 6.0 1.8 6.0 6.2 6.6
14 D2 7.3 7.8 7.8 5.8 7.0 8.2 7.2
15 D3 5.2 6.3 5.4 3.2 5.1 5.8 5.5
16 D4 6.3 7.0 7.1 4.5 6.2 7.2 6.0
17 D5 4.9 6.4 5.4 2.9 4.9 4.6 5.2
18 D6 6.3 6.8 7.4 4.6 6.0 7.0 6.2
15
19 D7 5.2 6.5 5.5 3.7 4.4 5.1 5.9
20 D8 5.1 6.3 5.1 2.7 4.2 6.2 5.8
21 D10 5.5 6.7 6.0 3.3 4.6 6.3 5.9
22 D11 5.4 6.7 6.4 2.0 4.8 5.7 6.4
23 D12 5.2 6.6 5.6 1.8 5.6 6.1 5.7
24 H1 5.1 6.5 5.4 3.1 5.0 4.5 5.8
25 H2 5.8 6.7 6.0 2.8 6.0 7.5 5.8
26 H3 6.1 6.6 7.2 4.8 6.7 6.1 5.4
27 H4 5.8 6.3 5.8 6.0 5.7 6.0 5.3
28 H5 5.3 6.3 5.8 3.4 5.6 6.1 4.5
29 H6 6.3 6.7 7.0 4.2 6.3 7.3 6.4
30 H8 7.5 7.9 7.3 6.5 7.1 8.2 8.0
31 H9 4.9 6.3 6.4 1.4 4.4 5.8 5.3
32 H10 4.9 6.9 5.1 2.6 4.0 4.4 6.3
33 N1 6.3 6.7 6.0 6.0 6.5 6.5 6.3
34 N2 5.5 6.4 5.8 5.2 3.6 6.3 5.9
35 N3 7.1 7.6 7.1 5.0 7.2 8.3 7.6
36 P3 7.7 7.9 7.7 7.7 7.2 8.6 7.1
37 P4 8.1 8.4 8.3 6.7 8.1 9.1 7.8
38 P5 5.6 6.6 6.5 1.0 6.5 6.8 6.2
39 P6 5.8 6.7 6.6 2.9 6.1 6.4 5.8
40 P7 6.7 7.0 7.1 5.9 6.1 7.8 6.3
41 P8 4.7 6.5 4.9 1.8 4.7 4.2 6.3
42 P9 7.0 7.8 7.1 3.8 8.6 6.6 7.9
43 P10 5.4 7.0 4.1 3.0 5.1 6.3 6.7
44 P11 5.5 6.8 5.3 3.1 6.4 5.0 6.6
45 P12 6.4 7.1 6.7 3.8 6.2 7.9 6.8
46 P13 5.0 6.8 4.7 3.7 4.1 4.8 6.1
47 P14 5.7 6.6 6.2 3.9 4.6 6.4 6.4
48 P15 7.2 7.8 7.7 5.8 6.8 7.5 7.8
49 P16 8.4 8.6 8.3 6.8 9.2 9.0 8.7
50 P17 6.3 7.4 6.9 3.6 6.2 7.1 6.7
51 P18 7.1 7.3 6.2 6.8 7.4 7.8 7.0
16
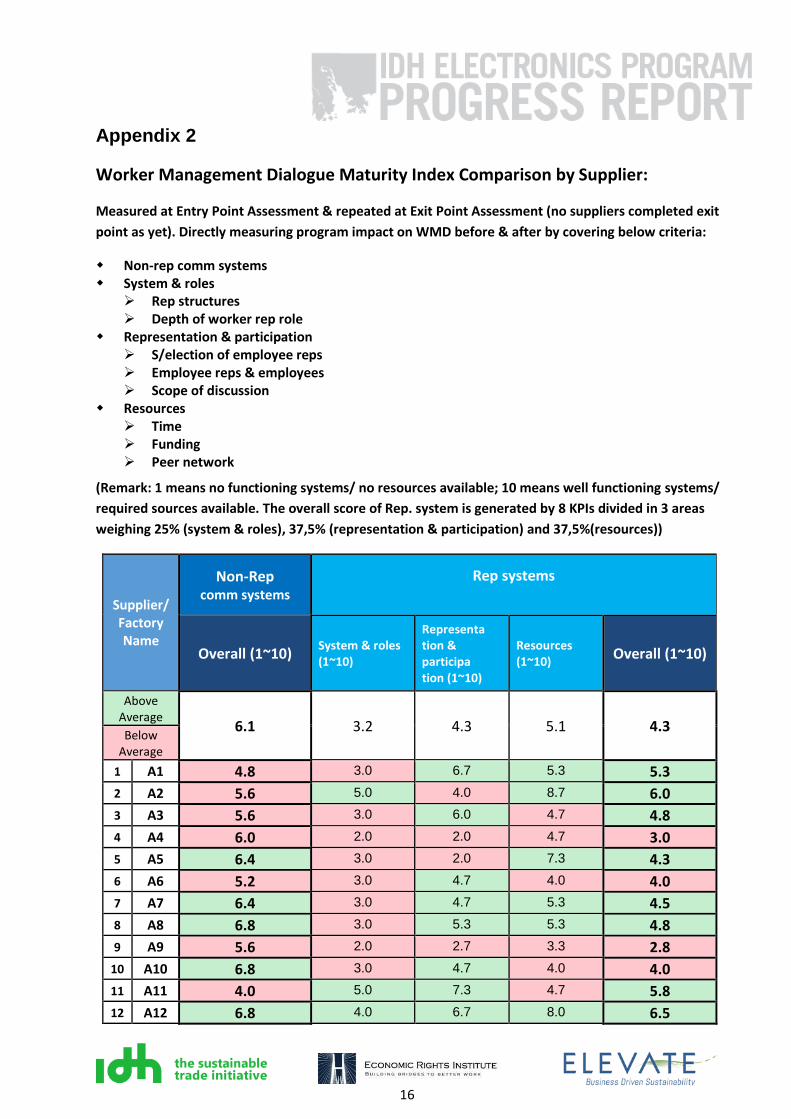
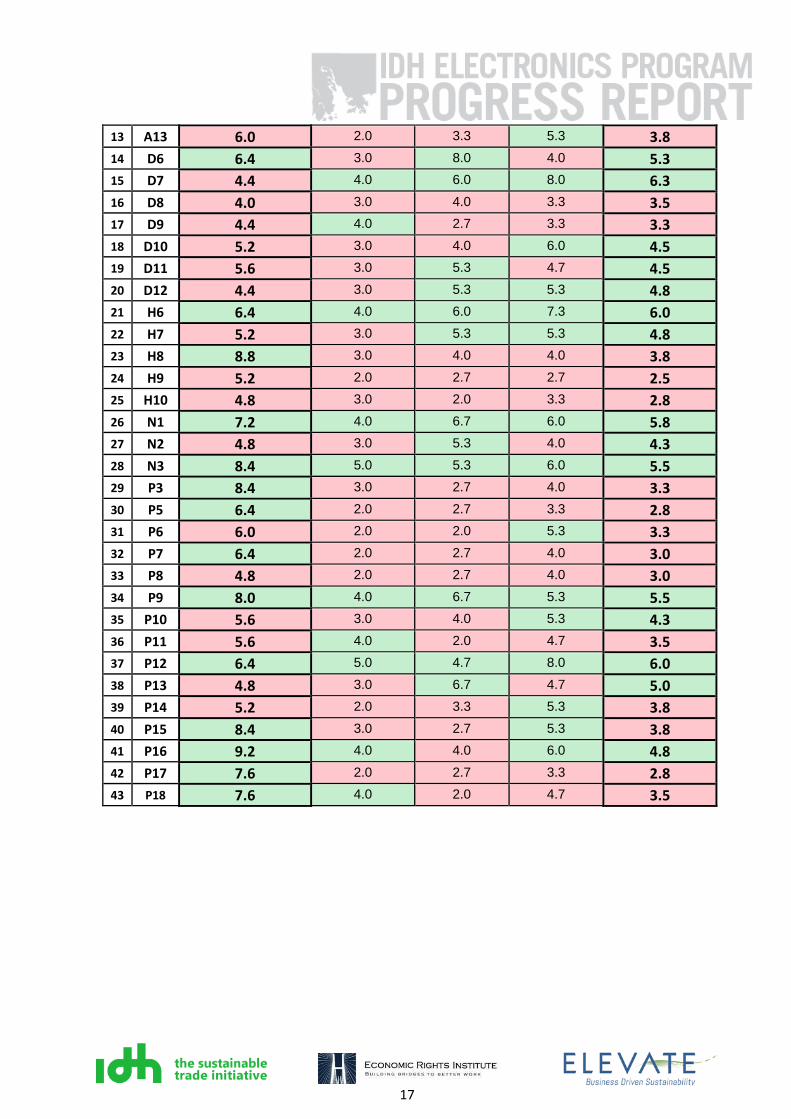
Appendix 2
Worker Management Dialogue Maturity Index Comparison by Supplier:
Measured at Entry Point Assessment & repeated at Exit Point Assessment (no suppliers completed exit
point as yet). Directly measuring program impact on WMD before & after by covering below criteria:
Non-rep comm systems System & roles
Rep structures Depth of worker rep role
Representation & participation S/election of employee reps Employee reps & employees Scope of discussion
Resources Time Funding Peer network
(Remark: 1 means no functioning systems/ no resources available; 10 means well functioning systems/
required sources available. The overall score of Rep. system is generated by 8 KPIs divided in 3 areas
weighing 25% (system & roles), 37,5% (representation & participation) and 37,5%(resources))
Supplier/Factory Name
Non-Rep comm systems
Rep systems
Overall (1~10) System & roles (1~10)
Representa tion & participa tion (1~10)
Resources (1~10)
Overall (1~10)
Above Average
6.1 3.2 4.3 5.1 4.3 Below
Average
1 A1 4.8 3.0 6.7 5.3 5.3
2 A2 5.6 5.0 4.0 8.7 6.0
3 A3 5.6 3.0 6.0 4.7 4.8
4 A4 6.0 2.0 2.0 4.7 3.0
5 A5 6.4 3.0 2.0 7.3 4.3
6 A6 5.2 3.0 4.7 4.0 4.0
7 A7 6.4 3.0 4.7 5.3 4.5
8 A8 6.8 3.0 5.3 5.3 4.8
9 A9 5.6 2.0 2.7 3.3 2.8
10 A10 6.8 3.0 4.7 4.0 4.0
11 A11 4.0 5.0 7.3 4.7 5.8
12 A12 6.8 4.0 6.7 8.0 6.5
17
13 A13 6.0 2.0 3.3 5.3 3.8
14 D6 6.4 3.0 8.0 4.0 5.3
15 D7 4.4 4.0 6.0 8.0 6.3
16 D8 4.0 3.0 4.0 3.3 3.5
17 D9 4.4 4.0 2.7 3.3 3.3
18 D10 5.2 3.0 4.0 6.0 4.5
19 D11 5.6 3.0 5.3 4.7 4.5
20 D12 4.4 3.0 5.3 5.3 4.8
21 H6 6.4 4.0 6.0 7.3 6.0
22 H7 5.2 3.0 5.3 5.3 4.8
23 H8 8.8 3.0 4.0 4.0 3.8
24 H9 5.2 2.0 2.7 2.7 2.5
25 H10 4.8 3.0 2.0 3.3 2.8
26 N1 7.2 4.0 6.7 6.0 5.8
27 N2 4.8 3.0 5.3 4.0 4.3
28 N3 8.4 5.0 5.3 6.0 5.5
29 P3 8.4 3.0 2.7 4.0 3.3
30 P5 6.4 2.0 2.7 3.3 2.8
31 P6 6.0 2.0 2.0 5.3 3.3
32 P7 6.4 2.0 2.7 4.0 3.0
33 P8 4.8 2.0 2.7 4.0 3.0
34 P9 8.0 4.0 6.7 5.3 5.5
35 P10 5.6 3.0 4.0 5.3 4.3
36 P11 5.6 4.0 2.0 4.7 3.5
37 P12 6.4 5.0 4.7 8.0 6.0
38 P13 4.8 3.0 6.7 4.7 5.0
39 P14 5.2 2.0 3.3 5.3 3.8
40 P15 8.4 3.0 2.7 5.3 3.8
41 P16 9.2 4.0 4.0 6.0 4.8
42 P17 7.6 2.0 2.7 3.3 2.8
43 P18 7.6 4.0 2.0 4.7 3.5