idirect marketstrategy 2018 - content.icicidirect.comcompany idirect code cmp (|)target price...
TRANSCRIPT

2018Market Strategy

1
Deal Team – At Your ServiceMarket Strategy 2018
Agrarian focused consumption push to alleviate rural stress
2
Capex revival to be key theme in 2018
3
Amid limited domestic challenge, risks to originate outside
4
Sectoral Outlook
5
Fiscal policy: Limited space for big bang reform
6
Monetary space: Limited respite on rate cuts ahead
7
Consumption, GFCE to drive GDP growth
8
Market Outlook – 2018 to be the year of Stabilisation1
Top Picks for Strategy 20189

Market OutlookEarnings to break shackles post four years of flattish trend?In sync with the flip flop in commodity prices, unexpected one offs likedemonetisation, GST, weak capex cycle, base of earnings remained flat in the range of| 1365‐1403 in FY14‐17. However, normalisation in commodity prices, a gradualadjustment to the GST regime, increased thrust of government in reviving capex cycleand peak NPA provisioning behind us, we feel that earnings will break the shackles ofone offs and stage a robust comeback at 17.4% CAGR in FY17‐20E.Our confidence on a durable recovery in earnings stems from the fact that assetturnover ratio of India Inc. marked their bottom in FY16 at 1x while same improvedmarginally to 1.1x in FY17. A smart recovery in the earnings profile of companies inQ2FY18 and ensuing management commentary indicates a robust H2FY18. Thiscoupled with stable margins (rising utilisation level will cushion rising input costs) areexpected to lead to a recovery in RoCE of Corporate India. We expect RoCE of Sensexcompanies (ex‐financials) to improve 220 bps by FY20E to 24.4%, which will help thebroader markets to trade at a premium vis‐à‐vis its historical premium multiples.Sectorally, in terms of earnings growth, the recovery baton will be taken by thebanking space (33% CAGR) with the share of incremental index earnings at ~58%Growth in earnings to drive Sensex as most multiple expansion behind usOur prognosis for CY18 suggest that the Sensex P/E expansion has been driven byfalling yields, which is behind us as the interest rate improvement cycle has playedout. Going ahead, the key driving force for the market would be earnings recovery,which would be backed by a rise in asset turn thereby improving the RoCE profile.Based on bottom up approach by using a sum of the parts (SoTP) evaluation ofindividual index constituents, we assign a fair value for Sensex at 37,600 withconsequent target for Nifty at 11,725 offering 12% upside from current levels.
CY17 was a remarkable year for equities as liquidity across the globe ensured that itwas the most favoured asset class. Back home in India, the story was no different asSensex delivered a handsome 29% return, aided further by the falling yields whichled to decline in cost of capital and consequent expansion of P/E multiples. Amid allthese, the year was also marked by one‐offs such as Demonetisation andimplementation of GST, which temporarily led to a down tick in corporate earningsand GDP growth.CY18 will be the year of Stabilisation as we believe that various steps taken by thegovernment may start bearing fruit, going ahead. Key theme, which is expected toplay out is an uptick in capacity utilisation across sectors. This, in turn, will call foran uptick in capex cycle. Also, with course corrections in private sector balancesheet, mending of banking sector and robust government policies in place, privatesector investments may start revving up in CY18. All this, in our view, will lead to aresurrection of GDP growth. Hence, we believe sectors like corporate banks, capitalgoods, infrastructure are likely to witness robust business activity in CY18.Government to lead capex, its policies to break private investment jinx…Based on our bottom up approach, infrastructure investment may jump up to ~| 48lakh crore led by housing, roads and railways in the next five years, which implies10% CAGR in infrastructure spending in the next five years. Hence, we expectinfrastructure spending as percentage of GDP to inch up to 6.0% in the next five yearsvs. 5.6% in the previous five years. In our view, increased infrastructure spending mayinch up GDP growth rate by 80 to 100 bps. Government’s “Housing for All by 2022”scheme (total opportunity of ~| 20 lakh crore) is expected to be a key catalyst in theeconomic recovery. Furthermore, an improvement in policy reform makes thebusiness environment conducive for private investment in infrastructure.…which will provide impetus to GFCF & trigger GDP normalisationGoing ahead, private sector capex (~38% of GFCF) will play a more important role inrecovery of GFCF growth, mainly on account of the full blown effect of affordablehousing initiatives. Hence, with above recovery setting in coupled with stable growthin private consumption, we expect nominal GDP growth to bounce from 9.9% inFY18E to 11.8% in FY19E.Rural focus ahead of elections…In the wake of a mere one and half years being left for general elections, thegovernment’s thrust will be on increasing farmer’s income considerably next year byway of supporting better crop realisation. Initiatives like eNam and setting up of megafood parks is likely to reduce the disintermediation cost by 25‐30%, which could wellbe the single most important factor in increasing farmer’s income immediately.
2
Economic Endurance to reinforce steady returns
Company Idirect Code CMP (|) Target Price (|) Upside (%)Bajaj Electricals BAJELE 489 575 18Greenply Industries GREIN 355 425 20Gujarat Gas GUJGA 843 1000 19Kalpataru Power KALPOW 471 600 27KSB Pumps KSBPUM 867 1080 25Narayana Hrudayalaya NARHRU 298 360 21Simplex Infrastructure SIMINF 575 750 31South Indian Bank SOUBAN 31 40 27
Stock Picks for 2018

128359
113136
97054
17808 20568
45450
0
20000
40000
60000
80000
100000
120000
140000
2012
2013
2014
2015
2016
2017
(| C
rore
)
33
Deal Team – At Your ServiceTINA factor locally, globally to continue amid shrinking investible bond pool
0
1
2
3
4
‐1‐0 0‐1
1‐2
2‐3
3‐4
4‐5
5‐6
6‐7
7‐8 >8
In US $ trillion
Yield %
2007 : US $ 15.8 tln yielding >4%
Corporate QuasiSecuritized Soverign
0
1
2
3
4
‐1‐0 0‐1
1‐2
2‐3
3‐4
4‐5
5‐6
6‐7
7‐8 >8
In US $ trillion
Yield %
2017 : US $ 1.8 tln yielding >4% Corporate QuasiSecuritized Soverign
Bond market returns continue to get sub optimal: bonds yielding more than 4% shrink by 90% since 2007
In hunt for yield, equities still more attractive vs. bonds: US equities have 210 bps better yields
Earnings yields more attractive for EMs vs. DM: This is likely to keep EM equites sheen intact
The overarching theme for equity remains “There is no alternative” (TINA) better than equities. In the yield starved world, the case for equities isgetting more compelling as earnings yields for equites continue to remain attractive compared to bond yields. A similar trend of higher earnings yieldalso remains for EMs. Indian equities may gain on the back of this trend as FIIs have been on the sidelines in the last couple of years.
EM’s attractiveness may push FIIs to reconsider India as inflows in 2017 still 40% lower than their five year average
Trailing five year average : | 75400 cr
Source:: Bloomberg, ICICIdirect.com Research
0
2
4
6
8
0
2
4
6
8
10
Mar/09
Sep/09
Mar/10
Sep/10
Mar/11
Sep/11
Mar/12
Sep/12
Mar/13
Sep/13
Mar/14
Sep/14
Mar/15
Sep/15
Mar/16
Sep/16
Mar/17
Sep/17 Earnings Yield ‐1
0‐Year Yield
Yeild
in %
Earnings Yield ‐ 10‐Year YieldS&P 500 Index Earnings Yield (RHS)US Generic Govt 10‐Year Yield
0.0%
0.5%
1.0%
1.5%
2.0%
2.5%
3.0%
3.5%
0.0%
2.0%
4.0%
6.0%
8.0%
10.0%
12.0%
Sep/09
Mar/10
Sep/10
Mar/11
Sep/11
Mar/12
Sep/12
Mar/13
Sep/13
Mar/14
Sep/14
Mar/15
Sep/15
Mar/16
Sep/16
Mar/17
Sep/17 Ea
rnings Yield Sprea
d (EM ‐DM )
Earnings Yeild in %
Spread (RHS) EM Yield DM Yield
Quaterly Fed ECB BoJ Total LiquidityQ1CY18 ‐60 105 180 225Q2CY18 ‐90 105 180 195Q3CY18 ‐120 105 180 165Q4CY18 ‐150 0 180 30Q1CY19 ‐150 0 180 30Q2CY19 ‐150 0 180 30Q3CY19 ‐150 0 180 30
In US $ billion
4
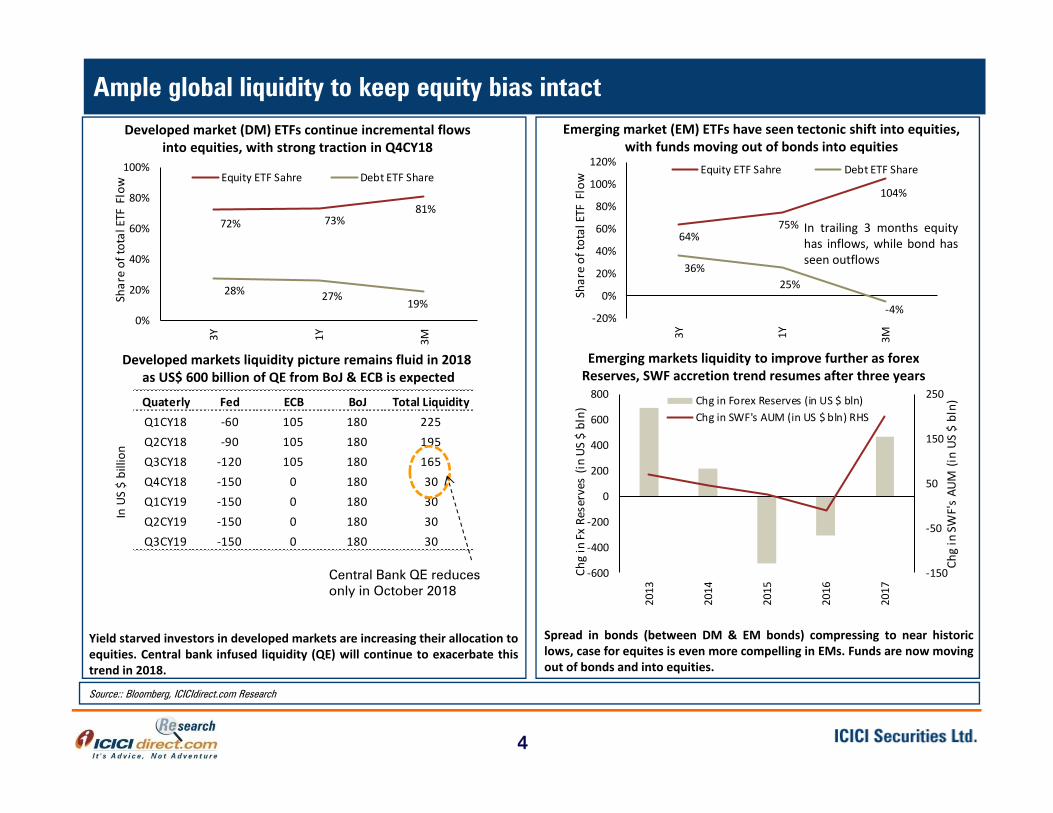
Deal Team – At Your ServiceAmple global liquidity to keep equity bias intactDeveloped market (DM) ETFs continue incremental flows
into equities, with strong traction in Q4CY18Emerging market (EM) ETFs have seen tectonic shift into equities,
with funds moving out of bonds into equities
Yield starved investors in developed markets are increasing their allocation toequities. Central bank infused liquidity (QE) will continue to exacerbate thistrend in 2018.
Developed markets liquidity picture remains fluid in 2018 as US$ 600 billion of QE from BoJ & ECB is expected
Emerging markets liquidity to improve further as forex Reserves, SWF accretion trend resumes after three years
Central Bank QE reduces only in October 2018
Spread in bonds (between DM & EM bonds) compressing to near historiclows, case for equites is even more compelling in EMs. Funds are now movingout of bonds and into equities.
Source:: Bloomberg, ICICIdirect.com Research
72% 73%81%
28% 27%19%
0%
20%
40%
60%
80%
100%
3Y 1Y 3M
Share of to
tal ETF Flow Equity ETF Sahre Debt ETF Share
64%75%
104%
36%25%
‐4%‐20%
0%
20%
40%
60%
80%
100%
120%
3Y 1Y 3M
Share of to
tal ETF Flow
Equity ETF Sahre Debt ETF Share
‐150
‐50
50
150
250
‐600
‐400
‐200
0
200
400
600
800
2013
2014
2015
2016
2017
Chg in SW
F's AU
M (in US
$ bln)
Chg in Fx
Reserves (in
US $ bln)
Chg in Forex Reserves (in US $ bln)Chg in SWF's AUM (in US $ bln) RHS
In trailing 3 months equityhas inflows, while bond hasseen outflows

‐10%‐5%0%5%
10%15%20%25%30%35%
US
German
y
Japa
n
Brazil
S.Ko
rea
Russia
South Afric
a
Malaysia
Indo
nesia
India
% Return
2017 3 Year Average
0
5
10
15
20
25
30
35
40
Jan‐07
Jun‐07
Nov
‐07
Apr‐0
8Se
p‐08
Feb‐09
Jul‐0
9De
c‐09
May
‐10
Oct‐10
Mar‐11
Aug‐11
Jan‐12
Jun‐12
Nov
‐12
Apr‐1
3Se
p‐13
Feb‐14
Jul‐1
4De
c‐14
May
‐15
Oct‐15
Mar‐16
Aug‐16
Jan‐17
Jun‐17
Nov
‐17
Trailin
g P/E
5
10
15
20
25
30
35
40
45
Jan‐07
Jun‐07
Nov
‐07
Apr‐0
8Se
p‐08
Feb‐09
Jul‐0
9De
c‐09
May
‐10
Oct‐10
Mar‐11
Aug‐11
Jan‐12
Jun‐12
Nov
‐12
Apr‐1
3Se
p‐13
Feb‐14
Jul‐1
4De
c‐14
May
‐15
Oct‐15
Mar‐16
Aug‐16
Jan‐17
Jun‐17
Nov
‐17
Trailin
g P/E
5
India not alone, P/E based valuation picture globally above long term average…
Source: Bloomberg, ICICIdirect.com Research
Developed market : Trail P/E based valuation, higher for US
Emerging Market: India, tracking EMs trend of trading at higher than their average
Germany : Current 19.2, Avg 18.1
US : Current 22.4, Avg 17.4
France : Current 18.4, Avg 17.6
S.Africa : Current 18.8, Avg 18.3 Russia : Current 8.5, Avg 8.1
Indonesia : Current 22.4, Avg 21 India : Current 23.4 Avg 18.44
Global Equity returns in 2017 were the best in recent memory
2017 average return of 16% is almost 1.75x of trailing 3 year average returns

6
Deal Team – At Your ServiceYields led P/E re-rating largely done; earnings recovery to be key driver now
Source: Bloomberg, ICICIdirect.com Research
• We highlight that Sensex P/E expansion has been driven by falling yields. The relationship between the P/E ratio and 10 year G‐sec yield isinverse. The key reason for the same is that falling yields lead to lower cost of capital. Hence, this drives the valuation multiple (i.e. high P/Eratio) for the market. We pointed out the above thesis in our last strategy report (find here).
• We expect inflation levels in 2018 at ~4.5%. Adding to it a normalised real interest rate of ~175 bps and further 75‐100 bps markup for 10year G‐sec, we expect the 10 year G‐sec yield to hover close to 7‐7.25% (similar to current levels). Therefore, we believe much of the yieldbased re‐rating is largely done.
• However, going ahead, the key driving force for the market would be earnings recovery (earnings CAGR of ~17.4% in FY17‐20), which willlargely be the function of improving capacity utilisation at corporate level (currently at five year low).
10
13
16
19
22
25
6
7
8
9
10
Sep‐13
Dec‐13
Mar‐14
Jun‐14
Sep‐14
Dec‐14
Mar‐15
Jun‐15
Sep‐15
Dec‐15
Mar‐16
Jun‐16
Sep‐16
Dec‐16
Mar‐17
Jun‐17
Sep‐17
Dec‐17
(x)
(%)
10 Year yield Trailing P/E ratio (RHS)
Earnings growth YoY (%) Avg Trailing P/E (%) Avg 10 yr yield (%)
FY15 ‐0.4 18.9 8.3
FY16 1.2 20.4 7.7
FY17 2.0 19.9 7.5
FY18YTD ‐1.6 22.4 6.7
FY17‐20E 17.4 ~7‐7.25
Sensex companies ex‐ BFSI
22.7 22.0
24.322.5 21.9
15.0
20.0
25.0
FY03 FY04 FY05 FY06 FY07
(%)
EBITDA Margin
Sensex companies ex‐ BFSI
19.220.9
28.625.6 26.8
15.0
20.0
25.0
30.0
FY03 FY04 FY05 FY06 FY07
(%)
ROCE
7
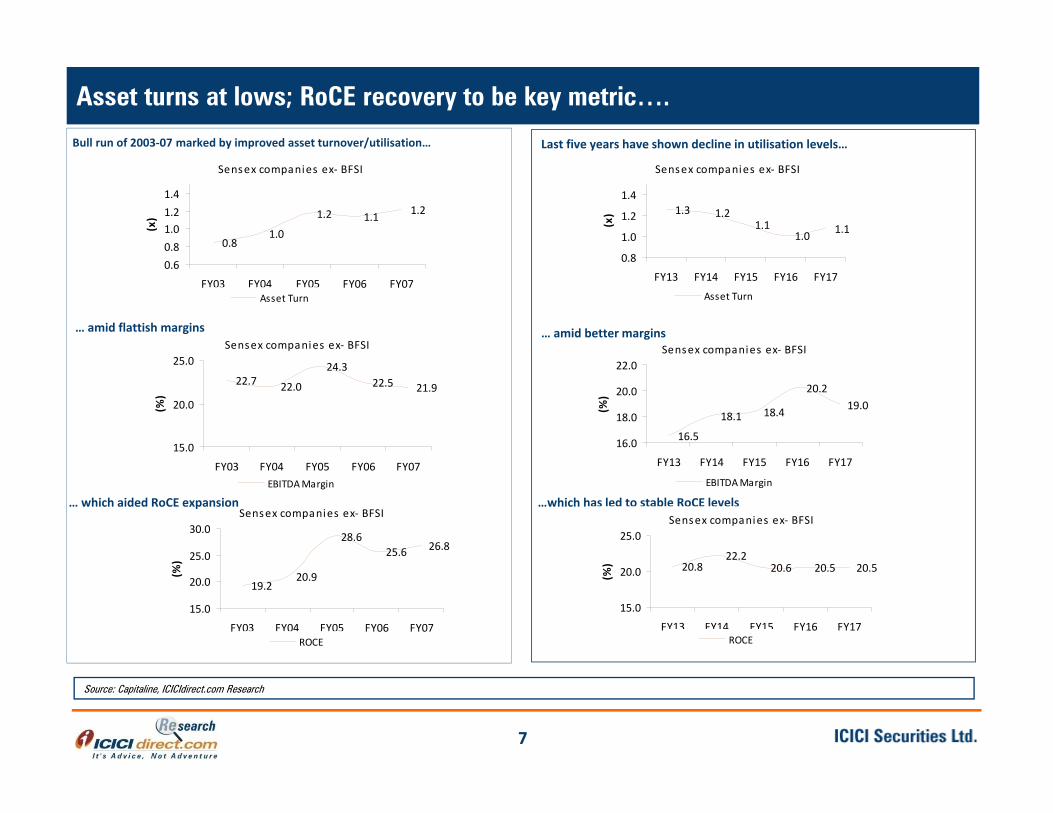
Asset turns at lows; RoCE recovery to be key metric….
Source: Capitaline, ICICIdirect.com Research
Bull run of 2003‐07 marked by improved asset turnover/utilisation…
… which aided RoCE expansion
Last five years have shown decline in utilisation levels…
…which has led to stable RoCE levels
Sensex companies ex‐ BFSI
0.81.0
1.2 1.1 1.2
0.60.81.01.21.4
FY03 FY04 FY05 FY06 FY07
(x)
Asset Turn
… amid flattish margins
Sensex companies ex‐ BFSI
1.3 1.21.1
1.0 1.1
0.8
1.0
1.2
1.4
FY13 FY14 FY15 FY16 FY17
(x)
Asset Turn
Sensex companies ex‐ BFSI
16.5
18.1 18.4
20.219.0
16.0
18.0
20.0
22.0
FY13 FY14 FY15 FY16 FY17
(%)
EBITDA Margin
… amid better margins
Sensex companies ex‐ BFSI
20.822.2
20.6 20.5 20.5
15.0
20.0
25.0
FY13 FY14 FY15 FY16 FY17
(%)
ROCE

3.1 3.1
3.2
3.3
3.0
3.1
3.2
3.3
FY17 FY18E FY19E FY20E
%
Sensex financials core RoAs
22.5
23.6
24.2
24.7
21
22
22
23
23
24
24
25
25
FY17 FY18E FY19E FY20E
%
Sensex RoCE (Ex‐financials)
Sensex RoCE to expand as utilisation levels of India Inc improve
8
• Ex‐financials, Sensex RoCE is expected to expand 220 bps in FY17‐20E to 24.7% by FY20E vs. 22.5% in FY17, leading to earningsCAGR of ~11% over FY17‐20E
• Improvement is envisaged on account of higher sweating of assets and consequent better asset turnovers coupled withoperational leverage benefits in terms of improved EBITDA margin profile
• For financials; core RoAs are expected to improve gradually to 3.3% in FY20E vs. 3.1% in FY17 primarily tracking a revival of creditgrowth. Consequently, BFSI is expected to report a robust ~33% earnings CAGR over FY17‐20E.

338 393 466 506377
168199
222 228241
225236
211 20825679
6955 47
61153200 98
17914538
10279
2153164
165 228 204 2681,165
1,365 1,359 1,375 1,403
‐100
100
300
500
700
900
1,100
1,300
1,500
FY13 FY14 FY15 FY16 FY17
(|)
Banking and NBFC IT Oil and Gas Capital Goods Auto Metals and Mining Others*
Sensex before new stocks addition
Others14%
Auto11%
Capital Goods5%
FMCG10%
Oil and Gas12%
IT12%
Banking and NBFC
37%
Sensex earnings: Sector specific headwinds impacted growth over FY14-17
9
In December 2017, banking stocks replaced two of thepharma stocks in the Index. Consequently, banking sectorweightage in the index increased to ~40% vs. ~37%previously)
Consequently, BFSI is expected to anchor indexperformance
Sensex post stocks additionsOthers 12%
IT11%
Oil and Gas12%
FMCG9%
Capital Goods4%
Auto11%
Banking and NBFC
40%
Earnings during FY14‐17 was largely flat primarily on the back ofthe global meltdown in commodity prices, delay in executionpick‐up in the domestic infrastructure space which led to higherNPAs of Banks and Consequently, higher provisioning leading todecline in their profitability.
New stocks addition to Sensex
338 393 466 506 377540
717883168 199
222 228241
225243
268
225236
211 208256
261
289
323
7969 55 47 61
61
70
83
153200 98 179 145
183
251
282
38102 79
21 5357
72
84
164
165 228 204 268233
271
346
1,165
1,365 1,359 1,375 1,4031,560
1,913
2,269
0
400
800
1,200
1,600
2,000
2,400
FY13 FY14 FY15 FY16 FY17 FY18E FY19E FY20E
(|)
Banking and NBFC IT Oil and Gas Capital Goods Auto Metals and Mining Others*
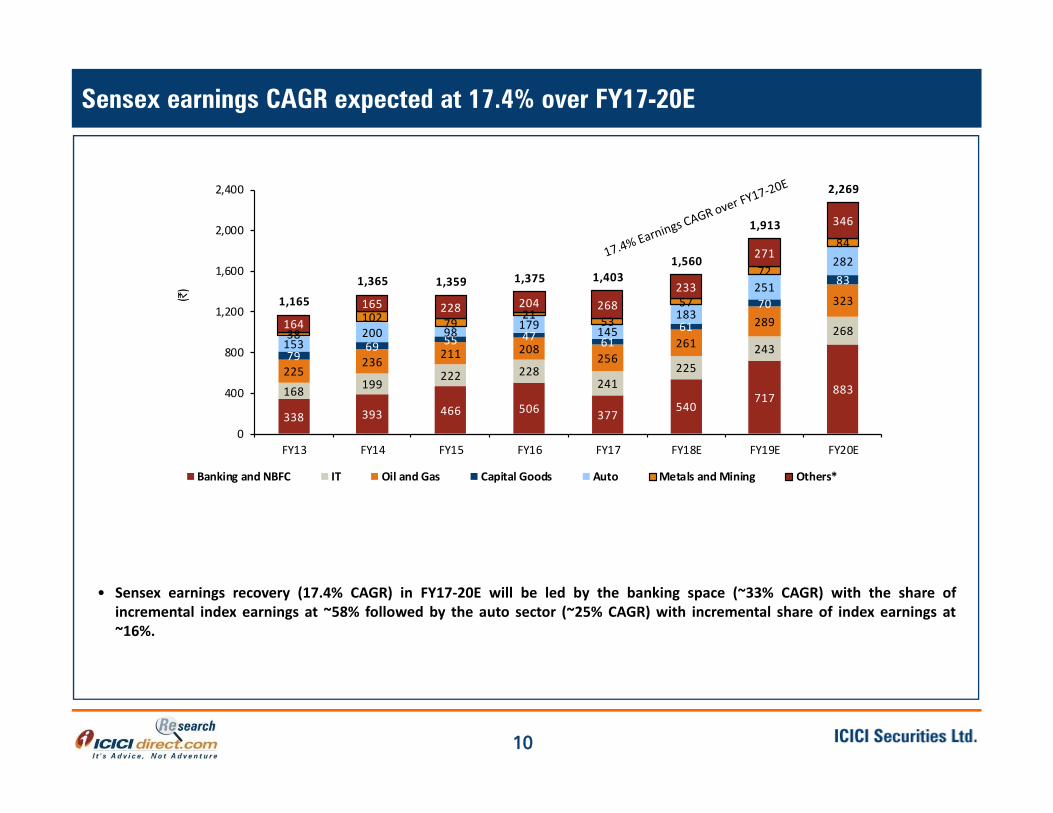
Sensex earnings CAGR expected at 17.4% over FY17-20E
10
• Sensex earnings recovery (17.4% CAGR) in FY17‐20E will be led by the banking space (~33% CAGR) with the share ofincremental index earnings at ~58% followed by the auto sector (~25% CAGR) with incremental share of index earnings at~16%.

Measuring Nifty fair value: SoTP methodology intersects P/E valuation at 11,725
11
• We have tried to evolve 2018 Index target based on bottoms up approach by using a sum of the parts (SoTP) evaluation ofindividual index constituents
• The rationale of such methodology stems from the fact that over the period of time, companies, within the index, with presencein various verticals/businesses have witnessed value unlocking and in such case the concept of SoTP captures the value in a betterway than purely P/E based valuations (especially for businesses where earnings are yet to mature). Moreover, we also note thatsuperior businesses, exhibiting consistent RoCEs, within the index now command higher valuations, while certain businesseswithin the index continue to trade at/below average index multiple .
• Therefore, given the above mentioned limitations of using a P/E purely on overall earnings of index, we have used the sum of theparts (SOTP) technique thereby using our research based target market capitalisation to index constituents and furthermore,taking the average based on the respective free float weightage in the index, to come to targeted index market capitalisation. Theresultant exercise has given us the fair value of Sensex at 37,600 with consequent target for Nifty at 11,725 offering a healthy12% upside from current levels.
• It should be noted that our Sensex target implies target P/E of ~18x on average of FY19 and FY20 earnings(i.e. 1x PEG), which ison the higher end of historical average P/E of ~16‐17x commanded by the market. However, we highlight that improving RoCE isa better metric than PE dissonance during an economic upturn.
FY15 FY16 FY17 FY18E FY19E FY20ESensex EPS 1359 1375 1403 1560 1913 2269Growth (%) ‐0.4% 1.2% 2.0% 11.2% 22.7% 18.6%Earnings CAGR over FY17‐20E 17.4xTarget Multiple (~1.0x PEG) 18.0xSensex Target (using avg FY19‐20E EPS) 37600Corresponding Nifty Target 11725
12.4%
Sensex & Nifty Target
Potential Upside

12
Deal Team – At Your ServiceMarket Strategy 2018
Agrarian focused consumption push to alleviate rural stress
2
Capex revival to be key theme in 2018
3
Amid limited domestic challenge, risks to originate outside
4
Sectoral Outlook
5
Fiscal Policy: Limited space for big bang reform
6
Monetary space: Limited respite on rate cuts ahead
7
Consumption, GFCE to drive GDP growth
8
Market Outlook – 2018 to be the year of Stabilisation1
Top Picks for Strategy 20189

13
GST collections yet to stabilise
Source: Finance Ministry, RBI Handbook of Statistics 2016-17, CBDT, ICICIdirect.com research
GST collections thus far are below our estimate, and we suspect below the revenue neutral rate required. Lower than expected GST collections (and thus, lowerindirect taxes) would be an overhang on fiscal deficit financing. In absence of official estimates for the targeted collections, we arrived at a revenue neutral figureof GST collections by working backwards from combined FY17 indirect tax revenues of the Central and State governments. GST collections would need to matchcomparable indirect tax revenues to ensure zero revenue loss under the new system. According to our estimate, FY17 revenues from indirect tax on items whereGST is now applicable (i.e. excluding petroleum, alcohol and real estate) works out to ~₹ 11.9 lakh crore, or ~ ₹1 lakh crore per month. Post GST implementation inJuly, monthly collection thereof has averaged ~₹ 88000 crore. If collections continue on this path, there would be a shortfall of ~₹ 60000 crore in indirect taxcollections, assuming 8% YoY growth in duties on petroleum and 9% YoY growth in stamp duty collection.However complete clarity is yet to emerge on the implication of initial GST collection from official sources. A possible encouraging aspect to future collections isthe implementation of interstate e‐way bill system on goods valued above ₹ 50000 with effect from February 1, 2018. E‐way bill implementation in states underthe previous system (pre‐GST) had helped boost tax revenues by 15‐20%. E‐way bills on intrastate goods movement will be rolled out from June 1, 2018.Additionally, the impact of composition scheme taxpayers required to file returns on a quarterly basis is yet to accrue.
2.6 2.9 3.7 4.6 5.0
8.6 9.3 11.7 11.9 10.8
1.1 1.2
0.02.04.06.08.0
10.012.014.016.018.020.0
FY14 FY15 FY16 FY17 Hypothetical fullyear post GST
(|lakh
crore)
Duties on petroleum products Combined Indirect Tax collections Stamp duties and registration
Income tax collections boosted
Demonetisation‐impacted H2FY17 saw a rise of 16% in direct tax collections YoY. In comparison, H1FY17 (six months before demonetisation) had recorded a 9%YoY growth over the comparable period. Apart from crackdown on black money, voluntary income declaration schemes, increase in surcharges for higher incomeslabs (above |50 lakh and |1 crore) and fear of action from authorities seem to have provided a boost to collections. In terms of personal income tax collections,the government managed to rake in ~ |3.5 lakh crore from individual tax payers in FY17, a rise of 21% YoY from FY16 collection of ~ |2.9 lakh crore. The totalnumber of tax returns filed by individual assesses during FY17 was 5.43 crore, up 17.3% YoY. 1.26 crore new taxpayers (i.e. return filers and non filers making taxpayments) were added to the tax base. Additionally, FY18 (as of August 5th) has recorded 41.79% YoY growth in personal advance tax collections YoY and 34.25%YoY growth in personal self assessment tax collections.
Month GST collections (₹ crore)
July 94063
August 90669
September 92150
October 83346
November 80808
Total 441036

322.8
356.3
394.7
428.9
453.2
493.9
22.9 22.4 23.224.7
28.2 28.2
‐
100
200
300
400
500
600
FY12 FY13 FY14 FY15 FY16 FY17RE
(In '0
00 cr)
‐
5.0
10.0
15.0
20.0
25.0
30.0
Corporate taxes (In '000 cr) Effective Tax rate (%)
14
Deal Team – At Your ServiceCorporate tax rates to decline gradually as near term fisc is challenged…
Source: Budget documents, ICICIdirect.com Research
Corporate tax cuts to happen gradually with phasing out of various exemptions…•The Finance Minister in his previous Budget 2015 had made clear his intention to cut corporate taxes to 25% gradually over a period to encourage foreign investments and jobs. Inthis direction, the government in the last Budget reduced the tax rate for companies with an annual turnover up to | 50 crore to 25% to promote MSME and encourage firms tomigrate to the company format.•The government had also proposed a gradual phasing out of deductions available to corporate Inc. from FY18 onwards like restricting the benefits of accelerated depreciation to40% from 100%with effect from FY18, limiting the benefit of deductions for research to 100% from 150%w.e.f. FY21, etc.•At present, total incentives availed by corporate Inc. stands at |83,492 crore which is the available headroom for the government to bring down the tax rate. Assuming corporateprofit CAGR of 15% for next three years, the government can still manage to grow its revenue from corporate taxes at 10.4% CAGR even by cutting down the tax rate to 25% asshown in the below mentioned table.•However, in the coming Budget, there is little room for the government to reduce corporate tax rates as clarity is yet to emerge on GST revenue collections. With the phasing out ofmajor profit linked deductions like accelerated depreciation, SEZ, area based deductions, etc., and plugging loopholes in the direct tax systems, the government can gradually bringdown corporate taxes to the desired levels of 25% over a period of time
Breakup of major incentives availed by companies Expected growth in corporate tax revenue @ 25%Tax rate
FY17RECorporate taxes (In cr) ‐ A 493923Effective Tax rate (%) ‐ B 28.2Implied PBT (In cr) ‐ [A/B = C] 1749019Tax tax revenue foregone (| cr) ‐ D 83492Total implied tax revenue ‐ [A+D] ‐ E 577415Expected PBT after 3 years (assuming 15% CAGR growth)
2660039
Tax rate Assumed (%) ‐ G 25.0Corporat tax revenue (F/G) ‐ H 665010Corporate Tax CAGR over 3 years (%) 10.4
(In Cr)Exemption Type FY17
SEZ & Area based 23048
Accelerated depreciation 54345
Scientific Research 10980
Infrastructure 5502
Power 12624
Mineral Oil & Natural Gas 6502
Telecom 1339
Others 10778
Total 125118Recoveries through MAT 41626Net Revenue forgone 83492
Trends in corporate taxes and effective tax rates

15
Deal Team – At Your ServiceGrowth supportive expenditure to lead to fiscal slippages …
Source: ICICIdirect.com Research
Particulars A FY16 FY17RE YoY (%) FY18BE YoY (%) FY18IE YoY (%) CommentsGross Tax Revenues 1455648 1703243 17.0 1911579 12.2 1889702 10.9 Clarity on net revenue from GST is yet to emerge. GST collections of the past three
months have witnessed some moderation due to refunds under IGST. Hence, weexpect shortfall of over ~| 21000 crore in tax revenues from the budgeted target.
Less: State Shares 511883 614450 20.0 684565 11.4 641947 4.5 Net Tax revenue 943765 1088793 15.4 1227014 12.7 1247755 14.6 Non Tax RevenuesDividend 112127 153223 36.7 142430 (7.0) 114684 (25.2) Dividend income to be lower at | 1,14,684 crore mostly lower dividend from RBI
and ONGCEconomic services 91000 129889 42.7 92235 (29.0) 90000 (30.7) Others 48133 51658 7.3 54092 4.7 49500 (4.2) Total Revenue Receipts 1195025 1423563 19.1 1515771 6.5 1505040 5.7 Capital ReceiptsRecovery of Loans 20835 11071 (46.9) 11932 7.8 11000 (0.6) Disinvestments 42132 45500 8.0 72500 59.3 108000 137.4 Disinvestment proceeds are likely to surpass the budgeted target by | 40,500
crore mainly due to extensive stake sales and buybacks of PSEs during this fiscal.This would provide significant cushion in bridging the fiscal gap
Total 62967 56571 (10.2) 84432 49.2 119000 110.4 Total Receipts 1257992 1480134 17.7 1600203 8.1 1624040 9.7
Scheme Expenditure: 725114 869847 20.0 945078 8.6 989624 13.8 The government has planned an additional expenditure of | 66113 crore ( of which | 20532 crore is for fertiliser, | 15908 crore for road transport & highway, etc).Hence, we expect the total expenditure to overshoot the budgeted estimates thisfiscal
On Revenue Account 545619 631511 15.7 674057 6.7 NA NAOn Capital Account 179495 238336 32.8 271021 13.7 NA NAExp other than Schemes: 624010 661491 6.0 678579 2.6 678579 2.6 On Revenue Account 550483 619980 12.6 639799 3.2 NA NAOn Capital Account 73527 41511 (43.5) 38780 (6.6) NA NAInterest payments 441659 483069 9.4 523078 8.3 523078 8.3 Total Expenditure 1790783 2014407 12.5 2146735 6.6 2191281 8.8
On Revenue Account 1537761 1734560 NA 1836934 NA NA NA
On Capital Account 253022 279847 NA 309801 NA NA NAFiscal deficit 532791 534273 NA 546532 NA 567241 NAPrimary Deficit 91132 51204 NA 23454 NA 44163 NAGDP estimates 13567192 15251028 12.4 16847455 10.5 16689300 9.4 Fiscal deficit as % of GDP 3.9% 3.5% 3.2% 3.4% With high focus on inftrastructure, we expect the fiscal deficit to slide marginally
by 20 bps to 3.4% from the budgeted target of 3.2% for this fiscal
16
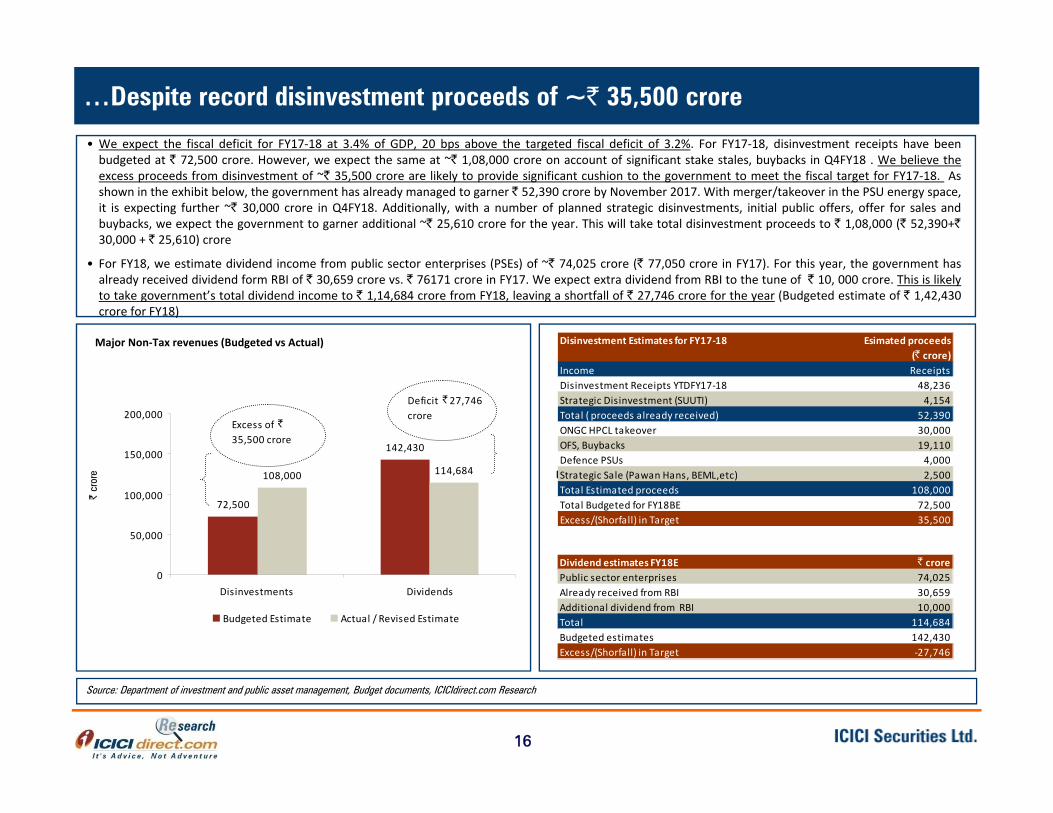
Deal Team – At Your Service…Despite record disinvestment proceeds of ~| 35,500 crore
• We expect the fiscal deficit for FY17‐18 at 3.4% of GDP, 20 bps above the targeted fiscal deficit of 3.2%. For FY17‐18, disinvestment receipts have beenbudgeted at | 72,500 crore. However, we expect the same at ~| 1,08,000 crore on account of significant stake stales, buybacks in Q4FY18 . We believe theexcess proceeds from disinvestment of ~| 35,500 crore are likely to provide significant cushion to the government to meet the fiscal target for FY17‐18. Asshown in the exhibit below, the government has already managed to garner | 52,390 crore by November 2017. With merger/takeover in the PSU energy space,it is expecting further ~| 30,000 crore in Q4FY18. Additionally, with a number of planned strategic disinvestments, initial public offers, offer for sales andbuybacks, we expect the government to garner additional ~| 25,610 crore for the year. This will take total disinvestment proceeds to | 1,08,000 (| 52,390+|30,000 + | 25,610) crore
• For FY18, we estimate dividend income from public sector enterprises (PSEs) of ~| 74,025 crore (| 77,050 crore in FY17). For this year, the government hasalready received dividend form RBI of | 30,659 crore vs. | 76171 crore in FY17. We expect extra dividend from RBI to the tune of | 10, 000 crore. This is likelyto take government’s total dividend income to | 1,14,684 crore from FY18, leaving a shortfall of | 27,746 crore for the year (Budgeted estimate of | 1,42,430crore for FY18)
Source: Department of investment and public asset management, Budget documents, ICICIdirect.com Research
72,500
142,430
108,000 114,684
0
50,000
100,000
150,000
200,000
Disinvestments Dividends
| cr
ore
Budgeted Estimate Actual / Revised Estimate
Excess of | 35,500 crore
Deficit | 27,746 crore
Disinvestment proceeds YTD FY18 at | 52,390 crore
Major Non‐Tax revenues (Budgeted vs Actual) Disinvestment Estimates for FY17‐18 Esimated proceeds (| crore)
Income ReceiptsDisinvestment Receipts YTDFY17‐18 48,236Strategic Disinvestment (SUUTI) 4,154Total ( proceeds already received) 52,390ONGC HPCL takeover 30,000OFS, Buybacks 19,110Defence PSUs 4,000Strategic Sale (Pawan Hans, BEML,etc) 2,500Total Estimated proceeds 108,000Total Budgeted for FY18BE 72,500Excess/(Shorfall) in Target 35,500
Dividend estimates FY18E | crorePublic sector enterprises 74,025Already received from RBI 30,659Additional dividend from RBI 10,000Total 114,684Budgeted estimates 142,430Excess/(Shorfall) in Target ‐27,746

17
Deal Team – At Your ServiceMarket Strategy 2018
Agrarian focused consumption push to alleviate rural stress
2
Capex revival to be key theme in 2018
3
Amid limited domestic challenge, risks to originate outside
4
Sectoral Outlook
5
Fiscal Policy: Limited space for big bang reform
6
Monetary space: Limited respite on rate cuts ahead
7
Consumption, GFCE to drive GDP growth
8
Market Outlook – 2018 to be the year of Stabilisation1
Top Picks for Strategy 20189
18
Deal Team – At Your ServiceEconomy rebooting; private consumption & reforms to make growth durable
Source: RBI, Mospi, Government of India, ICICIdirect.com Research
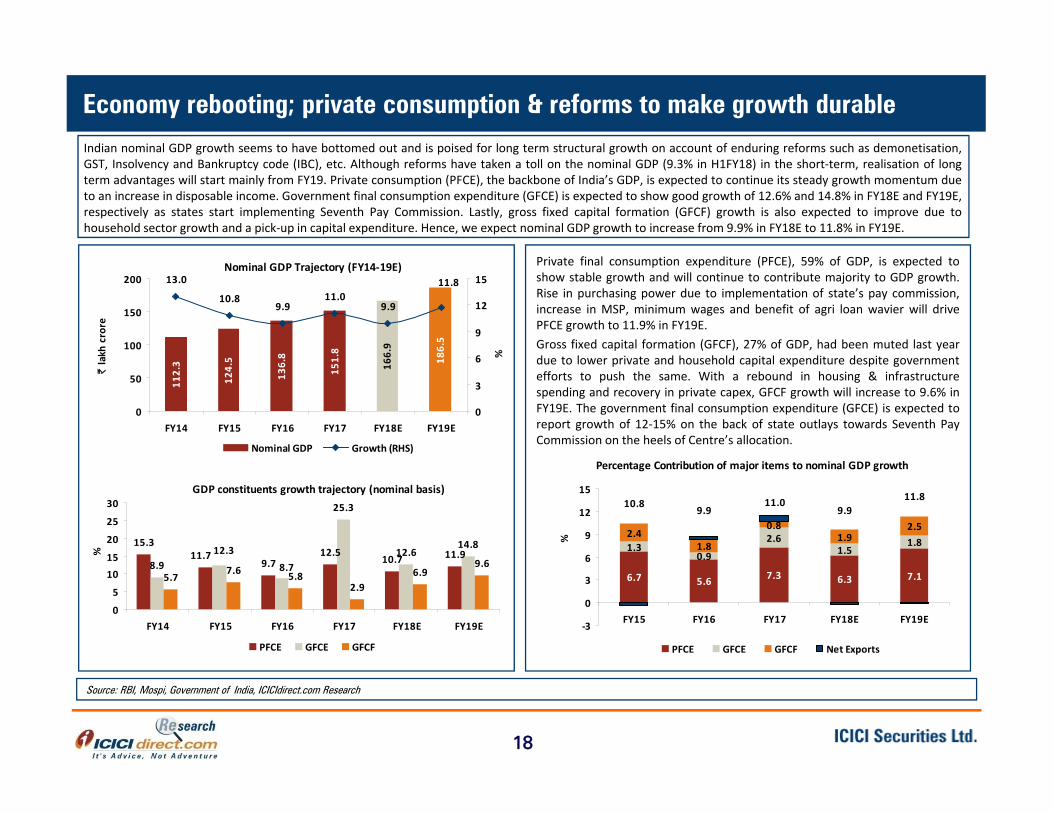
Indian nominal GDP growth seems to have bottomed out and is poised for long term structural growth on account of enduring reforms such as demonetisation,GST, Insolvency and Bankruptcy code (IBC), etc. Although reforms have taken a toll on the nominal GDP (9.3% in H1FY18) in the short‐term, realisation of longterm advantages will start mainly from FY19. Private consumption (PFCE), the backbone of India’s GDP, is expected to continue its steady growth momentum dueto an increase in disposable income. Government final consumption expenditure (GFCE) is expected to show good growth of 12.6% and 14.8% in FY18E and FY19E,respectively as states start implementing Seventh Pay Commission. Lastly, gross fixed capital formation (GFCF) growth is also expected to improve due tohousehold sector growth and a pick‐up in capital expenditure. Hence, we expect nominal GDP growth to increase from 9.9% in FY18E to 11.8% in FY19E.
Private final consumption expenditure (PFCE), 59% of GDP, is expected toshow stable growth and will continue to contribute majority to GDP growth.Rise in purchasing power due to implementation of state’s pay commission,increase in MSP, minimum wages and benefit of agri loan wavier will drivePFCE growth to 11.9% in FY19E.Gross fixed capital formation (GFCF), 27% of GDP, had been muted last yeardue to lower private and household capital expenditure despite governmentefforts to push the same. With a rebound in housing & infrastructurespending and recovery in private capex, GFCF growth will increase to 9.6% inFY19E. The government final consumption expenditure (GFCE) is expected toreport growth of 12‐15% on the back of state outlays towards Seventh PayCommission on the heels of Centre’s allocation.
Nominal GDP Trajectory (FY14‐19E)
112.3
124.5
136.8
151.8
166.9
186.5
13.0
10.89.9
11.09.9
11.8
0
50
100
150
200
FY14 FY15 FY16 FY17 FY18E FY19E
| lakh
crore
0
3
6
9
12
15
%
Nominal GDP Growth (RHS)
GDP constituents growth trajectory (nominal basis)
15.3
9.712.5
10.7 11.98.9
25.3
12.614.8
5.77.6 5.8
2.96.9
9.611.7
8.712.3
0
5
1015
20
25
30
FY14 FY15 FY16 FY17 FY18E FY19E
%
PFCE GFCE GFCF
Percentage Contribution of major items to nominal GDP growth
6.7 5.6 7.3 6.3 7.1
1.30.9
2.61.5
1.82.4
1.8
0.81.9
2.5
10.89.9
11.09.9
11.8
‐3
0
3
6
9
12
15
FY15 FY16 FY17 FY18E FY19E
%
PFCE GFCE GFCF Net Exports

19
Deal Team – At Your ServiceTraction in disposable income & state pay commission to drive consumption…
Source: RBI, Mospi, Government of India, media articles, ICICIdirect.com Research
Private financial consumption expenditure (PFCE) has been the key growth driver of GDP last year driven by the central government’s Seventh Pay Commissionand a steady rise in rural income. In FY18E, we expect marginally lower PFCE growth at 10.7% given the GST transition phase and higher base of last year. Thestate pay commission is expected to result in government final consumption expenditure (GFCE) growth at 14.8% in FY19E. This, in turn, is expected to lead to anuptick in consumer spending. In addition, agri loan waiver, likely hike in minimum support price and rural wages are likely to drive PFCE growth to 11.9% in FY19E.
Agri loan waiver and increase in disposable income are expected to providesupport to food & beverages consumption and basic housing needs, whichcontribute ~45% to PFCE. Also, robust growth in consumption of clothing &footwear (7% of PFCE), transport & communication (18%) among others areexpected to lead to improvement in private consumption growth.
State/ Center Outstanding agri loans Waiver Amount
UP 86241 36359
Maharashtra 252062 30500
Punjab 70141 10000
Karnataka 95557 8165TOTAL 504001 85024
States where farm loan waiver is announced (| crore)
PFCE growth will continue to remain strong110.6
98.889.3
79.372.3
64.8
22.919.917.714.113.011.6
0
25
50
75
100
125
FY14 FY15 FY16 FY17 FY18E FY19E
| lakh
crore
0
6
12
18
24
30
%
PFCE GFCE PFCE growth (RHS) GFCE growth (RHS)
State Total ex‐chequer (| crore)
Uttar Pradesh 27000
Maharashtra 18000
Tamil Nadu 14700
Rajasthan 10400
TOTAL 70100
States which has announced implementation of 7th Pay commission
% Increase YoY % of GDP FY13 FY14 FY15 FY16 FY17 FY18E FY19EEmployees Compensation 7.6 12.0 11.8 10.9 12.2 28.8* 14.5 17.5GFCE 11.7 9.7 8.9 12.3 8.7 25.3 12.6 14.8
Government expenditure on employees
* Icicidirect.com estimates
After the central government’s implementation of Seventh Pay Commission,states are also likely to follow suit by increasing expenditure towards salariesand pension. Some of the states have already announced the budget forincremental salaries and wages. Initial figures suggest the release ofincremental | 70,000 crore from some of major states. This can go up to | 2lakh crore with implementation across all states. We expect expenditure ofstates on salaries and wages to increase sharply at 19.3% in FY19E.Also, HRA dues to the tune of | 30000 crore and | 10000 crore for teachers inUGC funded universities and colleges, respectively, lined up for paymentbetween H2FY18 and FY19E is likely to increase the quantum of GFCE. Assalaries and wages constitutes ~65% of the GFCE, hike in the same wouldstimulate consumption over the next couple of years. Hence, we expect theGFCE to increase at 12.6% and 14.8% in FY18E and FY19E, respectively.

20
Deal Team – At Your ServicePickup in private investments will start recovery in the capex cycle
Source: RBI, Mospi, Government of India, ICICIdirect.com Research
The Gross Fixed Capital Formation (GFCF) component in GDP has witnessed slower growth in the last few years due to subdued investments from privatesector & household sector which constitute ~38% and ~37% of the GFCF, respectively. Majority of the growth in GFCF over the last few years was contributedby the increased spending by the government. The public sector spending which is ~25% of GFCF had played a vital role in the growth. The public sector GFCFpie in overall GFCF has grown from ~21% in FY13 to ~25% in FY16 on the back of government’s thrust on infrastructure. However, given the fiscal constraints ofthe government, we expect the growth rate of government’s public spending to get normalised in the coming years.
Going ahead, we expect private sector capex (~38% of the GFCF) and spending on the household sector and will play a more important role in recovery of GFCFgrowth. The private sector growth revival is on the cards due to recovery in the manufacturing sector which accounts for 35% of private GFCF. Manufacturingcapex will pick up on the back of pent‐up demand post the disruption caused by demonetisation and GST implementation. The private investment could seeuptick in investment possibly in late 2018 as there are early signs of corporate balance sheet repairs. Furthermore, relatively lower interest rate along withimprovement in policy reforms makes the business environment conducive for private investment in infrastructure. The public sector spending will continue togrow steadily on account of planned investments in infrastructure projects besides defence & public administration. Overall, we expect GFCF growth torecover to 9.6% in FY19E.
35.2 37.8
40.0
41.2
44.0
48.35.7
7.6
5.8
2.9
6.9
9.6
0
2
4
6
8
10
0
10
20
30
40
50
FY14 FY15 FY16 FY17 FY18E FY19E
%
|lakh
crore
GFCF on the road to recovery
Gross Fixed Capital Formation (GFCF) Growth (RHS)
(| lakh Crore)FY08‐12Actual
FY13‐17NITI Aayog
FY18‐22E I‐direct estimates
Power 7.8 12.7 7.1
Railways 2.0 3.8 8.6
Airports & Ports 0.8 0.9 2.0
Highways 4.6 7.6 7.0
Urban & Others 8.6 12.2 24.2
TOTAL 23.8 37.2 48.8
GFCF drivers going ahead

21
Deal Team – At Your ServiceMarket Strategy 2018
Agrarian focused consumption push to alleviate rural stress
2
Capex revival to be key theme in 2018
3
Amid limited domestic challenge, risks to originate outside
4
Sectoral Outlook
5
Fiscal Policy: Limited space for big bang reform
6
Monetary space: Limited respite on rate cuts ahead
7
Consumption, GFCE to drive GDP growth
8
Market Outlook – 2018 to be the year of Stabilisation1
Top Picks for Strategy 20189

22
Real interest rate within RBI range, to maintain status quo on Repo rate
Source: Bloomberg, ICICIdirect.com Research
• Inflation over the last year has been significantly impacted by many one‐offevents like demonetisation, GST and HRA. RBI has categorically mentionedthat they will look through the impact of these one‐off events. RBI expectsCPI inflation to average ~4.7% in FY19 including central HRA impact. Ourestimates suggest HRA impact to be around 30 bps. Therefore, normalisedinflation at ~4.4% may not be a significant concern given its durable targetof 4.0%. We draw comfort from the fact that when inflation wasundershooting RBI’s expectation in recent months, it refrained fromfurther rate cuts. Hence, RBI should not hike rates for minor overshoot also
• We have tried to analyse the future rate action by RBI with real rateassumption of 1.75% and average inflation range for year 2018 at 4.25% to4.75%
• We expect RBI to maintain status quo on repo rate at 6.0% during CY18.While we do not expect a further rate cut, we also do not expect a reversalin the interest rate cycle in the near future
• The recent up move in G‐sec yield with 10 year yield moving to ~7.30% ismore of a retracement of bullish positioning as investors adjust from adeclining rate cycle to a prolonged status quo phase in benchmark rates.Considering the 10 Year G‐Sec yield spread over repo at 100‐125bps, weexpect 10 year G‐Sec yield to trade in the range of 7.0%‐7.25%
• RBI has indicated to maintain real interest rate in the range of 1.25%‐2.00%.RBI earlier said the equilibrium real interest rate in India was 1.5‐2.0% but itsubsequently brought down the range to 1.25%
• Real interest rate is the difference between nominal interest rate andinflation. Nominal interest rate as indicated by RBI is the yield on 1‐YearGovernment security while headline CPI is being considered as inflation
• Currently with one‐year T‐bill rate at 6.4%, implied real interest rate is at1.9% assuming average CPI inflation for 2018 at 4.5%. Historically, 1‐year G‐Sec yield has traded 25bps above Repo rate indicating normalised level of6.25% at current Repo rate of 6.0%. Therefore on a normalised basis, realrate comes to 1.75%, in line with RBI’s expectation.
0
100
200
300
2014 2015 2016 2017 2018E
Current normalised real rate at 1.75% is within the RBI indicated range of 1.25% to 2.00% Best Case Base Case Worst Case
Real interest rate as indicated by RBI 1.75 1.75 1.75Average inflation expectation for 2018 4.25 4.50 4.75Impl ied nominal rate (Inflation + Real rate) 6.00 6.25 6.50Indicated nomina l rate by RBI (1Yr G‐Sec) 6.25 6.25 6.25Impl ied Repo rate (Impl ied nominal rate minus 25bps , his torica l ly lower than 1 Yr G‐Sec by 25bps) 5.75 6.00 6.25Current Repo rate 6.00 6.00 6.00Further Repo rate action by RBI (bps) ‐25 0 25
RBI Repo rate projection (%)
• India is still evolving in terms of fixing real interest rate regime. Given thewide range, scope of subjectivity in terms deciding Repo rate level hasincreased.

23
Scope for banking system to lower rates remains…deposit repricing effect still at play
Source: RBI, Bloomberg, ICICIdirect.com Research
New external benchmarking of MCLR to lead to faster transmission:The banking system in India has lagged timely and effective transmission of RBIbenchmark rate movement into lending rates. While moving from base rate toMCLR has resulted in slightly better transmission, external benchmarking rulemay have a far better effective transmission mechanism.Though term deposits re‐pricing has happened to the tune of 195 bps,transmission through MCLR is restricted to ~110 bps by banks. Repo rate cutduring the same period of December 2014‐September 2017 was 200 bps.
The proposed external benchmarking of MCLR rate warrants banks to use externalrates (T‐bill/ CD rates/repo rate) rather than current internal rates like banks owncost of funds while determining their lending rates. Also, the reset period is beinglowered to a month/quarter from a year to ensure faster transmission of anychange seen in external rates..
(200)
(150)
(100)
(50)
-Repo rate
Wtd Avg term deposit rate
Wtd Avg term o/s rupee loans
(bps)
Deposit growth to continue even at lower rates, re-pricing to persistDeposits are expected to continue to be repriced lower on renewals with freshgrowth continuing at ~8‐10% even at current lower rates. Savings bank interestrate reduction of 50 bps by banks also resulted in a decline in their cost ofdeposits. Therefore, a consistent decline in deposit costs for banks along withinitial lower transmission can offer scope for lowering lending rates by ~15‐20bps (within overall 40 bps expected), going forward.The medium term effect of demonetisation and other digital reform initiativesby the government in moving towards a less cash economy is likely to continueto fuel growth in low cost deposit in the banking and financial system.Declining share of physical assets is expected to keep deposit inflows high.
While repo & deposit rates are down 200bps, lending rates are down only 110 bps
Market rates like treasury yield/CD rate largely move with repo rate
While we expect RBI to maintain status quo on benchmark rates for most of year 2018, we believe there is still scope of lower lending rates in the banking system. Lowercredit cost in terms of lower provisioning, repricing of deposits at lower rates and structural reforms like lower cash to GDP ratio, increased digital transactions, increase inmerchant discount rate (MDR) rates expected to cut losses, benchmarking of lending rates to marginal cost lending rate (MCLR) provide scope for further rate transmission.We estimate scope of further reduction of ~40 bps in the banking system in a gradual manner particularly in corporate lending rate. {assumed 40 bps = 20 bps fromdeposits + 15 bps from provisions + 5 bps from lower opex}
These external benchmarks reflect RBI’s Repo rate & liquidity changes fasterMarket rates like treasury yield or bank CD rates move faster with change inrepo rate. Therefore, the new proposed external benchmarking mechanism, ifimplemented, will lead to effective and timely transmission of interest ratechanges by the banking system to the borrowers.
0
5
10
15
20
25
30
35
May‐10 May‐11 May‐12 May‐13 May‐14 May‐15 May‐16 May‐17
(%)
12M CD 1Yr T‐bill Repo (RHS)

24
Higher NPA provisions impact bank’s ability to lower rates, resolutions at IBC eyed
Source: RBI, Bloomberg, ICICIdirect.com Research
Apart from deposits, higher credit cost (provisions) largely prevented faster and higher rate cuts by the banking system. Expected IBC resolutions may offer room,wherein our hypothetical analysis offers 15‐20 bps room due to the same.
Higher credit cost prevent rate cut transmission: While pre‐provisioning profitsof the banking system continue to grow at a steady growth of ~12%,provisioning have increased significantly from around | 90000 crore in FY15 to| 222000 crore in FY18E. Provision as percentage of pre‐provisioning profithas nearly doubled to 81% from 46% in the last three years as a result ofhigher provisioning. Higher credit cost or provisioning has prevented banksfrom taking higher lending rate cuts hampering the transmission of lowerrates to the system.
Accordingly, the government and regulator have pressed the pedal toaccelerate resolutions, to resolve asset quality concerns pushing banks to fileRBI specified cases to NCLT under IBC code.
Of ~ | 8.4 lakh crore bad loans currently, the top 12 accounts by valuecontribute ~| 2.5 lakh crore and have been referred to NCLT (‘NCLT ‐ RBI List 1accounts’). Majority of these accounts are from the steel sector. An uptick indomestic prices and steel demand over the last couple of years has improvedthe sector outlook making it more appealing for potential bidders.
0%
10%
20%
30%
40%
50%
60%
70%
80%
90%
0
50000
100000
150000
200000
250000
300000
FY13 FY14 FY15 FY16 FY17 FY18E
(%)
| cr
ore
Provision PPOP Prov/PPP (%)
Provision/PPOP at ~81% seems to have peaked out….
Sensitivity analysis of NCLT List 1 accounts on banking networthIn the banking context, we have tried to do a sensitivity analysis ofimpact of haircuts on the net worth of banks. Currently, bankshave provided ~50% of the hit required in NCLT ‐ RBI List 1 cases.According to our estimates, every 10% reduction/increase in thehaircut, achieved through resolution process will impact net worthof banks to the tune of +3%/‐3%, respectively. This gain/hit inprofitability through write‐back or higher provisions (and thus networth) would reflect on financials of banks within a subsequentquarter or two.
HaircutNetworth (₹ lakh crore) Impact on Net Worth
30% 8.90 6%40% 8.65 3%50% 8.40 0%60% 8.15 -3%70% 7.90 -6%

25
…lower incremental provisions, digitisation to aid further transmission
Source: RBI, Bloomberg, ICICIdirect.com Research
The amount of provisions from FY19E onwards is largely expected to decline as resolutions from IBC kick in while probability of fresh large scale NPA additionsalso remain meagre. Lower incremental provisions are expected to lead to lower credit cost. Assuming credit cost at 2.1% (similar levels in FY15)from 3.1% now,provisioning amount reduces by ~| 40000 crore. Assuming NIMs and other variables constant, this factor alone leads to an impact of lowering ~30 bps onlending rates by banks. Factoring that provisions were higher for PSU banks than private peers, a 15 bps cut can be expected at the industry level led by thesavings on provisions alone.
Expected lower provisioning to lead to reduction in lending rates
Push towards digitisation likely to lower cost of funds structurally
The cost of cash to the financial system such as handling, security and opportunity cost is around 1.3% of GDP. The government agreeing to bear merchantdiscount rate (MDR) charges for two years on transactions up to | 2000 likely to expedite usage of digital modes like cards/ UPI/ wallets, etc. A reduction in usageof cash will lead to saving of this cost (operational overheads) to the banking system.
3.1
2.1
~100 bps decline in credit cost at 2.1%....
10.0%
9.6%
...factoring in higher provisionborne by PSB, on reversals atsystem level, scope for ~15 bpstransmission exist
..assuming other variables constant, banking yield onadvances can be brought down by ~30 bps
Hypothetical case study of 100bps fall in credit cost (provisions as a % of advances)

26
Deal Team – At Your ServiceMarket Strategy 2018
Agrarian focused consumption push to alleviate rural stress
2
Capex revival to be key theme in 2018
3
Amid limited domestic challenge, risks to originate outside
4
Sectoral Outlook
5
Fiscal policy: Limited space for big bang reform
6
Monetary space: Limited respite on rate cuts ahead
7
Consumption, GFCE to drive GDP growth
8
Market Outlook – 2018 to be the year of Stabilisation1
Top Picks for Strategy 20189

1201
93
1125
07
1047
63
9141
6
7913
7
1236
5
2418
8
2614
6
2403
86
0
50000
100000
150000
200000
250000
300000
1993
‐94
1999
‐00
2004
‐05
2011
‐12
2012
‐13
2013
‐14
2014
‐15
2015
‐16
2022
‐23E
( |)
95 9580 75
40 38
2.4 3.914.4 14.8
5565
0
20
40
60
80
100
US WesternEurope
Russia Brazil India China
(%)
Mechanization Rate Population engaged in agriculture
2924
2229
1908
1338
1046
0500
10001500200025003000
Uttar
Prad
esh
Mad
hya
Prad
esh
Andh
raPrad
esh
Tamil
Nad
u
Karnataka
( | Bn)
27
The consumption story in India would be supported by rural income levels, which are still a fifth of the national average. In the wake of a mere one and half yearsbeing left for general elections, the government’s thrust will be on increasing farmer’s income considerably next year by way of supporting better crop realisation.Initiatives like eNam and setting up of mega food parks is likely to reduce the disintermediation cost by 25‐30%, which could well be the single most important factorin increasing farmer’s income immediately. However, the initiatives towards increasing the yield like micro irrigation, farm mechanisation are a long drawn process,which would yield results over the next decade. Moreover, the government’s thrust on warehousing and cold storage would indirectly benefit large agri states in Indiaby eliminating the agri waste. India’s five major agri states contribute >40% of the total net state value added (NSVA). Given the higher contribution of agriculture inthese states coupled with the large rural population, the difference between the rural per capita household income is much lower than the national average. Webelieve effective implementation of these initiates in top agri states would boost rural income levels
Deal Team – At Your ServiceFocus on productivity to boost rural income
Source: Government of India, World bank, Ministry of Agriculture, ICICIdirect.com research
Target to double the farm household income
Per hectare yield of different crops in India vis‐à‐vis other countries
Rice/ Paddy
(tonnes/hec)
Wheat(tonnes/hec)
Coarse Grain
(tonnes/hec)
Corn Area
(tonnes/hec)
Barley(tonnes/hec)
Egypt 8.2 Egypt 6.4 USA 10.3 USA 11.0 USA 4.2USA 8.1 China 5.3 Argentina 7.1 Argentina 8.4 China 4.0China 6.9 US 3.5 China 5.8 China 6.0 SA 4.0Vietnam 5.7 Brazil 3.2 Vietnam 4.6 Brazil 5.6 Brazil 3.9Indonesia 4.8 India 2.9 Philippines 3.0 Vietnam 4.6 Argentina 3.8India 3.8 Pakistan 2.8 Brazil 5.5 Indonesia 3.2 Mexico 3.0Thailand 2.8 Iran 2.3 India 1.8 India 2.7 India 2.7World 4.5 World 3.4 World 4.2 World 5.8 World 3.06
Mechanisation rate vs. Population engaged in agriculture
India’s major agri led states which account >40% of total NSVA* (FY17)

AP7%
Gujurat5%
KA5%
MP7%
MH7%
TN2%
Others67%41
905
1015202530354045
Sanc
tion
ed
Ope
ration
al
(Nos)
28
Deal Team – At Your ServiceCreating requisite infra to improve agri demand supply dynamics
Source: MoFPI , ICICIdirect.com Research
Investment in food processing industry to minimise agri products wastage
34% of mega food parks have been sanctioned in six major agri states
In India, ~20% of the crop produced by the farmer does not reach the end consumer, which leads to a loss of ~ | 92,000 crore. This translates to an urgent need forcold storage facilities across major agri producing states in India. Some of the major initiatives to boost the demand for agri products and reduce wastage isinvestment in cold chain facilities & mega food parks. The government has allocated land for 41 mega food parks out of which nine are operational (remaining 32parks to be operational by 2019). Simultaneously, 100 cold chain stores are operational since 2008 while further 136 are under implementation. Total investment inmega food park and cold chain storage has been more than | 10000 crore. Setting up of mega food park and cold chain storage facility would not only reduce thecrop wastage significantly but also result in additional agri produce demand and better realisation through food processing sector.
Total 60% of cold chain capacity concentrated in five states
13.6
5.9
2.3 2.0
1.6
42.3
05
1015202530354045
UttarPradesh
WestBengal
Gujarat Punjab AndhraPradesh
India
(million tonn
es)
Operational Projects Under Implementation No of Projects No of Projects
Fruits & Vegetables 66 72Dairy 19 41Meat / Poultry / Fish 7 18Mixed (Horti & Non Horti) 4 5Irradiation 4 0Total 100 136
Sector
Food Processing Industry
Fruits & Vegetable
Milk FisheriesMeat Poultry
35%
21%
6% 6%2%1% 2%
5% 4%
18%
Processing level Wastage
Higher Processing level
Lower Wastage
Upcoming cold chain facilities to reduce crop wastage
The new cold chain projects will create additional capacity of 2.76 lakh MT of cold storage

29
Deal Team – At Your ServiceUniversal basic income: To boost farm income, benefitting rural economy…
Source: Budget Documents , ICICIdirect.com Research
•Over the years, one of the primary objectives of the Government of India hasbeen to alleviate poverty. India has been able to reduce the number of peopleunder poverty line from 70% at the time of independence to 22% in 2011‐12(according to Tendulkar Committee). However, 22% still counts for more than 25crore people under the poverty line, which is equivalent to fourth largest countryin the world. Hence, India is currently looking at UBI from an angle of povertyelimination. UBI (when implemented) has the potential to reduce the incomeinequality, especially in rural areas. UBI has the capability to increase the famer’sincome thereby benefiting the rural economy at large. In current context, in thelonger run UBI has the potential to play role of a catalyst in eliminating poverty inone leap.•Universal basic income is guaranteed income that acts as a cushion to surviveeven under extreme circumstances. By definition, UBI has three components,universality, un‐conditionality & agency. Putting it simply, it is a periodicunconditional cash payment to all individuals without any work requirement. UBIis also a natural extension after the success of direct benefit transfers (DBT) forsome centrally sponsored schemes. Simultaneously, it is advocating efficacy byreducing waste in implementing government welfare schemes
•According to 2011‐12 Tendulkar Committee, poverty line was defined as | 893per month, which comes to | 5400 per year. Adjusting for inflation, the sameshould be | 7620 per year in 2016‐17. Hence, to reduce the poverty line from22% to 0.5%, the government is required to provide per year basic income at |7620, which would translate into government outgo of | 9.9 lakh crore (6.5% ofGDP). However, with the targeted 75% of the population, the outgo will be | 7.4lakh crore, which is 4.9% of the 2016‐17 GDP.
•One of the biggest benefits of UBI is eliminating poverty completely at one gogiven minimum basic income (an amount that keeps people above poverty line)would be provided to every citizen. The government needs to spend ~5% of GDPto implement universal basic income. To garner the resources for this, it iscrucial to replace the various welfare schemes with UBI•The Union Government spends 5.2% of GDP, which accounts for ~ | 7.8 lakhcrore, in various welfare schemes & subsidies. It also spends 1.0% of GDP on themiddle class as subsidy in railways fares, LPG, personal income tax exemption,etc. Moreover, the government also spends 0.7% of GDP on education, publichealth, sanitation & family welfare. In total, the government spends more than7% of GDP on various schemes. While the government needs to continue someschemes, which are inherently essential for social development, the resourcesallocated to some of the other subsidies and welfare schemes can be utilisedtowards UBI•One of the concerns of UBI is that a minimum guarantee could make people lazyand lead them to opt out of labour market. Hence, UBI, with an exclusion list,could be a solution to this problem. The government can create an exclusion liston the basis of ownership of key assets like automobile, air conditioners or bankbalance beyond a certain amount. It can also appeal to people to ‘give it up’similar to the LPG ‘give it up’ programme. The other option could be toimplement UBI only for women. This would not only reduce the fiscal cost inproviding basic income to half but would also empower women and can be usedas a deterrent toward discrimination against women. Giving money to womenalso improves their bargaining power within households and reduces concernson money being splurged on conspicuous goods (liquor, tobacco, etc)•UBI, if implemented appropriately, can revolutionise the structure ofgovernment welfare schemes, subsidy distribution and eradicate poverty, to agreat extent

63.5
49.6
72.3
58.8
40
50
60
70
80
90
Electric Fan Television
(%)
Rural India
30
Deal Team – At Your ServiceRise in rural income to spur consumption through agri heavy states
Source: Government of India, ICICIdirect.com Research
NSVA growth in agri & allied activity vs. tractor growth in FY17
6.817.5
31.3
3.8
16.37.9
20.2
51.7
29.9
4.2
19.7 18.0
0102030405060
Tamil
Nad
u
Andh
raPrad
esh
Mad
hya
Prad
esh
Karnataka
Uttar
Prad
esh
India
(%)
Agriculture, Forestry and Fishing Tractor sales growth
4.0
6.0 6.1
8.6
12.1
0.0
2.0
4.0
6.0
8.0
10.0
12.0
14.0
MadhyaPradesh
Karnataka AndhraPradesh
UP Tamil Nadu
(%)
02468101214161820
(%)
India
Household penetration of refrigerator in agri led states vs. India
16.719.4
23.825.7
32
0
5
10
15
20
25
30
35
MadhyaPradesh
Karnataka AndhraPradesh
UP Tamil Nadu
(%)
0
5
10
15
20
25
30
(%)
India
Household penetration of motorised wheeler in agri led states vs. India
The household penetration of consumer goods (refrigerator, fans, television) & motorised vehicles in major agri states is abysmally low, as lower rural per capitaincome in these states (vs. the national average) is impacting discretionary spending. The increase in rural income through various government initiatives, bettermonsoon in the last two years & possible implementation of UBI would simultaneously result in higher rural demand for consumables. We believe the first levelsof consumption growth would be visible in tractors, two‐wheelers and household appliances in these major agri states. With ~35% of consumption coming fromrural areas and more than 70% of the workforce employed in rural India, lifting rural economic growth is critical for overall growth of the durable industry.
Household penetration of consumer durable goods

31
Deal Team – At Your ServiceMarket Strategy 2018
Agrarian focused consumption push to alleviate rural stress
2
Capex revival to be key theme in 2018
3
Amid limited domestic challenge, risks to originate outside
4
Sectoral Outlook
5
Fiscal Policy: Limited space for big bang reform
6
Monetary space: Limited respite on rate cuts ahead
7
Consumption, GFCE to drive GDP growth
8
Market Outlook – 2018 to be the year of Stabilisation1
Top Picks for Strategy 20189

3.7 3.5 4.5 6.6 4.5 100.0
2.5
5.0
7.5
10.0
12.5
15.0
FY14 FY15 FY16 FY17 8MFY18 Over next 3yrs
(| la
kh c
rore
)
Trend in Tendering Activity
Looking at historical trend and goverment spending targets, our rough calculation indicates that tendering activity should pick up to | 10 lakh crore pa over next three years
21.0% CAGR
With government's focus on infrastructure, a pick-up in tendering activity at a CAGR of
21% was witnessed in last few years
7.0 16.823.9 26.5
46.5
48.4
1.3
8.67.1
2.620.0
1.9
Roads Ports Railway Power Urban Infra Housing Defense Total
| la
kh c
rore
Possible Infrastructure spend over the next 5 years
Verticalwise break up of Tendering
11
17
7
13
0.7
56
58
58
57
49
8
9
12
10
11
3
2
2
1
2
5
2
2
10
5
4
7
24
8
6
12
9
12
2 5
0 20 40 60 80 100
FY14
FY15
FY16
FY17
8MFY18
(%)
Power & Distribution
Renewable Energy
Roads
Railways
Airports
Ports
Real Estate
Irrigation
32
Infrastructure investment could jump up to ~| 48 lakh crore based on our bottom up approach mainly led by investment in housing, roads and railways over thenext five years . This implies 10% CAGR in infrastructure spending in the next five years. Consequently, we expect infrastructure spending as percentage of GDP toinch up to 6% in the next five years vs. 5.6% in previous five years. However, we believe tendering activity needs to jump up to | 10 lakh crore over next threeyears to achieve desired infrastructure spending outcome. In our view, increased infrastructure spending could improve the GDP growth rate by 80 to 100 bps.
Tendering all set to firm up amid mega infrastructure spending!!!
Source: Niti Aayog, Project Today ICICIdirect.com Research *Derived from Niti Aayog *assuming GDP growth rate of 7% pa

1.0
1.5
2.0
2.5
3.0
FY10 FY11 FY12 FY13 FY14 FY15 FY16 FY17
(x)
Debt to equity (x) of Infra & Engg Universe of 66 companies
Tendering break-up by ownership (%)
99.8 99.7 99.7 99.8
0.2 0.3 0.3 0.20
25
50
75
100
FY15 FY16 FY17 8MFY18
(%)
Government share Private share
33
Private investment in infra – Revival on the cards…
Source:Project Today, Capitaline, Press reports, ICICIdirect.com Research
Private Investment
Strong Economic Growth
Banks Recapitalization to boost investment
Favorable Business & Regulatory Environment
Low Interest Rate
Corporate Balance
Sheet Repair
Triggers for revival in private investment are in place
While tendering activity was dominated by the government, participation of privateplayers in tendering activity was very limited in the last three to four years due tohigh leverage and elevated interest rate scenario along with uncertainty over policyframework. However, we believe private investment could see uptick in investmentpossibly in late 2018 as there are early signs of corporate balance sheet repairs.Furthermore, relatively lower interest rate along with improvement in policy reformsmakes the business environment conducive for private investment in infrastructure.
Sector Key reforms making business enviroment conducive for pvt. investment
Road Introduction of hybrid annuity model leading to lower equity requirement for private players
To improve liquidity of private players, the government passed ordinance for payment of 75% of arbitration claims where initial ruling is in favour of private players
Introduction of new funding avenues such as investment trusts (InVITs) to free up capital
PowerThe government is planning to amend National Electricity Act to keep cross subsidy below 20% and transfer power subsidies to farmers directly through DBT schemeUday scheme would lead to reduction in stressed assets and financial & operational turnaround for state electricity board (SEB)
Real Estate Infrastructure status to affordable housing leading to lower cost of debt
100% tax deduction for affordable housing projects making project viable for private playersPort Infrastructure status to shipyard industry leading to lower cost of debt

Tendering activity in the real estate sector
*up to August, 2017
Note: Above data includes all tenders in real estate sector. Given the lack of interest of private players due to issues like RERA, we presume majority of tendering activity would be from the government side.
2092
0
21 900
317
463
1367
5
289
191
548
227
3835
5 7550
7514
6446
717
4925
5 1116
2
4963
6186 10
671
0
10000
20000
30000
40000
50000
60000
Real Estate Telangana Maharashtra Madhya Pradesh Andhra Pradesh
(| c
rore
)
2014 2015 2016 YTD 2017*
The tendering activity for real estate indicates housing momentum to remain strong ahead.
34
Housing for All – investment cornerstone
Source: Project Today, Press reports, KPMG NAREDCO, ICICIdirect.com Research
Government’s “Housing for All by 2022” scheme is expected to be a key catalyst ineconomic recovery. There is a shortage of ~1.2 crore houses in urban areas, ~4.4crore houses in rural areas that government is addressing through Pradhan MantriAwas Yojana‐Gramin (PMAY‐G ) & Pradhan Mantri Awas Yojana‐Urban (PMAY‐U ).We expect the government to construct ~1 crore urban houses and ~3 crore ruralhouses entailing overall investment of ~| 20 lakh crore in next five years.
We believe Housing for All scheme will revive the economy with 250+ sectorsforward and backward linkages. Beside this, it would result in huge employmentgeneration. According to a Credai CBRE report, jobs in the real estate sector arelikely to witness 80% growth from 9.2 million in 2016 to 17.2 million in 2025.
Tendering activity in the real estate sector has picked up significantly in the pasttwo years across major states of India with Telangana topping with tenders worth~| 11162 crore in YTD2017.
Several government initiatives to boost PMAY‐U executionAccording infrastructure status to affordable housing
100% tax deduction for affordable housing projects
PPP models to develop affordable housing projects with private participation
So far, ~1.6 lakh houses have been constructed under PMAY – U since the inceptionof the scheme. However, several government initiatives and strong momentum intendering activity gives us the confidence that the execution would improve, ahead.
On a positive note, strong traction was witnessed in execution of PMAY – Gscheme with the government sorting out operational & approval issues like linkingBelow Poverty Line beneficiary data with socio economic & caste census (SECC).Furthermore, to build a pucca house, the government is giving ~| 1.3 lakh throughDirect Benefit Transfer (DBT), ~| 12000 for toilet construction under Swachh BharatMission and ~| 18000 under MNREGA (~90‐95 days wages) to eligible beneficiaries.Consequently, we expect this execution momentum to sustain given the strongbudgetary allocations for the scheme by several state governments.
Particulars Urban
(crore units) Rural
(crore units) Total
(crore units)
Programme housing target 1.2 4.4 5.6
Delivered till date 0.0 0.6 0.6
Yet to be delivered 1.2 3.8 5.0
Anticipated completion over next 5 years 1.0 3.0 4.0
Anticipated investment (| lakh crore) 5.0 15.0 20.0

Tendering activity in Railway
29.7 30.554.9 67.5
49.8
191.2
0
100
200
300
FY14 FY15 FY16 FY17 8MFY18 Over Next 3year
| 00
0 crore
Looking at historical trend in tendering activity and goverment spending targets, our rough calculation indicates that tendering activity should pick up ~2x to |1.9 lakh crore pa over next three years helping it to achieve railway investment target to |8.6 lakh crore over next 5 years.
35
The government has chalked out a rail infrastructure investment plan of ~| 8.6 lakh crore over the next five years. There has been a quantum jump in investment outlay‐ | 1.1 lakh crore in FY17 against ~| 0.6 lakh crore in FY15. Looking at historical trend in tendering activity, we believe tendering activity needs to jump 2x to | 1.9 lakh crore over the next three years to achieve the five year target
Quantum jump in Railway investment
Source: Indian Railway, Project Today, ICICIdirect.com Research
Government's plan of Rail investment in next 5 years (in | crore)
Network decongestion (DFC+electrification; Doubling+electrification) 199320
Network expansion (including electrification) 193000
National projects (North Eastern & Kashmir connectivity projects) 39000
Safety (Track renewal & bridge work) 127000
Information Technology/Research 5000
Rolling stock(Locomotives, coaches, wagons) 102000
Passenger amenities 12500
High Speed & elevated corridor 65000
Station redevelopment+logistics park 100000
Others 13200
Total 856020
1528
2828
2857
3500
1184
1730
2013
4000
0
1000
2000
3000
4000
5000
AVG 2009‐14 2015‐16 2016‐17 2017‐18 (PLAN)
(km)
Broad gauge lines commissioned (km) Electrification completed (km)
Almost doubled the pace of infrastructure
• Broad gauge lines commissioned could increase to 19 km/day & can rise up to 25 km/day in partnership with state governments
• Two dedicated freight corridors (DFCs) to be commissioned by 2019. Three new DFCs are in the pipeline
• Increased pace of rail infrastructure at almost 4000 km/year. Target is to electrify 11,000 km in three years
Reforms agenda for rail infrastructure

0.0 2.0 4.0 6.0
FY14
FY15
FY16
FY17
8MFY18
| lakh crore
Tendering activity in road vertical
Tendering activity of ~| 12 lakh crore in last four to five years is sufficient for goverment target. However, focus will be on execution & physical milestones to complete road projects
36
Road – Bharatmala to provide next fillip to investments…
Source: Government reports, ICICIdirect.com Research
Road sector certainly remains the key focus area for government. Road awarding haspicked up from 3225 km during FY12 to ~16271 km in FY17. We expect this strongtraction in awarding/construction activity to continue with the government’sannouncement of historic road building programme to construct 83677 km of roadsover next five years.
Bharatmala Phase - I•Road length: 34,800 km
•Investment: | 5,35,000 crore
Other roads•Road length: 48,777 km
•Investment: | 1,56,000 crore
PMGSY•Road length: 1,09,302 km
•Investment: | 88,185 crore
•Upgradation work: | 11,725 crore
The government has announced its historic road building programme to construct83677 km of roads over the next five years with a total outlay of | 6.92 lakh crore whichis expected to generate 14.2 crore man‐days of jobs. This also includes the phase 1 ofBharatmala project which includes construction of 34800 km of roads at an investmentof | 5.35 lakh crore in the next five years. Additionally, the government is also lookingto construct 1.1 lakh km roads in rural areas with investment of | 88185 crore in thenext three years. This rapid completion of road construction is to be ensured by variousagencies including NHAI, MoRTH, NHIDCL and state PWDs.
Clear road map for funding mega-road construction plan Funds (in | lakh crore)Funding for Bharatmala (34800 km) 5.35
Central road Fund/ Toll operate Transfer model/ Toll 2.19
Funds from Market 2.09
Private Investments 1.06
Funding for balance works (48877 km) 1.56
Central road Fund 0.97
Budgetary Support 0.59
Grand Total 6.92
Detailed break-up of GoI’s Historic road building programme
* Given change of chairman in NHAI, there is likelihood of MoRTH missing targets . However, we believe this is a temporary blip and traction should remain strong going ahead
0
10000
20000
30000
FY12 FY13 FY14 FY15 FY16 FY17 FY18E*
(Km
s)
Awarding Construction
Trend in MoRTH awarding and construction

37
Government reforms, policy changes to boost tendering activities in power!
Source: Central Electricity Authority, Ministry of Power, Ministry of New and Renewable energy, Sigma Insights, Power Grid Corporation, Projects today, ICICIdirect.com Research
Over the next five years, the power segment is expected to witness an investment of | 7,09,000 crore (of which | 3,29,000 crore will be in power and | 3,80,000 crore willbe in transmission & distribution). For these investments to fructify, tendering activities needs to rise by 2.0x. Considering the government’s focus on Power for All by 2020,implementation of UDAY scheme, replacement of old thermal power plants and policy changes in the power sector, we expect a significant jump in tendering activity in thecoming years. Further, renewable energy tendering is also expected to witness an upward trend mainly led by government incentives like tax holidays & accelerateddepreciation and import duty exemptions.
380000
9413681133752836659263885
0
50000
100000
150000
200000
250000
300000
350000
400000
FY12 FY13 FY14 FY15 FY16 Over next 5years
(in | crore)
Transmission & Distribution Capex
With the implementation of the UDAY scheme and other reforms in powersector, we expect capex spends by SEBs to improve significantly. Assuming aconservative run rate of | 70,000‐75,000 crore per annum capex, SEB capexcan be in the range of | 2,80,000‐3,00,000 crore over the next five years. Inaddition to this, Power Grid Corporation will also incur capex of | 1,00,000crore over the same period. This will lead to an overall investment of| 3,80,000 crore in the T&D segment.
Particulars MW Capex (in | crore)
Renewable energy 88000.0 352,000.0
Thermal power plant replacement 29560.0 118,240.0
Total power capex over next five years 470,240.0
In the next five years, power sector is expected to attract investment of| 4,70,000 crore. However, considering the process delays in signingPPA and delay in execution, we expect only 70% of power investmentsto materialise leading to investment of ~| 3,29,000 crore
5321
87036
32652
6013140565
1428712765
162872
020000400006000080000
100000120000140000160000180000
FY12
FY13
FY14
FY15
FY16
FY17
8MFY18
Over next
3 years
( | crore)
Power tendering
8MFY18 tendering has witnessed slowdown due to policychanges; however we expect tendering to pick up from FY19Eonwards. Further, considering 2.6x rise in tendering in FY17 andgovernment's focus on power reforms we believe a 2.0x rise inpower tendering to |1.6 lakh crore p.a over next three years isachievable. This coupled with past tendering we believe overallinvestment of |7 lakh crore looks an achievable target.

38
Ports key catalyst for sustained economic development
Source: Ministry of Shipping, Industry (defence), Projects Today, ICICIdirect.com research
• Waterways is 7.5x cheaper than railways and 12.5x cheaper thanroadways. Hence, to increase the share of waterways and reducelogistic cost the Government of India plans to double its cargo handlingcapacity to 3,036 MT by 2021 from 1,550 MT by adding new ports,expansion of existing major ports and efficiency improvement.
Government’s thrust on defence to drive capex in industryDevelopment of ports to help reduce logistic inefficiency
Defence order in pipeline Capex in | crore Likely by
1 Akash missile systems 5,000.0 FY18
2 Electronic warfare systems 7,000.0 FY18
3 LRSAM 6,000.0 FY19
4 Small boats 1,000.0 FY19
5 Landing platform docks 20,000.0 FY19
6 P75 I Submarines 60,000.0 FY19
7 Tactical communication system 10,000.0 FY19
8 QRSAM 8,000.0 FY20
9 Anti submarine warfare & shallow water craft 10,000.0 FY20
10 Next generation corvette 17,500.0 FY20
11 Next generation missile vessels 12,000.0 FY20
12 Battlefield management system 30,000.0 FY21
Total 186,500.0
• Defence procurements have gained significant steam over the past fewyears. This is evident from a slew of approvals that has taken place in thelast few years. Defence Acquisition Council has given the go‐ahead to anumber of large projects like K9 Vajra Guns, Apache attack helicopters,Rafale fighter aircraft, Diving support vessel, ASW Corvettes, etc, worth~| 80,000 core. We believe such large projects are likely to augur well forthe industry helping push much need capital formation in this criticalsegment
• Gong forward, we expect the pipeline to be even stronger over the nextthree to four years. We have listed 12 large projects /platforms, whichwe believe are likely to get approved over the coming years. We estimatethe total value of these projects at ~| 1,86,500 crore
1970 21902570
1550
3036
100320 220
380
466
Existing Capacity Major portsefficiency
improvement
Ongoingexpansion atmajor ports
Additionalcapacity frommasterplanprojects inmajor ports
Capacity expansionat non‐major
ports
New ports FY’21capacity
In M
T
22000
7921
16276
21403
7908
19347
0
5000
10000
15000
20000
25000
FY14 FY15 FY16 FY17 8MFY18 Over nextthree years
(in | crore)
Ports Tendering Trend
To double the port capacity the government aims to invest ~|4 lakh crore.However, we believe investment in port will be lower than |4 lakh crore due tolack of private participation, slowdown in tendering and process delays.Assuming 1.4x increase in tendering, we believe |22,000 crore p.a tendering over
next 3 years seems achievable leading to a total investment of |1.3 Lakh crore
over next 5 years.

39
The government is expected to spend | 2.6 lakh crore on urban infrastructure (metro rail, airport, smart city, trans‐harbour & Swachh Bharat programme). Out of this, amajor chunk of investments would be done on Metro and Airports.. On the metro front, we believe the investment would be to the tune of | 0.94 lakh crore based on themetro projects sanctioned in the last three years. On the airport side, we expect investment of | 0.5 lakh crore over the next five years. Looking at the tendering activity, itshould be easily achievable.
Metro & airports – Key pillars for urban infrastructure
Source: AAI, CAPA, Ministry of Urban Development, ICICIdirect.com Research
State/UT Project Estimated cost (in | crore)
Maharashtra Mumbai Metro Line 2 & 3/ Pune Project Phase 1 51956
Karnataka Bangalore Metro Rail Project Phase 2 26405
Rajasthan Jaipur Metro Rail Project Phase 1 3149
Gujarat Ahmedabad Metro Rail Project Phase‐1 10773
Maharashtra Nagpur Metro Rail Project 8680
UP Lucknow Metro Phase 1A 6928
Tamil Nadu Extension of Chennai Metro 3770
Total 111661
ProjectStart of
constructionExpected
completionProject cost
(| cr)Navi Mumbai FY18 end FY22 14500Pune 7500Goa FY18 FY22 4500Bhogapuram FY19 FY22 4500Hassan FY19 FY23 3000Dholera FY19 FY22 2500Ankleshwar FY20 FY22 2500Dwarka FY19 FY22 2500Aranmula FY20 FY23 2000Kannur Under construction FY18 1900Nagpur FY18 FY22 2000Chennai FY19 FY22 1400Bengaluru Phase II FY18 FY20 1000Kushinagar FY19 FY21 750Kolkata ‐ Modernisation FY19 FY20 700Guwhati ‐ Modernisation FY19 FY20 600Total 51850
Land yet tobe finalised
7200 7400
4700 4800 4600
2400 22003000
67007600
010002000300040005000600070008000
FY11
FY12
FY13P
FY14P
FY15P
FY16P
FY17P
FY18E
FY19E
FY20E
| cr
ore
Investment trends in Airportsf
Low investment phase
Tendering activity in Airport
8910 87528270
10893
2526
5000
0
2000
4000
6000
8000
10000
12000
FY14 FY15 FY16 FY17 8MFY18 Over nextthreeyears
| crore
Going by the tendering activity in the last four years, governments spending target of next 5 years is achievable with a tendering of | 5000 crore anually for next 3 years

40
Deal Team – At Your ServiceMarket Strategy 2018
Agrarian focused consumption push to alleviate rural stress
2
Capex revival to be key theme in 2018
3
Amid limited domestic challenge, risks to originate outside
4
Sectoral Outlook
5
Fiscal policy: Limited space for big bang reform
6
Monetary space: Limited respite on rate cuts ahead
7
Consumption, GFCE to drive GDP growth
8
Market Outlook – 2018 to be the year of Stabilisation1
Top Picks for Strategy 20189

0
5
10
15
20
25
30
0
25
50
75
100
125
150
175
Increase in Inflation
Incr in US 10yr gsec yield S&P PE
Increa
se in bo
nd yields
P/E
0.0
0.2
0.4
0.6
0.8
1.0
1.2
0.1
0.6
1.1
1.6
2.1
2.6
Aug‐15
Oct‐15
Dec‐15
Feb‐16
Apr‐16
Jun‐16
Aug‐16
Oct‐16
Dec‐16
Feb‐17
Apr‐17
Jun‐17
Aug‐17
Oct‐17
Dec‐17
Japa
n Brea
k even
yield
US &
German
y Brea
k Even
Yeild US Breakeven Yld Germany Breakeven Yld
Japan Breakeven Yld
41
Rising inflation may tilt spotlight from equity to other asset classes…
Source: Bloomberg, ICICIdirect.com Research
Subdued inflation reading had kept term premium of bond yields lower in 2017
Increase in Inflation could translate to higher bond yields and lower Equity P/E Multiple
However inflation expectations for 2018 anchored for higher readings
‐1.0
‐0.5
0.0
0.5
1.0
1.5
2.0
1.0
1.2
1.4
1.6
1.8
2.0
2.2
2.4
2.6
2.8
Aug‐12
Dec‐12
Apr‐13
Aug‐13
Dec‐13
Apr‐14
Aug‐14
Dec‐14
Apr‐15
Aug‐15
Dec‐15
Apr‐16
Aug‐16
Dec‐16
Apr‐17
Aug‐17
Dec‐17
Term
Premium
Yield & PCE
10‐Year Breakeven yld (L)Inflation (Core PCE)(L)10‐Year Term Premium (R1)
Higher inflation has potential to partly unwind TINA for equites
Inflation remained elusive in 2017 as inflation fell and drove term premiumand resultant bond yields lower. Inflation outlook for 2018 is relativelystronger for 2018 (crude and commodity price recovery being key catalysts)and remains a key risk.
There is a clear direct relationship between earnings yield (inverse of PE) andbond yield over a long time horizon. Earnings yields have average 1.5x bondyields. Increase in bond yield from current 2.4% (because of higher inflation)will result in a proportionate increase in earnings yield, which may result indeclining PE.
Any inflationary shock has the potential to increase the preference for otherinterest yields assets like bonds.

Middle East turmoil
Rising instability and geopolitical risks in the MiddleEast such as escalation of Saudi coalitionintervention in Yemen, potential conflicts withneighbor Iran could result in severe disruptionsimpacting commodity prices
Russia Opec accord breaks
An extended oil supply agreement between Russiaand Opec for 2018 especially leading oil producerSaudi Arabia faltering could result in supply shockscausing increased volatility in crude prices
Populist vote in Italy triggers
In Europe, a populist win in the Italian election in2018 could also bring Italian membership of the EUor participation in the Euro into question.
Nafta remains contentious
Negotiations between Nafta and US continues tofalter and a failure to agree upon a revisedagreement by early 2018 could result in withdrawalby US from Nafta setting dangerous precedents forany other trade agreements with the US
4242
Deal Team – At Your ServiceRisk factor that may derail ongoing “rationale exuberance” in equities…
China continues to add on their aggregate debt. Its debt to GDP ratioexceeded 30% over its long term average of 220 (fueled by significant rise incorporate debt). Though there is sufficient debt servicing capacity due tocurrent lower interest policy, any sudden spikes in interest rates could exposefinancial risks.
Shutdown in China could translate into future opportunities
A large number of the capacity cuts have occurred in China courtesy pressurefrom the Chinese government albeit with some resistance from local provincesto curb production.
Some of these cuts are basis environmental concerns, while others seek toshut down production and credit both to loss‐making firms with excesscapacity.
Capacity squeeze in industries such as coal, steel, aluminum, textile mills,rubber processing and fertilizers etc. could further heighten a supply squeezein the short run and potentially leave opportunity open for global players.
China debt implosion remains biggest risk in 2018 Political Risks
Source:: Bloomberg, Cnbc, ICICIdirect.com Research
163191 200 195 205 218 230 241 260
300
0
75
150
225
300
375Dec‐08
Dec‐09
Dec‐10
Dec‐11
Dec‐12
Dec‐13
Dec‐14
Dec‐15
Dec‐16
Dec‐17*
China's Debt as a percentage of GDP (%)
(%)

43
Deal Team – At Your ServiceMarket Strategy 2018
Agrarian focused consumption push to alleviate rural stress
2
Capex revival to be key theme in 2018
3
Amid limited domestic challenge, risks to originate outside
4
Sectoral Outlook
5
Fiscal Policy: Limited space for big bang reform
6
Monetary space: Limited respite on rate cuts ahead
7
Consumption, GFCE to drive GDP growth
8
Market Outlook – 2018 to be the year of Stabilisation1
Top Picks for Strategy 20189

44
Which sectors will find favour?
Auto
Source: ICICIdirect.com Research
Capital Goods Cements
Positive Outlook on Sector Neutral Outlook on Sector Negative Outlook on Sector
Banking
We expect Northern region to be a major beneficiary of pent up demand fromrural, Individual House Builder (IHB) segment and government led infra projects.The ongoing infrastructure and housing program of government has potential togenerate cement demand of ~112MT over next 5 years, of which Northern regionwould occupy over 30% share.
While pan-India cement demand would grow at a CAGR of 7.5% over FY17-20E,we expect northern region to grow at a CAGR of over 8.0% over the same period.Further, limited capacity addition (CAGR of 2.0% over FY17-20E) is expected tokeep utilization levels above 80.0% in that region, going forward.
Among the top North based players, we believe JK Cement and JK Lakshmi arelikely to be a key beneficiary of the same as majority (~75%) of their sales are inthe northern region. Further, operating leverage benefit and price improvement isexpected to result in margin expansion of 120 bps and 300 bps for JK Cement andJK Lakshmi over FY17-20E.
• Pick up in capacity utilisations backed by strong growth in auto volumes andrecovery in industrial segments (railways/construction machinery/renewables) inFY19E will be catalyst for strong performance in bearings companies. We expectthe bearings segment to deliver revenue CAGR of 12% over FY17-FY19E backed bypick up in utilisations. Operating leverage will also help EBIDTA margins improveby 100 bps and lead to ~15% PAT CAGR for the entire space in the same period.
• In the EPC space, we like Power T&D space wherein strong backlog and bidingpipeline will drive revenue CAGR of 14-15% for both KEC international andKalpataru power. Strong scale up in newer business like railways, civil EPC andpipeline infra would aid revenue growth and improve margins to 10-11% over thenext three years. Also, improvement in working capital will help keep finance costsmoderate. Consequently KEC and Kalpataru will see PAT CAGR of 23% and 15%respectively. In terms of stock price performance, we expect both the stocks candeliver returns of 23-25% over next 12 months
• PSU banks would be key beneficiaries of resolutions expected under IBC in FY19E,being worst hit in terms of NPA & provisioning expenses. GNPA ratio for them is at13.5% & likely to peak out in FY18E. Asset quality is expected to tread well aheadespecially in H2FY19E. In H1FY19E, bulk of the cases referred under IBC would seeresolutions. Since provisions are already at ~45-50%, improvement in steelindustry, with renewed interest would be positive, particularly for PSU banks as itmay result in write-back of provisions and lower haircuts. Overall provisions inFY19E are expected to be steady
• PSU banks were starved of capital due to higher provisions and recent governmentdecision on recapitalisation bonds worth | 135000 crore equivalent to ~26% ofPSU bank’s networth came as a shot in the arm. PSU banks also raised QIPs of |33000 crore, equivalent to cumulative QIP funds raised by them in the last fiveyears
• Sale of non-core assets may continue for PSU banks. PSU banks are trading at 1xwhile the private banks at 3x on FY19E BV basis. We expect large PSU banks tooutperform with return potential of 25-30% over the next year
• Within the OEM sub-segments (PV, 2-W, CV & tractor), we expect the 2-W space todo well in FY19E (volume growth of ~10%) as lower penetration in key northern ¢ral states, revival in rural economy & new launches provide sufficientheadroom for volume growth. The volume driven operating leverage benefit &increasing share of premium 2-W will boost EBITDA margins, which bolsters ourpositive view on the 2-W space, already characterized by superior profitability (vs.rest of the industry), typically negative working capital & strong cash flow profile.The PV space, however, offers little margin of safety, given that the anticipatedgrowth is broadly factored in the current price levels
• The pace of Electric Vehicle adoption & BS VI implementation by 2020 can pose abusiness risk to the ancillary players, (mainly companies producing InternalCombustion Engine parts) given that it entails huge investments in R&D and threatof new entrants. Hence there is little scope for multiple re-rating in the ancillaryspace (~23x PE FY19E).
• The OEMs, trading at premium valuation of >17x PE FY19E is justified, mainly dueto strong demand & earning visibility (PAT growth of >21% over FY17-19E) in thespace

45
Which sectors will find favour?
Source: ICICIdirect.com Research
Infrastructure
Positive Outlook on Sector Neutral Outlook on Sector Negative Outlook on Sector
FMCG
IT
• With the transition of IT landscape from traditional to digital and client IT spendingpattern towards emerging technologies, Tier-I Indian IT companies are likely towitness single digit growth (5-8% in $ terms) in FY19E owing to higher share oftraditional business (70-80% of revenues).
• Digital Transformation would be key theme for IT companies growth potential (20-30%) currently. Recent Accenture commentary indicates that deal size in this spacemoving from pilot to development phase indicating better deal win. Players suchas Wipro, Mindtree, Persistent & Majesco with acquisitions done in emergingtechnologies space in last few years could benefit from increased deal flow in2018.
• At the CMP, IT players are trading at 13-17x FY19 EPS and also offer healthy FCFyield (4-5% at current level). However, taking cognizance of low earning growthexpectation, valuation are reasonable. Any incremental returns would be in tandemwith pick up in digital contribution and better than expected recovery in demand.Key Risk: Sharp appreciation in rupee, and Protection measures in keygeographies
• Given the low base in FY18 (largely impacted by GST led deferral of sales), CDcompanies are likely to record healthy revenue growth of ~16% YoY in FY19E. Webelieve, cooling product categories such as air conditioners and air coolers torecord healthy volume growth 16% and 19% YoY respectively due to lowerpenetration and rising disposable income (pay hike post 7th pay commission andgovernment’s focus to double the farm income).
• Despite a rising trend of raw materials (crude oil and copper prices) electricalgoods manufacturers would witness a margin expansion in the range of 70-190bps YoY owing to low base in FY18 and price hike with introduction of new energyrating products from January 2018. This would help increase EBITDA margin ofour coverage universe by ~80 bps YoY in FY19E to 15.6%.
• India's shifting preference towards premium products and increasing penetrationof the electrical goods in the country, stands to benefit mid cap electrical goodscompanies. Further asset light model coupled with cash surplus status ofcompanies such as Voltas and Symphony justifies premium valuation for FY19E
• With the GST trade related disruptions waning out, FMCG companies are likely towitness strong volume led growth (11% growth in our FMCG coverage universein FY19) supported by increasing demand from rural India in the wake of goodmonsoons in 2017 and government’s continued thrust on increasing farmincome. Structural reforms like GST have benefited the formal sector. The earlysigns of market share gains by the organised sector can be seen in Q2FY17. Webelieve segments with low penetration levels or segments dominated byunorganised sector like packaged food, dairy products, branded pulses wouldwitness robust growth, going forward
• We believe FMCG companies would witness an inch up in margins (our coverageuniverse would see 50-200 bps margin improvement in FY17-19) in next twoyears as they have stronger pricing power to pass on any commodity price hike.
• We stay positive on GSK consumer and ITC as they are still trading at 25-30%discount to other FMCG companies and we expect this discount to shrink. ITChas been increasing focus on FMCG business that has potential to grow 2-3x innext five to seven years.
• We believe that infrastructure sector is sitting in a sweet spot with government’srenewed focus on sector. Strong EPC opportunities are expected to be driven byroad sector (historic road building program with outlay of | 6.92 lakh crore),railway sector (capex outlay of | 8.5 lakh crore) and housing (government targetingto build 5.6 crore affordable houses) over next 5 years. With this, we expect ourEPC universe orderbook to grow from ~| 1.3 lakh crore in FY17 to ~| 1.8 lakhcrore in FY20E
• Additionally, balance sheet of EPC players has improved from 1.1x to 0.5x in lastthree years, lending us comfort that they are well placed to report improvement inexecution (our EPC universe revenue is expected to grow at 21.5% CAGR overFY17-20E vs. 8.9% CAGR over FY14-17)
• Currently, our EPC universe is trading at attractive valuations of 14-18x P/E (ex-NBCC) against robust earnings growth of ~22% CAGR over FY17-20E.Consequently, we believe there is still some scope for expansion in PE multiplegiven the robust earnings growth, improved balance sheet, burgeoning order bookand strong opportunities ahead.
Consumer Discretionary

46
Which sectors will find favour?
Logistics
Source: ICICIdirect.com Research
Oil and Gas
Positive Outlook on Sector Neutral Outlook on Sector Negative Outlook on Sector
Metals and Mining
Media
• Even after the sharp run-up in stock prices, we continue to prefer entire gas valuechain within the oil and gas space. With increased LNG imports and new fieldscoming in production over the next few years, India’s natural gas output is set togrow, benefiting the gas transmission companies. Domestic gas allocation for citygas distribution and other favourable policies will lead to steady volume led growthfor all gas utility companies. High pricing power will help gas utilities (mainly CGDcompanies) to maintain healthy margins, thus reducing the volatility in the profits,going forward. We expect the earnings to grow at 18.3% CAGR over FY17-19E.
• On the other hand, E&P companies and OMCs profitability will continue to remainvolatile amid sharp fluctuations in oil prices. We remain conservative on OMCs,given the sharp rally witnessed in share prices and challenge to maintain marginson increased private player competition. On the upstream front, although therecent high oil prices augurs well, we remain neutral as we don’t expect anysignificant upside in oil prices. Also, lack of visibility on sustainable volume growthwill limit the upside from the current levels.
• The Indian finished steel consumption grew by 4.2% YoY during YTDFY18E. Onthe back of increased government’s focus on infrastructure, we expect the steeldemand to firm up during FY19E. Amongst the sub-segments, we like playershaving higher exposure to flat steel/value added products in their portfolio due tostable realizations and healthy demand prospects from end user industries such asautomobiles, white goods etc. However on the other hand the prospects of longsteel products are likely to be marred by volatile prices due to commoditizednature.
• With China cutting capacity and subsequent reduction in exports, the domestic flatmanufacturers are well placed in the form of rising utilization levels and continuedpricing support. The domestic players on account of lower cost of production arethus likely to benefit from both import substitution as well as higher exports.
• With resolution of steel companies undergoing Indian Bankruptcy Code (IBC) oncards, the major domestic steel players are well placed to grow inorganicallyunderpinned by strong balance sheet and financial flexibility, which augurs as thedemand is likely to firm up.
We expect surface players with wide network coverage like TCI, Gati and Bluedartto benefit from implementation of the e-way bill. The cost arbitrage provided byunorganised players would fade away given the higher cost of compliance in theGST-era leading to a shift of cargo movement to tax-compliant large-fleet Pan Indiaorganised operators. E-way bill which necessitates prior uploading of informationabout the consignment (above | 50000) on GST portal would to an extent policeunorganised movement and facilitate faster movement of goods.
Higher volumes would result improved operating leverage for multi-modal playerslike TCI, Bluedart and Gati. Subsequently the revenue/EBITDA for surface playersare expected to outpace the overall logistics industry with a growth of 15%/26%for FY19. However, Concor and GPPL are expected to register a revenue growth of14% and 10% respectively.
Overall revenue/EBITDA and PAT for I-direct logistics universe is expected to growby 14%/20% and 24% to | 16106 crore/ | 3022 crore and | 1856 crore,respectively.
• Media sector is expected to report healthy set of ad growth given the low base inFY18 owing to legislations led uncertainty as well as demonetisation aftereffects
• Radio is likely to be the key segment of growth as commencement of newstations and its subsequent stabilisation is likely to boost ad growth (~16-18%) inFY19E, while margins and RoCE expansion is in the offing as new stations break-even.
• The next preferred segment in our pecking order would be Multiplexes, a quasiplay on discretionary spends, which are expected to report healthy ad growth(15-18% in 19E) and ~25% growth in operating profits in FY19E. We, however,note that the box office performance in FY19 would be the key monitorable forthe segment.
• Print with higher share of local advertisers, is likely to witness a slower adrecovery while Broadcasters’ steeper spends into digital/OTT space could limit themargins expansion in FY19E.

47
Which sectors will find favour?
Source: ICICIdirect.com Research
Power
Positive Outlook on Sector Neutral Outlook on Sector Negative Outlook on Sector
Real Estate Retail
Pharma
• The initial hiccups related to sourcing and registering on the GST network arethrough in FY18 and FY19 would earmark a normalised year for organised retailplayers. Incremental benefit of the shift from unorganised to organised wouldresult in above normal (14-15%) revenue growth of 19% in FY19 for our coverageuniverse.
• Branded retail players are emphasizing on increasing its Pan India coveragethrough asset light FOFO (Franchisee Owned Franchisee Operated) models andexpanding in Tier III & IV cities. We expect retail space addition of 2 mn. sq. ft. forour coverage universe in FY19.
• Specialty retail players like Bata and Titan are expected to outpace the retailuniverse revenue/EBITDA growth. We expect Bata to register a revenue/EBITDAgrowth of 16%/26% driven by addition of 150 stores in 2019 and increased shareof premium products which would entail a margin expansion of 100 bps in FY19.Titan is expected to continue store additions (~30 stores in FY19) with increasedfocus on wedding jewellery We expect Titan’s FY19 revenues/EBITDA to grow at23%/27% in FY19.
Recovery in the domestic market post GST implementation has been faster thanexpected. Even products under NLEM (price control) list are also registeringdecent growth. Concerns regarding mandatory generics prescription seems tobe losing its significance for want of clear implementation plan. We expectdomestic market to grow at a CAGR of 12.5% over FY17-20E on the back of newlaunches and volume growth.
On the US front, we expect most of the players to continue to face intensecompetition owing to client consolidation and faster product approvals.
Apart from this, normalized emerging markets currency volatility and newproduct launches especially in biosimilar, respiratory and other complexsegments is likely to support overall growth
We expect I-Direct healthcare coverage revenues, EBITDA and PAT to grow at aCAGR of 7.2%, 5.4% and 6.9% over FY17-20E. We prefer India-focusedcompanies from healthcare coverage.
• In terms of segment, we believe Hydro sector can hog limelight in the wake ofupcoming hydro policy of the government. The key anticipation is increasing theprovisioning of the depreciation and loan repayment period from 15 years to 25years, given the effective life of Hydro plants is relatively higher. This measureswould spread the fixed costs over a longer period and thus help reduce the tariffsof the plant. This measures would make most of the delayed under constructionplants competitive. Such policy measure would help return ratios to improve asCWIP as % of networth will start declining
• Going into CY18, the landscape of the sector will shift to increase in PLF’s across allpower assets (on back of improvement in demand and uptick in industrial activity)and regulations so far enacted resulting into some material action on the ground (resolution to stressed assets, faster enactment of UDAY scheme, allocation of coalunder Shakti leading to operation of stranded plants, improvement in health ofSEB’s and resumption of pace in renewable capacity addition given wind tariffpolicy is in place now).
• Currently, the real estate sector is grappling with triple impact of RERA, GST &demonization resulting in to subdued sales volumes in CY17. Going ahead, weremain optimistic on affordable housing segment amid government’s policy push
• We expect a meaningful pick-up of ~24% CAGR in sales volumes of our real estateuniverse to ~7.5 msf over FY17-19E led by new launches and improvement indemand scenario especially on the affordable side given the government’s focuson the segment. However, we maintain our neutral view on the sector despiteanticipated recovery in volumes as it seems to be priced in the current valuationsof the companies
• Going ahead, any further return expectation (BSE Realty index up 96% in last 1year) in sector would depend on improvement in fundamental drivers such assales volumes.
• On commercial front, office space has annual absorption of ~40 mn sq ft and hasan anticipated supply of 90 mn sq ft over the next three years. We remain positiveon the commercial office space front as it would continue to witness reduction invacancy rate and lease rate could firm up in top cities in 2018, going ahead.
48
Which sectors will find favour?
Source: ICICIdirect.com Research
Telecom
Positive Outlook on Sector Neutral Outlook on Sector Negative Outlook on Sector
Textiles & Apparel
• Post the completion of industry consolidation, we expect pricing to firm up fortelecom operators as top three players are likely to focus on data usage adoption,which would drive the overall ARPU for the industry. In terms of data usage, weexpect overall data volumes to witness 40-45% growth in FY19E, with usage permonth per customer hitting ~5.5 GB vs. current levels of ~3.8-4 GBs. For FY19,however, we expect ARPU growth of ~5% despite IUC cut impact that is likely toimpact ARPU by 4-6%
• On the operators front, we prefer Bharti Airtel, which is a leader not only in termsof subscribers/revenues but also on cost efficiency and capital allocation (prudentacquisitions).
• In the telecom product space, the segment is in a sweet spot given the robustglobal demand of OFC on account of transition to 5G as well as domestic tractionfrom Bharatnet. We expect Sterlite Technologies to report 30%+ revenue andEBITDA growth in FY19E.
We believe innerwear segment to be the biggest beneficiaries of GST, as a largepie (~60%) is dominated by unorganised players. Moreover, innerwear segmentalso has an advantage of lower GST rates (5% vs. earlier 9%) as majority of themare priced less than | 1000. Refreshed focus on premiumisation would drive FY19revenue growth for the companies like Page and Rupa by 25% and 17%respectively.
Coupled with revenue growth innerwear companies would also benefit from lowerinput cost which would aid in margin improvement. According to industryestimates though the cotton yield is expected to be lower by 9% owing to damageby pink ball worms, expansion in cotton acreage by 19% would result 11%increase in cotton production to 375 lakh bales. Subsequently, the cotton prices forthe current procurement season are lower by 10-15% on YoY basis which couldenable margin expansion of 100-150 bps for textile players in FY19.
The initial negative impact due to GST disruption has abated and we expect therevenue/EBITDA for FY19 of our I-direct textile universe is expected to grow by15%/21%.
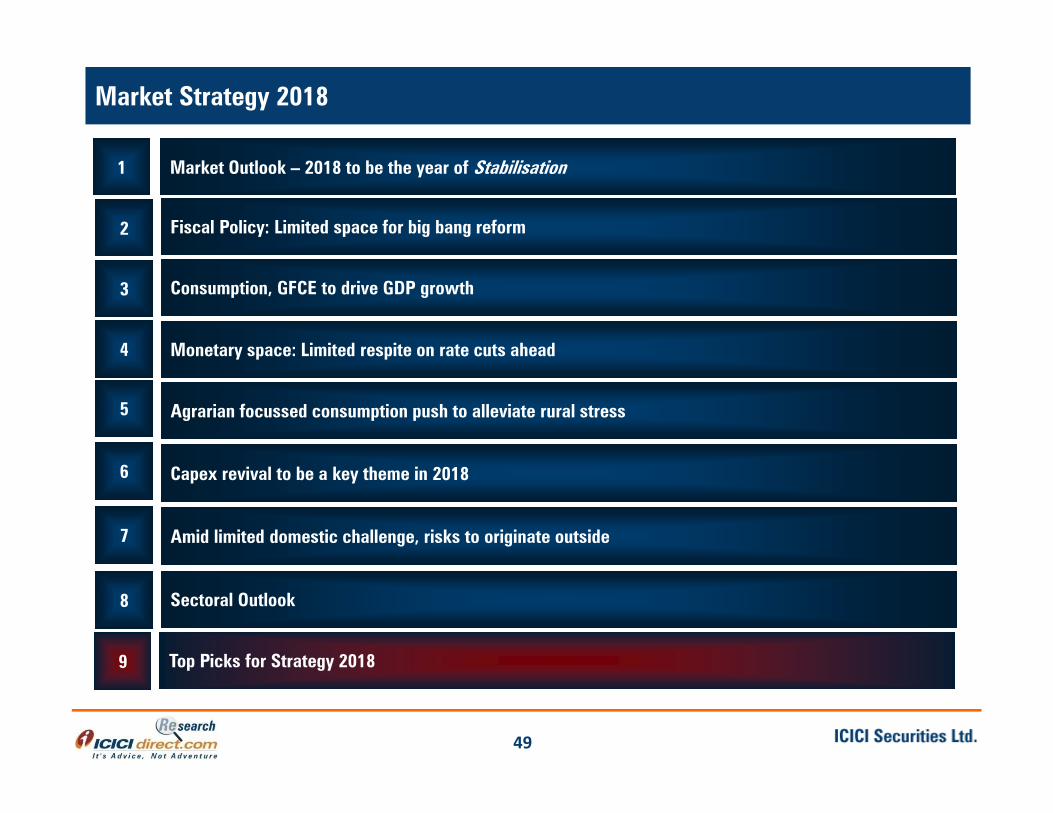
49
Deal Team – At Your ServiceMarket Strategy 2018
Agrarian focussed consumption push to alleviate rural stress
2
Capex revival to be a key theme in 2018
3
Amid limited domestic challenge, risks to originate outside
4
Sectoral Outlook
5
Fiscal Policy: Limited space for big bang reform
6
Monetary space: Limited respite on rate cuts ahead
7
Consumption, GFCE to drive GDP growth
8
Market Outlook – 2018 to be the year of Stabilisation1
Top Picks for Strategy 20189
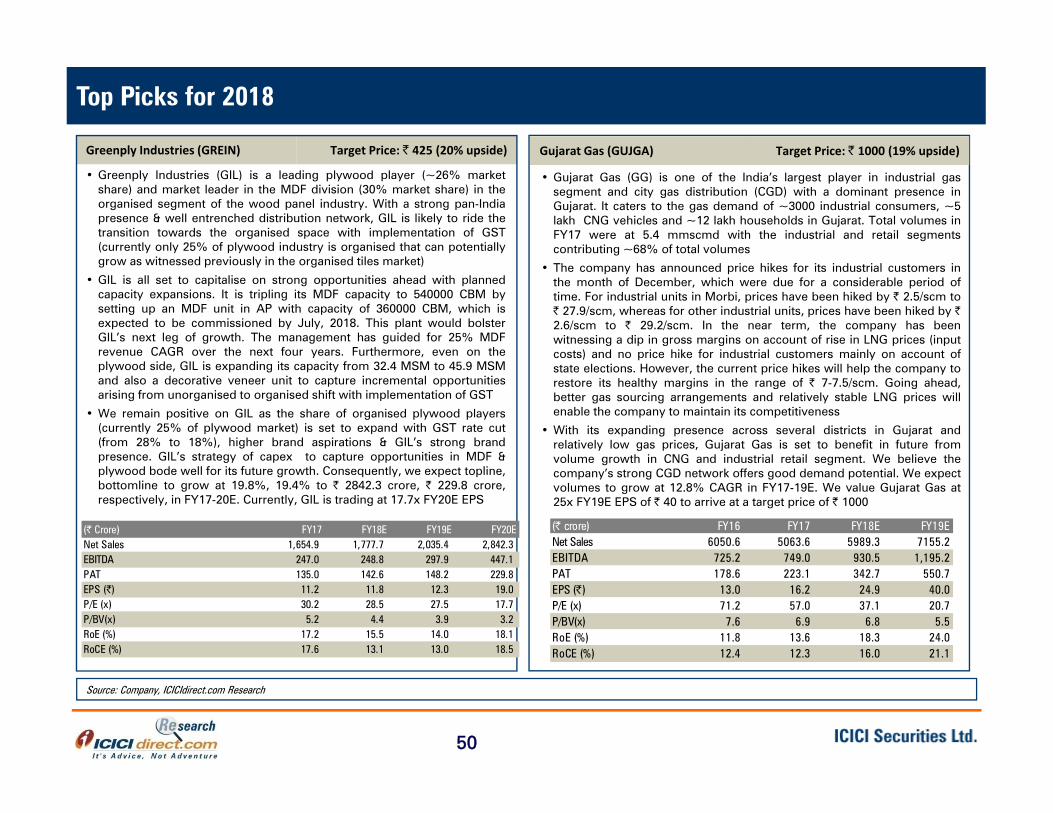
Target Price: | 425 (20% upside)Greenply Industries (GREIN)
• Greenply Industries (GIL) is a leading plywood player (~26% marketshare) and market leader in the MDF division (30% market share) in theorganised segment of the wood panel industry. With a strong pan-Indiapresence & well entrenched distribution network, GIL is likely to ride thetransition towards the organised space with implementation of GST(currently only 25% of plywood industry is organised that can potentiallygrow as witnessed previously in the organised tiles market)
• GIL is all set to capitalise on strong opportunities ahead with plannedcapacity expansions. It is tripling its MDF capacity to 540000 CBM bysetting up an MDF unit in AP with capacity of 360000 CBM, which isexpected to be commissioned by July, 2018. This plant would bolsterGIL’s next leg of growth. The management has guided for 25% MDFrevenue CAGR over the next four years. Furthermore, even on theplywood side, GIL is expanding its capacity from 32.4 MSM to 45.9 MSMand also a decorative veneer unit to capture incremental opportunitiesarising from unorganised to organised shift with implementation of GST
• We remain positive on GIL as the share of organised plywood players(currently 25% of plywood market) is set to expand with GST rate cut(from 28% to 18%), higher brand aspirations & GIL’s strong brandpresence. GIL’s strategy of capex to capture opportunities in MDF &plywood bode well for its future growth. Consequently, we expect topline,bottomline to grow at 19.8%, 19.4% to | 2842.3 crore, | 229.8 crore,respectively, in FY17-20E. Currently, GIL is trading at 17.7x FY20E EPS
50
Deal Team – At Your ServiceTop Picks for 2018
Source: Company, ICICIdirect.com Research
(| Crore) FY17 FY18E FY19E FY20ENet Sales 1,654.9 1,777.7 2,035.4 2,842.3 EBITDA 247.0 248.8 297.9 447.1 PAT 135.0 142.6 148.2 229.8 EPS (|) 11.2 11.8 12.3 19.0 P/E (x) 30.2 28.5 27.5 17.7 P/BV(x) 5.2 4.4 3.9 3.2 RoE (%) 17.2 15.5 14.0 18.1 RoCE (%) 17.6 13.1 13.0 18.5
Target Price: | 1000 (19% upside)Gujarat Gas (GUJGA)
(| crore) FY16 FY17 FY18E FY19ENet Sales 6050.6 5063.6 5989.3 7155.2EBITDA 725.2 749.0 930.5 1,195.2PAT 178.6 223.1 342.7 550.7EPS (|) 13.0 16.2 24.9 40.0P/E (x) 71.2 57.0 37.1 20.7P/BV(x) 7.6 6.9 6.8 5.5RoE (%) 11.8 13.6 18.3 24.0RoCE (%) 12.4 12.3 16.0 21.1
• Gujarat Gas (GG) is one of the India’s largest player in industrial gassegment and city gas distribution (CGD) with a dominant presence inGujarat. It caters to the gas demand of ~3000 industrial consumers, ~5lakh CNG vehicles and ~12 lakh households in Gujarat. Total volumes inFY17 were at 5.4 mmscmd with the industrial and retail segmentscontributing ~68% of total volumes
• The company has announced price hikes for its industrial customers inthe month of December, which were due for a considerable period oftime. For industrial units in Morbi, prices have been hiked by | 2.5/scm to| 27.9/scm, whereas for other industrial units, prices have been hiked by |2.6/scm to | 29.2/scm. In the near term, the company has beenwitnessing a dip in gross margins on account of rise in LNG prices (inputcosts) and no price hike for industrial customers mainly on account ofstate elections. However, the current price hikes will help the company torestore its healthy margins in the range of | 7-7.5/scm. Going ahead,better gas sourcing arrangements and relatively stable LNG prices willenable the company to maintain its competitiveness
• With its expanding presence across several districts in Gujarat andrelatively low gas prices, Gujarat Gas is set to benefit in future fromvolume growth in CNG and industrial retail segment. We believe thecompany’s strong CGD network offers good demand potential. We expectvolumes to grow at 12.8% CAGR in FY17-19E. We value Gujarat Gas at25x FY19E EPS of | 40 to arrive at a target price of | 1000

51
Deal Team – At Your ServiceTop Picks for 2018
Source: Company, ICICIdirect.com Research
Target Price: | 600(27% upside)Kalpataru Power (KALPOW) Target Price: | 1080 (25% upside)KSB Pumps (KSBPUM)
• KSB Pumps (KSB) is a leading pumps & valves manufacturer domestically.It realises ~80% of sales from the pump segment and remaining ~20% ofsales from the valves segment. Within the pumps segment, it realises 35%of sales from the standard product meant primarily for irrigation(agriculture) purposes. It realises remaining 65% of sales from theengineered pump segment (industrial)
• It is one of the unique propositions that offers a twin play of agri +industry and would be a key beneficiary of an increase in farm incomeamidst government spend on rural India. KSB has a good product profile(centrifugal pumps, solar water pumps) with a strong brand recall
• KSB would also be a key beneficiary of a revival of domestic capex cycleparticularly the aggressive capex spend envisaged in the oil & gas space(upgradation of refineries). KSB has recently commissioned a new plant(December 1, 2017), which is intended to be used for manufacturing supercritical power pumps for power and industrial segments. Thus, it providesrequisite capacity to grow, going forward
• KSB has a lean balance sheet with surplus cash on books and possessesbest in class working capital cycle (50 days) among its listed peers. It is atechnology driven organisation with support from the parent group i.e.KSB AG. It also realises healthy core RoICs of ~15%+. Over CY17-20EKSB will generate average CFO of ~| 120 crore, thereby offering animpressive CFO yield of ~4% Going forward, we expect KSB to recordsales & PAT CAGR of 12.4% & 24.2%, respectively, in CY17-19E. We valueKSB at 35x P/E on CY19E EPS of | 30.7 and assign a target price of | 1080with a BUY rating on the stock
(| Crore) CY16 CY17E CY18E CY19ENet Sales 817.6 885.7 1,010.6 1,119.8 EBITDA 99.1 106.8 135.2 157.3 PAT 65.3 69.2 89.3 106.8 EPS (|) 18.8 19.9 25.6 30.7 P/E (x) 48.0 45.3 35.1 29.3 P/BV(x) 4.9 4.5 4.2 3.8 RoE (%) 10.1 10.0 11.9 12.9 RoCE (%) 10.6 10.8 13.1 14.2
(| Crore) FY17 FY18E FY19E FY20ENet Sales 4,855.5 5,472.4 6,144.1 7,197.8 EBITDA 546.3 649.0 714.4 848.8 PAT 264.9 325.0 360.7 449.2 EPS (|) 17.3 21.2 23.5 29.3 P/E (x) 27.5 22.4 20.2 16.2 P/BV(x) 2.9 2.6 2.3 2.1 RoE (%) 10.5 11.6 11.5 12.7 RoCE (%) 15.0 16.3 16.3 17.7
• Kalpataru power is a leading power T&D EPC player with well diversifiedoperations in both domestic and international markets. The company hasalso emerged as leading EPC player in the railways and oil & gas pipelineinfrastructure. It also has exposure via 67.2% stake in civil EPC businessvia stake in JMC projects and 70% stake in logistics subsidiary.
• As of H1FY18, KPTL commands a strong order backlog of | 9620 crorewhich renders comfortable revenue visibility till FY20E. Till H1FY18, thecompany has won significant orders to the tune of |5023 crore. Goingahead, opportunities in power T&D space (international markets), railwaysand pipeline segment will add to order wins. Hence, we have built in orderinflow of | 8900 crore and |9100 crore in FY18E and FY19E respectively.With robust wins in infrastructure segment (railways and pipeline) will seerevenue CAGR of 32% over FY17-FY20E while overall revenues are likelyto witness revenue CAGR of 14.8% in the same period. EBITDA marginsare likely to be in 11-11.8% range which result in PAT CAGR of 16.5%..
• JMC’s improved performance and robust outlook in the core EPCbusiness and lower capex intensity in BOT assets will further aid theconsolidated performance while the logistics subsidiary is likely to turnaround at PBT level by FY19E will further add to the performance. .
• Strong outlook of 18% PAT CAGR in the base business and improvedperformances of subsidiaries will help improve the ROCE of KPTL 13.6%in FY17 to 16.3% in FY20E which will rerate the stock. We value it on aSoTP basis and assign a target of |600/share.

Target Price: | 360 (21% upside)Narayana Hrudayalaya (NARHRU)
52
Deal Team – At Your ServiceTop Picks for 2018
Source: Company, ICICIdirect.com Research
• Narayana Hrudayalaya (NHL) operates as a chain of multispecialtyhospitals. Started predominantly in Karnataka and Eastern India, thecompany is growing its footsteps in western and northern India as well
• NHL has a legacy model based on affordability over the years. Due tostrict control over costs and capital, the company has been makingreasonable profit. However, as it is looking to scale up in other regions,where the consideration for quality has more weight than affordability, themodel is likely to be modified to a mix of ‘affordable + quality’
• NHL mostly follows an asset right model. Under this model, partnersinvest in land and building while NHL takes care of medical equipmentand hospital management on a revenue share basis. This is why NHL’sbalance sheet is one of the lightest among peers. However, themanagement has maintained a flexible approach in this regard
• In a conducive but challenging space of Indian healthcare delivery,plagued by longer gestation periods, low operating margin, leveragedbalance sheets and low return ratios, we believe NHL is best placedamong peers to sail through. Its legacy model is based on affordability.Hence, conscious efforts towards cost & capital control are embedded inthe management’s long term strategy. On the other hand, it is alsodetermined to improve ARPOB by improving case mix, occupancies, thusfine-tuning affordability with profitability. We arrive at an SOTP targetprice of | 360 by valuing the matured hospitals and Cayman Islandshospital at 14x FY20E EV/EBITDA and other hospitals and otherbusinesses.(| crore) FY16 FY17 FY18E FY19E FY20ERevenues 1613.9 1878.2 2269.7 2665.0 3021.5EBITDA 174.6 228.9 254.3 311.4 409.7Net Profit 32.2 84.4 89.0 136.2 203.4EPS (|) 1.6 4.1 4.4 6.7 10.0P/E (x) 286.0 73.1 69.1 44.6 29.8EV/EBITDA (x) 36.0 27.2 24.9 20.1 14.8RoCE (%) 8.8 12.5 11.9 14.4 18.7RoE (x) 3.7 8.8 8.5 11.5 14.6
Target Price: | 750 (31% upside)Simplex Infrastructure (SIMINF)
• Simplex Infrastructure (SIL) is a focused EPC player in the infrastructurespace with presence in several verticals like roads, railways, buildings &housing, power & piling, etc. The company has very little exposuretowards BOT project portfolio. The company has a robust orderbook of| 17301 crore, 3.0x order book to bill ratio, providing strong revenuevisibility. With presence in various verticals, the company is expected tobenefit from government’s renewed focus on infrastructure development
• SIL’s debt is at | 3611 crore as on Q2FY18 (D/E: 2.1x). The company aimsto reduce its debts through receipt of old debtors, which makes it a strongcase for re-rating given its attractive valuation (10x FY20E). It is looking torecover ~| 450-500 crore in FY18E and | 800 crore in FY19E from olddebtors. Furthermore, SIL expects to receive | 100 crore from theBangladesh project by the year end. We believe that an improvement inits working capital position & consequent debt reduction will boost itsbottomline growth. Consequently, we expect SIL’s bottomline to growrobustly at 33.2% CAGR to | 284.1 crore in FY17-20E
• We like Simplex Infrastructure given its focused approach towards theEPC business, healthy order book and its strong execution capabilities. Inour view, SIL would be a key beneficiary of the government’s renewedfocus on infrastructure development. Furthermore, the working capitalposition of the company is expected to improve soon post recovery fromold debtors to the tune of ~| 450-500 crore by the year end. This couldlead to debt repayment and subsequent improvement in the profitability.The stock is currently trading at 10.1x FY20E EPS
(| crore) FY17 FY18E FY19E FY20ENet Sales 5,607.5 6,159.2 6,941.5 7,853.4 EBITDA 688.7 774.9 887.2 1,003.8 PAT 120.3 169.9 206.8 284.1 EPS (|) 24.3 34.3 41.8 57.4 P/E (x) 24.0 17.0 13.9 10.1 P/BV(x) 1.9 1.7 1.5 1.3 RoE (%) 7.9 10.0 10.8 12.9 RoCE (%) 11.8 12.8 14.1 15.4

Target Price: | 575 (18% upside)Bajaj Electricals Ltd (BEL)
53
Deal Team – At Your ServiceTop Picks for 2018
Source: Company, ICICIdirect.com Research
• South Indian Bank (SIB) is an old private sector bank from Kerala. It hasstrong presence in southern India with 80% of total 851 branches there.As on Q2FY18, the advances grew 12% YoY | 48954 crore. Deposits wereat | 67142 crore (up 11.5% YoY) with CASA ratio at 24.6%
• Post 25% CAGR in loans (led by corporate segment) during FY09-14, thebank witnessed large NPA stress in FY14-17. The GNPA ratio rose to 4%in Q2FY17 and is now at 3.6% (| 1766 crore) as on Q2FY18 vs. 1-1.3%range before FY14. However, the bank has been addressing the NPAissue by recognising & adequately providing for it. Provisioning expenseswere at | 678 crore in H1FY18 vs. | 614 crore seen for full year FY17.There are no accounts under the watchlist from corporate book. The bankhas | 886 crore exposure to IBC related accounts (most of it sold to ARCs& now has security receipts) for which provisions are in 25-50% range.Current PCR at 40% is set to improve to >60%, which is factored by us.
• Owing to asset quality woes & a weak economy in FY14-17, credit growthwas impacted & was at 8.6% CAGR. The bank has guided for credittraction of ~18-20% led by retail & SME. NIM is now back to 2.9% levels.We expect the average 2.8-2.9% to sustain. This would drive healthytraction of ~18% CAGR in operating earnings
• Improving operating income would reflect positively on the bottomline.PAT could improve to~| 800 crore by FY20E from ~| 400 crore in FY17.RoE seen improving to 13-15% range while the RoA can reach ~0.9-1%.At the CMP, the stock is available at 1.1x FY20E ABV. Focus on cleaningup the balance sheet, rise in credit traction and return ratios shall warranta higher multiple. Risk-reward ratio seems favourable at current levels
Target Price: | 40 (27% upside)South Indian Bank (SOUBAN)
| crore FY17 FY18E FY19E FY20ENII (| crore) 1,675.0 2,000.0 2,280.0 2,668.0PPP (| crore) 1215.0 1447.0 1618.0 1928.2PAT (| crore) 393.0 240.7 568.1 800.0EPS (|) 2.2 1.3 3.2 4.7PE (x) 14.4 23.7 9.9 6.7P/ABV (x) 1.4 1.3 1.2 1.1ROA (%) 0.4 0.3 0.7 0.9ROE (%) 8.1 4.8 10.8 14.4
• BEL, a well-known brand in the consumer durable (CD) segment,witnessed a muted performance in the last three years. This was led byvarious company & macro level developments such as elimination ofwholesale chain (through RREP model), demonetisation andimplementation of GST. However, we believe a) completion of RREP(Range Reach Expansion Programme) coupled with implementation ofGST (to favour organised players) by Q4FY18 and b) given lowerpenetration and rising income of the Indian middle class and ruralhousehold (owing to good monsoon), would help drive sales of consumerdurables, going forward. This would help CD revenues grow at 14%CAGR in FY18E-20E with an improvement in EBIT margin (owing tohigher operating leverage) to 6%. On the EPC front, we believe thecompany will continue to perform well on the back of higher governmentexpenditure towards power infrastructure in India.
• Bajaj being a strong brand in the economic CD products segment wouldbe a direct beneficiary of GST and the government’s push to ‘double farmincome’ by FY22. This would start driving the market share in favour ofBEL. As a result, BEL’s CD EBIT margin may improve 170 bps to 6% byFY20E from FY17 level. We expect BEL to achieve an operating profit of |117 crore from the segment with margins of 5% in FY20E. We believeBEL’s revenue, earning will grow at a CAGR of 14% and 30%,respectively, in FY18E-20E, with an improvement in EBITDA margin
• Under our SOTP based valuation, we value BEL’s CD segment MCap at1.8x FY20E sales (~40% discount to peers) and E&P segment at 7x FY19EEV/EBITDA. We recommend BUY with target price of | 575/share.
(| crore) FY16 FY17 FY18E FY19E FY20ENet Sales 4626.7 4298.3 4347.3 4798.1 5638.9EBITDA 264.2 242.8 215.7 251.8 307.3PAT 110.3 107.7 100.0 135.8 170.4EPS (|) 10.9 10.6 9.9 13.4 16.8P/E (x) 45.3 46.4 49.9 36.8 29.3P/BV (x) 6.6 5.7 5.6 5.0 4.4RoE (%) 14.6 12.4 11.1 13.6 15.0RoCE (%) 17.2 16.7 15.6 17.4 19.4
Pankaj Pandey Head – Research [email protected]
ICICIdirect.com Research Desk,ICICI Securities Limited,1st Floor, Akruti Trade Centre,Road No 7, MIDCAndheri (East)Mumbai – 400 [email protected]
Disclaimer
ANALYST CERTIFICATIONWe /I, Pankaj Pandey, Research Analysts, authors and the names subscribed to this report, hereby certify that all of the views expressed in this research report accurately reflect our views about thesubject issuer(s) or securities. We also certify that no part of our compensation was, is, or will be directly or indirectly related to the specific recommendation(s) or view(s) in this report.
Terms & conditions and other disclosures:ICICI Securities Limited (ICICI Securities) is a Sebi registered Research Analyst having registration no. INH000000990. ICICI Securities Limited (ICICI Securities) is a full-service, integrated investmentbanking and is, inter alia, engaged in the business of stock brokering and distribution of financial products. ICICI Securities is a wholly-owned subsidiary of ICICI Bank which is India’s largest privatesector bank and has its various subsidiaries engaged in businesses of housing finance, asset management, life insurance, general insurance, venture capital fund management, etc. (“associates”), thedetails in respect of which are available on www.icicibank.com.ICICI Securities is one of the leading merchant bankers/ underwriters of securities and participate in virtually all securities trading markets in India. We and our associates might have investmentbanking and other business relationship with a significant percentage of companies covered by our Investment Research Department. ICICI Securities generally prohibits its analysts, personsreporting to analysts and their relatives from maintaining a financial interest in the securities or derivatives of any companies that the analysts cover.The information and opinions in this report have been prepared by ICICI Securities and are subject to change without any notice. The report and information contained herein is strictly confidentialand meant solely for the selected recipient and may not be altered in any way, transmitted to, copied or distributed, in part or in whole, to any other person or to the media or reproduced in anyform, without prior written consent of ICICI Securities. While we would endeavour to update the information herein on a reasonable basis, ICICI Securities is under no obligation to update or keep theinformation current. Also, there may be regulatory, compliance or other reasons that may prevent ICICI Securities from doing so. Non-rated securities indicate that rating on a particular security hasbeen suspended temporarily and such suspension is in compliance with applicable regulations and/or ICICI Securities policies, in circumstances where ICICI Securities might be acting in an advisorycapacity to this company, or in certain other circumstances.This report is based on information obtained from public sources and sources believed to be reliable, but no independent verification has been made nor is its accuracy or completeness guaranteed.This report and information herein is solely for informational purpose and shall not be used or considered as an offer document or solicitation of offer to buy or sell or subscribe for securities orother financial instruments. Though disseminated to all the customers simultaneously, not all customers may receive this report at the same time. ICICI Securities will not treat recipients ascustomers by virtue of their receiving this report. Nothing in this report constitutes investment, legal, accounting and tax advice or a representation that any investment or strategy is suitable orappropriate to your specific circumstances. The securities discussed and opinions expressed in this report may not be suitable for all investors, who must make their own investment decisions,based on their own investment objectives, financial positions and needs of specific recipient. This may not be taken in substitution for the exercise of independent judgment by any recipient. Therecipient should independently evaluate the investment risks. The value and return on investment may vary because of changes in interest rates, foreign exchange rates or any other reason. ICICISecurities accepts no liabilities whatsoever for any loss or damage of any kind arising out of the use of this report. Past performance is not necessarily a guide to future performance. Investors areadvised to see Risk Disclosure Document to understand the risks associated before investing in the securities markets. Actual results may differ materially from those set forth in projections.Forward-looking statements are not predictions and may be subject to change without notice.ICICI Securities or its associates might have managed or co-managed public offering of securities for the subject company or might have been mandated by the subject company for any otherassignment in the past twelve months.ICICI Securities or its associates might have received any compensation from the companies mentioned in the report during the period preceding twelve months from the date of this report forservices in respect of managing or co-managing public offerings, corporate finance, investment banking or merchant banking, brokerage services or other advisory service in a merger or specifictransaction.ICICI Securities or its associates might have received any compensation for products or services other than investment banking or merchant banking or brokerage services from the companiesmentioned in the report in the past twelve months.ICICI Securities encourages independence in research report preparation and strives to minimize conflict in preparation of research report. ICICI Securities or its analysts did not receive anycompensation or other benefits from the companies mentioned in the report or third party in connection with preparation of the research report. Accordingly, neither ICICI Securities nor ResearchAnalysts have any material conflict of interest at the time of publication of this report.It is confirmed that Pankaj Pandey, Research Analyst of this report has not received any compensation from the companies mentioned in the report in the preceding twelve months.Compensation of our Research Analysts is not based on any specific merchant banking, investment banking or brokerage service transactions.ICICI Securities or its subsidiaries collectively or Research Analysts do not own 1% or more of the equity securities of the Company mentioned in the report as of the last day of the month precedingthe publication of the research report.Since associates of ICICI Securities are engaged in various financial service businesses, they might have financial interests or beneficial ownership in various companies including the subjectcompany/companies mentioned in this report.It is confirmed that Pankaj Pandey, Research Analyst do not serve as an officer, director or employee of the companies mentioned in the report.ICICI Securities may have issued other reports that are inconsistent with and reach different conclusion from the information presented in this report.Neither the Research Analysts nor ICICI Securities have been engaged in market making activity for the companies mentioned in the report.We submit that no material disciplinary action has been taken on ICICI Securities by any Regulatory Authority impacting Equity Research Analysis activities.This report is not directed or intended for distribution to, or use by, any person or entity who is a citizen or resident of or located in any locality, state, country or other jurisdiction, where suchdistribution, publication, availability or use would be contrary to law, regulation or which would subject ICICI Securities and affiliates to any registration or licensing requirement within suchjurisdiction. The securities described herein may or may not be eligible for sale in all jurisdictions or to certain category of investors. Persons in whose possession this document may come arerequired to inform themselves of and to observe such restriction..