ids-912 ndia te conference- statistically-based test ... · statistically - based test optimization...
TRANSCRIPT

Statistically-Based Test Optimization Strategies
23rd Annual NDIA Test & Evaluation ConferenceMarch 13, 2007
Neal Mackertich, Ph.DRaytheon Integrated Defense Systems
© 2007, Raytheon Co., All Rights Reserved

© 2007, Raytheon Co., All Rights Reserved Page 1N. Mackertich
Best Practices in Statistically-Based Test Optimization
Why, What , When & How: There are lots of meaningful testing questions and opportunities to explore…
The focus of this presentation is to share with you three industry cited best practices around the use of statistically - based test optimization strategies:
• Usage-based Statistical Testing• Combinatorial Design Methods• Critical Parameter Management

© 2007, Raytheon Co., All Rights Reserved Page 2N. Mackertich
What to Test?
Okay, let’s say we need to test a system or subsystem…
How do we typically determine what test cases to run?

© 2007, Raytheon Co., All Rights Reserved Page 3N. Mackertich
Usage-Based Statistical Testing
• Use-Based Statistical testing emphasizes the operational scenarios most likely to occur
Least Likely Most Likely
The Universe of possible test cases

© 2007, Raytheon Co., All Rights Reserved Page 4N. Mackertich
Usage-Based Statistical Testing
• Testing based on the way the system / product is to be operational used.
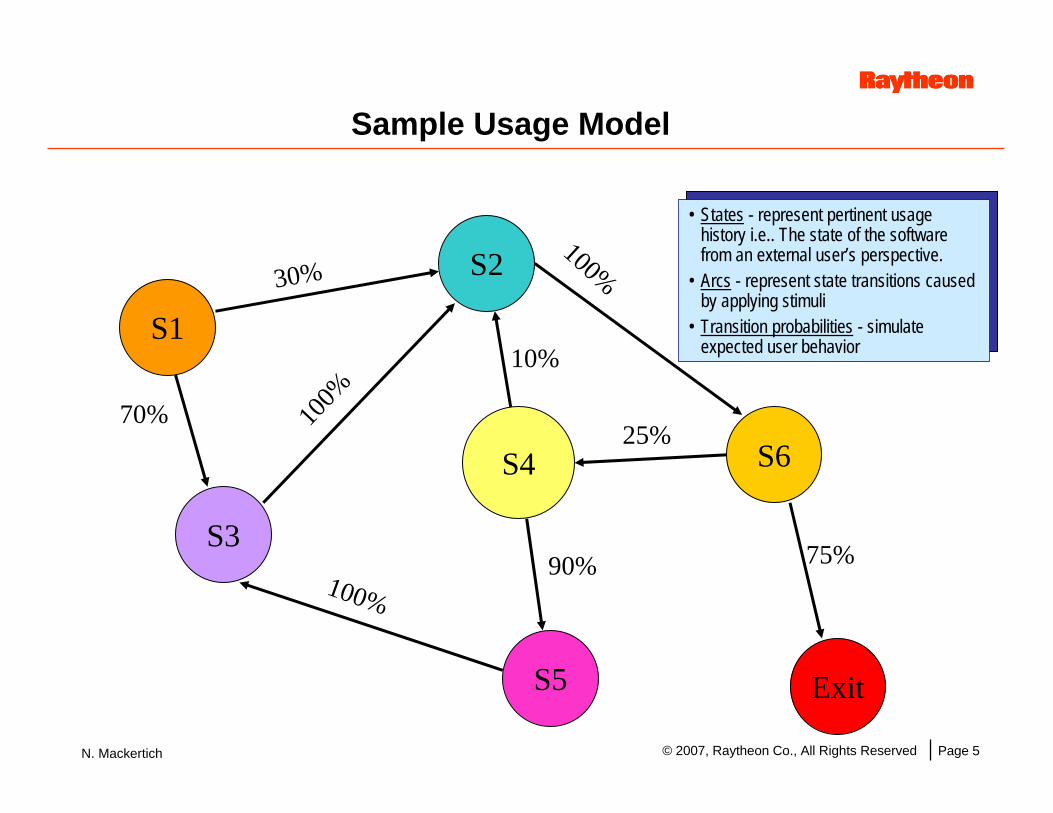
• A “Use Case” state diagram (in the form of a Markov Model) is used to generate a representative, random sample usage so statistical methods can be applied to model System behavior.
• Specific test case generation is accomplished using input stimuli selected via a random walk through the Markov chain.
© 2007, Raytheon Co., All Rights Reserved Page 5N. Mackertich
Sample Usage Model
S1
S3
S5 Exit
S4
S2
S6
30%
70% 100%
100%
10%
100%
25%
75%90%
• States - represent pertinent usage history i.e.. The state of the software from an external user’s perspective.
• Arcs - represent state transitions caused by applying stimuli
• Transition probabilities - simulate expected user behavior

© 2007, Raytheon Co., All Rights Reserved Page 6N. Mackertich
Usage-Based Statistical Testing- Case Study Results
• Escaping defects were less than previous methods (1.16 defects per KSLOCs Vs. 6-defects/ KSLOCs) from previous testing method.
• Development costs met budgets.
• Major functions were integrated quickly.
• Poll was taken with the leads about whether to use this statistical testing on a follow-on program; results were unanimous to use statistical testing for next project which has already started!!

© 2007, Raytheon Co., All Rights Reserved Page 7N. Mackertich
What are Combinatorial Design Methods?
• A testing methodology in which a subset of all possible combinations is chosen such that all N-way combinations are tested.
• Covering all 2 way combinations would require that for any two factors A and B, where Ai and Bi are valid levels for A and B, there is a test for all Ai and Bi combinations.

© 2007, Raytheon Co., All Rights Reserved Page 8N. Mackertich
Why not DOE?
The use of proven statistical / combinatorial methods can be very helpful here…
But why not just use Design of Experiments (DOE) techniques?

© 2007, Raytheon Co., All Rights Reserved Page 9N. Mackertich
CDM Advantages
• The use of N-way combinations provide reasonable, balanced coverage across the test space.
• More realistic than full/fractional designs– Compatible with constraints– Compatible with factors at different levels– Can account for previous test
• Drastically reduces the total number of test cases when compared to all combinations.
• Since generating test cases is very quick and simple, there are no major barriers to using CDM as part of the testing process.
• Can be used in almost all phases of testing.

© 2007, Raytheon Co., All Rights Reserved Page 10N. Mackertich
Black-Box Testing Scenario
22 Test Cases2 Way Combinations
1920 Test CasesAll Combinations
If Destination Format is GIF, then # colors cannot be 16 bit or 24 bit.Constraints
Correct conversion (True or False)Outputs
Source Format (GIF, JPG, TIFF, PNG)Dest. Format (GIF, JPG, TIFF, PNG)Size (Small, Med, Large)# colors (4 bit, 8 bit, 16 bit, 24 bit)Destination (Local drive, network drive)Windows Version (95, 98, NT, 2000, Me)
Inputs
Graphics manipulation function that converts from one format to another.Example Application
Black-box type testing geared to functional requirements of an application.Definition

© 2007, Raytheon Co., All Rights Reserved Page 11N. Mackertich
Regression Testing Scenario
32 Test Cases2 Way Combinations
1620 Test CasesAll Combinations
If Destination Format is GIF, then # colors cannot be 16 bit or 24 bitConstraints
Correct conversion (True or False)Outputs
Source Format (GIF, JPG, TIFF, PNG, WMF)Dest. Format (GIF, JPG, TIFF, PNG, WMF)Size (Small, Med, Large)# colors (4 bit, 8 bit, 16 bit, 24 bit)Destination (Local drive, network drive)Windows Version (95, 98, NT, 2000, Me, XP)
Inputs
Graphics functionality on previous page must be expanded to support a new file format (WMF) and a new OS (Windows XP).
Example Application
Re-testing after fixes or modifications of the software or the environment in which the software operates.
Definition

© 2007, Raytheon Co., All Rights Reserved Page 12N. Mackertich
CDM- Case Study Application
• Testing program requirements– Factory Acceptance Test (FAT) Dry Run– FAT– Site Acceptance Test (SAT) Dry Run– SAT
• Not realistic to do exhaustive testing of all 144 possible System test scenarios
• Quasi-Exhaustive strategy invented– 100% of tests for FAT Dry Run– 10% of tests, selected at random, for FAT– 50% of tests, selected at random, for SAT Dry Run– 10% of tests, selected at random, for SAT

© 2007, Raytheon Co., All Rights Reserved Page 13N. Mackertich
CDM Case Study- A Comparison of Strategies
Quasi-Exhaustive Strategy FAT Dry Run FAT SAT Dry Run SAT Number of test cases 144 15 72 15 Time spent writing test procedures
49.00 hours 0.00 hours 8.00 hours 0.00 hours
Time spent performing data paths test procedures
73.25 hours 8.75 hours 55.00 hours 12.25 hours
Number of persons involved in testing
1 3 3 4
Total Labor Hours 370.5 hours (46.3 days)
CDM Strategy FAT Dry Run FAT SAT Dry Run SAT
Number of test cases 12 12 12 12 Time spent writing test procedures
16.00 hours 0.00 hours 3.00 hours 0.00 hours
Time spent performing data paths test procedures
7.25 hours 7.25 hours 10.00 hours 10.00 hours
Number of persons involved in testing
1 3 3 4
Total Labor Hours 118.0 hours (14.8 days)

© 2007, Raytheon Co., All Rights Reserved Page 14N. Mackertich
Bottom Line Comparison(Time-to-Market Savings)
• CDM Strategy was superior to Quasi-Exhaustive Strategy– Schedule savings = 68%– Cost savings (labor) = 67%

© 2007, Raytheon Co., All Rights Reserved Page 15N. Mackertich
What is Critical Parameter Management?
• A disciplined methodology for managing, analyzing, and reporting technical product performance.
• A process for mathematically linking system parameters for sensitivity analysis and optimization of critical performance threads.
• A strategic tool for improving product development by unifying and integrating systems, design, manufacturing and test activities.
CPM = TPMs + Other parameters critical to functionality, cost, schedule or customer

© 2007, Raytheon Co., All Rights Reserved Page 16N. Mackertich
Performance Analysis
CPM Statistically Flow-Up Design, Supplier and Manufacturing Capabilities Exposing Performance Risks and Opportunities
X’s
Y’s
Y’sRisk
Opportunity
“The System Can….”

© 2007, Raytheon Co., All Rights Reserved Page 17N. Mackertich
Whitepaper Management and Task Delegation
Engineering Documents and Whitepaper Analyses
Attach Engineering Documents, Models, and Whitepaper Analysis.
Connect people to analyses, requirements, and performance measures.

© 2007, Raytheon Co., All Rights Reserved Page 18N. Mackertich
CPM Program Benefits
• Facilitate Analysis– Statistical modeling & optimization of the performance – cost trade space – Real-time System-level sensitivity analysis – Connects analyses between system, subsystem and component levels
• Improve Collaboration– Shares technical analysis and knowledge– Links ownership to parameters– Mathematically connects Program teams and parameters to understand
requirement flow-down– Captures and leverages invested intellectual capital for future business reuse
• Enable TPM Management and Reporting– TPM design margins are statistically tracked over product lifecycle– Automated, real-time TPM data gathering / report generation– Reconciliation of requirement allocation and engineering design capability

© 2007, Raytheon Co., All Rights Reserved Page 19N. Mackertich
DFSS Statistical Performance Analysis
A
B
C
D
E
Y
Y = f (A, B, C, D, E, F,...,M)0
0.02
0.04
0.06
0.08
0.1
0.12
0.14
0.16
0.18
180
187
194
201
208
215
222
229
236
243
250
0
0.1
0.2
0.3
0.4
0.5
0.6
0.7
0.8
17
17.6
18.2
18.8
19.4 20
20.6
21.2
21.8
22.4 23
0
0.2
0.4
0.6
0.8
1
1.2
1.4
15
15.8
16.6
17.4
18.2 19
19.8
20.6
21.4
22.2 23
0
0.2
0.4
0.6
0.8
1
1.2
1.4
15
16.5 18
19.5 21
22.5 24
25.5 27
28.5 30
0
0.2
0.4
0.6
0.8
1
1.2
1.4
15
16.5 18
19.5 21
22.5 24
25.5 27
28.5 30
Response
F
G
H
I
J
K
L
M
0
0.05
0.1
0.15
0.2
0.25
15
16.5 18
19.5 21
22.5 24
25.5 27
28.5 30
Design Variables
Allocation/Flow Down

© 2007, Raytheon Co., All Rights Reserved Page 20N. Mackertich
Statistical Performance Analysis Results In…
• A prediction of the Response Statistical Properties
• A prediction of the Probability of Non-Compliance
• An assessment of the Contribution of Parameter Variation to Response Performance and Cost
A
B
C
D
E
Y
f (A, B, C, D, …)
Parameters
Response
F
G
H
I
J
K
L
M
Function
G-Sys. Losses -.45
A-Pavg .35
D-Ant. Eff, .35
F-Integ. Eff. .34
J-Rec. BW -.34
B-Ant. Gain .29
H-Tgt RCS .23
C-Ant. Aperture .21
K-Pulse Width -.19
M-Rec. Out SNR -.15
I-Noise Figure -.12
L-Rep. Freq. -.03
-1 -0.5 0 0.5 1Measured by Rank Correlation
Certainty is 95.12% from 4.00E+1 to 5.30E+1
.000
.007
.014
.020
.027
0
33.75
67.5
101.2
135
3.75E+1 4.25E+1 4.75E+1 5.25E+1 5.75E+1
Prob(LL<Y<UL)
.000
.007
.014
.020
.027
3.75E+1 4.25E+1 4.75E+1 5.25E+1 5.75E+1
PDF(Y)
Results from Crystal Ball® Monte Carlo SW

© 2007, Raytheon Co., All Rights Reserved Page 21N. Mackertich
Traditional TPM Stoplight Reporting
TPM Number Description Aug '05 Sep '05 Oct '05 Nov '05 Dec '05 CDRJan '06
TPM-001 Single Pulse Sensitivity G G G G G GTPM-002 Search Sensitivity G G G G G GTPM-003 Range Accuracy G G G G G GTPM-004 Angle Accuracy G G G G G GTPM-005 RCS Accuracy G G G G G GTPM-006 Phase Stability Y Y Y Y Y GTPM-007 Polarization Isolation G G G G G GTPM-008 Ellipticity Y Y Y Y Y GTPM-009 Range Sidelobe Level G G G G G GTPM-010 Range Resolution G G G G G GTPM-011 2-Way Notch Depth (combined) Y G G G G GTPM-012 Receive Pattern Sidelobe Level Y G G G G GTPM-013 Weight G G G G G G
G Meets Requirement with MarginY Meets Requirement with No MarginR Does Not Meet Requirement
Previous TPM Reporting / Tracking method is vague and ambiguous with respect to the design margin for each metric. TPM report was only
tracked and managed on a monthly basis for the tracking book.

© 2007, Raytheon Co., All Rights Reserved Page 22N. Mackertich
Statistically-Based TPM Reporting / Management
⎟⎟⎠
⎞⎜⎜⎝
⎛ −−=
sxLSL
sxUSLCpk
*3,
*3min
Statistically track design capability and requirement by establishing upper and lower limitsMonitor design capability and requirement convergence over product lifecycle:
- IPDR, PDR, CDR etc.-Design, Manufacturing, Integration, Test
Probability of Non-Compliance
Cp and Cpk
sLSLUSLCp
6−
=

© 2007, Raytheon Co., All Rights Reserved Page 23N. Mackertich
New Automated TPM Reporting Format
Block Name:
CFR (Y) Spec Owner Units Lower UpperCode Limit Nominal Limit Nominal Mean Std. Dev. Cp Cpk Mean Std. Dev. Cp Cpk
TPM 1 R 0.9400 0.9600 0.9990 0.9672 1.9040 0.6238 0.0158 -0.9836 0.0000TPM 2 R 6.0000 8.0000 11.0000 7.0000 9.5000 0.5833 1.4286 0.3571 0.0000TPM 3 Y 43.0000 45.0000 49.0000 43.0000 42.7500 0.3750 2.6667 -0.7222 0.0000TPM 4 G 14.0000 17.0000 19.0000 16.0000 16.5000 0.4167 2.0000 1.5000 0.0000TPM 5 G 0.1000 0.1200 0.1600 0.1250 0.1250 0.0008 12.0000 9.5000 0.0000TPM 6 R 4.0000 6.8000 8.0000 7.0000 7.0000 0.0833 8.0000 3.5000 0.0000TPM 7 Y 0.4000 1.0000 1.2000 0.6000 0.7000 0.0333 4.0000 2.8333 0.0000TPM 8 G 0.4000 0.4500 0.5000 0.4500 0.4550 0.0042 4.0000 3.4333 0.0000
Target Value Design Model Prediction
TPMs BOM ID#: 2/9/2006
Validation Test Data
Meaningful stoplights based on statistical
sensitivityCompares requirement allocation vs. current
design capability
Includes sensitivity and statistical information
Captures complete product lifecycle: requirements, design, manufacturing, testing,
validation, etc. (other columns not shown)
TPM design margins are statistically tracked real-time