iea etp transport analysis unece/geneva · iea etp transport analysis unece/geneva september 13...
TRANSCRIPT

© OECD/IEA 2012
IEA ETP Transport Analysis UNECE/Geneva September 13 2013
Alex Körner
International Energy Agency

© OECD/IEA 2012
Content
ETP modeling framework
IEA mobility model (MoMo)
IEA transport database
Emission mitigation policy analysis

© OECD/IEA 2012
Motivation – 2DS
To reach a 2 degree Celsius trajectory energy related emissions needs to be halved by 2050.

© OECD/IEA 2012
Supply side:
TIMES – Energy system least cost optimization, perfect foresigh, high technology resolution, until 2050 (2075)
The 2DS is climate change driven – Constraint on emissions
Demand side
Split into three sectoral models: Transport (MoMo), Industry and buildings
All demand side models are technology rich simulation tools which allow for sectoral projections energy use and policy analysis until 2050
ETP modelling framework

© OECD/IEA 2012
IEA mobility model
Spreadsheet model of global transport, energy use, emissions, safety, and materials use Analysis of multiple scenarios with time horizon until 2050 Projections of future transport demand and vehicle stock based on hypotheses on GDP
and population growth Broad set of techno-economic parameters: fuel economy, technology costs, mileage,
vehicle and fuel market shares, emission factors etc…
World divided in 29 regions, incl. a good number of specific countries
USA, Canada, Mexico, Brazil, France, Germany, Italy, UK, Japan, Korea, China, India The model is suitable for handling regional and global issues
Based on a large amount of data on technologies and fuel pathways
Full evaluation of the life cycle GHG emissions Cost estimates for new light duty vehicles Estimates for fuel costs and taxes as well as fuel distribution infrastructure Module on material requirements for LDV manufacturing
It is based on the "ASIF" framework:
Activity (passenger travel) * Structure (travel by mode, load factors) * Energy Intensity = Fuel use

© OECD/IEA 2012
MoMo – Analytical capabilities
For LDVs and trucks: Technology uptake based on a stock model Tracking of activity, intensity, energy use GHG emissions (on a WTW, a TTW basis) Pollutant emissions (CO, VOCs, PM, lead and NOx) Fuel and vehicle costs (only for LDVs)
For buses, 2/3 wheelers, stock, tkm, stock efficiency, energy use and emissions are tracked
For rail and air total travel activity (in pkm or tkm), stock efficiency, energy use and emissions are tracked
For shipping, so far just energy use and emissions are tracked
Material requirements and emissions have been integrated in the model Analysis of future vehicle sales (e.g. fuel cells) and how they impact materials
requirements (e.g. precious metals, Li) is possible Full life-cycle analysis for GHG emissions from LDVs (including manufacturing); Tailpipe emissions of various pollutants for road modes

© OECD/IEA 2012
Coverage of transport modes
2-3 wheelers
Light duty vehicles (PLDV, LCV, minibuses) Internal combustion (gasoline/diesel/CNG/LPG) Hybrids (gasoline/diesel) Plug-in hybrids (gasoline/diesel) Fuel cell vehicles Electric vehicles
Heavy duty vehicles Passenger
Buses BRT systems
Freight Medium freight trucks Heavy freight trucks
Rail (passenger, freight) High-speed rail (to be added in 2013)
Air (only passenger, new module under dev.)
Water transport (only freight, new module under dev.)

© OECD/IEA 2012
Transport database covers 33 single countries and 8 aggregate regions
Stock, sales, travel, mileage, fuel economy are tracked by road vehicle mode, type, power-train and energy source
Transport database and ESD energy balances allow for bottom-up vs. top-down comparison of fuel use data
Transport database

© OECD/IEA 2012
The combination of the transport database and ESD fuel use allows for robust fuel split
Oddities in ESD tracking can be spotted via plausible transport assumptions on uncertain data
Bottom-up vs top-down
0
5000
10000
15000
20000
25000
30000
35000
40000
45000
50000
19
70
19
73
19
76
19
79
19
82
19
85
19
88
19
91
19
94
19
97
20
00
20
03
20
06
20
09
Energy Use (ktoe)
Gasoline
Diesel
CNG
LPG
Biogasoline
Biodiesel
Electricity
ESD official Stats
Gasoline
Diesel
CNG

© OECD/IEA 2012
Basic indicators
Inputdata for tracking and scenarios:
Activity data & structure data – transport demand Vehicle stocks
Mileage Bottom up (pkm/tkm)
Mode shares, load factors
Travel data – pkm/tkm Top down (pkm/tkm)
Intensity data – specific fuel consumption of different transport modes (l/100km, mls/gal etc. converted to energy based on LHV of fuels)
Fuel data – specific carbon content of different transport fuels (well-to-tank and tank-to-wheel well-to-wheel)
Cost data – Specific vehicle purchase costs, fuel costs for various fuel pathways
Incomplete, inconsistent, not available
for all countries
Hard to measure: Gap factor between
tested and on road FE
Very fuel and region specific, big
uncertainties e.g. ILUC emissions
Very region specific: e.g. size classes

© OECD/IEA 2012
IEA data: Energy Balances (Beyond 2020), Energy Indicators
Official data – National/international stats, government/ministries Eurostat, BTS, EPA, EEA, MLIT, NRC, Transport ministries, RosStat,
UNECE, IEEJ…
Associations JAMA, OICA, ACEA, ANFAVEA, ACEM, FCAI, NAAMSA, IRF, KAMA…
Public & private research institutes ORNL, TREMOVE, NIIAT, Tsinghua University, ANL, DLR, ARAI, ITS, UC
Davis…
Industry/consulting Marklines, POLK, Walsh, car and truck manufacturers…
Sources
© OECD/IEA 2012
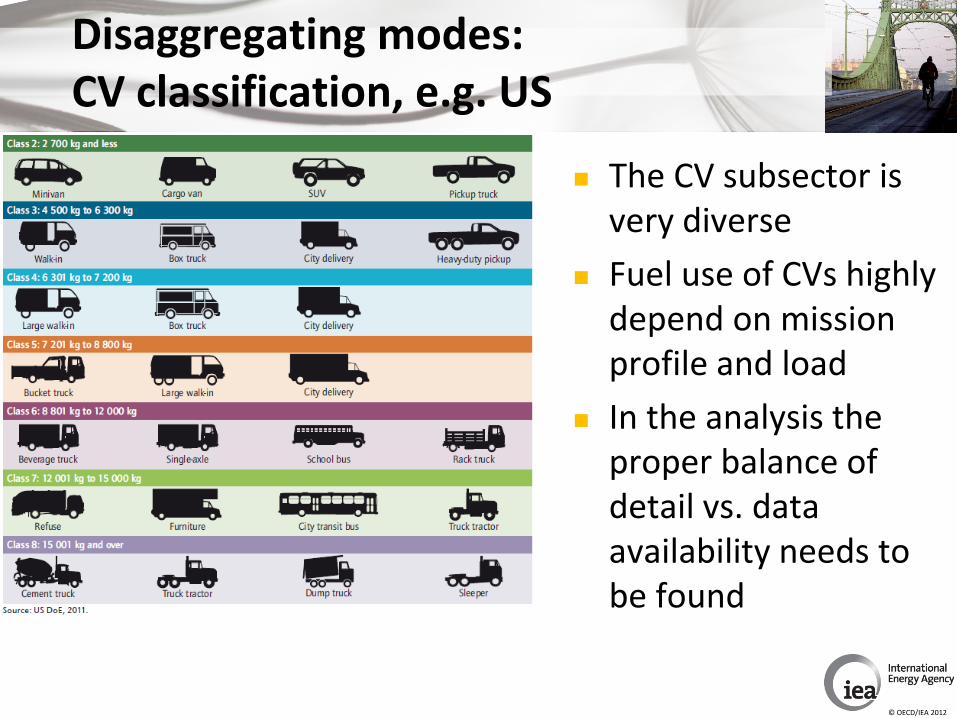
The CV subsector is very diverse
Fuel use of CVs highly depend on mission profile and load
In the analysis the proper balance of detail vs. data availability needs to be found
Disaggregating modes: CV classification, e.g. US

© OECD/IEA 2012
68 individual countries to be pulled out
33 pulled out as individual files at the end of 2012
Countries

© OECD/IEA 2012
World’s mobility habits are diverse
Most regions and countries increasingly relying on energy intensive transportation modes

© OECD/IEA 2012
Transport oil addiction worsening
Transport energy demand doubled in the last thirty years

© OECD/IEA 2012
Going back to 2000 CO2 levels in 2050
Pushing technology to its maximum potential is not enough to meet the 2DS target for transport
A three-pillar strategy is needed: Avoid/Shift/Improve
© OECD/IEA 2012
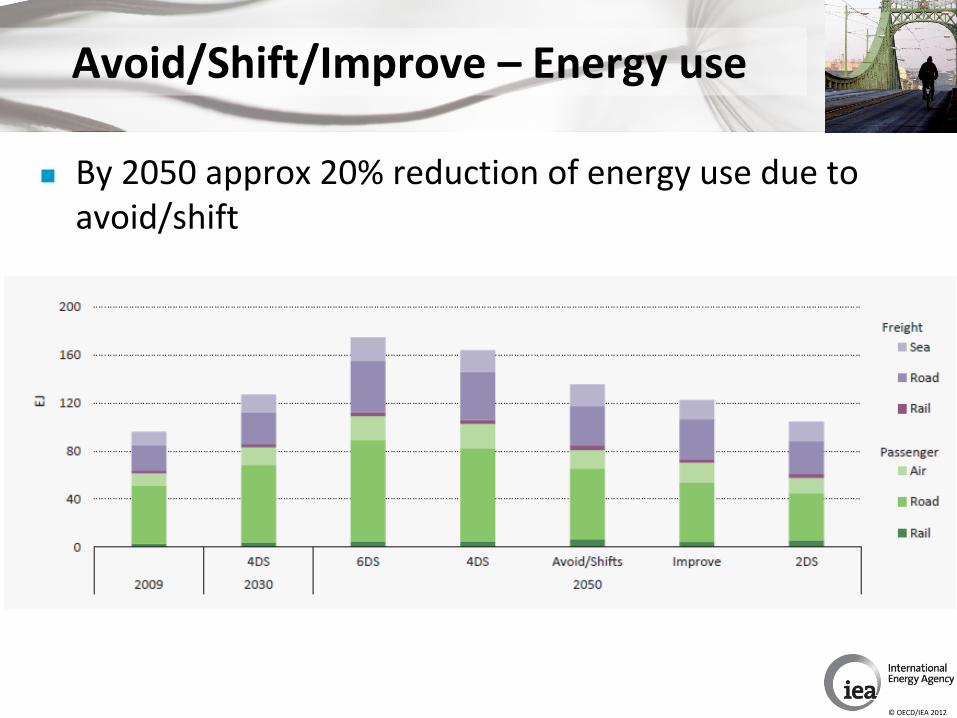
Avoid/Shift/Improve – Energy use
By 2050 approx 20% reduction of energy use due to avoid/shift

© OECD/IEA 2012
Growth takes mainly place in non-OECD countries
Technology portfolio need to substantial evolve to reach 2DS
PLDV sales: Tripling until 2050

© OECD/IEA 2012
A low carbon future may save money
More than USD 60 trillion saved over the next 4 decades by saving fuel, and also reducing vehicle and infrastructure spendings

© OECD/IEA 2012
Tackle Fuel Economy Now!
Traditional powertrains biggest saving potential
2020 Target : 5.6 Lge/100km on average worldwide
Policy options: FE standards, taxation, monetary incentives e.g. feebate systems

© OECD/IEA 2012
EVs need to come out of age
EV sales need to be doubled each year until 2020
In the (very) short term we are on track: 120,000 EVs sold in 2012
Each production/sale shown here is assumed to be constant after the year OEM announced/reported.

© OECD/IEA 2012
IEA initiatives: GFEI & EVI
Global fuel Economy Initiative: How can we maximize the benefits of fuel efficiency in LDVs on a global scale, given the projected expansion of the global fleet?
GFEI target: reducing new vehicle fuel consumption by 50% until 2030
EVI: Announced at the Clean Energy Ministerial July 2010 15 countries: China, Denmark, Finland, France, Germany, India, Italy, Japan,
Netherlands, Portugal, South Africa, Spain, Sweden, United Kingdom, United States
Three primary objectives: • Common data collection/analysis efforts
• Greater RD&D collaboration
• City forum that links cities within EVI countries

© OECD/IEA 2012
GFEI – target and progress tracking
New vehicles in OECD almost achieve the GFEI annual fuel consumption reduction target
New vehicles in Non-OECD show a slight annual fuel consumption reduction over the last three years
The global reduction rate is still far off the target due to a shift in market from OECD to non-OECD
2005 2008 2010 2011 2030
3 years
average
annual
change 2005-
2008
3 years
average
annual
change
2008-2011
Annual
change
2010-2011
Annual
change
2005-2011
Required
annual
change
2005-2030
OECD average 8.1 7.6 7.0 7.0 -2.3% -2.6% -0.5% -2.5%
Non-OECD average 7.5 7.5 7.4 7.3 0.4% -0.9% -0.7% -0.3%
Global average 8.0 7.6 7.2 7.1 -1.8% -1.9% -0.5% -1.9%
GFEI target 8.1 4.0 -2.7%

© OECD/IEA 2012
GFEI – Data, analysis and outreach
Data work - Global and regional fuel economy baseline
Analysis and progress tracking - Effect of FE policies in OECD countries
Outreach: Attracting Non-OECD countries to implement FE policies

© OECD/IEA 2012
Transport, Energy and CO2 (2009)
Energy Technology Perspectives (2010)
Technology Roadmap on Electric Vehicles (2011)
Energy Technology Perspectives (2012)
Technology Roadmap on Vehicle Fuel Economy (2012)
EV City Casebook (2012)
Railway Handbook (2012)
Working Paper on Transport Infrastructure (2013)
Nordic Energy Technology Perspectives (2013)
Global Fuel Economy Initiative Report Update(2013)
Global Electric Vehicle Outlook 2013
Already published & transport related

© OECD/IEA 2012
ETP 2014
Technology Roadmap on Hydrogen
IEA Working Paper on PC Material Use, Light-Weighting and Emissions
IEA Featured Insights Paper on Fuel Costs
Transport publications 2013/2014

© OECD/IEA 2012
Who supports this work?
Now 13 partner institutions; 6 have been financing the project development since the end of the SMP Institute for Transport Policy Studies (ITPS - a Japanese research institute) joined the project in 2009, after VW in 2008. US DoE also joined in 2010, and UITP / ICCT in 2011, UC Davis and Volvo in 2012.

© OECD/IEA 2012
Thanks!

© OECD/IEA 2012
Browsing through MoMo