iea2013windroadmap
TRANSCRIPT

8/13/2019 IEA2013WindRoadmap
http://slidepdf.com/reader/full/iea2013windroadmap 1/63
Technology Roadmap
2035 2040
2045
2050
2013 edition Wind energy
E n e
r g y T e c h n o l o g y P e r
s p e c t i
v e s

8/13/2019 IEA2013WindRoadmap
http://slidepdf.com/reader/full/iea2013windroadmap 2/63
INTERNATIONAL ENERGY AGENCY
The International Energy Agency (IEA), an autonomous agency, was established in November 1974.Its primary mandate was – and is – two-fold: to promote energy security amongst its member
countries through collective response to physical disruptions in oil supply, and provide authoritative
research and analysis on ways to ensure reliable, affordable and clean energy for its 28 membercountries and beyond. The IEA carries out a comprehensive programme of energy co-operation amongits member countries, each of which is obliged to hold oil stocks equivalent to 90 days of its net imports.The Agency’s aims include the following objectives:n Secure member countries’ access to reliable and ample supplies of all forms of energy; in particular,through maintaining effective emergency response capabilities in case of oil supply disruptions.
n Promote sustainable energy policies that spur economic growth and environmental protectionin a global context – particularly in terms of reducing greenhouse-gas emissions that contributeto climate change.
n Improve transparency of international markets through collection and analysis ofenergy data.
n Support global collaboration on energy technology to secure future energy supplies
and mitigate their environmental impact, including through improved energyefciency and development and deployment of low-carbon technologies.
n Find solutions to global energy challenges through engagement anddialogue with non-member countries, industry, international
organisations and other stakeholders. IEA member countries: Australia
AustriaBelgium
CanadaCzech Republic
DenmarkFinland
FranceGermany
GreeceHungary
IrelandItaly
JapanKorea (Republic of)
Luxembourg
NetherlandsNew ZealandNorway PolandPortugalSlovak RepublicSpainSwedenSwitzerland Turkey
United Kingdom
United States
The European Commissionalso participates in
the work of the IEA.
© OECD/IEA, 2013International Energy Agency
9 rue de la Fédération75739 Paris Cedex 15, France
www.iea.org
Please note that this publicationis subject to specic restrictionsthat limit its use and distribution.
The terms and conditions are available online athttp: // www.iea.org / termsandconditionsuseandcopyright /

8/13/2019 IEA2013WindRoadmap
http://slidepdf.com/reader/full/iea2013windroadmap 3/63
1Foreword
Current trends in energy supply and use areunsustainable – economically, environmentally andsocially. Without decisive action, energy-relatedgreenhouse-gas (GHG) emissions could more thandouble by 2050, and increased oil demand willheighten concerns over the security of supplies. We can and must change the path we are now on;sustainable and low-carbon energy technologieswill play a crucial role in the energy revolutionrequired to make this change happen.
There is a growing awareness of the urgent need toturn political statements and analytical work intoconcrete action. To address these challenges, theInternational Energy Agency (IEA), at the request
of the Group of Eight (G8), has identified the mostimportant technologies needed to achieve a globalenergy-related CO2 target in 2050 of 50% belowcurrent levels. It has thus been developing a seriesof technology roadmaps, based on theEnergyTechnology Perspectives modelling, which allowsassessing the deployment path of each technology,taking into account the whole energy supply anddemand context.
Wind is the most advanced of the “new” renewableenergy technologies and was the subject of one ofthe first roadmaps produced by the IEA, in 2009.Since then, the development and deployment ofwind power has been a rare good news story in thedeployment of low-carbon technology deployment.A much greater number of countries in all regionsof the world now have significant wind generatingcapacity. In a few countries, wind power alreadyprovides 15% to 30% of total electricity. Thetechnology keeps rapidly improving, and costsof generation from land-based wind installationshave continued to fall. Wind power is now beingdeployed in countries with good resources withoutspecial financial incentives.
Because of these improvements and other changesin the energy landscape, this updated roadmaptargets an increased share (15% to 18%) of globalelectricity to be provided by wind power in 2050,compared to 12% in the original roadmap of 2009.
But more remains to be done to ensure that theseobjectives are met. There is a continuing need forimproved technology. Increasing levels of low-costwind still require predictable, supportive regulatoryenvironments, and appropriate market designs. Thechallenges of integrating higher levels of variablewind power into the grid must be tackled. Andfor offshore wind – still at the early stages of thedeployment journey – much remains to be done
to develop appropriate large-scale systems and toreduce costs.
This updated roadmap recognises the verysignificant progress made since the last versionwas published. It provides an updated analysis ofthe barriers which remain to accelerated progressalong with proposals to address them coveringtechnology, legislative and regulatory issues. Wehope that the analysis and recommendations willplay a part in ensuring the continued success ofwind energy.
This publication is produced under my authority asExecutive Director of the IEA.
Maria van der HoevenExecutive Director
International Energy Agency
Foreword
This publication reflects the views of the International Energy Agency (IEA) Secretariat but does not necessarily reflectthose of individual IEA member countries. The IEA makes no representation or warranty, express or implied, in respectto the publication’s contents (including its completeness or accuracy) and shall not be responsible for any use of, orreliance on, the publication.

8/13/2019 IEA2013WindRoadmap
http://slidepdf.com/reader/full/iea2013windroadmap 4/63
2 Technology Roadmap Wind energy
Foreword 1
Acknowledgements 4
Key findings and actions 5
Key actions in the next ten years 5
Introduction 7
Rationale for wind power in the overall energy context 7
Purpose of the roadmap update 7
Roadmap process, content and structure 8
Wind energy progress since 2008 9
Recent developments in wind markets 9
Technology improvements 12
Advancing towards competitiveness 14
Barriers encountered, overcome or outstanding 17
Medium-term outlook 18
Vision for deployment and CO 2 abatement 19
CO2 reduction targets from theETP 2012 Scenarios 19
Wind targets revised upward compared to 2009 roadmap 20
Potential for cost reductions 22
Global investment to 2050 23
Wind technology development: actions and time frames 25 Wind power technology 25
Special considerations for offshore development 28
Wind characteristic assessment 32
Supply chains, manufacturing and installation 34
System integration: actions and time frames 36
Transmission planning and development 36
Reliable system operation with large shares of wind energy 41
Policy, finance, public acceptance and International collaboration: actions and time frames 45
Incentivising investment 45
Public engagement and the environment 47
Planning and permitting 48
Increased funding for RD&D 49
International collaboration: actions and time frame 50
Roadmap action plan and next steps 52
Near-term actions for stakeholders 52
Implementation 53
Abbreviations and acronyms 54References 56
Table of contents

8/13/2019 IEA2013WindRoadmap
http://slidepdf.com/reader/full/iea2013windroadmap 5/63
3Table of contents
List of tables
Table 1. Progress in wind power since 2008 10
Table 2. Cumulative investment in the 2DS (USD billion) 23
List of gures
Figure 1. Global cumulative growth of wind power capacity 9
Figure 2. Global wind map, installed capacity and production for lead countries 11
Figure 3. Capacity factors of selected turbine types 12
Figure 4. Evolution of forecasting errors since 2008 13
Figure 5. Cost trend of land-based wind turbine prices, by contract date 14
Figure 6. Capital costs of European offshore wind farms, by year (EUR/W) 15
Figure 7. Recent trends in average price for full-service O&M contracts (EUR/MW/yr) 16
Figure 8. Estimated change in the LCOE between low- and high-wind-speed sites 17
Figure 9. Global electricity mix by 2050 in the 2DS and hiRen scenario 20
Figure 10. Regional production of wind electricity in the 2DS and hiRen 21
Figure 11. Additional CO2 emissions reduction in 2050 by region in the 2DS and hiRen (over the 6DS) 21
Figure 12. Wind electricity production in the hiRen versus industry scenarios 22
Figure 13. 2DS projections for investment costs of wind turbines 23
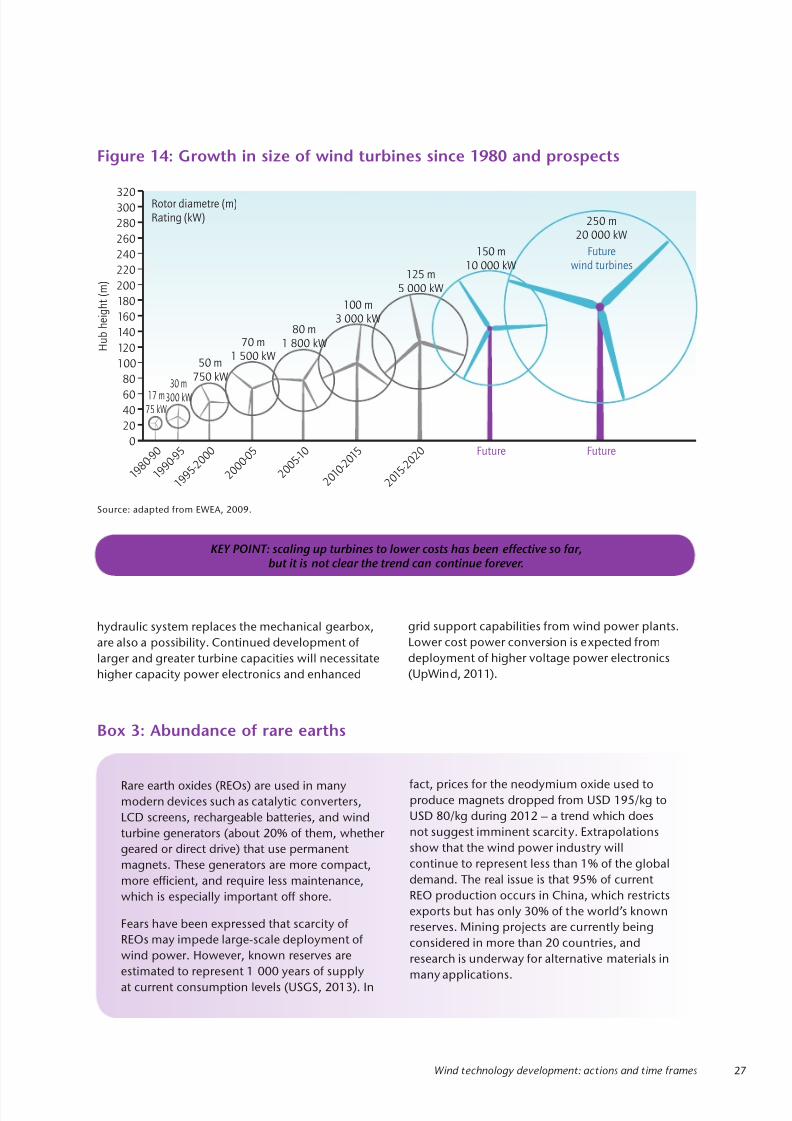
Figure 14. Growth in size of wind turbines since 1980 and prospects 27
Figure 15. Target for cost reductions of land-based wind power in the United States 28Figure 16. Cost-reduction potential of offshore wind power plants, United Kingdom 30
Figure 17. Fixed-bottom foundation and floating offshore concepts 31
Figure 18. Bottlenecks in the European electricity network 37
Figure 19. China’s West-East electricity transfer project 39
Figure 20. From radial to fully meshed options for offshore grid development 40
Figure 21. OECD member country funding for wind energy R&D and share of energy R&D 50
List of boxes
Box 1. Modern wind turbine technology: major achievements over last five years 13Box 2.ETP Scenarios: 6DS, 2DS, hiRen 19
Box 3. Abundance of rare earths 27
Box 4. UK projections for offshore cost reductions 29
Box 5. Co-ordinated transmission planning in Europe 38
Box 6. Geographic “smoothing” of variable output 43
Box 7. Attracting private finance 46

8/13/2019 IEA2013WindRoadmap
http://slidepdf.com/reader/full/iea2013windroadmap 6/63
4 Technology Roadmap Wind energy
through discussions and early comments, but aretoo numerous to be named individually. Reviewcomments were received from: Global WindEnergy Council (GWEC, Steve Sawyer); European Wind Energy Association (EWEA, Jacopo Mocciaand Vilma Radvilaite); American Wind EnergyAssociation (AWEA, Michael Goggin and others);US Department of Energy (DOE, Jim Ahlgrimm,Benjamin Chicoski and Richard Tusing); NationalRenewable Energy Laboratory (NREL, MaureenHand, Paul Veers, Patrick Moriarty, Aaron Smith,Brian Smith and Robert Thresher);LawrenceBerkeley National Laboratory (LBNL, Ryan Wiser); GLGarrad Hassan (Paul Gardner); Iberdrola (AngelesSantamaria Martin); Acciona (Carmen BecerrilMartinez); General Electric (GE, Bart Stoffer andIzabela Kielichowa); HIS CERA (Susanne Hounsell);Energinet.dk (Antje Orths); Laboratòrio Nacionalde Energia e Geologia (LNEG, Ana Estanqueiro);Strathclyde Uni (David Infield); Utility Variable-Generation Integration Group (UVIG, J. CharlesSmith); WindLogics (Mark Ahlstrom), MargueriteFund (Michael Dedieu); Green Giraffe (JeromeGuillet); Kreditanstalt für Wiederaufbau (KfW,Andrew Eckhardt); HgCapital (Tom Murley); andABB (Hannu Vaananen).
For more information on this document, contact :Technology RoadmapsInternational Energy Agency9, rue de la Fédération75739 Paris Cedex 15FranceEmail: [email protected]
This publication was prepared by the RenewableEnergy Division (RED) of the International EnergyAgency (IEA). Cédric Philibert and HanneleHolttinen were the co-ordinators and main authorsof this update, based on the original work of HugoChandler. Paolo Frankl, Head of RED, providedinvaluable guidance and input, as did KeisukeSadamori, Director of Energy Markets and Securityat the IEA. Cecilia Tam, in her role as TechnologyRoadmap Co-ordinator, made importantcontributions through the drafting process. Severalother IEA colleagues also provided importantcontributions, in part icular Heymi Bahar, DanielMoeller, Simon Mueller, Alvaro Portellano, UweRemme and Michael Waldron.
The IEA Implementing Agreement on WindEnergy Systems provided valuable comments andsuggestions. Edgar DeMeo of Renewable EnergyConsulting Services, Inc. provided valuable input.
The authors would also like to thank MarilynSmith for editing the manuscript as well as the IEAPublication Unit, in particular Muriel Custodio,Astrid Dumond, Angela Gossmann, Cheryl Hainesand Bertrand Sadin for their assistance on layoutand editing.
Finally, this roadmap would not be effective withoutall of the comments and support received fromthe industry, government and non-governmentexperts who attended the workshop, reviewedand commented on the drafts, and providedoverall guidance and support. The authors wish tothank all of those, such as workshop participants(Vienna, 4 February 2013), who gave inputs
Acknowledgements

8/13/2019 IEA2013WindRoadmap
http://slidepdf.com/reader/full/iea2013windroadmap 7/63
5Key findings and actions
z Since 2008, wind power deployment has morethan doubled, approaching 300 gigawatts(GW) of cumulative installed capacities, led byChina (75 GW), the United States (60 GW) andGermany (31 GW). Wind power now provides2.5% of global electricity demand – and up to30% in Denmark, 20% in Portugal and 18% inSpain. Policy support has been instrumental instimulating this tremendous growth.
z Progress over the past five years has boostedenergy yields (especially in low-wind-resourcesites) and reduced operation and maintenance(O&M) costs. Land-based wind power generationcosts range from USD 60 per megawatt hour
(USD/MWh) to USD 130/MWh at most sites. It canalready be competitive where wind resources arestrong and financing conditions are favourable,but still requires support in most countries.Offshore wind technology costs levelled off aftera decade-long increase, but are still higher thanland-based costs.
z This roadmap targets 15% to 18% share of globalelectricity from wind power by 2050, a notableincrease from the 12% aimed for in 2009. Thenew target of 2 300 GW to 2 800 GW of installedwind capacity will avoid emissions of up to4.8 gigatonnes (Gt) of carbon dioxide (CO2)per year.
z Achieving these targets requires rapid scalingup of the current annual installed wind powercapacity (including repowering), from 45 GW in2012 to 65 GW by 2020, to 90 GW by 2030 and to104 GW by 2050. The annual investment neededwould be USD 146 billion to USD 170 billion.
z The geographical pattern of deployment israpidly changing. While countries belongingto the Organisation for Economic Co-operationand Development (OECD) led early winddevelopment, from 2010 non-OECD countriesinstalled more wind turbines. After 2030, non-OECD countries will have more than 50% ofglobal installed capacity.
z While there are no fundamental barriers toachieving – or exceeding – these goals, severalobstacles could delay progress including costs,grid integration issues and permitting difficulties.
z This roadmap assumes the cost of energy fromwind will decrease by as much as 25% for land-based and 45% for offshore by 2050 on theback of strong research and development (R&D)
to improve design, materials, manufacturingtechnology and reliability, to optimiseperformance and to reduce uncertainties for plantoutput. To date, wind power has received only 2%of public energy R&D funding: greater investmentis needed to achieve wind’s full potential.
z As long as markets do not reflect climatechange and other environmental externalities,accompanying the cost of wind energy tocompetitive levels will need transitional policysupport mechanisms.
z To achieve high penetrations of variable windpower without diminishing system reliability,improvements are needed in grid infrastructureand in the flexibility of power systems as well asin the design of electricity markets.
z To engage public support for wind, improvedtechniques are required to assess, minimise andmitigate social and environmental impacts andrisks. Also, more vigorous communication isneeded on the value of wind energy and the roleof transmission in meeting climate targets and inprotecting water, air and soil quality.
Key actions in thenext ten years z Set long-term targets, supported by predictable
mechanisms to drive investment and to applyappropriate carbon pricing.
z Address non-economic barriers. Advanceplanning of new plants by including wind powerin long-term land and maritime spatial planning;develop streamlined procedures for permitting;address issues of land-use and sea-use constraintsposed by various authorities (environment,building, traffic, defence and navigation).
z Strengthen research, development anddemonstration (RD&D) efforts and financing.Increase current public funding by two- to five-fold to drive cost reductions of turbines andsupport structures, to increase performance andreliability (especially in offshore and other newmarket areas) and to scale up turbine technologyfor offshore.
z Adapt wind power plant design to specific localconditions (e.g. cold climates and low-wind sites),penetration rates, grid connection costs and theeffects of variability on the entire system.
Key findings and actions

8/13/2019 IEA2013WindRoadmap
http://slidepdf.com/reader/full/iea2013windroadmap 8/63
6 Technology Roadmap Wind energy
z Improve processes for planning and permittingtransmission across large regions; modernisegrid operating procedures (e.g. balancing areaco-ordination and fast-interval dispatch andscheduling); increase power system flexibilityusing ancillary services from all (also wind)generation and demand response; and expandand improve electricity markets, and adapt theiroperation for variable generation.
z Increase public acceptance by raising awarenessof the benefits of wind power (including emissionreductions, security of supply and economicgrowth), and of the accompanying need foradditional transmission.
z Enhance international collaboration in R&Dand standardisation, large-scale testingharmonisation, and improving wind integration.Exchange best practices to help overcomedeployment barriers.

8/13/2019 IEA2013WindRoadmap
http://slidepdf.com/reader/full/iea2013windroadmap 9/63
7Introduction
IntroductionThere is a pressing need to accelerate thedevelopment of advanced energy technologiesin order to address the global challenges ofclean energy, climate change and sustainabledevelopment. To achieve emission reductionsenvisioned, the IEA has undertaken an effort todevelop a series of global technology roadmaps,under international guidance and in closeconsultation with industry. These technologies areevenly divided among demand-side and supply-sidetechnologies and include several renewable energyroadmaps (www.iea.org/roadmaps/).
The overall aim is to advance global developmentand uptake of key technologies to limit global mean
temperature increase to 2 degrees Celsius (°C) in thelong term. The roadmaps will enable governmentsand industry and financial partners to identify stepsneeded and implement measures to acceleraterequired technology development and uptake.
The roadmaps take a long-term view, but highlightin particular the key actions that need to be takenby different stakeholders in the next five to ten yearsto reach their goals. This is because the actionsundertaken within the next decade will be criticalto achieve long-term emission reductions. Existingconventional plants together with those underconstruction lead to a lock-in of CO2 emissions asthey will be operating for decades. According to theIEAEnergy Technology Perspectives 2012 (ETP 2012) ,early retirement of 850 GW of existing coal capacitywould be required to reach the goal of limitingclimate change to 2°C. Therefore, it is crucial tobuild up low-carbon energy supply today.
Rationale for wind power inthe overall energy contextETP 2012 projects that – in the absence of newpolicies – CO2 emissions from the energy sectorwill increase by 84% over 2009 levels by 2050 (IEA,2012a). TheETP 2012 model examines competitionamong a range of technology solutions that cancontribute to preventing this increase: greaterenergy efficiency, renewable energy, nuclearpower and the near-decarbonisation of fossil fuel-based power generation. Rather than projectingthe maximum possible deployment of any givensolution, the ETP 2012 model calculates the least-cost mix to achieve the CO2 emission reduction goal
needed to limit climate change to 2°C (theETP 2012 2°C Scenario [2DS]; Figure 1 and Box 1).
ETP 2012 shows wind providing 15% to 18% of thenecessary CO2 reductions in the electricity sectorin 2050, up from the 12% projected inEnergyTechnology Perspectives 2008 (IEA, 2008). Thisincrease in wind compensates for slower progress inthe intervening years in the area of carbon captureand storage (CCS) and higher costs for nuclearpower. Yet, it also reflects faster cost reductions forsome renewables, including wind.
Wind energy, like other power technologies based onrenewable resources, is widely available throughoutthe world and can contribute to reduced energyimport dependence. As it entails no fuel price risk orconstraints, it also improves security of supply. Wind
power enhances energy diversity and hedges againstprice volatility of fossil fuels, thus stabilising costs ofelectricity generation in the long term.
Wind power entails no direct greenhouse gas (GHG)emissions and does not emit other pollutants (suchas oxides of sulphur and nitrogen); additionally,it consumes no water. As local air pollution andextensive use of fresh water for cooling of thermalpower plants are becoming serious concerns inhot or dry regions, these benefits of wind becomeincreasingly important.
Purpose of theroadmap updateThe wind roadmap was one of the initial roadmapsdeveloped by the IEA in 2008/09. This documentis an update of that earlier document, outliningprogress made in the last four years, as well aspresenting updated goals and actions. This updatedroadmap presents a new vision that takes intoaccount this progress of wind technologies as wellchanging trends in the overall energy mix.
It presents a detailed assessment of the technologymilestones that wind energy will need to reachthe ambitious targets presented in the vision. Thekey objective is to seek measures to improve windtechnology performance and reduce its costs inorder to achieve the competitiveness needed for thelarge investments foreseen.
The roadmap also provides an extensive list ofnon-economic barriers that hamper deploymentand identifies policy actions to overcome them.For instance, addressing issues such as permittingprocesses and public acceptance, transmission andsystem integration is critically important.

8/13/2019 IEA2013WindRoadmap
http://slidepdf.com/reader/full/iea2013windroadmap 10/63
8 Technology Roadmap Wind energy
This roadmap thus identifies actions and timeframes to achieve the higher wind deploymentneeded for targeted global emission reductions.In some markets, certain actions will already havebeen taken, or will be underway. Many countries,particularly in emerging regions, are only justbeginning to develop wind energy. Accordingly,milestone dates should be considered as indicativeof urgency, rather than as absolutes. Individualcountries will have to choose what to prioritise inthe rather comprehensive action lists, based on theirmix of energy and industrial policies.
This roadmap is addressed to a variety of audiences,including policy-makers, industry, utilities,
researchers and other stakeholders. It provides aconsistent overall picture of wind power at globaland continental levels. It further aims at triggeringand informing the elaboration of action plans,target sett ing or updating, as well as roadmaps ofwind power deployment at national level.
Roadmap process, contentand structureThis roadmap was developed with inputs from
diverse stakeholders representing the windindustry, the power sector, R&D institutions, thefinance community, and government institutions.Following a workshop to identify technologicaland deployment issues, a draft was circulatedto participants and a wide range of additionalreviewers. It is consistent with theLong Term R&DNeeds Report of the Implementing Agreementfor Co-operation in the Research, Developmentand Deployment of Wind Energy Systems (WindImplementing Agreement [IA], 2013).
This roadmap is organised into seven majorsections. First, the current state of the wind industryand progress since 2008 is discussed, followedby a section that describes the targets for windenergy deployment between 2010 and 2050 basedon ETP 2012. This discussion includes informationon the regional distribution of wind generationprojects and the associated investment needs, aswell as the potential for cost reductions.
The next three sections describe approachesand specific tasks required to address the majorchallenges facing large-scale wind deploymentin three major areas, namely wind technologydevelopment; transmission and grid integration;
policy framework development, public engagementand international collaboration.
The final section sets out next steps and categorisesthe actions from the previous sections bystakeholders (policy makers, industry and powersystem actors) to help guide their efforts tosuccessfully implement the roadmap activities andachieve the global wind deployment targets.

8/13/2019 IEA2013WindRoadmap
http://slidepdf.com/reader/full/iea2013windroadmap 11/63
9Wind energy progress since 2008
Wind energy is developing towards a mainstream,competitive and reliable power technology.Globally, progress continues to be strong, withmore active countries and players, and increasingannual installed capacity and investments.Technology improvements have continuouslyreduced energy costs, especially on land. Theindustry has overcome supply bottlenecks andexpanded supply chains.
Recent developmentsin wind markets
Since 2000, cumulative installed capacity has grownat an average rate of 24% per year (%/yr) (Figure 1).In 2012, about 45 GW of new wind power capacitywere installed in more than 50 countries, bringingglobal onshore and offshore capacity to a total of282 GW (GWEC, 2013; IEA, 2013). New investment
in wind energy in 2012 was USD 76.56 billion(Liebreich, 2013). Among the largest clean energyprojects financed in 2012 were four offshore windsites (216 megawatts [MW] to 400 MW) in theGerman, United Kingdom and Belgian waters of theNorth Sea, with investments of EUR 0.8 billion toEUR 1.6 billion (USD 1.1 billion to USD 2.1 billion).
Thriving markets exist where deploymentconditions are right. Progress made since 2008shows a positive trend: in 2012, wind powergenerated about 2.6% of global electricity (Table 1)while capacity and production information for windresources around the globe show steady expansion(Figure 2).
Wind energy progress since 2008
Figure 1: Global cumulative growth of wind power capacity
Source: unless otherwise indicated, all material in figures and tables derive from IEA data and analysis.
KEY POINT: cumulative wind power capacity grew at almost 25%/yr on average.
0
50
100
150
200
250
300
1995 1996 1997 1998 1999 2000 2001 2002 2003 2004 2005 2006 2007 2008 2009 2010 2011 2012
G W
0%
5%
10%
15%
20%
25%
30%
35%
40%
Rest of the world
IndiaChinaUnited StatesUnited KingdomSpainPortugalItaly Germany FranceDenmark
Annual growth (%)

8/13/2019 IEA2013WindRoadmap
http://slidepdf.com/reader/full/iea2013windroadmap 12/63
10 Technology Roadmap Wind energy
Table 1: Progress in wind power since 2008
Note: TWh = terawatt hour.Source: IEA , 2013; Wind IA, 2013.
Large-scale offshore deployment has started, moreslowly than initially hoped, mostly in Europe. By theend of 2012, 5.4 GW had been installed (up from1.5 GW in 2008), mainly in the United Kingdom(3 GW) and Denmark (1 GW), with large offshorewind power plants installed in Belgium, China,Germany, the Netherlands and Sweden. Additionaloffshore turbines are operating in Norway, Japan,Portugal and Korea, while new projects are plannedin France and the United States. In the UnitedKingdom, 46 GW of offshore projects are registered,of which around 10 GW have been progressing to
consenting, construction or operation.An increasing number of turbines are being installedin cold climates, where they are exposed to icyconditions and/or low temperatures outside thedesign limits of standard wind turbines (WindIA, 2012). At the end of 2012, nearly 69 GW ofinstalled capacity were estimated to be located incold climate areas in Scandinavia, North America,Europe and Asia, of which 19 GW were in areas withtemperatures below 20°C and the rest subject toicing risks. Between 45 GW and 50 GW of additionalcapacity are likely to be installed in cold climates
before end 2017 (Navigant, 2013a).
Repowering,i.e. replacing “old” wind turbineswith more modern and productive equipment,is on the rise. Repowering is shown to increasewind power while reducing its footprint. A 2 MWwind turbine with an 80 metre (m) diameter rotornow generates four to six times more electricitythan a 500 kW 40 m diameter rotor built in 1995.Repowering began in Denmark and Germany, andhas expanded to India, Italy, Portugal, Spain, theUnited Kingdom and the United States. In Germany,325 turbines totalling 196 MW were replaced in2012 with 210 turbines of 541 MW in total. On the
pioneer site Altamont Pass in California, NextEra isreplacing 780 old turbines with only 34 turbines of2.3 MW. GlobalData expects repowering to growdramatically over the coming five years, increasingannual power generation at repowered sites from1.5 TWh to 8.2 TWh by 2020 (Lawson, 2013).
Most wind turbine manufacturers are concentratedin six countries (the United States, Denmark,Germany, Spain, India and China), with componentssupplied from a wide range of countries. Marketshares have changed in the past five years. Newplayers from China are growing and have started
exporting; the six largest Chinese companies(among the top 15 manufacturers globally) togetherhave exceeded 20% of market share in recent years.
End of 2008 End of 2012Total installed capacity 122 GW 282 GWAnnual installed capacity 28 GW 45 GWAnnual investment USD 52 billion USD 78 billionNumber of countries with GW installed 17 24Number of countries with 500 MW yearly market 10 14 Wind generation during the year 254 TWh 527 TWh
Wind penetration levels % of yearly electricity consumptionGlobal 1.3 2.5Europe
Of which: z Denmark z Ireland z Portugal z Spain
4.0
20.09.09.09.0
6.0
29.914.520.017.8
United States 1.9 3.5China < 1.0 2.0

8/13/2019 IEA2013WindRoadmap
http://slidepdf.com/reader/full/iea2013windroadmap 13/63
11Wind energy progress since 2008
Figure 2: Global wind map, installed capacity and production for lead countries
Note: wind speeds at 80 m height are shown with 15 km resolution.Source: resource data from Wiseret al. , 2011; production and capacit y data from IE A, 2013.
KEY POINT: good wind resources are found in many regions, notably in the United States, Europeand China, which lead the global market.
5 km wind map at 80m
Wind speed (m/s)
3 6 9
Cumulative installed capacity (GW) in 2012 Additional capacity (GW) in 2012 TWh from wind energy in 2012 Share of windpower in electricity generation in 2012
China75.7 13 100 2%
Denmark France
United Kingdom
Ireland
Germany
4.6 0.4 10 33.7%
31.3 2.2 46 7.7%
12.5
8.4
1.7
0.9
1.9
0.1
14.9
19.4
4
2.7%
6%
14.5%
Spain22.8 1.3 49.2 17.8%
Italy 8 1.1 13.2 4%Portugal
4.5 0.3 10.3 20%
United States58.8 13.1 140.9 3.5%
India18.4 2.3 29.1 2.7%
This map i s without prejudice to the status of or sovereignty over any territory, to the delimitation of international frontiers and boundaries and to the name of any territory, city or area.
Denmark, the pioneering country, had about halfof global markets in 2005, but Danish companiesrepresented only 20% of operating turbines in 2012– still a huge amount for a country that has slightlymore than 1% of global installed wind capacity(Navigant, 2013a). In addition to Denmark, strongmanufacturers in Spain and Germany make Europea large exporter of wind technology; in 2010, netexports were EUR 5.7 billion (EWEA, 2012). TheUnited States and India are also among the largemanufacturing countries. The US market nowcomprises 559 wind-related manufacturing facilitiesand domestic content is 67% (up from less than25% before 2005) while import s are down to 33%from 75% (Wiser and Bolinger, 2012). Countries
with emerging manufacturers include France andKorea, while Brazil has an increasing number ofmanufacturing facilities.
The wind industry has contributed substantially tothe socio-economic development of several regions.A clear example is significant job creation in Spainduring the first decade of the century, where asound support scheme attracted several foreignindustrial companies across the value chain for windprojects, together with a strong local industry. TheUnited Kingdom is currently attracting industrybecause of its thriving offshore wind market (CrownEstate, 2012a): between 2007 and 2010, jobs inthe sector grew by nearly 30% (EWEA, 2012). Jobsin the wind industry (both direct and indirect)reached approximately 265 000 in both China andthe European Union (of which 118 000 in Germany),81 000 in the United States, 48 000 in India and
29 000 in Brazil (REN21, 2013). Employment figuresare not easy to compare across technologies, butwind generally provides more jobs per investment

8/13/2019 IEA2013WindRoadmap
http://slidepdf.com/reader/full/iea2013windroadmap 14/63
12 Technology Roadmap Wind energy
than generation from coal and natural gas. Anestimate for the United States finds that windprovides 0.10 job-years/GWh to 0.26 job years/GWh,while the rate is 0.11 job-years/GWh for both coaland natural gas (Weiet al ., 2010). An est imate forSpain shows that per EUR 1 million invested, thewind industry creates 15 jobs/yr while combinedcycle gas turbines (CCGT) create six jobs/yr (Ernst & Young, 2012).
Technology improvementsThe general trend in turbine design has been toincrease the height of the tower, the length of
the blades and the power capacity. On average,however, turbines have grown in height and rotordiameter more rapidly than have their powercapacities. This decrease in the specific power, or
ratio of capacity over swept area, has pushed upcapacity factors considerably for the same windspeeds (Figure 3). Reducing the energy cost hasbeen the primary driver of this evolution, whichmight also have positive implications at system level(see System integration: actions and time frame ).
This trend has also led to the emergence of rotorsdesigned for lower wind speeds, having evensmaller specific power, with high masts and longblades in relation to generator size – and evenhigher capacity factors. This allows installing windturbines in lower-wind-speed areas, which are oftencloser to consumption centres than the best “windyspots”. As this avoids installation in areas that are
sensitive for environment and landscape integration(seashores, mountain ridges, etc.), this practicelowers the potential for opposition and conflicts(Chabot, 2013).
Advances in blade design, often with bettermaterials and also advanced control strategies,have contributed to increased yields from theturbines relative to their installed capacity. Since
2008, the share of gearless or direct-drive turbineshas increased from 12% to 20%. Other designvariations being pursued include rotors downwind
of the tower and two-bladed rotors. Offshore windturbines are evolving from the earlier “marinised”versions of land-based models towards dedicatedoffshore turbines of increased size, exploring
different sub-structures such as jackets and tripods.Further improvements involving the design areanticipated.
Figure 3: Capacity factors of selected turbine types
Source: Wiseret al. , 2012.
KEY POINT: turbine design advancement in ten years allows for signi cant increase in capacity factors.
15%
20%
25%
30%
35%
40%
45%
50%
55%
5.5 6.0 6.5 7.0 7.5 8.0 8.5
Wind speed at 50 m height
C a p a c
i t y f a c t o r s
2012-2013 low windspeed (100 m tower)2012-2013 low windspeed (80 m tower)2012-2013 standard equipment 2009-10 standard equipment 2002-03 standard equipment

8/13/2019 IEA2013WindRoadmap
http://slidepdf.com/reader/full/iea2013windroadmap 15/63
13Wind energy progress since 2008
Wind power output varies as the wind rises and falls.At low penetration levels, wind variability adds onlyincrementally to the existing variability in electricitysupply and demand, but variability and uncertainty
become significant as wind penetrations increase.Recent years have seen more countries and regionsreach high penetration levels of close to 20% of yearly electricity consumption from wind power.The experience gained in wind integration shows
that few physical changes to power systems areneeded until penetration exceeds 20%. Considerableprogress has been made since 2008 in forecastingthe output of wind power plants. In Spain, for
example, day-ahead errors have been reduced byone-third (Figure 4). Moreover, a vast majority ofwind turbines now installed have fault ride-throughcapabilities and offer active and reactive powercontrol, thanks to power electronics developments.
Figure 4: Evolution of forecasting errors since 2008
Source: Red Elect rica, 2013.
KEY POINT: day-ahead errors in Spain have been reduced by one-third since 2008,a result of dramatically improved forecasting technologies.
While several technical designsare in use today, most grid-connected largeturbines have three blades in a horizontal axisrotor that can be pitched to control the poweroutput. The size of the wind turbines continuesto increase; the average rated capacity ofnew grid-connected turbines in 2012 wasabout 1.8 MW compared to 1.6 MW in 2008(Navigant, 2013a). For offshore, the averageinstalled turbine size has grown from 3 MW in2008 to 4 MW in 2012. As of 2012, the largestcommercial wind turbine available is 7.5 MW,with a rotor diameter of 127 m, and severallarger diameter turbines are available (up to164 m). Turbines with a rated capacity rangingfrom 1.5 MW to 2.5 MW still comprise thelargest market segment.
Wind turbines generate electricity from windspeeds ranging from 3 metres per second(m/s) or 4 m/s to 25 m/s (even 34 m/s withstorm control). Theavailability of a windturbine is the proportion of time that it istechnically ready for use, a useful indication ofO&M requirements, and the reliability of thetechnology in general. Onshore availabilitiesare usually more than 95%. Availability ofoffshore wind power plants in Denmark andSweden have been mostly between 92% and98%, but some years of lower availabilit ies haveoccurred. In the Netherlands and the UnitedKingdom, offshore power plants availabilitieshave been less than 90% in the first years ofoperation, but in most cases have recoveredtowards 95% (GL Garrad Hassan, 2013a).
Box 1: Modern wind turbine technology: major achievements over last five years

8/13/2019 IEA2013WindRoadmap
http://slidepdf.com/reader/full/iea2013windroadmap 16/63
14 Technology Roadmap Wind energy
Advancing towards
competitiveness Where the resource is good, and conventionalgeneration costs are high, onshore wind energymay be competitive with newly built conventionalpower plants today. This is the case in Brazil,where recent power auctions saw wind bids as lowas USD 42/MWh. Australia, Chile, Mexico, NewZealand, Turkey and South Africa also see land-based wind power competing or close to competingwith new coal- or gas-fired plants. Competitiveness,however, is not yet the norm and reducing thelevellised cost of energy (LCOE)1 from wind remains
a primary objective for the wind industry.2
PricingCO2 emissions from fossil-fuel combustion to reflectclimate change externalities would help windachieve competitiveness more rapidly.
1. The LCOE represents the present value of the total cost(overnight capital cost, fuel cost, fixed and variable O&M costs,and financing costs) of building and operating a generating plantover an assumed financial life and duty cycle, converted to equalannual payments, given an assumed utilisation, and expressed interms of real money to remove inflation.
2. The Wind IA “Task 26: Cost of Wind Energy” group has publisheda standard methodology to assess wind energy costs. (Schwabeet al. , 2011).
Investment costs
In the previous version of the IEA Wind Roadmap (IEA, 2009), the investment costs for onshorewind energy – including turbine, grid connection,foundations, infrastructure and installation – rangedfrom USD 1.45 per watt (USD/W) to USD 2.60/W.The range today is even larger, spanning from thelow USD 1.10/W in China to the high USD 2.60/Win Japan (IEA, 2013); mid-range prices are found inthe United States (USD 1.60/W) and Western Europe(USD 1.70/W).
Following a period of steady decline, investmentcosts rose considerably in 2004-09, doubling in
the United States for example. This increase wasdue mostly to supply constraints on turbines andcomponents (including gear boxes, blades andbearings), as well as higher commodity prices,particularly for steel and copper (the increase incommodity prices also affected conventional powerproduction). Since 2009, investment costs havefallen along with commodity costs and the reversalof supply constraint trends as well as increasedcompetition among manufacturers. All factorsconsidered, investment price declined by 33% ormore since late 2008 (Figure 5).
Figure 5: Cost trend of land-based wind turbine prices, by contract date
Note: data exclude Asian turbines.Source: Tabbush, 2013a.
KEY POINT: investment costs for onshore wind power have declined steadily since 2007.
0.7
0.8
0.9
1
1.1
1.2
1.3
H 2 2 0
0 6
H 1 2 0
0 7
H 2 2 0
0 7
H 1 2 0
0 8
H 2 2 0
0 8
H 1 2 0
0 9
H 2 2 0
0 9
H 1 2 0 1 0
H 2 2 0 1 0
H 1 2 0 1 1
H 2 2 0 1 1
H 1 2 0 1 2
H 2 2 0 1 2
H 1 2 0 1 3
E U R / W
Cost of turbines

8/13/2019 IEA2013WindRoadmap
http://slidepdf.com/reader/full/iea2013windroadmap 17/63
15Wind energy progress since 2008
Investment costs for offshore wind can betwo to three times higher than onshore winddevelopments, but limited data on offshore costsmake it difficult to calculate accurate estimates.It is known that in offshore projects, the turbineaccounts for less than half of the investment cost,compared to three-quarters for land-based projects.Offshore projects incur additional expenses forfoundation, electric infrastructure and installationcosts, which vary with distance from shore andwater depth. In 2008, offshore investment costsranged from USD 3.10/W to USD 4.70/W. Costshave increased in the 2010-13 period, spanningfrom USD 3.60/W to USD 5.60/W (Wind IA, 2012;JRC, 2012). It should be noted that the low numberis from Denmark, and does not include gridconnection to the shore (Wind IA, 2012).
The investment costs of offshore wind in the UnitedKingdom have significantly increased since the firstcommercial-scale wind power plants were deployedin the early 2000s. This results from underlying costincreases, reliability concerns and deeper watersites: while earlier plants were in relatively shallowwaters, most new plants since 2010 are locatedin water depth exceeding 20 m (Crown Estate,2012a). Recently announced wind power plants forsimilar sites show that capital costs have levelledoff at GPB 2.60/W to GBP 2.90/W (USD 4.00/W toUSD 4.40/W) including transmission capital costs(Figure 6). This reflects several factors including abetter understanding of the key risks in offshorewind construction and larger projects leading togreater economies of scale.
Figure 6: Capital costs of European offshore wind farms, by year (EUR/W)
Note: the bubble diameter is proportionate to wind farm capacity; EUR/W = EUR per watt.Source: GL Garr ad Hassan, 2013b.
KEY POINT: while technical advances since 2008 make it possible to install in deeper water,they also drive up investment costs for offshore wind power.
0.0
1.0
2.0
3.04.0
5.0
6.0
7.0
8.0
1990 1995 2000 2005 2010 2015 2020
O f f s h o r e
w i n d
f a r m c a p i t a l
c o s t ( 2 0 1 1 E U R / W )
Year operational
Operational Under construction Contracted
O&M
The O&M costs of wind turbines represent animportant component – 15% to 25% – in thecost of wind power. O&M activities typicallyinclude scheduled and unscheduled maintenance,spare parts, insurance, administration, site rent,consumables and power from the grid. Lowavailability of data makes it difficult to extrapolategeneral cost figures, as does the rapid evolution
of technology: O&M requirements dif fer greatly,according to the sophistication and age of theturbine. Problems with electrical and electronicsystems are the most common causes of windturbine outages, although most of these faults canbe rectified quite quickly. Generator and gearboxfailures are less common, but take longer to fix andare more costly.

8/13/2019 IEA2013WindRoadmap
http://slidepdf.com/reader/full/iea2013windroadmap 18/63
16 Technology Roadmap Wind energy 16
Based on recent contracts, O&M shows a 44%decrease in average prices (as EUR per MW per year [EUR/MW/yr]) from 2009 to 2013 (Figure 7). With a capacity factor of 25%, the 2013 costs forland-based would thus be EUR 7.90 per MWh (EUR/MWh) (USD 10.25/MWh). The span, however, canbe large ranging from USD 5 per kilowatt hour
(USD/kWh) to USD/kWh (Wiser and Bolinger, 2013).For offshore projects, O&M cost range exhibits alow of USD 20/MWh (stable since 2007), while theupper end has increased from USD 48/MWh in 2007to USD 70/MWh (NREL, 2012).
Figure 7: Recent trends in average price for full-serviceO&M contracts (EUR/MW/yr)
Source: Tabbush, 2013b.
KEY POINT: O&M costs of land-based wind power have decreased by almost half since 2007.
30 990
21 74520 120 19 152
17 312
0
5 000
10 000
15 000
20 000
25 000
30 000
35 000
July 2009 2010 2011 2012 2013
Prices in EUR/MW/year
LCOE
The LCOE of wind energy can vary significantlyaccording to the quality of the wind resource, theinvestment cost, O&M requirements, the cost ofcapital, and also the technology improvementsleading to higher capacity factors.
Turbines recently made available with higher hubheights and larger rotor diameters offer increasedenergy capture. This counterbalances the decade-long increase in investment costs, as the LCOE ofrecent turbines is similar to that of projects installedin 2002/03. For some sites, LCOEs of less thanUSD 50/MWh have been announced; this is true ofthe recent Brazil auctions and some private-publicagreements signed in the United States. Technology
options available today for low-wind speed – tall,long-bladed turbines with greater swept areaper MW – reduce the range of LCOE across wind
speeds (Figure 8). More favourable terms for turbinepurchasers, such as faster delivery, less need forlarge frame agreement orders, longer init ial O&Mcontract durations, improved warranty terms and
more stringent per formance guarantees, have alsohelped reduce costs (Wiser and Bolinger, 2013).
Higher wind speeds off shore mean that plants canproduce up to 50% more energy than land-basedones, partly offsetting the higher investment costs.However, being in the range of USD 136/MWh toUSD 218/MWh, the LCOE seen in offshore project sconstructed in 2010-12 is sti ll high compared toland-based (JRC, 2012; Crown Estate, 2012b). Thisreflects the trend of siting plants farther from theshore and in deeper waters, which increases thefoundation, grid connection and installation costs.Costs of financing have also been higher for largerdeals at new sites, as investors perceive higher risk.

8/13/2019 IEA2013WindRoadmap
http://slidepdf.com/reader/full/iea2013windroadmap 19/63
17Wind energy progress since 2008
Figure 8: Estimated change in the LCOE between low- and high-wind-speed sites
Source: Wiseret al ., 2012.
KEY POINT: cost of land-based wind power has fallen more rapidly at low-wind sitesthanks to the use of larger rotors.
0
20
40
60
80
100
120
2002-03standard technology
Current, 2012-13technology choice
L e v e l i s e d
c o s t o f e n e r g y ( U
S D / M W h )
i n c l u d e s
f e d e r a l P T C a n d
M A C R S
6 m/s
8 m/s
7 m/s
39% cost reduction
24% cost reduction
Barriers encountered,overcome or outstandingSince the first IEA Technology Roadmap on windpower was published in 2009, stakeholders haveencountered – and gained experience in addressing– several barriers that delay the deployment of windenergy and the achievement of targets set in energypolicy. Permit/authorisation delays and high costsfor administrative and grid connection proceduresare issues in many countries. Other barriers relate
to the lengthy approval of environmental impactassessments (EIAs), compliance with spatialplanning, the number of parties involved, anabsence of information on the grid connectioncapacity, a lack of planning for grid extension andreinforcements, insufficient grid capacity and landownership. For example, the German offshore windprojects faced delays in 2011 due to financial andtechnical issues. Delays in grid reinforcements alsoled to curtailments of wind energy in China.
The permitting process for wind power plants canbe complicated, long and expensive. Finding waysto simplify the process and co-ordinate amongauthorities can speed up considerably the buildingof wind power. As public acceptance is needed
to avoid lengthy appeal processes, authoritiesneed to assess safety margins to buildings, radars,roads, airports, etc., and address concerns aboutthe presence of bats and birds (such as raptors).Still, the size of areas in which building windpower plants is forbidden has been shrinking overtime, as knowledge of actual impacts improves.Some management measures – such as stoppingthe turbines when bird migration occurs – canalso reduce negative environmental impacts andfacilitate obtaining permissions to build.
Financing of wind power remains a substantialchallenge, as it is relatively new territory for bothcompanies and financial institutions. Politicaland regulatory stability are needed to counteractperceived high risk, particularly in times ofeconomic crisis, when banks reduced long-termlending and have increased borrowing costs. Muchdiscussion has explored “alternative” providers ofdebt (private placements, debt funds, institutional,etc.) – but so far the gap has not been closed.Efforts to make public financing available can helpavoid higher cost of capital, yet is it also clear thatpolitical and regulatory instability can severelyimpact project viability and financing. There isevidence of market fears of government making

8/13/2019 IEA2013WindRoadmap
http://slidepdf.com/reader/full/iea2013windroadmap 20/63
18 Technology Roadmap Wind energy 18
retroactive changes to support schemes (as in Spain)or ex-post creation on taxes on existing plants, andof higher financing costs in some countries (as inIndia) (CPI, 2012).
Project financing is particularly challengingin the offshore wind sector, which still faceshigh technological and construction risks. Theincreasing scale and complexity of the innovativeprojects create a perception of higher risk, themain constraint to raising investments, but alsothere is a lack of capital to fulf il the growing sectorneeds. Funding support – grants for technologydevelopment and loans for deployment – istherefore of crucial importance. Specific measures
may be needed to finance the offshore sector andavoid specific delays in:
z starting the projects and achieving financing:permitting for offshore areas may need newprocedures and the establishment of publicfinancing options; and
z grid connection: the regulator and systemoperators need to address future offshore plansin good time to establish planning and financingneeded.
Medium-term outlookDespite uncertainties and complications associatedwith the ongoing financial and economic crisis, theprospects for both land-based and offshore windpower development in the next five years remainpositive (IEA, 2013).
From a global perspective, land-based wind isprojected to reach an installed capacity exceeding500 GW by 2018, despite a slow-down in 2013.China will likely have the largest cumulativecapacity with a total of 185 GW, followed by theUnited States (92 GW), Germany (44 GW) and India(34.4 GW). Global production of land-based wind
power should reach 1 144 TWh in 2018, with non-OECD countries producing over 44%, a substantialincrease from less than 30% in 2012.
With strong support in some countries, offshorewind progresses significantly to 2018, but itsviability over the medium term ultimately dependson tackling technical and financial challenges. By2018, it should reach 28 GW, an impressive scalingup from 5.4 GW in 2012. Europe, led by the United-Kingdom, then Germany and Denmark, is drivingmuch of the growth, representing almost two-thirdsof total cumulative capacity by 2018. China (28%),the United States, Japan and Korea account for therest. By 2018, offshore wind should deliver 76 TWhof electricity globally – a third of which from theUnited Kingdom, followed by China.

8/13/2019 IEA2013WindRoadmap
http://slidepdf.com/reader/full/iea2013windroadmap 21/63
19Vision for deployment and CO 2 abatement
Vision for deployment and CO 2 abatementTheoretically, wind supply could meet globalenergy needs several times over (Wiseret al. ,2011) while producing virtually no CO
2 emissions.
However, the amount of wind resources that canbe harvested in a cost-effective manner is currentlymuch smaller. Although the best sites deliver themost power in relation to the level of investment,and should be developed first, the economicpotential for other sites will increase over time asthe technology matures, and as ways are found toincrease the ability of power systems to incorporategreater wind energy production (e.g. throughexpanded transmission networks and flexibility).
CO2 reduction targets fromthe ETP 2012 Scenarios Wind power plant s installed by end 2012 areestimated to generate 580 TWh/yr of cleanelectricity and thus avoid the emission ofabout 455 MtCO2/yr. In the ETP 2012 2DS andhiRen Scenarios (IEA, 2012a) (see Box 2), whichthis roadmap takes as its point of departure,deployment of wind power contributes 14% to 17%of the power sector CO2 emissions reductions in
2050. In the scenarios, global electricity productionin 2050 is almost entirely based on zero-carbonemitting energy technologies, including renewables(57% to 70%); the higher the renewable share,the lower the corresponding shares of fossil fuelswith CCS (14% to 7%) and nuclear (17% to 11%).Over the complete lifecycle of wind power plants,emissions of CO2 are negligible.
At the system level, the variable nature of windpower may require additional flexible reserves(e.g. combustion turbines) to respond to increasedvariability and uncertainty in the power system.Concerns have been expressed that this may raisethe CO2 emissions of the power sector, either as a
result of cycling losses or, in the longer term andin some countries, as a result of a displacement ofcarbon-free but inflexible capacities (e.g. nuclearpower in France or Germany) with flexible fossil-fuelled plants. In reality, such cycling losses areanticipated to be very small –i.e. less than 0.5%(GE Energy, 2012). Emission increases can beseen in some countries, but will be limited byinterconnections among countries. IEA modellingscenarios indicate that related CO2 emissions will bemuch less than the emission reductions achieved bywind power expansion.
Box 2: ETP Scenarios: 6DS, 2DS, hiRen
This roadmap has as a starting point the visionfrom the IEAETP 2012 analysis, which describesdiverse future scenarios for the global energysystem in 2050.
A Base Case Scenario, which is largely anextension of current trends, projects thatenergy demand will almost double during theintervening years (compared to 2009) andassociated CO2 emissions will rise even morerapidly, pushing the global mean temperatureup by 6°C (the 6°C Scenario [6DS]). Analternative scenario sees energy systemsradically transformed to achieve the goal oflimiting global mean temperature increaseto 2°C (the 2° C Scenario [2DS]). A thirdoption, the High Renewables Scenario (hiRenScenario), achieves the t arget with a largershare of renewables, which requires fasterand stronger deployment of wind power tocompensate for the assumed slower progress
in the development of CCS and deployment
of nuclear than in 2DS. This hiRen Scenariois more challenging for renewables in theelectricity sector.
The ETP 2012 analysis is based on a bottom-up TIMES* model that uses cost optimisationto identify least-cost mixes of energytechnologies and fuels to meet energydemand, given constraints such as theavailability of natural resources. Covering28 world regions, the model permits theanalysis of fuel and technology choicesthroughout the energy system, representingabout 1 000 individual technologies. Ithas been developed over several years andused in many analyses of the global energysector. Recently, theETP 2012 model wassupplemented with detailed demand-sidemodels for all major end-uses in the industry,buildings and transport sectors.
* TIMES = The Integrated MARKAL(Marketing and AllocationModel)-EFOM (energy flow optimisation model) System.

8/13/2019 IEA2013WindRoadmap
http://slidepdf.com/reader/full/iea2013windroadmap 22/63
20 Technology Roadmap Wind energy 20
Wind targets revisedupward compared to2009 roadmapTo achieve the targets set out in the 2DS and hiRenScenarios, it is necessary in this update to increaseconsiderably the wind capacity deployment thatwas envisioned in 2009. Against the initial windroadmap, the 2DS now sees a deployment of1 400 GW in 2030 (compared to 1 000 GW) and2 300 GW in 2050 (compared to 2 000 GW). Interms of electricity generation, the 2DS foresees6 150 TWh in 2050 (almost a 20% increase), so thatwind achieves a 15% share in the global electricitymix (against 12%).
Wind capacity in the hiRen Scenario reaches1 600 GW in 2030 and 2 700 GW in 2050, andgenerates 7 250 TWh, almost a one-fifth increasecompared to the 2DS. In this scenario, the share ofwind power in electricity generation increases to
18% in 2050. The higher penetration of wind in thehiRen is driven by a lower deployment of both CCSand nuclear power.
Figure 9: Global electricity mix by 2050 in the 2DS and hiRen scenario
Source: IEA, 2 012a.
KEY POINT: renewables could provide 57% to 71% of world’s electricity by 2050,of which 22% to 32% would be variable.
0
5 000
10 000
15 000
20 000
25 000
30 000
35 000
40 00045 000
2009 20502DS
20502DS hi-REN
T W h
Offshore wind OceanLand-based windSolar PV Solar CSPGeothermalHydropower
Biomass w. CCSBiomass and wasteNuclearOilNat. gas w. CCSNatural gasCoal w. CCSCoal
Renewables57%
71%
32%
Variables22%
As offshore wind power remains more expensive,deployment is expected to take place mainly onland. Offshore will, however, provide a growingshare and will increase to one-third of windgeneration by 2050.
China will overtake OECD Europe as the leadingproducer of wind power, by 2020 in the 2DS andby 2025 in hiRen; in both cases, the United Stateswill be the third-largest market. India and other
developing countries in Asia emerge by 2020 asan important market. By 2050, China leads with1 600 TWh to 2 300 TWh, followed by OECDEurope (1 300 TWh to 1 400 TWh) and the UnitedStates (1 000 TWh to 1 200 TWh), and then by otherdeveloping countries in Asia and the Middle East(Figure 10).
As wind penetration increases, CO2 abatement in2050 from wind energy under the 2DS reaches atotal of 3 Gt/yr over the 6DS (see Box 2), or 4 Gt/ yrif wind power was frozen at it s current level (anda mix of fossil fuels being used to generate thedifference in electricity). China makes the largest

8/13/2019 IEA2013WindRoadmap
http://slidepdf.com/reader/full/iea2013windroadmap 23/63
21Vision for deployment and CO 2 abatement
Figure 10: Regional production of wind electricity in the 2DS and hiRen
Source: IEA, 2 012a.
Figure 11: Additional CO 2 emissions reduction in 2050 by regionin the 2DS and hiRen (over the 6DS)
Source: IEA, 2 012a.
KEY POINT: principal wind markets up to 2050 are China, OECD Europe and the United States.
KEY POINT: China accounts for 35% to 44% of additional CO 2 reductions attributed to wind power in 2050.
OECD Europe260 Mt (9%)
OECD Asia Oceanic
99 Mt (3%)United States472 Mt (16%)
Other OECDNorth America
67 Mt (2%) Africa 108 Mt (4%)
Other developing Asia342 Mt (11%)
Middle East 143 Mt (5%)
India110 Mt (4%)
China1 064 Mt
(35%)
Eastern Europe andFSU 293 Mt (10%)
Latin America73 Mt (2%) OECD Europe
290 Mt (8%)OECD Asia Oceanic
135 Mt (4%)United Sates501 Mt (13%)
Other OECDNorth America
58 Mt (2%) Africa 108 Mt (3%)
Other developing Asia354 Mt (9%)
Middle East 158 Mt (4%)India
131Mt (3%)
China1 681 Mt
(44%)
Eastern Europe andFSU 352 Mt (9%)
Latin America60 Mt (2%)
hiRen2DS
contribution with 1 GtCO2/yr avoided, followed bythe United States at 472 Mt, and other developingAsia and Eastern Europe with 342 Mt (Figure 11).
Under the hiRen additional reductions over the 6DSreach 4 Gt CO2/yr – or 4.8 Gt CO2/yr if wind powerwas frozen at its current level.

8/13/2019 IEA2013WindRoadmap
http://slidepdf.com/reader/full/iea2013windroadmap 24/63
22 Technology Roadmap Wind energy 22
The wind industry suggests that production couldincrease even more, with deployment reaching upto 6 678 TWh from 2 500 GW capacities in 2030,and up to 12 651 TWh from 4 814 GW in 2050
(Figure 12) (GWEC, 2012). This correspondingadvanced scenario would require an average annualinstallation rate of 250 GW, five times the presentinstallation rate.
Figure 12: Wind electricity production in the hiRen versus industry scenarios
Sources: IEA , 2012a; GWEC, 2012.
KEY POINT: industry foresees wind electricity by 2050 as being 75% higher than in hiRen.
0
2 000
4 000
6 000
8 000
10 000
12 000
14 000
2009 2015 2020 2025 2030 2035 2040 2045 2050
T W h
Wind offshoreLand-based wind GWEC, 2012 (advanced)GWEC, 2012 (moderate)
Potential forcost reductionsThe main metric for improvements of technologyis the cost for produced energy, for a certain siteholding constant the quality of wind resource.This will take into account both the improvements
in extraction of energy as well as in the designfor producing the equipment with cost efficientmaterial use.
The European Wind Initiative (EWI) targetscompetitive land-based wind by 2020 and offshoreby 2030, as well as reducing the average cost ofwind energy by 20% by 2020 (in comparison to2009 levels). The cost competitiveness will dependon costs of other technologies as well, and assumesthat externalities of fossil fuels are incorporated.
A compilation of trends from various publications is
summarised in Wind IA Task 26 (2012) where mostLCOE estimates anticipate 20% to 30% reductionby 2030.
Technology innovation, which will continueto improve energy capture, reduce the cost ofcomponents, lower O&M needs and extend turbinelifespan, remains a crucial driver for reducing LCOE(see Wind power technology ). Larger markets willimprove economies of scale, and manufacturingautomation with stronger supply chains can yieldfurther cost reductions.
Given its earlier state of development, offshorewind energy is likely to see faster reductions in cost.Foundations and grid connection comprise a largershare of total investment cost, with foundationshaving substantial cost-reduction potential. Greaterreliability, availability and reduced O&M cost areparticularly important for offshore development asaccess can be difficult and expensive.
The 2DS assumes a learning rate3 for wind energy of7% on land and 9% off shore up to 2050, leading toan overall cost reduction of 25% by 2050. Offshore
3. Learning or experience curves reflec t the reduction in capitalcosts achieved with each doubling of installed capacity.

8/13/2019 IEA2013WindRoadmap
http://slidepdf.com/reader/full/iea2013windroadmap 25/63
23Vision for deployment and CO 2 abatement
Figure 13: 2DS projections for investment costs of wind turbines
Source: IEA, 2 012a.
KEY POINT: investment costs for wind power would decrease by 25% on land and 45% off shore by 2050.
0
5 00
1 000
1 500
2 000
2 500
3 000
3 500
4 000
2010 2015 2020 2025 2030 2035 2040 2045 2050
U S D / k W
Offshore Land-based
investment costs are assumed to fall by 37% by2030, and by 45% in 2050 (Figure 15). The analysesassume a 20% reduction of onshore O&M costs by2030, rising to 23% by 2050. Larger reductions areanticipated for offshore O&M costs, of 35% in 2030and 43% in 2050.
The cost of generating energy is expected todecrease by 26% on land and 52% off shore by 2050,assuming capacity factor increases from 26% to31% on land and 36% to 42% off shore. All figuresanticipate that improved wind turbine technologyand better resource knowledge will more than offsetthe possible saturation of excellent sites.
Global investment to 2050Approximately USD 5.5 trillion to USD 6.4 trillionof investment will be required to reach the 2DStargets of 15% to 18% global electricity produced
from wind energy in 2050. Cumulative investmentsin wind in the 2DS account for 15% of the totalinvestments (USD 36 trillion) in the power sector.Close to 70% will be spent in China, OECD Europeand OECD Americas together (Table 2).
Table 2: Cumulative investment in the 2DS (USD billion)
2010-20 2020-30 2030-50OECD Europe 256 337 831OECD Americas 209 455 628OECD Asia Oceania 32 69 120Africa and Middle East 42 173 194China 305 385 839India 36 38 158Latin America 25 12 74
Other developing Asia 53 105 279Other non-OECD 22 61 185TOTAL 980 1 635 3 308

8/13/2019 IEA2013WindRoadmap
http://slidepdf.com/reader/full/iea2013windroadmap 26/63
24 Technology Roadmap Wind energy 24
Current investment in wind power deployment isalready considerable, with more and more countriesgetting involved: USD 76.560 billion of newinvestment was reported in 2012 (Liebreich, 2013).The 2DS scenarios project the sector to grow from282 GW of installed capacity at the end of 2012 tobetween 2 346 GW and 2 777 GW in 2050. This
would require the annual new capacity installed togrow from 45 GW in 2012 to 56 GW/yr to 65 GW/yron average for the next 38 years, or up to 93 GW/ yrtaking into account repowering. On average,annual investments should double to betweenUSD 150 billion and USD 170 billion.

8/13/2019 IEA2013WindRoadmap
http://slidepdf.com/reader/full/iea2013windroadmap 27/63
25Wind technology development: actions and time frames
Wind technology development:actions and time framesIncreased efforts in wind technology R&D areessential to realising the vision of this roadmap,with a main focus on reducing the investment costsand increasing performance and reliability to reacha lower LCOE. Good resource and performanceassessments are also important to reducefinancing costs.
Wind energy technology is already proven andmaking progress. No single element of onshoreturbine design is likely to reduce dramatically thecost of energy in the years ahead. Design andreliability can be improved in many areas, however;when taken together, these factors will reduceboth cost of energy and the uncertainties that stifle
investment decisions. Greater potential for costreductions, or even technology breakthrough, existsin the offshore sector.
Actions related to technology development fall intothree main categories:
z wind power technology : turbine technologyand design with corresponding development ofsystem design and tools, advanced components,O&M, reliability and testing;
z wind characteristics : assessment of wind energy
resource with resource estimates for siting,wind and external conditions for the turbinetechnology, and short-term forecasting methods;
z supply chains, manufacturing and installationissues .
In light of continually evolving technology,continued efforts in standards and certificationprocedures will be crucial to ensure the highreliability and successful deployment of new windpower technologies. Mitigating environmentalimpacts is also important to pursue.
This roadmap draws from the Wind IALong-termR&D Needs report, which examines most technologydevelopment areas in more detail (Wind IA,forthcoming).
Wind power technologyCost reduction is the main driver for technologydevelopment but others include grid compatibility,acoustic emissions, visual appearance and suitabilityfor site conditions (EWI, 2013). Reducing thecost of components, as well as achieving betterperformance and reliability (thereby optimisingO&M), all result in reducing the cost of energy.
System design Time frames1. Wind turbines for diverse operating conditions: specific designs for cold
and icy climates, tropical cyclones and low-wind conditions.Ongoing. Commercial-scaleprototypes by 2015.
2. Systems engineering: to provide an integrated approach to optimisingthe design of wind plants from both performance and cost optimisationperspectives.
Ongoing. Complete by 2020.
3. Wind turbine and component design: improve models and toolsto include more details and improve accuracy. Ongoing. Complete by 2020.
4. Wind turbine scaling: 10 MW to 20 MW range turbine design to pushfor improved component design and references for offshore conditions. Ongoing. Complete by 2020-25.
5. Floating offshore wind plants: numerical design tools and novel designsfor deep offshore. Ongoing. Complete by 2025.
Advanced components Time frames6. Advanced rotors: smart materials and stronger, lighter materials to enable
larger rotors; improved aerodynamic models, novel rotor architecturesand active blade elements.
Ongoing. Complete by 2025.
7. Drive-train and power electronics: advanced generator designs; alternativematerials for rare earth magnets and power electronics; improved gridsupport through power electronics; reliability improvements of gearboxes.
Ongoing. Complete by 2025.
8. Support structures: new tower materials, new foundations for deep waters
and floating structures.Ongoing. Complete by 2025.
9. Wind turbine and wind farm controls: to reduce loads and aerodynamiclosses. Ongoing. Complete by 2020-25.

8/13/2019 IEA2013WindRoadmap
http://slidepdf.com/reader/full/iea2013windroadmap 28/63
26 Technology Roadmap Wind energy 26
O&M reliability and testing Time frames10. Operational data management: develop standardised and automated
wind plant data management processes; build shared database ofoffshore operating experiences. Ongoing. Complete by 2015.11. Diagnostic methods and preventive maintenance: develop condition
monitoring, predictive maintenance tools and maintenance practices,especially off shore.
Ongoing. Complete by 2015.
12. Testing facilities and methods: develop advanced testing methods andbuild facilities to test large components. Ongoing. Complete by 2020.
13. Increase technical availability: target for offshore turbines to current best-in-class of 95%; minimum O&M requirement for remote locations. Ongoing. Complete by 2020-25.
System design
Moving towards specificwind turbines fordiverse operating conditions requires deeperunderstanding of the conditions in which a windpower plant will operate over its lifetime. The aim isto develop more cost-effective turbine designs withthe ability to extract more energy from the wind,over a longer lifetime and in specific operatingenvironments. Wind turbine manufacturersplanning to offer so-called “cold climate packages”will need to use special materials and components,including specialised measurement systems, heatersor pre-heaters for components and subsystems, and
even nacelle heating to allow comfortable turbinemaintenance. Anti- or de-icing systems for bladesmost often use electro-thermal heating elements.Special foundations may be needed in permafrost.
System design needs tool development to minimiseloads across the components to optimise for specificconditions including offshore, cold and icy climates,tropical cyclone climates and low-wind speeds.Improving model tools requires measurementcampaigns both in the field and in controlledtest facilities.
Optimising power-to-swept area ratios isimportant to achieve lowest LCOEs, especiallyat low-wind-speed sites (Molly, 2012). If thisoptimisation includes connecting costs it may leadto different results,4 as the reduction in connectioncosts might be important, especially for offshorewind farms far from shore. Also, the reducedvariability offered by the weaker turbines is likely tofacilitate the handling of large shares of wind powerin the electricity mix.
4. Consider, for example, a “strong” turbine of specific power(relative to the swept area) of 530 W/m2, assuming on a given sitea capacity factor of 32.4%. On the same site, a “weak” turbine ofonly 294 W/m2 will have a capacity factor of 48.9%. For same sweptareas, the weak turbine will generate only 83.7% of the electricity ofa strong turbine, but will require a connecting line of only 55.5% ofthe capacity of that needed for the strong turbine (Molly, 2011).
R&D targets forup-scaling to 10 MW to 20 MWturbines will push the technology towards newsolutions, which may help reduce costs for the2 MW to 5 MW turbine size (seen as sufficient formost applications). Optimum size for both land-based and offshore applications is still to be solved(EWI, 2013). Further enlargement of land-basedturbines is limited by logistics constraints as well assound and visibility regulations. Offshore up-scalingwill bring more direct benefits. A comprehensiveevaluation by the UpWind Project (funded by theEuropean Union) found a 20 MW turbine technicallyfeasible, with need for significant advances inmaterials, design architectures, controls capabilitiesand other factors (UpWind, 2011). Achieving thevastly larger turbines expected in future generationswill require new R&D and innovations to offset ormitigate the mass increases that would be assumedfrom classical scaling-up theory (Figure 14).
Advanced components
Advanced rotors , with larger swept area and higherreach, provide greater energy capture and havealready reduced the cost of wind energy. As rotorsbecome larger with longer, more flexible blades,a fuller understanding of their behaviour duringoperation is required to inform new designs. Noisereduction technologies are important to increasethe amount of land available for wind projects.Other promising technologies can be developedto improve blade pitch control and advanceblade bearing and pitch systems and hub design,materials and manufacture.
Drive-train component improvements can berealised through a comprehensive optimisationof the whole turbine. Increased controls, throughpower electronics , can reduce loads and material
intensity. Hydraulic drive-train designs, in which a
8/13/2019 IEA2013WindRoadmap
http://slidepdf.com/reader/full/iea2013windroadmap 29/63
27Wind technology development: actions and time frames
Figure 14: Growth in size of wind turbines since 1980 and prospects
Source: adapted from EWEA, 2009.
KEY POINT: scaling up turbines to lower costs has been effective so far,but it is not clear the trend can continue forever.
320300280260
H u
b h e
i g h t
( m )
240220200180
Rotor diametre (m)Rating (kW)
Futurewind turbines
FutureFuture
1 9 8 0
- 9 0
1 9 9 0
- 9 5
1 9 9 5
- 2 0 0 0
2 0 0 0
- 0 5
2 0 0 5
- 1 0
2 0 1 0
- 2 0 1 5
2 0 1 5
- 2 0 2 0
16014012010080
604020
0
250 m20 000 kW
150 m10 000 kW
125 m5 000 kW
100 m3 000 kW
80 m1 800 kW70 m
1 500 kW50 m750 kW30 m
300 kW17 m75 kW
hydraulic system replaces the mechanical gearbox,are also a possibility. Continued development oflarger and greater turbine capacities will necessitatehigher capacity power electronics and enhanced
grid support capabilities from wind power plants.Lower cost power conversion is expected fromdeployment of higher voltage power electronics(UpWind, 2011).
Box 3: Abundance of rare earths
Rare earth oxides (REOs) are used in manymodern devices such as catalytic converters,LCD screens, rechargeable batteries, and windturbine generators (about 20% of them, whethergeared or direct drive) that use permanentmagnets. These generators are more compact,more efficient, and require less maintenance,which is especially important off shore.
Fears have been expressed that scarcity ofREOs may impede large-scale deployment ofwind power. However, known reserves areestimated to represent 1 000 years of supplyat current consumption levels (USGS, 2013). In
fact, prices for the neodymium oxide used toproduce magnets dropped from USD 195/kg toUSD 80/kg during 2012 – a trend which doesnot suggest imminent scarcity. Extrapolationsshow that the wind power industry willcontinue to represent less than 1% of the globaldemand. The real issue is that 95% of currentREO production occurs in China, which restrictsexports but has only 30% of the world’s knownreserves. Mining projects are currently beingconsidered in more than 20 countries, andresearch is underway for alternative materials inmany applications.

8/13/2019 IEA2013WindRoadmap
http://slidepdf.com/reader/full/iea2013windroadmap 30/63
28 Technology Roadmap Wind energy 28
Support structures could benefit from advances inmaterial research that might further reduce costs.Materials with higher strength-to-mass ratios (e.g. carbon fibre and titanium) could enable larger arearotors, lighter generators and other drive-traincomponents, thereby reducing tower head mass.New materials could also provide solutions for tallertowers and reduce the dependence of permanentmagnet generators on rare earths. As turbinesapproach 10 MW, direct-drive superconductinggenerators may offer potential to lower mass andsize, while also providing the reliability benefits ofdirect-drive platforms (Abrahamsenet al., 2010).
Wind turbine and wind farm ( i.e. plant-wide)
controls are an important area for cost reductionin wind power. Industry is currently undergoing a
transformation to optimise at the plant level, withindividual turbines viewed as components that canbe designed and operated for specific locationswithin the plant as a whole. Turbine-mountedLidar (Light and radar) will be used to informturbines of changes in wind speed, direction andturbulence, making it possible to optimally positionturbines (and pitch blades) as changes occur in theapproaching wind. Such capabilities offer the dualbenefit of enhanced performance and reducedfatigue loads (UpWind, 2011).
All these improvements could drive about 20% costreduction of the lcoe of land-based wind power by2020 (Figure 15).
Figure 15: Target for cost reductions of land-based wind powerin the United States
Source: US DOE, 2013.
KEY POINT: incremental progress on many fronts can reduce land-based wind power costs.
L e v e l i s e d c o s t o f e n e
r g y ( U
S D / M W h )
Bladearchitecture,
controls,aero-acoustics,aero-dynamics,controlsystemsreduce bladeloads
Drivetrainarchitecture,powerelectronics,controlsystemsreducegeneratorloads
Towerarchitecture,innovativematerial,controlsystemsreducetower loads
Optimised
electricalinfra-structure
Optimised
resourceassessment,forecasting,optimisedmicro-siting,controlstrategies
Testing,standards,transparent informationsharing
Reducedcomponent defects andfailures,conditionmonitoring,optimisedO and Mstrategies
2 0 0 9
L C O E
b e n c h m
a r k
2 0 1 0
L C O E R o
t o r
Rotor
D r i v e
t r a i n
Drivetrain
T o w e r
Tower
B a l a n
c e o f
p l a n t
Balance of plant
P l a n t p
e r f o r m a
n c e
o p t i m i
s a t i o n
Plant performance optimisation
S y s t e m
v a l i d a
t i o n
System validation
O p e r a
t i n g c o s t
s
Operating costs
2 0 2 0
L C O E
2009 LCOE benchmark
0
10
20
30
4050
60
70
80
90
Special considerationsfor offshore developmentOffshore challenges: the design of offshoreturbines for distant offshore installations willcontinue to deviate from that of land-basedturbines, with less focus on issues such as flicker,
sound and aesthetics. Continued turbine scalingwill remain critical for offshore technology, as ithas already resulted in lower balance of plant andoperations costs while simultaneously increasingenergy capture.

8/13/2019 IEA2013WindRoadmap
http://slidepdf.com/reader/full/iea2013windroadmap 31/63
29Wind technology development: actions and time frames
The interaction of the marine atmosphere and seawaves, which places different loads on variousparts of the wind turbine and its foundation,requires continued attention. As long as the realrequirements of wind technology in offshoreconditions remain insufficiently understood,conservative design practices – adopted from otheroffshore industries – are likely to be used for turbinedesign (Wiser and Bolinger, 2012).5�
Offshore turbines could adopt a design other thanthe mainstream three-blade concept,e.g. twoblades rotating downwind of the tower. Improvedalternative-current (AC) power take-off systemsor the introduction of direct-current (DC) power
systems are also promising technologies for internalwind power plant grid offshore and connection to
5. Assessment of a number of shallow, transitional, and deep-wateroffshore concepts is ongoing in the IEA Wind Task 30 OffshoreOC4 group.
shore. Changes in design architecture and an abilityto withstand a wider array of design considerationsincluding hurricanes, surface icing, and rolling andpitching moments, are also likely to be needed.
In total, the US DOE expects a 40% reduction inthe cost of electricity generated by offshore windby 2030; the UK Crown Estate foresees similarreductions for wind projects to be decided as earlyas 2020 (2013b; Crown Estate, 2012b). The CrownEstate expects cost reductions from areas suchas competition and installation, with the largestsavings (17%) from turbine changes (Figure 16 andBox 4). Of this, increase in rated power accounts fornine percentage points, as it reduces capital costs
by as much as 4% to 5%, operating costs by 10%to 15%, and increases annual energy production byup to 5%.
Box 4: UK projections for offshore cost reductions
In the United Kingdom, the government-ownedCrown Estate manages all offshore sites. The
Renewables Roadmap target is to cut the cost ofwind power to GBP 100/MWh (USD 150/MWh)and install 18 GW capacity off the UK coasts by2020.
All parts of the supply chain will need toplay their roles in building the industry andbolstering innovation to drive down the cost ofenergy in line with the seven areas identified bythe roadmap:z introduction of larger turbines with higher
reliability and energy capture and lower
operating costs; z greater competition in key supply markets
(e.g. turbines, foundations and installation)from within the United Kingdom, Europe andEast Asia;
z greater activity at the front end of projects,including early involvement of suppliers andimproved wind farm design;
z economies of scale and standardisation;
z optimisation of installation methods;
z
mass-produced, standardised deep waterfoundations;
z lower costs of capital through de-riskingconstruction, and O&M.
As cost reductions require a larger market,predictability and permanence of the market isneeded to achieve maximum results. Wind farmdevelopers and suppliers must work togetherto deliver continuous, end-to-end cost and riskreduction. Managing a pipeline of projects,rather than working project by project, willhelp to drive down cost.
The cost of capital is a key driver of LCOE foroffshore wind plants. A drop of one percentagepoint in the weighted average cost of capital
(WACC) reduces LCOE by about 6%. As theoffshore industry gains experience, key risks(e.g. installation costs and timings, turbineavailability, and O&M costs) will be bettermanaged, and the overall risk profile ofoffshore projects will decline, thereby loweringthe returns sought by capital providers. Movingto products specifically designed for offshorewind and industrialising the supply chainprovides multiple opportunities to reducecapital and operating costs and increase powergeneration (Crown Estate, 2012b).

8/13/2019 IEA2013WindRoadmap
http://slidepdf.com/reader/full/iea2013windroadmap 32/63
30 Technology Roadmap Wind energy 30
Figure 16: Cost-reduction potential of offshore wind power plants,United Kingdom
Source: Crown E state, 2012b.
KEY POINT: progress all along the value chain can reduce the cost of offshore wind power.
3
4
6
3
5
17
9
39 Total
Other
Support structures
Installation
Scale/Productivity
Front end activity
Competition
New turbines
% reduction in levelised cost of energy FID 2011 to FID 2020
Supply chain Technology
The monopile’s relative simplicity and low labourrequirements make it an attractive platform, butthe combination of diverse seabed conditions,deeper water and larger turbines will push thedevelopment for innovative alternatives such asjackets, tripods,gravity-based structures andsuction caissons (Figure 17). Composite towersand foundations might offer greater corrosionprotection, while integrated concrete and steelhybrid structures or entirely concrete structuresmight also deliver benefits (Navigant, 2013b).
Clearly, a sizable offshore wind resource can bedeveloped with the fixed-bottom foundationtechnologies. Floating offshore foundations,by contrast, offer the potential for lessfoundation material, simplified installation anddecommissioning, and additional wind resource atwater depths exceeding 50 m to 60 m. Two recentfirst demonstrations show good performance:Hywind, a 2.3 MW prototype operating off theNorwegian coast since 2009; and US/PT, a 2 MWprototype off the Portuguese coast since 2011. Fivefloating turbines in Portugal received EU funding tobe constructed by 2015.
The long-term cost implications of moving tofloating offshore platforms are not yet clear; yearsof rigorous design and testing will be neededbefore these technologies are commercially viable.New tools will be required to capture the designcriteria, which include the need to address weightand buoyancy requirements as well as the heavingand pitching moments created by wave action.Current floating concepts include the spar buoy, thetension leg platform and the buoyancy-stabilisedsemi-submersible platform (Figure 17). Vertical-axis turbines, which disappeared from land, mayhave a second chance at sea. Although they have ahigher material need to cover same swept areas andhave some dynamical structural issues, their lowercentre of gravity and fewer parts may be suitablein offshore wind. Vertimed, an EU-funded projectled by EDF-Energies Nouvelles with Nenuphar andTechnip, aims to install thirteen vertical-axis windturbines of 2 MW of f Fos-sur-Mer in the FrenchMediterranean waters by 2017.

8/13/2019 IEA2013WindRoadmap
http://slidepdf.com/reader/full/iea2013windroadmap 33/63
31Wind technology development: actions and time frames
Figure 17: Fixed-bottom foundation and floating offshore concepts
Source: Wiseret al ., 2011.
KEY POINT: diverse concepts are being tested for offshore turbines.
Ballast stabilised “spar-buoy”with catenary mooring drag
embedded anchors
Mooring line stabilisedtension leg platform
with suction pile anchors
Buoyancy stabilised“barge” with catenary
mooring linesMonopile Tri-pod Jacket Suction
caissonGravity base
Floating windturbine concepts
O&M reliability and testing
Operational data management can facilitate fasterand less costly O&M. High access costs to offshoreturbines, often coupled with narrow weatherwindows, make reliability a high priority. Minimalon-site O&M can be achieved by equipping turbineswith system redundancy while applying remote,advanced condition monitoring and self-diagnosticsystems can reduce the duration and frequency ofonsite repairs. Offshore turbine designs that create
new access opportunities, potentially allowingrepairs under more diverse weather and seaconditions, are also important.
Reliability and other operational improvementswould be accelerated through greater sharingof operating experience among industry actors,including experiences related to other marinetechnologies such as wave and ocean currenttechnologies. A database of operating experiences,currently being developed in Germany, hasstimulated wider, international research co-operation.. A way should be sought to make
operational data available through a shareddatabase, while taking into account commercialsensitivities. Development of public databases
may need “push” from R&D funding organisationsand government; e.g. granting of subsidies couldbe linked to required reporting of operationalexperience.
Diagnostic methods and preventativemaintenance offer the possibility to use correctivemaintenance with more regular and effectivemeasures that can help to minimise unplannedmaintenance – a critical factor in driving downoperations expenditures. Technological advances
in condition monitoring and more experienceidentifying failure indicators are expected toincrease efficiency in diagnosing and findingappropriate mitigation in advance of failures.Advanced condition monitoring techniques mightinclude self-diagnosing systems, real-time loadresponse, and the ability to manipulate and controlindividual turbines from an onshore monitoringfacility. Co-ordinating preventative maintenanceefforts with improved wind and weather forecastingshould allow operators to minimise turbineproduction losses (US DOE, 2012).

8/13/2019 IEA2013WindRoadmap
http://slidepdf.com/reader/full/iea2013windroadmap 34/63
32 Technology Roadmap Wind energy 32
Long-term options
To date, concepts to replace the current two-to-three-bladed horizontal axis turbine have fallenshort in terms of cost-effectiveness and technicalreliability.
Future research is likely to explore airborne options.Kites might transmit mechanical energy to land-based generators, or fully fledged “flying machines”such as tethered autogyres with rotors run by thewind that provide both lift and power generation.Google recently bought Makani Power, a start-upthat specialises in developing such devices. High-altitude winds are known to be very good and
constant resources, routinely used by pilots to savetime and fuel on eastbound circumpolar flights.Their potential has been said to be considerable(Archer and Caldeira, 2009), but other scientists seea greater potential for environmental perturbationthan for electricity generation (seee.g. Miller, Gansand Kleidon, 2011).
While technologies to get electricity from offshorewinds have been developing, use of winds inmaritime transportation disappeared after havingserved mankind for centuries (except for leisureand some small fishing activities). An array of new
or modernised technologies (e.g. automated sailsand kites) can save fuel and emissions in maritimetransportation, either through direct mechanicalenergy or through electricity generation or both(see e.g. Fagianoet al., 2012). A full description ofthese still immature options is beyond the scope ofthis roadmap.
In the future, innovative combinations of renewableenergies and storage options could prove to becost-effective. There is strong interest in the energyisland proposed in the Netherlands, which willcombine wind power, pump-storage and potentiallytidal power (IEA, 2012b). Other options would tieindividual submarine pumped storage systems withoffshore turbines (see,e.g., Slocumet al ., 2013).
Wind characteristicassessmentAccurate assessment of wind characteristics isneeded for choosing the right turbines for givensites and selecting the specific locations for turbineswithin a wind farm (micro-siting). More precisemeasurements and modelling of external conditions(e.g. climate) can significantly enhance the turbine
design process. Ultimately, efforts in both areascontribute to more precise power productionforecasts, whether five days or five minutes ahead.
One risk factor that influences investments in windpower relates to the anticipated output from agiven plant with turbines located over many squarekilometres. Better understanding of the numerousuncertainties in current wind resource assessmentprocesses could result in lower financing costs. Bothmodels and measurements are needed to estimatethe long-term average wind resource and theturbine output: measurements offer precision andallow benchmarking models, which offer depth inboth time and space.
Resource assessmentand siting
Regional wind atlas and databases , based onmodels that try to capture the wind resource for acertain grid cell, offer a starting point. Such atlasesare already used for potential analyses when sett ingtargets for deployment and regional planning.They can also help wind developers to find the bestsites for projects, but more detailed modelling andmeasurements are needed for actual investments.
A shared database of information on the availabilityof wind resources in all countries with significantdeployment potential would greatly facilitate thedevelopment of new projects. Many countrieshave already published wind atlas maps anddetailed data, including measurements, would alsobe valuable to share, but commercial sensitivityconcerns need to be addressed. Resource data areparticularly sparse in developing countries andfor wind at heights above 80 m and of f shore. Thedatabase should include details of wind variability,average speeds, wind shear, turbulence and
extreme speeds. Ideally, it would also link to otherdatabases of the solar resource, site topography, airtemperature, lightning strikes and seismic activity,as well as off shore relevant external conditions. TheInternational Renewable Energy Agency (IRENA),in collaboration with the Clean Energy Ministerial(CEM) Multilateral Wind and Solar Working Group,recently posted an online compilation of resourcedata for wind.6
As turbines become taller, it becomes more costly toacquire measurements using standard anemometrymasts – particularly off shore.Remote sensing using sonic detection and ranging (Sodar) or light
6. www.irena.org/globalatlas.

8/13/2019 IEA2013WindRoadmap
http://slidepdf.com/reader/full/iea2013windroadmap 35/63
33Wind technology development: actions and time frames
and radar (Lidar) technologies, and computationalfluid dynamics (CFD) techniques to model airflow, have recently been developed but still needvalidation especially for complex terrains.7 Remotesensing is also a future option in turbine nacelles toimprove the control of turbines.
Siting optimisation of wind turbines in a plant could help address the wake effect (i.e. theinfluence of one turbine on the airflow incidenton another turbine), one of the more poorlyunderstood phenomena in wind power. Wakeeffect is particularly significant off shore, wherewind power plants comprise hundreds of turbines,and can reduce energy capture by as much as 10%while often increasing structural loading and O&Mcosts.8 Future research is critical to improve micro-siting and increase the lifespan of the turbines, as is
7. The Wind IA Task 11 has recently published recommendedpractices using SODAR and LIDAR to assess the wind resource.
8. Work for a new IEC standard on wind plant siting IEC 61400-15has started in 2013.
validation of wake models. Reducing array losses andoptimising plant layout by modelling the wake effectcan improve total wind power plant efficiency.
Efforts are underway to standardise methodsfor measurement campaigns and computermodelling of the resource, on-site measurementand data gathering. Uncertainty remains highest fornew types of sites, such as off shore, complex andforested terrains, and those with icy conditions.9 Additional work is needed to develop measurementand modelling techniques, and to standardise bestpractices. Improving the models further requiresmeasurement campaigns in diverse terrains; toachieve multi-scale models for complex flow, it willbe necessary to combine regional and micro-siting models.
9. The Wind IA Task 19 Wind Energy in Cold Climates has publishedRecommended Practices and State-of-the-art reports includingalso measurements http://arcticwind.vtt.fi/.
Resource assessment and siting Time frames
1. International wind atlases: develop publicly accessible databases of land-
based and offshore wind resources and conditions.Ongoing. Complete by 2015.
2. Remote sensing techniques: high spatial resolution sensing technologyand techniques for use in high-fidelity experiments and siting wind powerplants.
Ongoing. Complete by 2015.
3. Siting optimisation of turbines in a wind power plant: develop toolsbased on state-of-the-art models and standardised micro-siting methods;refine and set standards for modelling techniques for wind resource andmicro-siting.
Ongoing. Complete by 2020.
4. Measurement campaigns and model improvement for multi-scalecomplex flow: improve understanding of complex terrain, offshoreconditions and icy climates; develop integrated models linking large-scaleclimatology, meso-scale meteorological processes, micro-scale terrain and
wind farm array effects.
Complete by 2025.
Assess conditions to improve turbine design Time frames5. Measurement campaigns and model improvement for turbine rotor
inflow: experimentation to couple blade loading conditions to rotorinflow, including computational fluid dynamics and wake effects.
Complete by 2020.
6. Marine environment design conditions: design case development forcomplex interactions among wind, waves, turbulence and current,including handling of extreme conditions such as typhoons and icing.
Complete by 2025.
Improve short-term forecasting accuracy Time frames
7. Wind forecasts: meteorological wind forecasts, with feed-back loop fromwind power plant online data to weather forecasting.
Complete by 2020. Weatherforecasting takes input data fromwind power plants.
8. Power production forecasts: for use in power system operation, withstorm and icing forecasts. Complete by 2020.

8/13/2019 IEA2013WindRoadmap
http://slidepdf.com/reader/full/iea2013windroadmap 36/63
34 Technology Roadmap Wind energy 34
Assess conditions to improveturbine design
Measurement campaigns to improve modelsfor turbine rotor in ow are needed to improveknowledge about turbine loading. Coupling bladeloading conditions to rotor inflow requires use ofCFD and modelling of wake effects. Improvingaccuracy of external meteorological conditionsmore broadly is vital to better turbine design. Moreprecise estimates of extreme winds, for example,can reduce the uncertainty of loads for turbines.Moreover, understanding wind characteristics atspecific locations within the wind farm can supportselection of turbines to the site and optimise turbinedesign for operations within that plant, using fullplant control algorithms (instead of single machinecontrols) to optimise the output of the whole plant.
For offshore, work is needed onmarineenvironment design conditions to improveunderstanding of the complex interactions amongwind, waves, turbulence and current conditionsand apply such learning to better turbine design.Knowledge of extreme conditions, such as typhoonsor icing, will be important for certain sites.
Improve short-termforecasting accuracy
Improving the accuracy ofshort-term windforecast is needed for the operation of windpower plants, especially for electricity marketsand the power system. Better predictability ofwind resources will help producers meet deliverycommitments, thereby increasing the economic
value of wind-generated electricity in the powermarket. Forecasts will enable the power system toschedule and dispatch other power plants as costeffectively as possible, and to ensure adequacy ofbalancing reserves in real-time operation.
Improved accuracy ofpower production forecasts on various time scales will support power systemoperation and enable wind power producers to actin electricity markets. Depending on market gateclosure times and system operation practices, timescales of one to two days ahead, four to eight hoursahead and one to two hours ahead can be used.10 Inthe future, forecast accuracy will allow wind powerproducers to operate also in the system (ancillary)
services markets and offer balancing services.
Supply chains,manufacturingand installationRapid growth rates of wind energy have givenrise to occasional bottlenecks in supply of keycomponents, including labour. Supply chaincomplexity for onshore wind has increased with
the deployment of higher towers and larger blades,and supply chain readiness is a particular issue foroffshore wind. Strong supply chains will providestability and predictability for investors.
10. In the United States, several large power markets are ver yeffect ively integrating wind into real-time markets usingforecasts that are within ten minutes ahead, taking advantageof much lower wind forecast errors.
Manufacturing and installation Time frames
1. Advanced manufacturing methods: accelerate automated,localised, large-scale manufacturing for economies of scale, withan increased number of recyclable components.
Ongoing. Continue over 2013-50 period.
2. Offshore installation and logistics: make available enoughpurpose-designed vessels; improve installation strategies; makeavailable suitably equipped large harbour space.
Sufficient capacity by 2015.
3. Develop workforce: develop curricula for wind workforce inindustry and academia. Ongoing. Continue over 2013-50 period.
Advanced manufacturing methods offer pathways
to increase manufacturing efficiency. Strategiessuch as improvements in serial production andautomation, and in locating factories nearer to
installation sites can reduce transport costs and
import taxes, and provide more efficient means ofturbine delivery.

8/13/2019 IEA2013WindRoadmap
http://slidepdf.com/reader/full/iea2013windroadmap 37/63
35Wind technology development: actions and time frames
Economies of scale and cost reductions from actualproject deployment are anticipated when projectscan be delivered at a quicker pace. At present,severe supply chain pressures are seen in theoffshore market segment. Governments shouldconsider support for testing, manufacturing andassembly processes located in specially designedharbours in the vicinity of resource-rich areas (as inthe Bremerhaven area development in Germany).Cross-country co-operation on project installationand grid development may also trigger more R&Dco-operation in this area.
Rising steel prices affect the entire supplychain; bottlenecks for cabling have contributed
significantly to delays for offshore wind projectsin Germany.
Depending on weather and local conditions,installation and logistics of offshore turbines can be a costly and iterative process, constrainedto defined periods by nature protection (e.g. breeding animals in spring and summer) and strictweather windows. Staging, assembly, transportand installation account for a substantial fraction ofoffshore wind costs. Installation vessels (e.g. jack-upbarges and lifting equipment) are costly and morewill be needed to meet demand. Co-operativemeasures such as sharing vessels between projectscould help. Significant upgrades are needed inports that were not designed for the offshorewind industry.
To lower costs, installation strategies need to reducethe amount of work done at sea or with largecranes. To reduce O&M costs, sufficiently robustaccess systems for staff could widen the currentweather windows.
A large, skilled workforce is needed to developnew designs, establish new manufacturing plantsin new locations, develop installation technologies,and to build, operate and maintain wind powerplants. The EU Wind Technology Platform estimatesa gap of 18 000 qualified staff entering theEuropean wind energy workforce in 2030, if therate of graduation from industry-relevant coursesis not increased (TPWind, 2013). The nature of this
shortage changes over time to become dominatedby a lack of qualified O&M personnel.
Governments and state/province authorities couldhelp establish the necessary education and trainingactivities. For example, the American Recovery andReinvestment Act (ARRA) designated USD 500 millionfor projects that prepare workers for careers inenergy efficiency and renewable energy (US DOL,2010). In Europe, the European Academy of WindEnergy hub links several training programmesprovided by centres of excellence at specificuniversities. In the United Kingdom, the RenewablesTraining Network facilitates the transition ofprofessionals from other sectors into the offshorewind industry. A Talent Bank project, hosted by EUSkills, is designed to make it easier for businesses toaccess and organise apprenticeship schemes.

8/13/2019 IEA2013WindRoadmap
http://slidepdf.com/reader/full/iea2013windroadmap 38/63
36 Technology Roadmap Wind energy 36
Effective mechanisms for integrating wind powerinto transmission grids are a key challenge forachieving this roadmap’s goals. Specific actions are
needed to promote transmission grid developmentand to improve the operation of power systems.
Improve transmissiondevelopment
Long-term, interconnection transmissioninfrastructure plans require mechanisms tooptimise existing and future grids. Much of thebest wind resource lies some distance from energydemand centres: delivery of wind-generatedelectricity to end-users requires use of existingtransmission and distribution (T&D) systems (grids).In some cases, the best wind speeds may be just offshore and relatively close to major (coastal) demandcentres – but transmission entails higher costs per
kilometre of connecting lines. Even wind resourcesclose to existing grids create challenges: much ofthe transmission infrastructure is at least 40 yearsold and needs upgrades or reinforcement.
In this regard, wind is one among other driversfor grid strengthening, such as enhancing theintegration of electricity markets and increasingsecurity of supply. The European Network of
Transmission System Operators for Electricity(ENTSO-E) has identified about 100 bottlenecks inthe European transmission grid (Figure 18). Althoughmany are identified as security of supply or marketintegration issues, about 80% have some link to thedeployment of renewables (ENTSO-E, 2012).
Emerging underground cable technology may helpovercome local public opposition and ecologicalconcerns – though at a cost. Strong supportfor R&D initiatives towards new transmissiontechnology will be a key enabler. Developingtransmission planning, grid modelling and powermarket tools are needed to take into accountvariability and lower utilisation t ime of resources likewind power. Operational and planning time scaleswill both be incorporated in the planning task infuture where renewables are increasingly at the coreof long-term planning strategies.
Full utilisation of existing grids is also importantto avoid unnecessary curtailments of wind power.Dynamic line ratings is one promising technologyto help increase transmission capacity over existinglines, but requires more R&D on how it can beapplied more widely.
System integration: actions and time frames
Improve transmission development Time frames1. Develop long-term interconnection transmission infrastructure plans in
concert with power plant deployment plans; advanced planning tools.Complete plans by 2015 andtools by 2020.
2. Establish workable mechanisms for transmission cost recovery and allocation;provide incentives for accelerated permitting and construction of transmissioncapacity.
Complete by 2015-20.
3. Identify agencies to lead large-scale, multi-jurisdictional transmission projectsor a “one-stop shop” approach to regulatory approval of major transmissioninfrastructure projects.
Complete by 2015-20.
4. Develop and implement plans for regional-scale transmission overlays to linkregional power markets.
Complete plans by 2015.Achieve deployment by 2030.
5. Develop and implement plans for offshore grids, linking transmission lines,offshore wind resources and power market zones; develop tools to co-optimiseoffshore grid and wind turbine design (incl. power-to-swept area ratios).
Complete plans by 2015and tools by 2020. Achievedeployment by 2030.
Transmission planning and development

8/13/2019 IEA2013WindRoadmap
http://slidepdf.com/reader/full/iea2013windroadmap 39/63
37System integration: actions and time frame
Figure 18: Bottlenecks in the European electricity network
Source: ENTSO-E, 2012.
KEY POINT: stronger grids would help integrate markets, secure supply and deploy renewables.
Market integration: between price zonesMarket integration: within price zoneGeneration integrationSecurity of supply
This map is without prejudice to the status of or sovereignty over any territory, to the delimitation of international frontiers and boundaries and to the name of any territory, city or area.

8/13/2019 IEA2013WindRoadmap
http://slidepdf.com/reader/full/iea2013windroadmap 40/63
38 Technology Roadmap Wind energy 38
Governments and energy regulators should
accelerate the development of integrated,economically optimal plans for new transmission;doing so across the whole of an interconnectedpower system is a critical enabler.
China is further developing its West-East electricitytransfer project with the building of three electricitytransmission corridors that connect demand centreson the coast with newly built generation capacityin the north, central and south regions (Figure 19).Each corridor of HVDC lines is expected to exceed40 GW in capacity by 2020, and will transportelectricity from coal, hydro, land-based wind andsolar power to large onshore load centres. Windpower curtailment for lack of transmission capacityhas been a serious impediment to wind powerdeployment in China.
Transmission cost recovery and allocation mechanisms are needed to expand capacity. Lack oftransmission capacity is a major obstacle in severalEU countries (Ireland, the United Kingdom andGermany), the United States and China. This reflectsthat it often takes more time to permit and buildtransmission lines than to permit and build wind
power plants. In fact, lack of transmission neededto connect new wind power plants is a potentialbarrier delaying wind energy deployment.
Box 5: Co-ordinated transmission planning in Europe
The European regulation EC 714/2009led to the founding of two bodies, theEuropean Network of Transmission SystemOperators (ENTSO-E), and the Agency forthe Co-operation of Energy Regulators(ACER). ENTSO-E co-ordinates the 41 nationaltransmission systems operators (TSOs) from 34countries. Every two years, it publishes a non-binding Ten-Year Network Development Plan(TYNDP), partly with the aim of increasingtransparency of the European transmissionnetwork.
The TYNDP 2012 comprises eight documents:six regional reports, one scenario outlookand system adequacy report, and the pan-European document, which extract s the mostimportant pan-European projects from theregional reports.
The TYNPD 2012 identifies more than 100projects adding up to 52 300 km of newtransmission lines – an annual grid lengthdevelopment of 1.3% for investment costs ofEUR 104 billion (USD 135 billion) (ENTSO-E,2012). The drivers for new transmissioninclude renewable energy sources (RES)integration (80%), market integration (47%)and security of supply (33%). In Europe,these project costs are not allocated toenergy producers. As transmission is seenas a "common good" , costs are allocated toconsumers, with national regulators beingresponsible for authorising the projects.
Cost allocation is often the most important policy
consideration for allowing new transmission to bebuilt. In general, the approach is that costs shouldbe shared among all beneficiaries, capturing thebroadly distributed benefits of reduced electricitycosts, improved security of supply and strongercompetition in the electricity market. In Europeand in some parts of the United States (includingTexas), the costs are broadly allocated instead of anysingle category of stakeholders –e.g. wind powerdevelopers – paying them entirely (ENTSO-E, 2012).
Texas offers an example of successfully combiningbroad transmission cost allocation policies with pro-active transmission planning. The Electric ReliabilityCouncil of Texas (ERCOT) provided developmentscenarios for the Public Utility Commission (PUC)of Texas, and PUC confirmed (July 2008) thedevelopment of transmission to deliver 18.5 GWof wind power to demand centres from fivecompetitive renewable energy zones located inwest Texas, using the state’s long-standing policy ofbroadly allocating all transmission costs to load. Thenew lines, expected to be in service by end 2013,will reduce the volume of curtailments currentlyneeded for the 10 GW wind installed and increase
opportunities to build 8 GW more. The project isexpected to cost USD 6.9 billion (PUC Texas, 2013).

8/13/2019 IEA2013WindRoadmap
http://slidepdf.com/reader/full/iea2013windroadmap 41/63
39System integration: actions and time frame
Incentives may be needed to encourage TSOs tobuild transmission; such measures must take into
account the capital constraints of most TSOs andthe return expectations of financial investors.Investors, including infrastructure funds, couldthen become more involved in the equity fundingof transmission projects, as this asset class isconsidered attractive at an acceptable return.Offering to TSOs a premium on normal WACC for“new built” is one way to create such incentives.
Effective planning, however, should seek to minimisetotal system costs, rather than focusing solely onmaximising wind power dispatch. As penetrationincreases, it may be necessary to adjust capacities ofwind turbines, grids and entire systems.
Figure 19: China’s West-East electricity transfer project
Note: this is an indicative map figuring the concept of the West-East electricit y transfers. The exac t localisation of corridors is still underdiscussion and subject to possible changes.
Source: D. Tyler Gibson and James Conkling/China Environment Forum at the Woodrow Wilson Center.
KEY POINT: the vast majority of power sources in China – including wind resource –are far from demand centres.
Tibet
/
The siting and permitting of transmission expansionoften involves multiple jurisdictions (local,
state, federal), each with different regulationsand methods of assessing costs, benefits andenvironmental impacts. A stalemate often arises inthat no-one wants to be the first to invest: both thewind plant developer and transmission developerwant to be certain the other party will commit inorder to avoid the risk of being left with a strandedasset (i.e. unusable and of no monetary value). Where generation and transmission asset s areseparated by regulation, integrated planning andinvestment are even more critical.
Policy makers may consider the merits ofmandating a single agency to lead the planningand permitting process when several jurisdictions

8/13/2019 IEA2013WindRoadmap
http://slidepdf.com/reader/full/iea2013windroadmap 42/63
40 Technology Roadmap Wind energy
are involved, or of implementing a “one-stopshop” approach to regulatory approval of majortransmission infrastructure projects. Germanyrecently shifted responsibilities between countiesand federal authorities for lines crossing countyborders: the National Grid Expansion AccelerationAct (NABEG) of 2011 aimed to simplify andaccelerate permitting procedures of nationaland cross-border lines while ensuring a highlevel of public participation. In 2013, a secondlaw containing a “Federal Requirement Plan forTransmission Networks”, identified 36 power lineprojects as “necessary and urgent” and gave soleauthority for any related dispute to the FederalAdministrative Court in Leipzig.
In the United States, new regional and interregionaltransmission planning and cost allocation policiesare required under the Federal Energy RegulatoryCommission (FERC) Order 1000, which alsomandates that transmission planning processestake into account the states’ RPS. Ongoing state,regional and federal co-operation is needed toensure that cost allocation policies will support thenecessary transmission upgrades.
Plan and deploy regional supergrids and offshore grids
High-voltage direct-current (HVDC) linesreduces energy losses during transmission, andis increasingly used worldwide for bulk powertransmission over long distances, for interconnectingpower systems and for systems that require longlengths of cable. From a cost perspective, thebreak-even point between high-voltage alternative-current (HVAC) and HVDC, which is severalhundred kilometres on land, is less than 100 km offshore. Continued evolution of HVDC conversiontechnology, improvements in cable-laying vessels,increased marine cable-laying capacity andinnovative trenching equipment will help reducecosts (Wiser and Bolinger, 2012). One recent HVDCtechnology, voltage source converter (VSC), isusually preferred over the more mature currentsource converter (CSV) for offshore connections.
Distance is a key factor indeveloping andimplementing plans for offshore grids . The NorthSea Countries’ Offshore Grid Initiative (NSCOGI)is a co-operative framework among ten countries,
Figure 20: From radial to fully meshed options for offshore grid development
Source: NSCOGI, 2 012.
KEY POINT: offshore, meshed solutions might be preferable but require more planning and higher certainty.

8/13/2019 IEA2013WindRoadmap
http://slidepdf.com/reader/full/iea2013windroadmap 43/63
41System integration: actions and time frame
the European Commission, ACER, ENTSO-E andnational regulatory authorities. It has published astudy analysing the possible effects of developinga meshed grid versus a radial approach by 2030(Figure 20), which shows some advantages of themeshed option. This approach would, however,require a higher level of certainty on offshore winddeployment – of 42 GW by 2020 and 52 GW by2030 (NSCOGI, 2012).
In the United Kingdom, the total capacity ofoffshore wind power plants having connectionagreements with National Grid is 35.2 GW. A keyindustry issue during 2011/12 was how to movetoward a more co-ordinated onshore/offshore
grid, which could reduce costs and speed upthe connection process. The feasibility of a co-ordinated grid network has been explored, showingthat a meshed grid network could save betweenGBP 0.5 and GBP 3.5 billion (USD 0.77 billionto USD 5.4 billion) compared to a purely radialapproach. Continued work will be needed to resolveissues arising from a co-ordinated grid approach,including unlocking barriers to enable developers toconnect to grids off shore (Crown Estate, 2012a).
Reliable system operation withlarge shares of wind energy Variability and uncertainty are not newcharacteristics of power systems. As demandfor power varies by hours, days, and seasons, all
power systems must have sufficient firm capacityto respond to load, with some safety margin (i.e. operational reserves) to respond to unforeseenevents and forecasting errors. Experiences in Western Europe and the United States suggestthat at low-wind energy shares (5% to 10%), theincrease in variability “seen” by the system will besmall and existing reserve margins are sufficient.As wind penetrations rise, greater amounts ofoperational reserves will be needed to ensure thatcombined (forecast/actual) production from windand dispatchable power plants can continue to bereliably balanced against (forecast/actual) demand.
The main challenge for wind integration is as
follows: once the targeted amount of wind energyhas been captured and converted into electricity,and sufficient transmission capacity has beensecured to deliver it to market, the electricityavailable must be cost-effectively integrated intothe power system while ensuring the security ofsupply. Existing T&D networks and the physicalpower markets they support were designed arounddispatchable, centralised power generation that cantypically be turned of f and on according to demand.In contrast, the generation of electricity from windenergy depends on a variable resource that cannotbe scheduled, as is possible with conventional plant.
Enable wind integration Time frames1. Enable larger balancing areas and use of wind forecast and online
data in control rooms of system operators.2. Assess grid codes and ensure that independent power producers can
access grids.
Ongoing. Complete by 2015-20.
Develop electricity markets Time frames3. Accelerate development of larger-scale, faster and deeper trading of
electricity through evolved power markets and advanced smart gridtechnology.
4. Enable wind power plants taking part in electricity markets, also forsystem services.
5. Incentivise timely development and use of flexible reserves, innova-tive demand-side response and storage.
Ongoing. Market development by 2020and wind power in ancillary servicesmarket by 2025.
Increase power system fexibility Time frames6. Develop methods to assess the need for additional power system
flexibility to enable variable renewable energy deployment.7.
Carry out system studies to examine the challenges, opportunities,costs and benefits of high shares of wind power integration.8. Prepare strategies for managing wind curtailments.
Ongoing. Complete by 2020.

8/13/2019 IEA2013WindRoadmap
http://slidepdf.com/reader/full/iea2013windroadmap 44/63
42 Technology Roadmap Wind energy
Enable wind integration
The first step in wind integration isenablingforecast . Acquiring online data to control roomsmeans accessing also distribution-system connectedplant data. In Spain and Portugal, this is organisedthrough centres for compiling distributed data,which also manage any control orders from theTSOs. Forecasting on a one-to-two day horizon isa primary tool in managing uncertainty. In systemoperation, it is also important to be ready forextreme events (storms and other events with largeramps). In the United States, the FERC expects thatforecasting and intra-hour scheduling be part of anyproposal for charging integration costs. In addition,
generators providing variable energy resourcesmust provide meteorological and forced-outagedata, which the transmission provider can use forforecasting their output
Enabling larger balancing areas and trade withneighbouring areas are important measures tosupport higher shares of wind power. Co-ordinationbetween balancing areas allows for more spatialdiversity, thereby reducing the impact of variablerenewable energy, and also provides synergiesbetween diverse flexible supply-side and demand-side resources. Experience from Germany andthe Nordic countries reveals the value of largerbalancing areas in decreasing reserve needs forindividual system operators. The Nordic powermarket, which covers the whole Scandinavia, hasfacilitated the trade of Danish wind for Norwegianhydropower, helping wind energy to reach 30% ofthe Danish market with moderate balancing costsfrom the day-ahead market.
Grid codes represent the requirements of systemoperators on power producers, and typicallyinclude specifications such as voltage andfrequency. Most modern wind turbines have therequired capabilities to comply with these codes,but further co-operative efforts to standardise thecontent, definitions, terminology and compliance-test methods of grid connection requirements cansupport smoother grid operation.
In the early days of wind power deployment,turbines were mostly connected to distributiongrids – and simply disconnected in case of griddisturbances to simplify the corrective measuresof grid operators. At larger deployment, (e.g. in Germany and Spain) it became evident that
disconnecting turbines that represent severalgigawatts of power can undermine system
reliability. The development of fault-ride-throughcapabilities of wind power plants has become anindustry standard.
Grid code harmonisation, if carefully defined andcoherent with each technology capability, couldlead to more cost-effective turbines. Regulatorsshould ensure that grid codes are equitable andprovide a level playing field for all entrants whileavoiding excessively stringent requirements anduselessly expensive features. In Europe, networkcodes are being elaborated by ENTSO-E accordingto guidelines provided by ACER. Once approvedby the Parliament and the Council, these codes willbe legally binding. The network code in Europe
is based on “envelopes of requirements” thatleave national TSOs free to choose an appropriaterequirement inside these values.
Develop electricity markets
Larger-scale, faster and deeper trading ofelectricity requires evolved markets and smartgrid technologies. Improved operational practices,such as electricity trading rules, can be a powerfulenabler of flexibility. Regulators tasked with marketdesign may wish to consider characteristics, such as:allowing shorter time windows; adjusting balanceof portfolios with enhanced trading options;and extending balancing and provision of othersystem services into demand response, storage andwind generation. Increasing intraday trading andincluding cross-border trading will facilitate winddeployment. Grid operators should be ensuredthe ability to assess grid operation challenges anduncertainty.
Dispatching energy at short intervals is also usefulfor reducing wind integration costs and enablingmore efficient operation of the power system. Thisallows dispatch schedules to be updated within theoperating hour in response to demand and supplydeviations, thus accommodating total systemvariability at far lower costs than when using onlyexpensive reserve generation to accommodateintra-hour variability.
Integrating wind more tightly in the real-timedispatch process has proven a very effective strategyfor independent system operators (ISOs) such as theMidcontinent ISO (in the Midwest United States)and the ERCOT. These ISOs are dispatching windevery five minutes, just as they do with coal, natural
gas and other conventional generators. Because theISOs tell the wind producers how much wind power

8/13/2019 IEA2013WindRoadmap
http://slidepdf.com/reader/full/iea2013windroadmap 45/63
43System integration: actions and time frame
they expect to receive every five minutes, windplants fit into markets and operations just like anyother generating capacity. Using a very short-termforecast (updated within ten minutes of real time)to dispatch the wind plants makes this work: evena simple persistence forecast reduces the forecasterror towards zero as real time approaches.
With wind power already participating in electricitymarkets, some experience with managingimbalances has been gained. In Nordic countries,for example, wind power producers have beenexposed to imbalance costs that have been quitemoderate, USD 3/MWh to USD 4/MWh, even if theydo not reflect the real costs that wind power causes
for system balancing at all hours.System support services from wind power plants are still being developed to provide both voltageand frequency control to system operators whenneeded. Technical requirements on wind turbines(e.g. remote control) to participate in power marketsare increasing in importance. Market rules will needto develop to take advantage of these services infuture, in times when more cost effective servicesare not available from other power plants.
Getting sufficient remuneration from market
prices at high wind (and solar) penetration levelsis a future challenge for wind power in electricitymarkets. Energy-only markets will react to highwinds (or strong sunshine) with very low electricityspot prices, making the transition from subsidisedvariable renewables to market exposure a complextask – even when wind (or solar) power offercompetitive electricity costs.
Increase power system flexibility
Timely deployment and use of exible reserves is vital at higher penetration levels of wind power.Markets need to be designed such that price signalsencourage investment in and subsequent operationof all flexible resources in the region. Timelyinvestment in flexibility should be incentivised,recognising the tendency for large shares ofrenewable energy to depress spot electricity marketprices. Conventional generation, from thermalplants (to dif ferent degrees) to hydropower,already provide some flexibility. Enhancing systemflexibility from thermal plants relates to faster startsand greater ramp rates and ramp ranges; reduced
minimum generation; balancing and responsecapability; better part-load efficiency; and lowemissions to meet environmental requirementsduring cycling. Deeper trade with adjacent marketsand connecting diverse energy sectors (e.g. heat,transport and gas) can further increase flexibilityavailable for balancing. Using dynamic marginalcosts to develop such incentives would be essentialto efficiently integrate wind power.
Other options for flexibility include the use ofdeferrable and responsive demand (i.e demand-side management) through smart meters, andinvestment in energy storage as well as electricand hybrid vehicles. Smart grids that enable bothdemand and supply agents to interact in real t imecreate the potential for an exponential increase inthe number of market participants, which impliesboth benefits and challenges.
Box 6: Geographic “smoothing” of variable output
As distances between wind power plantsincrease, their collective output is generally lesscorrelated. An uncongested grid connected tomany dispersed plants will therefore “see” asmoother aggregated wind output profile thanif all the wind plants were in the same place.The capacity of interconnected markets toshare dispatchable reserve capacity increases
the extent to which wind plants can displaceconventional energy production. Larger,deeper and more liquid electricity markets canbe achieved by merging balancing areas andincreasing trade among systems. Europe hasa political target to merge regional balancingmarkets by the end of 2014.

8/13/2019 IEA2013WindRoadmap
http://slidepdf.com/reader/full/iea2013windroadmap 46/63
44 Technology Roadmap Wind energy
Carrying out system-wide studies to identifychallenges that system operators need to consideras wind power becomes an integral part of powersystem evolution, rather than being developed inisolation. System operators should receive earlynotice of targeted wind energy shares in order toplan accordingly, and should collaborate with windpower developers and manufacturers regardingthe capabilities that wind power plants can offerto system support as well as wind forecastingand on-line data for operator control rooms.TSOs and regulators should co-ordinate actionsto avoid situations of sudden oversupply of newwind capacity that the TSO would be unable toabsorb. Detailed system-wide studies, assessing
the existing flexibility and options to increase it, areimportant to advancing towards high renewableenergy shares. Good examples include the All IslandGrid Study in Ireland (and its continuation studies)and the east and west interconnect studies carriedout in the United States (DCEN, 2008; Ecofys andDIgSILENT, 2010; Enernex, 2011; GE Energy, 2010).11
At higher penetration levels of wind power itis foreseeable that conventional, synchronousgeneration may sometimes provide less than 50%of the load, which raises questions about howthe system might behave and associated stabilityconcerns for which TSO have little or no experience.Research is needed to answer questions aboutmodel accuracy and the extent to which HVDCtransmission reinforcement can be used to stabiliseAC transmission lines.
11. Wind IA Task 25 is preparing Recommended Practicesfor Wind Integration studies, to be published in 2013(www.ieawind.org).
Curtailments of wind power are an emergingconcern . In northern Germany and Texas, somecurtailments were caused by delayed transmissionreinforcement; in Spain, the issue was a lack offault-ride-through capabilities at wind power plants.These situations were largely temporary and havebeen reduced through updates to transmissionsystems and requirements. China’s more seriouscurtailment problems, however, reflect inflexibilityin the operation of the power system. Integrationstudies show that curtailments will become a moreserious challenge at wind power penetration levelsof about 30%. Addressing this issue, which mayrequire compensation for curtailments, is vitalto enabling investors to consider future energy
production options.Further information on integration of variablerenewables will be provided in a forthcomingIEA publication on grid integration of variablerenewables (forthcoming1).

8/13/2019 IEA2013WindRoadmap
http://slidepdf.com/reader/full/iea2013windroadmap 47/63
45Policy, finance, public acceptance and international collaboration: actions and time frame
Strong market pull is needed to complement thetechnology push that will support higher sharesof wind in electricity markets. Action in this areais more associated with policy, finance, publicacceptance and international collaboration thatfosters more rapid deployment of wind power.Sharing the lessons learned from past activitiesand experience in different countries can enhanceawareness, acceptance and deployment.
Incentivising investmentA principal role of government is to attractinvestment in clean energy technologies by
facilitating a predictable and transparent policyframework, including integrating renewable energy
policy into an overall energy strategy. Withoutgovernment incentives or equivalent support, inmost cases the rates of return would be too low andmarkets would stagnate.
To finance the higher amounts of investmentsneeded to expand wind penetration, it is essentialto move from limited resources for risk financingtowards more abundant resources for mainstreamactivities and more conservative financing (suchas pension funds). These investors seek adequaterisk-adjusted returns and stable inflation-adjustedincome streams. A predictable policy environmentis a prerequisite to minimise the perceived risk;by contrast, regulatory uncertainty, including
retroactive changes, can drive up the cost of financeto prohibitive levels.
Policy, finance, public acceptance andinternational collaboration: actions and time frames
Attract investment to wind power Time frames1. Set short- and long-term deployment targets for wind power
(where not already in place).Complete by 2015.
2. Implement incentives and support mechanisms that providesufficient confidence to investors; create a stable, predictablefinancing environment to lower costs for financing.
Complete by 2015.
3.
Internalise the external costs of electricity production into marketprices. Complete by 2020.4. Encourage national and multilateral development banks (MDBs)
to target clean energy deployment. Continue over 2013-50 period.
5. Further develop mechanisms to attract investment in winddeployment (such as the Clean Development Mechanism [CDM]).Continue over 2013-50 period.
Bindingdeployment targets with near-termmilestones provide a clear pathway for technologydevelopment and confirm government support,
both of which further encourage private sectorinvestment. For instance, the European Uniontargets 20% of all energy to be from renewables by2020 (about one-third of all electricity) with bindingtargets for member states, further detailed in theirnational renewable energy action plans (EEA, 2011).Importantly for the longer term, consultations areongoing about possible targets post-2020.
National roadmaps could be created to supportwind development and implementation at thecountry level. The first of these was theChina WindEnergy Development Roadmap 2050 published by
the Energy Research Inst itute of China’s NationalDevelopment and Reform Commission togetherwith the IEA (IEA and ERI, 2011). National roadmaps
would help countries to identify priorities basedon the energy and industrial policy they choose.A detailed process for developing national wind
roadmaps will soon be published as aHow2Guide (IEA, forthcoming2)
Establishing incentives and support mechanismsfor wind deployment can build investor confidence.At present, government support and incentives forrenewable energy producers vary from country tocountry. Common mechanisms include fixed FiTs,feed-in premium (FiPs), production tax credits,RPS or quotas (with or without tradable greencertificates), capital grants and loan guarantees.Most mechanisms seek to establish a return permegawatt hour of electricity that is competitive with
other energy sources and sufficient to attract privateinvestment; loan guaranties in the United Statesfocus on reducing risks for investors. Importantly,

8/13/2019 IEA2013WindRoadmap
http://slidepdf.com/reader/full/iea2013windroadmap 48/63
46 Technology Roadmap Wind energy
Box 7: Attracting private finance
Raising sufficient finance for investments inlow-carbon energy technologies dependson governments sett ing a domestic policyframework that is responsive to evaluation of riskand return profiles on which the private sectormakes investment decisions. Investor confidencecan be strengthened in several ways.
In the case of wind development, potentialinvestors need a solid understanding of thefull range of both perceived and real risks,which can include wind resource uncertainty,technology risk (e.g. unforeseen O&M costsand down-time), predictability and longevity ofgovernment incentives, instability in the carbonprice, and uncertainty regarding the reliabilityand credit-worthiness of other parties.
Partnerships enhance financing, as differentplayers have different risk appetites andfinancing possibilities. Public-privatepartnerships (PPPs) can reduce the risk toprivate investors, and should be used tomaximise leverage. PPPs may be effective, forexample, to secure the construction of newgrid infrastructure, wherein the grid companyprovides the investment capital against agovernmental assurance that the lines willbe used, thereby guaranteeing a return onthe investment.
government policies must have flexibility to adjustthe subsidy level as the cost of wind energy getscloser to conventional technologies. However, suchadjustments must apply only to new plants, as any
retroactive changes to remuneration of existingplants would undermine investor confidence.
Internalising the external costs of electricityproduction is viewed as one way to level theplaying field across primary energy sources.Subsidies might serve to reflect the value of cleanenergy production – including the avoided costsof reduced GHG emissions and pollutants, thepositive impact on health, less energy dependence,etc. – that is not yet effectively internalised inelectricity prices. A more straightforward methodof internalising the cost of GHG emissions in theprice of electricity – which may have more weightin investment decisions – would be to put a priceon emissions through carbon taxes or emissionstrading systems. A carefully designed scheme isparamount to ensure meaningful and stable prices.Even with a carbon price, emerging renewableenergy technologies with good prospects for costcuts could be given additional incentives to unlocktheir long-term potential (Philiber t, 2011).
The critical barriers that can deter or slow downdeployment tend to change as the market for
a technology develops. Policy makers need totake a dynamic approach, adjusting prioritiesas deployment expands. Above all, support
mechanisms should aim to reduce project risksand stimulate deployment, while encouraging thetechnology to reduce costs. A policy must also beeasy to implement and enforce (IEA, 2011).
Public nancing by government or quasi-government agencies has been critical todevelopment of larger wind power projects. Mostoffshore projects in Europe have received supportfrom the European Investment bank (EIB), EksportKredit Fonden (EKF) the Danish export creditagency, Euler Hermes (EH) the German exportcredit agency, or a combination of them. Financingoffshore wind projects in Germany has beenfacilitated by the availability of EUR 5 billion fromthe German Development Bank (Kreditanstalt fürAufwiederbau). The Meerwind project in Germanyincluded financing from US-based private equityfirm, Blackstone. In 2011, DONG Energy sold 50%of the Anholt project to two Danish pension funds,a new source of financing in the sector. Parties areexploring alternative forms of financing such asproject bonds. The European experience shows thatmany different regulatory regimes work as long asthe overall price level is compatible with the currentinstallation costs of offshore wind and the regulatoryframework is sufficiently stable to cover the relativelylong development and construction process.

8/13/2019 IEA2013WindRoadmap
http://slidepdf.com/reader/full/iea2013windroadmap 49/63
47Policy, finance, public acceptance and international collaboration: actions and time frame
MDBs are an important source of financing forjoint development efforts. Financing facilities canbe designed on a case-by-case basis to supportdiffering needs. The Turkish Clean TechnologyFund (CTF) is a business plan established amongthe Turkish government, the World Bank, theInternational Finance Corporation and the EuropeanBank for Reconstruction and Development, worthapproximately USD 1.9 billion.
Alongside policy support, efforts should be madeto identify and address barriers to deployment. Forexample, off-taker risk can be a serious impedimentto investment. A project’s risk profile is considerablyhigher prior to the signature of a power-purchase
agreement and reduces substantially once anoff-taker has been securely identified to buy theelectricity to be produced. In India, China andelsewhere, power-purchase agreements arehabitually signed at project completion – long afterfinancing has been secured. This practice makes itmore difficult to attract investors early, when the bulkof financing is needed. It should be noted that thefinancial reliability of potential off-takers may be inquestion. In such a case, disincentives to investmentcould be reduced by a regulated requirement foroff-takers to contract for electricity when projects areat the financing stage, or by developing a mechanismto shield investors from subsequent failure to securea power-purchase agreement.
Increased effort should be made todevelopmechanisms to attract investment. The CDMwithin the United Nations Framework Conventionon Climate Change (UNFCCC), which is pursuingglobal agreements to cap GHG emissions, hasshown some success in building clean energycapacity in developing economies. Early in 2013,there were 2 616 wind projects in the CDM pipeline,29% of the total amount of projects. Wind ranks
first with respect to the number of projects,followed by hydro (26%). Wind power projects areexpected to yield 19% of total certified emissionsreductions (CERs) issued per year.
China and India dominate among wind CDMprojects. China has 1 511 projects totalling almost84 GW, and India 810 projects totalling about14 GW. Brazil, Mexico, South Korea, South Africaand Chile follow. The rapid increase in winddeployment in China and India has coincidedwith the development of the CDM incentivemechanism for clean energy projects. This growthhas contributed to the development of domesticwind manufacturing bases, particularly in China.However, current uncertainty on the future of theclimate negotiations has put into question thefuture of CDM.
Public engagementand the environmentProminent environmental groups are squarelybehind the large-scale deployment of wind power,while international, national and regional policiestargeting GHG emission reductions have widepublic support. Yet local groups often opposeindividual projects or the installation of transmissionlines, often because of visual impacts, effects onproperty values, health concerns, or impacts onavian, bat and offshore ecology. In some Europeancases, local opposition has delayed importanttransmission interconnector projects by as muchas 15 years. Even as knowledge is gained regardinghow wind power affects the natural environment,uncertainty remains over impacts on local species.If studies from other regions are difficult to find,this lack of information often leads decision makersto reject a wind proposal or take no action at all,forcing developers to less-desirable sites that resultin higher energy costs.
Mitigate impacts and increase public engagement Time frames1. Improve techniques to assess, minimise and mitigate social and
environmental impacts and risks. Complete by 2020.
2. Increase public involvement and understanding, and communityengagement, on the basis of best practices.
3. Promote wind energy as part of a portfolio of abatementtechnologies for GHG emissions and pollution. Continue over 2013-50 period.

8/13/2019 IEA2013WindRoadmap
http://slidepdf.com/reader/full/iea2013windroadmap 50/63
48 Technology Roadmap Wind energy
Rigorous effort is needed toassess, minimiseand mitigate the social and environmentalconcerns associated with wind power – particularlyin response to the sometimes polarised publicdebate. Local EIAs can identify and allay real publicconcerns, as well as avoid subsequent, unforeseenproject delays. Government agencies and the windpower community should work together to buildimproved understanding of local impacts, and toensure that the planning of wind power and relatedtransmission infrastructure is based on transparent,fair and equal criteria.
To avoid duplications of environmental impactanalyses for every wind power project, where
feasible, environmental/radar studies that benefita large number of projects could be financedwith public or shared funding. Overall, a betterunderstanding of impacts and mitigation solutionswill increase the certainty of development outcomesand ultimately lead to more deployment.
Increase public involvementand understanding of the fullvalue of wind
Public involvement is essential to enable efficient
project development. As a tool to help the industryaddress stakeholder questions on wind energy, the
Swedish wind energy industry introduced its firstcode of conduct for the sector in July 2012 (Svensk Vindenergi, 2012). The Wind IA has publishedbest practice recommendations (Wind IA Task 28,2013), outlining methods to identify and minimisenegative local impacts, reduce project uncertaintyand risk due to local attitudes, accelerate projectdevelopment, and establish strategies andcommunication activities to express the full value ofwind power. Support can be built via the provisionof reliable and balanced information, and withcommunity participation at the earliest stages of aproject, including open public hearings. In caseswhere negative environmental effects from wind arelikely, means to minimise and mitigate these effectsneed to be identified and developed.
It is also important that the general public andlocal populations in the vicinity of a proposeddevelopment understand the full value of windenergy. The variability of wind power is takenby some as a measure of unreliability while itscontributions to climate change mitigation andenergy security are often underestimated. Effectivepublic information campaigns that highlightquantifiable benefits of wind power can addressthese concerns.
Planning and permitting
Improve planning and permitting Time frames1. Include wind power in long-term regional planning, taking into
account other likely power plant developments and transmissiondeployment.
Complete by 2020.
2. Harmonise, accelerate and streamline permitting practices. Complete by 2015.
The need to include wind power in the long-term regional planning process is clear: windpower developments typically reflect a wide rangeof potentially conflicting attributes and interests,and thus require very careful consideration. Early,integrated, long-term planning for deploymentof wind power and associated infrastructure willhelp long-term wind deployment. Identifyingpre-screened zones that offer quicker permittingto wind deployment will lighten the burden on
developers by avoiding likely obstacles. Large-scale development zones should take into accountwind resources and existing and planned gridinfrastructure. Where a large wind resource islocated in an area lacking sufficient transmission tobring electricity to market, transmission planningshould be co-ordinated. Development zones mustalso be allocated on an equitable basis with socio-environmental requirements, as well as defence(radar) and other industrial interests.

8/13/2019 IEA2013WindRoadmap
http://slidepdf.com/reader/full/iea2013windroadmap 51/63
49Policy, finance, public acceptance and international collaboration: actions and time frame
Examples of effective national strategic planning forthe offshore sector exist across Europe (Denmark,Germany, the United Kingdom, the Netherlandsand Belgium). The Dutch government’s 2009National Water Plan includes 6 000 MW windpower development potential by 2020 alongsidethe ongoing development of fisheries, shipping,sand extraction, oil and gas extraction, natureconservation and coastal defences. The plandesignates areas in which permits for wind energyparks can be granted.
Efforts to streamline permitting procedures facean inherent challenge in that a key aspect of manypermitting procedures is to ensure that deployment
takes into account diverse local needs. However,if responsibility is divided among several agenciesat different levels of government, permitting canbe subject to delays and create uncertainty fordevelopers and investors. A more holistic approachthat identifies and integrates the various approvalsrequired can effectively address any planning,environmental or safety distance concerns duringwind project development. Standardised, moretransparent permitting procedures reduce projectuncertainty.
For example, the US Department of the Interior(US DOI) and the FERC are now partnering tooversee deployment of wind, wave and tidalpower on the outer continental shelf. In Denmarkand in the United Kingdom, offshore permittingprocedures have been streamlined into a “one-stop-shop” system in which the Danish Energy
Agency and Crown Estate serve as the co-ordinatingauthorities. In Denmark, the system operatoris involved in selecting sites and initiating thelease process. It then holds a competit ive bidprocess to select a wind farm developer whilethe system operator permits and constructs theinterconnection to the onshore grid and negotiatesa power purchase agreement. This model iseffective in that it includes interconnection supportto facilitate financing the projects.
The UK government recognised the importanceof spatial planning and the need to streamlinethe consenting process and a created “one-stopshop” approach for permitting for its Round 2
offshore tendering. The Crown Estate (which is theseabed owner and manager) charged successfulapplicants a one-time fee based on the spatialarea of their respective sites. Once plants areoperational, owners of Round 2 projects will berequired to make lease payments on the order of1% of gross power sales, including incentives. In2009, an offer was announced to extend site leasesto 50 years, affording developers greater certaintywhen considering life-extension and repoweringof their projects. This move was also designedto instil greater confidence in the supply chain.For Round 3, initiated in 2008, the Crown Estateestablished a strategic spatial planning processand identified nine zones prior to running thetender process. Additionally, the UK governmentimplemented a new infrastructure planning processfor the permitting of offshore projects, providing animproved and timely consenting regime.
Increased funding for RD&D
Support R&D and demonstrations Time frames
1. Establish funding commitment levels for the next decadefor wind energy R&D. Complete by 2015-20.
2. Provide demonstration funding for innovative concepts thatwould not be pursued without extra support. Ongoing. Complete in 2020.
Achieving the technology development needed forthe roadmap targets will require increased fundingfor RD&D.
Establishing clear nancial support for RD&D sends a clear strong message that public and privatesectors are engaged for the long term. This helpsattract more investors. For the last three decades,
research funding in OECD member countriesfor wind power has mostly fluctuated between1% and 2% of all energy R&D funding. Stimulusprogrammes in the European Union and the UnitedStates increased funding in 2009-2010. In 2011, the
figure stood at estimated 2.2%, equalling aboutUSD 357 million (Figure 21).

8/13/2019 IEA2013WindRoadmap
http://slidepdf.com/reader/full/iea2013windroadmap 52/63

8/13/2019 IEA2013WindRoadmap
http://slidepdf.com/reader/full/iea2013windroadmap 53/63
51Policy, finance, public acceptance and international collaboration: actions and time frame
Expanding international RD&D collaborationis an important means of ensuring greater co-ordination among national approaches to windenergy RD&D. It could help to ensure that keyaspects are addressed according to areas of nationalexpertise, taking advantage of existing RD&D andtesting activities and infrastructure. Long-termharmonisation of wind energy research agendaswould also be beneficial.
One example of international collaboration isthe Wind IA, which is one of 42 such agreementscovering the complete spectrum of energytechnology development. More than 20 countriesparticipate in the Wind IA: together, their nationalexperts have developed a coherent researchprogramme including offshore, cost of energy,
social acceptance, wind modelling, aerodynamicsand wind integration.12 This may provide the focusfor greater collaboration among OECD and non-OECD countries.
In addition, in Europe, the Wind Energy TechnologyPlatform (TPWind) builds collaboration amongindustry and public sector participants; it is oneof a range of technology platforms with cross-cutting activities established in partnership withthe European Commission. TPWind has developeda research agenda and market deployment strategyup to 2030, which provides a focus for the EuropeanUnion and national financing initiatives. In theoffshore sector, Norway joined the German-Danish-Swedish Co-operation Agreement with specificfocus on offshore wind energy RD&D.
China has been participating for several years ininternational collaboration on standards, testingand certification of wind power plants, which ledto a revision of the Chinese grid code in 2012 anddevelopment of a testing centre for wind turbines.
The need to build capacity in emerging economiescannot be overstated. Strong wind resources existin many countries where deployment has yet to
12. See www.ieawind.org.
begin to approach its potential. By 2050, accordingto the 2DS, more than half of cumulative globalinvestment in new capacity will have taken place innon-OECD countries. In China alone, building the
611 GW of installed capacity envisaged in the 2DSwould at today’s prices cost around USD 690 billionby 2030 and USD 1.5 trillion by 2050.
Rapid economic growth, limited energy supply andabundant conventional resources are factors thatcause key countries to turn first to conventionalenergy supply. Without sufficient incentive to dootherwise, many emerging economies are likelyto pursue a carbon-intensive development path(UNEP, 2009). Bilateral and multilateral efforts, suchas the Sino-US Co-operation in Clean Energy, areunderway to address this challenge.
Governments of OECD member countries areencouraged to assist developing economiesin the early deployment of renewable energy.The exchange of best practice in terms ofwind technology, system integration, supportmechanisms, environmental protection, approachesto mitigating water stress, and the dismantling ofdeployment barriers are important areas. Dynamicmechanisms will be required to achieve successfultechnology and information transfer. Poorerand more slowly developing economies (such asmany in Africa) are lagging behind more quicklyindustrialising nations; specific, tailored actions willbe necessary.
The value of wind energy for reasons in additionto climate protection should be emphasised – evenwhen based on developed economies’ experience.Benefits related to innovation, employment, freshwater conservation and environmental protectionshould be accurately quantified and expressedto developing economy partners, particularly interms of wind energy’s ability to contribute towardsthe fundamental benefits of energy provision and
poverty alleviation.
Increase international collaboration Time frames1. Expand international RD&D collaboration, making best use
of national competencies.Continue over 2013-50 period.
2. Build capacity in emerging economies by developing new mechanismsto encourage technology exchange and sharingof best practice for wind deployment.
Continue over 2013-50 period.
3. Assess and express the value of wind energy in economic development,poverty alleviation and efficient use of fresh water resources. Continue over 2013-50 period.

8/13/2019 IEA2013WindRoadmap
http://slidepdf.com/reader/full/iea2013windroadmap 54/63
52 Technology Roadmap Wind energy
The main milestones to achieve the target of 15% to18% global electricity from wind power in 2050 are:
z Stimulate cost reductions to achieve costcompetitiveness with new conventional powerproduction (including carbon prices) by 2020 foronshore and by 2030 for offshore wind power.This means increasing funding allocation for windenergy RD&D between two- and five-fold by 2020.
z Reduce uncertainty of resource assessment to 3%of projected output of wind power plants andincrease technology reliability to 95% by 2020also for offshore.
z By 2020: publish and encourage broad use ofbest practice guidelines for project development,system integration and community engagement.
z By 2020: include wind power in long-termregional planning with clear ways to addressdeployment barriers from transmission and safetydistances to built environment.
z By 2020: increase cost competitiveness by settinga price on emissions through an emissionstrading system, with careful design to ensurethe emissions price is meaningful (fully cost-reflective) and stable.
Near-term actions forstakeholdersThe most immediate actions are listed below bylead actors.
Governments include policy makers atinternational, national, regional and local levels.Their underlying roles are to: remove deploymentbarriers; establish frameworks that promote closecollaboration between the wind industry and the
wider power sector; and encourage private sectorinvestment alongside increased public investment.
Governments should take the lead on thefollowing actions:
z Set or update long-term targets for wind energydeployment, including short-term milestones.
z Ensure a stable, predictable financingenvironment. Where market arrangementsand cost competitiveness do not providesufficient incentive for investors, make sure thatpredictable, long-term support mechanisms exist.
z Address existing or potential barriers todeployment from land-use restrictions, public
Roadmap action plan and next stepsresistance and lack of co-ordination amongdifferent authorities (e.g. environment, building,traffic, defence).
z Launch work on regional land-use and marinespatial planning, taking into account wind powerand its transmission needs. Harmonise andstreamline permitting practices.
z Identify and provide a suitable level of publicfunding for wind energy R&D, proportionate tothe cost reduction targets and potential of thetechnology in terms of electricity production andCO2 abatement targets.
z Enable increasing international R&D collaborationto make best use of national competencies.
z Provide incentives for accelerated constructionof transmission capacity to link wind energyresources to demand centres; identify agencies tolead large-scale, multi-jurisdictional transmissionprojects together with regulators and systemoperators.
z For offshore deployment, make available sufficientand suitably equipped large harbour space.
z Work with R&D funding organisations to establishthe technology push (e.g. compulsory reportingwhen getting subsidies) needed to establishpublic databases (O&M and wind resources).
z Launch maritime spatial planning that includesareas for offshore wind energy deployment anddevelop appropriate offshore planning regimes.
Wind industry includes turbine and componentmanufacturers, developers of wind plants andassociated infrastructure, with strong collaborationwith the research sector. One main objective is tolower the lifecycle cost of energy production andreduce the uncertainties of wind output estimatesand reliability.
Wind industry actions on R&D for short-term resultsby 2015 should focus on:
z wind characteristics: develop a publicly availabledatabase of onshore and offshore wind resourcesand environmental conditions; develop andimplement international standards for windresource assessment and siting; further developremote sensing technology; and develop short-term forecast models, for use in power systemoperation (working together with systemoperators);
z wind turbine technology: build a shared databaseof offshore operating experiences; developdedicated designs for different site conditions;

8/13/2019 IEA2013WindRoadmap
http://slidepdf.com/reader/full/iea2013windroadmap 55/63
53Roadmap action plan and next steps
for offshore deployment, make availablesufficient purpose-designed vessels and improveinstallation strategies;
z work with funding agencies to establish targetedR&D support programmes, then launch long-term programmes for new materials; improvedesign tools; and increase knowledge of offshore,complex terrain and icing climates, aerodynamics,and of offshore turbine and foundation designs.
Power system actors include transmissioncompanies, system operators and independentelectricity sector regulators as established bygovernments, as well as vertically integrated utilities(where they exist). Their key role is to invest intransmission infrastructure needed to connect windpower (and other generators) and move electricityto load centres. They also play a role in enablingphysical power markets to evolve in a manner thatcost-effectively reduces the impact of variability andincreases the value of wind power while ensuringsecurity of supply.
Power system actors should focus their short-termefforts on the following areas:
z develop wide-area transmission plans thatsupport interconnection, anticipating windpower deployment and the linking of regionalpower markets, to ensure security of supply;
z establish mechanisms for cost recovery andallocation from new transmission build-outs forwind-rich areas, in case transmission costs are notcovered by customers;
z where not already available, implement gridcodes that ensure open access to transmissionnetworks for wind power plants; collaborate withneighbouring areas to enhance balancing;
z continue to advance progress on the evolution of
market design and system operating practices toenable integration of large shares of renewableenergy;
z improve wind forecasting and include online datain control rooms of system operators;
z work for offshore grid improvements such asmeshed grids connecting several countriesand combining offshore connections withinterconnectors where regionally and socio-economically reasonable;
z develop methods to assess the need for additional
power system flexibility; carry out grid studies toexamine costs and benefits of high shares of windpower;
z exploit power system flexibility to increase thevalue of RES;
z support standards development to ensuregovernment-funded R&D is translated intoindustry best practice.
ImplementationThe implementation of this roadmap could takeplace through national roadmaps, targets, subsidiesand R&D efforts. Based on its energy and industrialpolicies, a country could develop a set of relevantactions. To facilitate this process at national levels,the IEA is also publishing aHow2Guide for thedevelopment of wind roadmaps, which includesinformation and guidance related to:
z resource availability;z technology status and costs;z policy costs and effectiveness;z barriers that would need to be addressed;z stakeholder engagement and public acceptability.
Ultimately, international collaboration will beimportant and can enhance the success of national
efforts. This roadmap update identifies approachesand specific tasks regarding wind energy research,development, demonstration and deployment,financing, planning, grid integration, legal andregulatory framework development, publicengagement, and international collaboration. Italso updates regional projections for wind energydeployment from 2010 to 2050 based on ETP 2012 .Finally, this roadmap details actions and milestones toaid policy makers, industry and power system actorsin their efforts to successfully implement wind energy.
The wind roadmap is meant to be a process, one thatevolves to take into account new developments fromdemonstration projects, policies and internationalcollaborative efforts. The roadmap has beendesigned with milestones that the internationalcommunity can use to ensure that wind energydevelopment efforts are on track to achieve the GHGemissions reductions required by 2050. As such,the IEA, together with government, industry andnon-governmental organisation (NGO) stakeholderswill report regularly on the progress that has beenachieved toward this roadmap’s vision. For moreinformation about the wind roadmap inputs and
implementation, visit www.iea.org/roadmaps.

8/13/2019 IEA2013WindRoadmap
http://slidepdf.com/reader/full/iea2013windroadmap 56/63
54 Technology Roadmap Wind energy
Abbreviations and acronyms2DS 2°C Scenario6 DS 6°C Scenario
AC alternative current ACER Agency for the Co-operation of Energy
RegulatorsARRA American recovery and reinvestment Act CCS carbon capture and storageCDM Clean Development MechanismCEM Clean Energy MinisterialCER certified emission reductionCFD computational fluid dynamics
CO2 carbon dioxideCPI Climate Policy InitiativeCSP concentrating solar power CSP current source converter CTF Clean Technology FundDC direct current EDF Électricité de FranceEH Euler HermesEKF Eksport Kredit Fonden (Denmark)EIA environmental impact assessment EIB European Investment BankENTSO-E European Network of Transmission
System Operators for ElectricityERCOT Electric Reliability Council of TexasETP Energy Technology Perspectives
EU European UnionEUR euroEWEA European Wind Energy AssociationEWI European Wind Initiative
FERC Federal Energy Regulatory Commission(United States)
FID final investment decisionFiT feed-in tariff FiP feed-in premiumG8 Group of Eight GBP Great Britain poundGHG greenhouse gas(es)Gt gigatonnes
GW gigawatt (1 million kW)GWh gigawatt hour (1 million kWh)
GWEC Global Wind Energy CouncilhiRen high renewables (Scenario)
HVDC high-voltage direct current IA implementing agreement IEA International Energy AgencyIFI international financial institutionIrena International Renewable Energy AgencyISO independent system operator JRC Joint Research CentrekW kilowatt kWh kilowatt hour
LCD liquid-crystal displayLCOE levelised cost of electricityLidar light and radar, or light detection
and rangingMW megawatt (1 thousand kW)MWh megawatt hour (1 thousand kWh)NABEG National Grid Expansion Acceleration Act
(Germany)NGO non-governmental organisationNREL National Renewable Energy Laboratory
(United States)NSCOGI North Sea Countries’ Offshore
Grid InitiativeOECD Organisation for Economic
Co-operation and Development O&M operation and maintenancePPA power purchase agreement PPP public-private partnershipPUC Public Utility CommissionPV photovoltaicR&D research and development RD&D research, development and
demonstrationREN21 Renewable Energy Network for
the 21st CenturyREO rare earth oxideRES renewable energy sourceRPS renewable energy portfolio standardSodar sonic detection and ranging
T&D transmission and distribution

8/13/2019 IEA2013WindRoadmap
http://slidepdf.com/reader/full/iea2013windroadmap 57/63
55Abbreviations and acronyms
TIMES The Integrated MARKAL (Marketing andAllocation Model)-EFOM (energy flowoptimisation model) System.
TSO transmission system operator TWh terawatthour (1 billion KWh)
TYNDP Ten-Year Network Development Plan
UK United Kingdom
UNEP United Nations Environment Programme
US United States (of America)
USGS United States Geological Survey
USD United States dollar
US DOE United States Department of Energy
US DOI United States Department of Interior
VSC voltage source converter
WACC weighted average cost of capital

8/13/2019 IEA2013WindRoadmap
http://slidepdf.com/reader/full/iea2013windroadmap 58/63
56 Technology Roadmap Wind energy
ReferencesAbrahamsen, A.et al ., (2010). “Superconducting Wind Turbine Generators.”Superconductor Scienceand Technology, Vol. 23, No. 3, IOP Publishing,Bristol, UK.
Archer, C.L. and K. Caldeira (2009), “Global Assessmentof High-Altitude Wind Power”,Energies, Vol.2, MDPI,Basel, pp. 307-319.
Chabot, B. (2013), “Wind Power Silent Revolution:New Wind Turbines for Light Wind Sites”,Renewables International , Hannover, Germany,available at www.renewablesinternational.net.
Chapman, J.et al ., (2012). “Wind EnergyTechnologies,” Chapter 11.Renewable ElectricityFutures Study , Vol. 2, National Renewable EnergyLaboratory Golden, CO: pp. 11-1–11-63.
Climate Policy Initiative (2012),Meeting India’sRenewable Energy Targets: The Financing Challenge .Available at ht tp://climatepolicyinitiative.org/our-work/publications/.
Crown Estate (2012a),Offshore Wind Report 2012 .
Crown Estate (2012b),Offshore Wind Cost ReductionPathways Study Available at www.thecrownestate.co.uk/media/305094/offshore-wind-cost-reduction-
pathways-study.pdf.Department of Communications, Energy andNatural Resources (DCEN)(2008), All Island GridStudy , Dublin 2, Ireland, available atwww.dcenr.gov.ie.
Ecofys and DIgSILENT (2010), All Island TSOfacilitation of renewables studies . Prepared forEirgrid, Dublin 4, Ireland. Available atwww.ecofys.com/files/files/faciltiation_of_renwables_wp3_final_report.pdf.
Enernex (2011),Eastern Wind Integration andTransmission study . Prepared for the NationalRenewable Energy Laboratory. 2011 revision,February. Available atwww.nrel.gov/docs/fy11osti/47078.pdf.
ENTSO-E (2012),Ten Year Network Development PlanTYNDP . Available at www.entsoe.eu/major-projects/ten-year-network-development-plan/.
Ernst & Young (2012 ), Analysis of the Value CreationPotential of Wind Energy Policies . A comparativestudy of the wind and CCGT power generation.
Available at www.ey.com.
European Environment Agency (EEA), 2011NationalRenewable Energy Action Plans, available at www.eea.europa.eu/data-and-maps/figures/national-renewable-energy-action-plan
European Wind Energy Association (EWEA) (2009),Wind Energy – The Facts, a Guide to the Technology,Economics and Future of Wind Power , Brussels,Belgium, available atwww.wind-energy-the-facts.org/.
EWEA (2012),Green Growth. The Impact of WindEnergy on Jobs and the Economy . Available atwww.ewea.org .
EWEA (2013),Offshore statistics . Available atwww.ewea.org .
EWI (2013),The European Wind Initiative. Wind PowerResearch and Development to 2020 , EWI, available atwww.ewea.org.
Fagiano, L.et al ., (2012), “High-Altitude WindEnergy for Sustainable Marine Transportation”,IEEETransactions on Intelligent Transportation Systems,Vol. 13, No. 2, June.
GE Energy (2010),Western Wind and SolarIntegration Study : NREL report SR-5500-47434, May.
GE Energy (2012), Analysis of Cycling Costs in WesternWind and Solar Integration Study , prepared for NREL,19 March.
GL Garrad Hassan (2013a),Offshore turbineavailabilities, private communication.
GL Garrad Hassan (2013b),European offshore windfarm capital costs by year, private communication13.
13. The values utilised for the chart are based on publishedinformation - typically contractor or developer press releases
and/or guidance from the relevant project owner throughdirect consultation. The values have been adjusted for currency,inflation and scope differences. Currency adjustments(principally between sterling, euro and Danish krone) havebeen made using historical inter-bank data from oanda.com, referenced from the approximate date of financialclose or signing of major construction contracts. Inflationadjustments before 1998 have been based on UK Retail PriceIndex (excluding all housing) using data obtained from theOffice for National Statistic s. For 1998 onwards, the average ofRPI and euro area inflation (Harmonised Indices of ConsumerPrices) has been taken - the latter be ing obtained through theEuropean Commission Eurostat portal. Adjustment for scopedifferences has been made in cases where grid connectionincluding offshore substation have been provided by a third-party. In these instances, an increase of 15% to 25% has beenadded which based on GL GH experience is a realistic reflect ionof the cost of such works. In addition, reductions have beenmade in cases where Warranty, Operational and Maintenancecosts have been included in the published value at a rate ofEUR 150 000 per wind turbine per year which, again, is basedon GL GH exper ience and is broadly representative of currentand historical levels.

8/13/2019 IEA2013WindRoadmap
http://slidepdf.com/reader/full/iea2013windroadmap 59/63
57References
GWEC (Global Wind Energy Council) (2012),GlobalWind Energy Outlook, 2012, Brussels, Belgium.Publication can be viewed online atwww.gwec.net/.
GWEC (2013).Global Wind Statistics 2012.Publication can be viewed online atwww.gwec.net/.
International Energy Agency (IEA) (2008),EnergyTechnology Perspectives: Scenarios and Strategies to2020 , Paris, France.
IEA (2009),IEA Technology Roadmap: Wind Power,OECD/IEA, Paris.
IEA (2011),Deploying Renewables 2011 ,OECD/IEA, Paris.
IEA (2012a),Energy Technology Perspectives:Scenarios and Strategies to 2050 , Paris, France.
IEA (2012b),IEA Technology Roadmap: Hydropower ,OECD/IEA, Paris.
IEA (2013),Medium-term Renewable Energy MarketReport , OECD/IEA, Paris.
IEA (forthcoming1),Grid Integration of VariableRenewables: The Economics of Flexibility (workingtitle), OECD/IEA, Paris.IEA (forthcoming2),How2Guide for Wind Energy ,OECD/IEA, Paris.
IEA/Energy Research Institute (ERI) (2011),Technology Roadmap: China Wind EnergyDevelopment Roadmap 2050, OECD/IEA, Paris.
Implementing Agreement for Co-operation in theResearch, Development and Deployment of WindEnergy Systems (Wind IA) (2013),IEA Wind AnnualReport 2012 , Colorado, USA,available at
www.ieawind.org.IRENA (2012),Renewable Energy Jobs , available atwww.irena.org/.
IRENA and GWEC (2012),30 Years of Policies for WindEnergy Lessons from 12 Wind Energy Markets , IRENA,Abu Dhabi, Available at www.irena.org/.
Joint Research Centre (JRC) (2012),2012 JRCwind status report . The Netherlands. Availableat www.recs.org/documents/report--european-commission_2012-jrc-wind-status-report.
Lawson, J. (2013), “New Life for Old Sites”,WindTechnology , Renewable Energy World, NewHampshire, May-June.
Liebreich, M. (2013),Scaling Up Financing to Expandthe Renewables Portfolio , Presentation at the IEARenewable Energy Working Party, BNEF, Paris,9 April.
Miller, L.M., F. Gans and A. Kleidon (2011), “JetStream Wind Power as a Renewable EnergyResource: Little Power, Big Impacts”,Earth SystemDynamics , Vol.2: 201-212.
Molly, J.P. (2011), “Rated Power of Wind Turbines: What is Best?”DEWI Magazine No.38, February.
Molly, J.P. (2012), “Design of Wind Turbines andStorage: a Question of System Optimisation”,DEWIMagazine, No. 40, February.
Navigant (2013a),World Market Update 2012.International Wind Energy Development. Forecast2013-2017 , a BTM WIND report, Navigant, Chicago.
Navigant (2013b),Offshore Wind Market andEconomic Analysis. Annual Market Assessment ,prepared for US DOE, Chicago.
NREL (National Renewable Energy Laboratory)(2012), 2010 Cost of Wind Energy Review, TechnicalReport NREL/TP-5000-52920, April.
NSCOGI (North Seas Countries’ OffshoreGrid Initiative) (2012),North Seas Grid Study– Initial Findings, NSCOGI, Brussels, Availableat www.benelux.int/nscogi/NSCOGI_WG1_OffshoreGridReport.pdf.
Philibert, C. (2001),Interactions of Policies forRenewable Energy and Climate , Working Paper, IEA/OECD, Paris.
PUC (Public Utility Commission of Texas) (2013),Competitive Renewable Energy Zone ProgramOversight, Progress Report No. 10, PUC, Austin.
RED Electrica (2013), personal communication.
REN21 (2013),Renewables 2013 Global Status Repor t, REN21, Paris.
Slocum, A.H., G.E. Fennell, G. Dundar, B. G.Hodder, J.D.C. Meredith, M.A. Sager (2013)“Ocean Renewable Energy Storage (ORES) System:Analysis of an Undersea Energy Storage Concept,”Proceedings of the IEEE , vol. 101, no.4, pp. 906,924.
Svensk Vindenergi (2012),Code of Conduct . Availableat www.vindkraftsbranschen.se/start/vindkraft/uppforandekod/.

8/13/2019 IEA2013WindRoadmap
http://slidepdf.com/reader/full/iea2013windroadmap 60/63
58 Technology Roadmap Wind energy
Tabbush, E. (2013a),Wind Turbine Price Index: IssueVIIII, Wind – Research Note, BNEF, 11 February.
Tabbush, E. (2013b),Operations and MaintenancePrice Index, Issue II , Wind – Research Note, BNEF,4 April.
TPWind (2013),European Wind Energy TrainingNeeds, Opportunities and Recommendation ,forthcoming.
UpWind (2011),Design Limits and Solutions forVery Large Turbines , Sixth Framework Programmefor Research and Development of the EuropeanCommission (FP6), Brussels.
US DOE (US Department of Energy) (2013),FY 2014DOE Budget Request to Congress . Available atwww.cfo.doe.gov/budget/14budget/index14.html.
US DOL (US Department of Labour) (2010),Green Jobs Training: Funding, Implementing, CollaboratingFact Sheet, US DOL, Washington DC.
United Nations Environment Programme (UNEP)(2009), Global Trends in Sustainable EnergyInvestment 2009, Analysis of Trends and Issues in theFinancing of Renewable Energy and Energy Efficiency ,UNEP, Paris Available at http://sefi.unep.org/english/
globaltrends22009.html. Wei, M., S. Patadia and D.M. Kammen (2010),“Putting renewables and energy efficiency to work:How many jobs can the clean energy industrygenerate in the US?" Energy Policy , Vol. 38, Elsevier,Amsterdam, pp. 919–931.
Wind IA (2012),The Past and Future Cost of WindEnergy , IEA Wind Task 26, May, available atwww.ieawind.org/.
Wind IA (forthcoming),Long-Term R&D Needs, Paris,
Available at www.ieawind.org/. Wind IA Task 19 (2012),Wind Energy Projects in ColdClimates , Expert Group Study on RecommendedPractices, IEA Wind, May. Available atwww.ieawind.org.
Wind IA Task 25 (2013),Final Report, Phase Two2009-2011 Design and operation of power systemswith large amounts of wind power, VTT, Finland.Available at www.ieawind.org/AnnexXXV/Task25_Publications.html.
Wind IA Task 26 (2011),Multi-national Case Study ofthe Financial Cost of wind Energy . Work Package 1.Available at www.ieawind.org/task_26.html.
Wind IA Task 28 (2013)Recommended Practices forSocial Acceptance of wind . Available atwww.ieawind.org.
Wiser, R. and M. Bolinger (2013),2012 WindTechnologies Market Report, Lawrence BerkeleyNational Laboratory, Berkeley, CA.
Wiser, R.et al . (2011), “Wind Energy” in O.Edenhoferet al. (eds), IPCC Special Report onRenewable Energy Sources and Climate ChangeMitigation , Cambridge University Press, Cambridgeand New York.
Wiser, R.et al. (2012), Recent Developments in theLevelized Costs of Energy from U.S. Wind PowerProjects, presentation to IEA Wind Task 26, NREL,February, Paris.
World Bank (2009),Clean Technology FundInvestment Plan for Turkey , World Bank, Washington, DC.

8/13/2019 IEA2013WindRoadmap
http://slidepdf.com/reader/full/iea2013windroadmap 61/63
This document and any map included herein are without prejudice to the s tatusof or sovereignty over any territory, to the delimitation of international frontiers
and boundaries and to the name of any territory, city or area.
IEA Publications, 9 rue de la Fédération, 75739 PARIS CEDEX 15PRINTED IN FRANCE BY CORLET, OCTOBER 2013
Front cover photo (large): © Rudy Chrétien/Systèmes SolairesFront cover photo (small): © Comstock
Back cover photo (large): © GraphicObsessionBack cover photo (small): © Energiequelle
The paper used for this document has received certification from the Programme for the Endorsement of Forest Certification (PEFC)for being produced respecting PEFC’s ecological, social and ethical standards. PEFC is an international non-profit, non-governmental
organization dedicated to promoting Sustainable Forest Management (SFM) through independent third-party certification.

8/13/2019 IEA2013WindRoadmap
http://slidepdf.com/reader/full/iea2013windroadmap 62/63
I n t
e r
n a
t i o n a l
E n e r
g y
A g
e n c
y •
9 r
u e
d e l a F é d é r a t i o n • 7 5 7 3 9 P a r i s C e d e x 1 5
, F r a n c e
Buy IEA publicationsonline:
www.iea.org/booksPDF versions available
at 20% discount
A number of books printed before January 2012are now available free of charge in pdf format
on our website
Onlinebookshop
Tel: +33 (0)1 40 57 66 90
E-mail:[email protected]

8/13/2019 IEA2013WindRoadmap
http://slidepdf.com/reader/full/iea2013windroadmap 63/63
2020
2025
2030
2013
2015TechnologyRoadmap
Windenergy