iee-project biogas production and biogas … · 5.1.1 for biogas plant operators ... starch and...
TRANSCRIPT

The sole responsibility for the content of this report lies with the authors. It does not necessarily reflect the
opinion of the European Union. Neither the EASME nor the European Commission are responsible for any
use that may be made of the information contained therein.
FRANCE - NATIONAL SITUATION
BIOGAS PRODUCTION AND BIOGAS POTENTIALS
FROM RESIDUES OF THE EUROPEAN
FOOD AND BEVERAGE INDUSTRY
IEE-Project
FABbiogas
Table of contents 1 Introduction .................................................................................................................... 1
2 Methodology ................................................................................................................... 2
3 Task 1 ............................................................................................................................ 2
3.1 Map showing national biogas plants using FAB industry waste ............................... 2
3.2 Basic characteristics of existing biogas installations ................................................ 6
4 TASK 2 ........................................................................................................................... 7
4.1 Maps showing national waste streams of different FAB industry branches .............. 7
5 TASK 3 ..........................................................................................................................13
5.1 Description of the barriers ......................................................................................13
5.1.1 For biogas plant operators...............................................................................13
5.1.2 For food and beverage producers ...................................................................14
5.1.3 General observations and conclusions ............................................................15
6 References ....................................................................................................................17
1 /19
National report of France
This report was written in the frame of the IEE project FABbiogas, which is supported
by the Intelligent Energy Europe. The aim of this report is to give an overview of the
biogas market in France, to evaluate the potential of renewable energy sources from
waste in the food and beverage industry (FAB), including the identification of the
production of biogas from organic waste, and the untapped potential of organic waste
in various industries of food and beverages and to identify non-technological barriers
that hinder development and use of renewable energy potential.
1 Introduction
The French Republic is located in Western Europe, bordered by Belgium,
Luxemburg, Germany, Switzerland and Italy to the East, by the Mediterranean Sea
and Spain to the South, by the Bay of Biscay to the West and by the English channel
to the North. The total area of France is around 641,000 km2 with a population of over
66 million people.
For administrative purposes France is divided into 27 administrative “régions”, of
which 22 are in metropolitan France (21 are on the continental part of metropolitan
France; 1 is the territorial collectivity of Corsica), and 5 are overseas regions. The 27
regions are further subdivided into 101 “départements”, and over 36 000
municipalities, called “communes”.
Europe recently engaged in increasing the use of renewable resources for producing
energy. These orientations as regards energy policy are determining for the
development of biogas production and recovery of biogas. At the European level,
directive 2009/28/CE set the mandatory national targets concerning the share of
renewable energy in the final energy consumption in 2020. In particular, the
European Commission set a target of 23% share of energy produced from renewable
sources in 2020 for France. This target has been transposed into French legislation
in the planning law n° 2009-967 relating to the implementation of the Grenelle de

2 /19
l’environnement roundtables, and in the bylaws / orders which stem from it, i.e. PPI
chaleur du 15 décembre 2009 and PPI électricité du 15 décembre 2009 :
-the objective to develop the production of heat from biogas (global
production) was 60ktep for 31 December 2012 and 555 ktep for 31
December 2020.
-the objective for developing the production of electricity is not specific to
biogas but rather applies to biomass in general (520MW to be in service by 31
December 2012 and 2300MW before 31 December 2020).
2 Methodology
Existing literature and studies were used to compile this report. Some internet
sources were also used, and some interviews were conducted with national and local
authorities. General sources mapping out waste streams and biogas plants are
relatively abundant, and work is currently in progress in France, in particular by the
regional offices of ADEME, the French Environment and Energy Management
Agency, to map these out even more precisely, and in particular as regards food and
beverage waste. The results of these ongoing studies should be available within the
timeframe of the FABBIOGAS project. For this reason, it was decided not to
unnecessarily duplicate the work already underway, and thus supplementary
interviews with biogas plants and food and beverage companies were not conducted
for this report. Moreover, there is a relatively large number of biogas plants and food
and beverage companies in France, and due to the fact that these same companies
are already solicited by the instances currently carrying out the aforementioned
studies on the waste streams and on the biogas market, low response rates to the
model questionnaires were to be expected. For this reason also, it was deemed most
efficient to wait for these studies to be published and then use them for the purposes
of the FABBIOGAS project.
3 Task 1
3.1 Map showing national biogas plants using FAB industry waste
In 2011, there were 80 plants linked to an industrial plant, of which 58 plants for the
Food and Beverage industry. The exact locations are available, along with the

3 /19
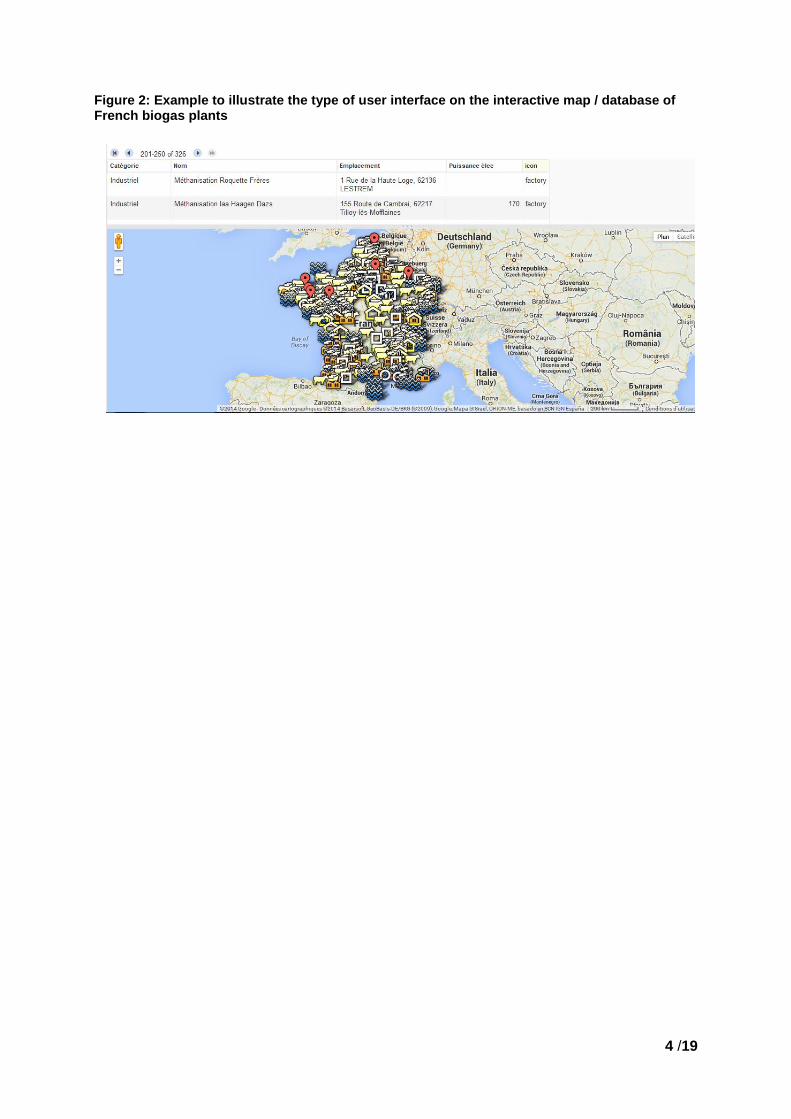
installed electrical power for some of these plants [kW] on an interactive website
(http://www.atee.fr/biogaz/carte-des-installations-biogaz-en-france or
https://www.google.com/fusiontables/DataSource?docid=1MoVjyodttW6MfzLJJ3Jz2t
T0MwGimt5525_Tn0o#map:id=3) It was therefore deemed unnecessary to remap all
the installations in Google Maps, as the source cited above will moreover be updated
regularly. Work is still under way to map out the plants more precisely. The figure
below shows the user interface for surfing on the database on Google Maps to locate
the industrial installations linked to anaerobic digestion plants.
Figure 1: Biogas Plants linked to an industrial installation in France in an interactive map / database
4 /19
Figure 2: Example to illustrate the type of user interface on the interactive map / database of French biogas plants

5 /19
The information on the industrial plants is also available per region, as follows:
Figure 3: Biogas Plants linked to an industrial installation in France (58 of 80 plants use food and beverage waste)
Table 1: Biogas plants using industrial waste in France, classified by regions (80 plants, of which 58 using food and beverage waste)
Region Number of installations Biogas produced
(Nm3/year)
Nord Pas de Calais 12 + 1 under
construction
12 270 000
Haute Normandie 4 5 490 000
Picardie 3 4 540 000
Basse Normandie - -
Ile de France 1 30 000
Champagne 2 1 580 000
Lorraine - -
Alsace 5 + 1 under
construction
3 490 000

6 /19
Bretagne 3 2 040 000
Pays de la Loire 6 2 190 000
Centre 1 2 800 000
Bourgogne 3 1 320 000
Franche Comté 3 2 550 000
Poitou-Charentes 1 3 350 000
Limousin 1 2 180 000
Auvergne - -
Rhône-Alpes 6 1 170 000
Aquitaine 9 7 370 000
Midi-Pyrenées 9 + 1 under
construction
1 350 000
Languedoc-Roussillon 2 + 1 under
construction
1 100 000
Provence-Alpes-Côte d’Azur 6 + 1 under
construction
340 000
Outre Mer 2 4 360 000
Corse - -
TOTAL 80 + 5 under
construction
59 520 000
3.2 Basic characteristics of existing biogas installations
The French Environment and Energy Management Agency (ADEME) was contacted
for more precise information concerning the plants using food and beverage waste.
They communicated the following figures:
Table 2: Biogas plants using food and beverage waste in France according to type of waste
Food and Beverage Sector Number of plants
Meat products 2
Dairy products (cheese, whey, yogurts, ice cream) 11
Sweets/Sugar 6
Drinks/alcohol (breweries) 7
Drinks/alcohol (wineries) 18
Drinks/alcohol (distilleries) 4
Drinks/alcohol (soft drink) 1
Fruits and vegetables 7
Starch and food additives 2

7 /19
4 TASK 2
4.1 Maps showing national waste streams of different FAB industry
branches
In France no specific maps exist as regards the type of waste streams and the
characteristics of the plant (other than the installed electrical power) according to
food and beverage industry branches for reasons related to competition between
companies. Food and beverage businesses are reluctant to communicate specific
data on the waste they produce and on how and at what price they manage this
organic waste. However, the information on the type of waste and the physical
characteristics is available in numerical format. Identified waste resources from the
food and beverage industry that could be used for the production of biogas include:
-waste from production processes
-effluents from the canning industries, distilleries, and wash water
-marc and stillage from wine cooperatives
-slurries and effluents from slaughterhouses (other than beef), stercoral
matter, sieve residue, greases, blood from slaughterhouses, animal
byproducts from the slaughter process, and more generally animal by-
products of category 2 and 3 (according to Regulation EC/1069/2009)
-grease from the processing industry and swill
In this way, the types of food and beverage industry waste are quite diverse, as are
their characteristics. For example, organic content of effluents are generally low,
contrarily to animal byproducts from the slaughter process and greases of animal
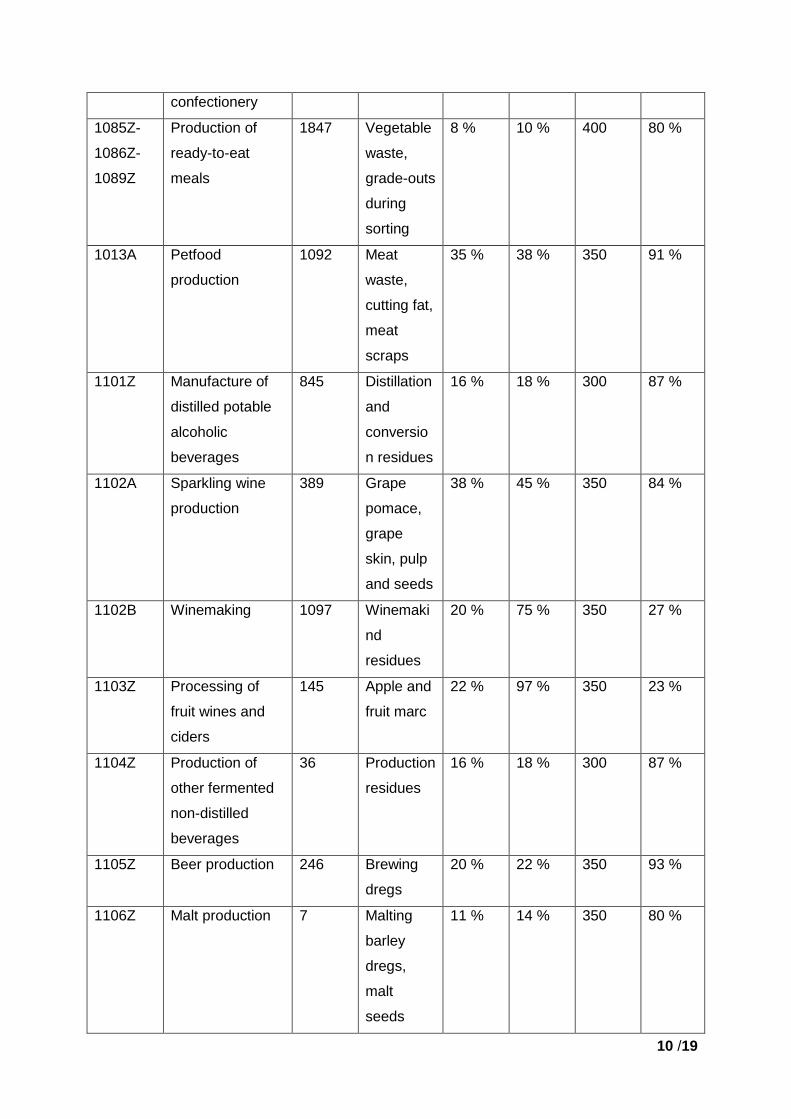
origin, which have a high methanogenic potential. The following table maps out the
waste resources from the food and beverage industry according to the NAF (French
statistical nomenclature for activities).

8 /19
Table 3. Characteristics of potential food and beverage waste resources
Activity
Code
Activity description Number
of firms
Type of
waste
Solid
Waste
(%
Organic
Matter /
Brut
Matter)
Solid
Waste
(Dry
Matter)
m3CH4/ t
Organic
Matter
%
Organic
Matter/
% Dry
Matter
1011Z Processing and
preserving meat
for butchers‘
shops
1257
Category
1, 2, 3
animal by-
products,
stercoral
matter,
greases
16 % 18 % 350 87 %
1012Z Processing and
preserving
poultry meat
393 Category
1, 2, 3
animal by-
products,
stercoral
matter,
greases
21 % 25 % 350 84 %
1013A Industrially
processed meat
products
1092 Cutting
fat, meat
scraps
35 % 38 % 350 91 %
1020 Fish industry 360 Fish waste 16 % 18 % 300 87 %
1031Z Processing and
preserving
potatoes
273 Potato
peels,
potato
waste
8 % 10 % 600 80 %
1032Z Preparation of
fruit and
vegetable juice
159 Fruit and
vegetable
waste
13 % 16 % 400 84 %
1039A Other Processing
and preserving of
vegetables
282 Vegetable
waste,
grade-outs
during
sorting
11 % 14 % 400 81 %

9 /19
1039B Processing and
preserving fruit
542 Fruit
waste,
grade-outs
during
sorting
27 % 35 % 400 78 %
1040 Manufacture of
vegetable and
animal oils and
fats
154 Oil cakes,
seed
sorting
residues,
filtration
residues
81 % 87 % 300 93 %
1051C Cheese
production
776 Cheese
waste
56 % 59 % 500 94 %
1051
autres
Fabrication of
liquid milk and
fresh milk
products
618 Whey,
milk, fresh
cheese
waste
14 % 15 % 400 95 %
1061A_B Manufacture of
grain mill
products,
starches and
starch products,
536 Grain
dust, dried
wheat
grains
84 % 95 % 250 89 %
1070 Bakery and
pastry products,
production of
pasta
12 Baked
dough,
flour, non-
conform
bread
58 % 60 % 250 97 %
1081Z Sugar production 34 Beet-pulp,
molasses,
other
waste of
sugar
manufactu
re,
11 % 11 % 330 97 %
1082Z Manufacture of
cocoa, chocolate
and sugar
935 Cocoa 83 % 90 % 300 92 %
10 /19
confectionery
1085Z-
1086Z-
1089Z
Production of
ready-to-eat
meals
1847 Vegetable
waste,
grade-outs
during
sorting
8 % 10 % 400 80 %
1013A Petfood
production
1092 Meat
waste,
cutting fat,
meat
scraps
35 % 38 % 350 91 %
1101Z Manufacture of
distilled potable
alcoholic
beverages
845 Distillation
and
conversio
n residues
16 % 18 % 300 87 %
1102A Sparkling wine
production
389 Grape
pomace,
grape
skin, pulp
and seeds
38 % 45 % 350 84 %
1102B Winemaking 1097 Winemaki
nd
residues
20 % 75 % 350 27 %
1103Z Processing of
fruit wines and
ciders
145 Apple and
fruit marc
22 % 97 % 350 23 %
1104Z Production of
other fermented
non-distilled
beverages
36 Production
residues
16 % 18 % 300 87 %
1105Z Beer production 246 Brewing
dregs
20 % 22 % 350 93 %
1106Z Malt production 7 Malting
barley
dregs,
malt
seeds
11 % 14 % 350 80 %
11 /19
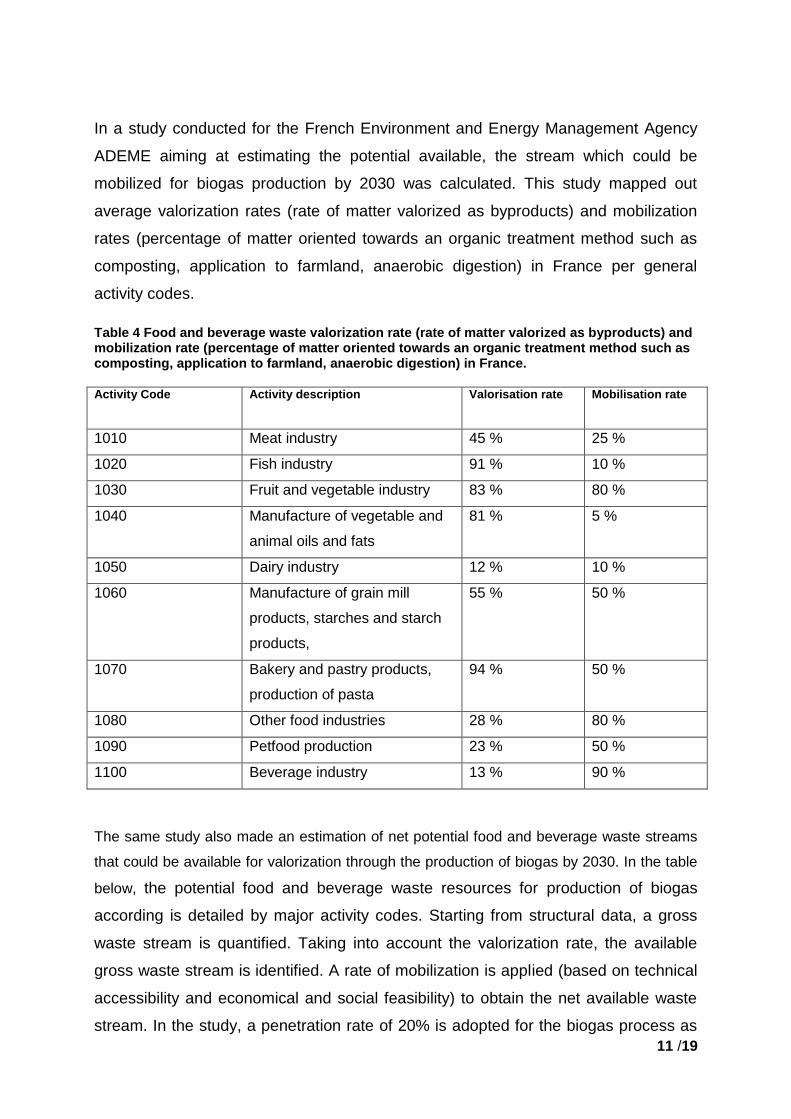
In a study conducted for the French Environment and Energy Management Agency
ADEME aiming at estimating the potential available, the stream which could be
mobilized for biogas production by 2030 was calculated. This study mapped out
average valorization rates (rate of matter valorized as byproducts) and mobilization
rates (percentage of matter oriented towards an organic treatment method such as
composting, application to farmland, anaerobic digestion) in France per general
activity codes.
Table 4 Food and beverage waste valorization rate (rate of matter valorized as byproducts) and mobilization rate (percentage of matter oriented towards an organic treatment method such as composting, application to farmland, anaerobic digestion) in France.
Activity Code
Activity description Valorisation rate Mobilisation rate
1010 Meat industry 45 % 25 %
1020 Fish industry 91 % 10 %
1030 Fruit and vegetable industry 83 % 80 %
1040 Manufacture of vegetable and
animal oils and fats
81 % 5 %
1050 Dairy industry 12 % 10 %
1060 Manufacture of grain mill
products, starches and starch
products,
55 % 50 %
1070 Bakery and pastry products,
production of pasta
94 % 50 %
1080 Other food industries 28 % 80 %
1090 Petfood production 23 % 50 %
1100 Beverage industry 13 % 90 %
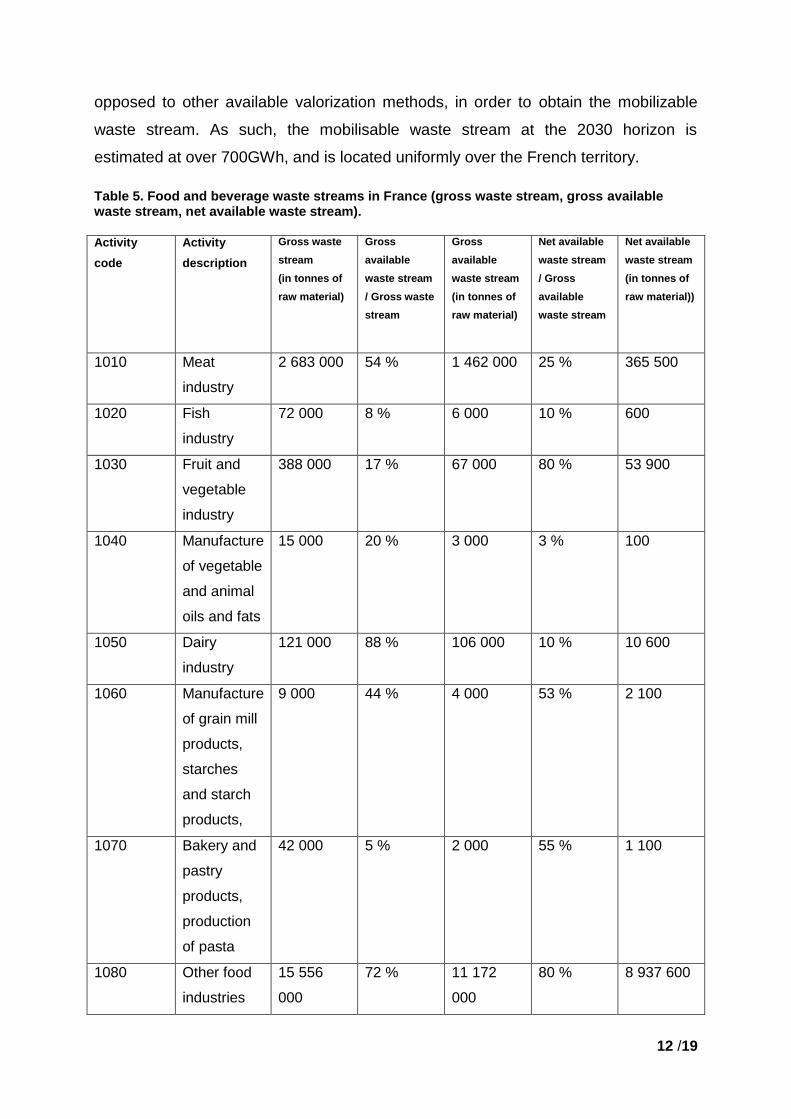
The same study also made an estimation of net potential food and beverage waste streams
that could be available for valorization through the production of biogas by 2030. In the table
below, the potential food and beverage waste resources for production of biogas
according is detailed by major activity codes. Starting from structural data, a gross
waste stream is quantified. Taking into account the valorization rate, the available
gross waste stream is identified. A rate of mobilization is applied (based on technical
accessibility and economical and social feasibility) to obtain the net available waste
stream. In the study, a penetration rate of 20% is adopted for the biogas process as
12 /19
opposed to other available valorization methods, in order to obtain the mobilizable
waste stream. As such, the mobilisable waste stream at the 2030 horizon is
estimated at over 700GWh, and is located uniformly over the French territory.
Table 5. Food and beverage waste streams in France (gross waste stream, gross available waste stream, net available waste stream).
Activity
code
Activity
description
Gross waste
stream
(in tonnes of
raw material)
Gross
available
waste stream
/ Gross waste
stream
Gross
available
waste stream
(in tonnes of
raw material)
Net available
waste stream
/ Gross
available
waste stream
Net available
waste stream
(in tonnes of
raw material))
1010 Meat
industry
2 683 000 54 % 1 462 000 25 % 365 500
1020 Fish
industry
72 000 8 % 6 000 10 % 600
1030 Fruit and
vegetable
industry
388 000 17 % 67 000 80 % 53 900
1040 Manufacture
of vegetable
and animal
oils and fats
15 000 20 % 3 000 3 % 100
1050 Dairy
industry
121 000 88 % 106 000 10 % 10 600
1060 Manufacture
of grain mill
products,
starches
and starch
products,
9 000 44 % 4 000 53 % 2 100
1070 Bakery and
pastry
products,
production
of pasta
42 000 5 % 2 000 55 % 1 100
1080 Other food
industries
15 556
000
72 % 11 172
000
80 % 8 937 600
13 /19
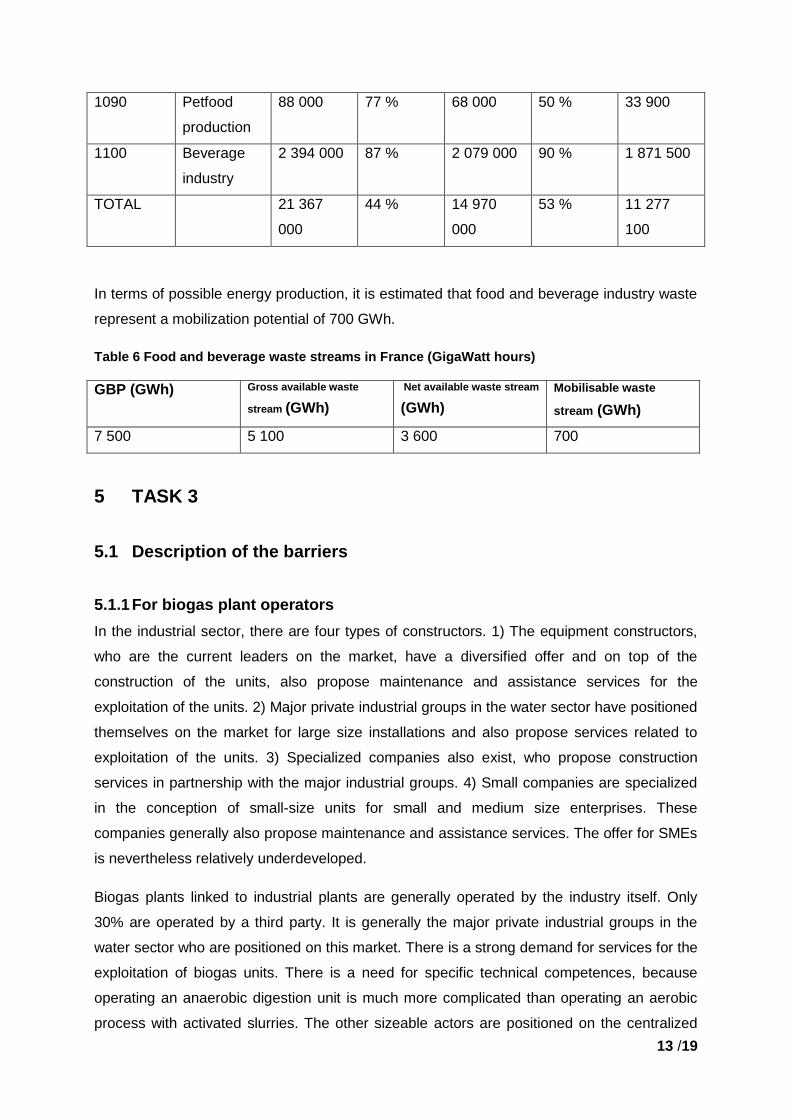
1090 Petfood
production
88 000 77 % 68 000 50 % 33 900
1100 Beverage
industry
2 394 000 87 % 2 079 000 90 % 1 871 500
TOTAL 21 367
000
44 % 14 970
000
53 % 11 277
100
In terms of possible energy production, it is estimated that food and beverage industry waste
represent a mobilization potential of 700 GWh.
Table 6 Food and beverage waste streams in France (GigaWatt hours)
GBP (GWh) Gross available waste
stream (GWh)
Net available waste stream
(GWh)
Mobilisable waste
stream (GWh)
7 500 5 100 3 600 700
5 TASK 3
5.1 Description of the barriers
5.1.1 For biogas plant operators
In the industrial sector, there are four types of constructors. 1) The equipment constructors,
who are the current leaders on the market, have a diversified offer and on top of the
construction of the units, also propose maintenance and assistance services for the
exploitation of the units. 2) Major private industrial groups in the water sector have positioned
themselves on the market for large size installations and also propose services related to
exploitation of the units. 3) Specialized companies also exist, who propose construction
services in partnership with the major industrial groups. 4) Small companies are specialized
in the conception of small-size units for small and medium size enterprises. These
companies generally also propose maintenance and assistance services. The offer for SMEs
is nevertheless relatively underdeveloped.
Biogas plants linked to industrial plants are generally operated by the industry itself. Only
30% are operated by a third party. It is generally the major private industrial groups in the
water sector who are positioned on this market. There is a strong demand for services for the
exploitation of biogas units. There is a need for specific technical competences, because
operating an anaerobic digestion unit is much more complicated than operating an aerobic
process with activated slurries. The other sizeable actors are positioned on the centralized

14 /19
territorial units, which allows for a better management of seasonality problems. The digestion
process is technically “mature”, but a better homogenization and preparation of some
substrates could be helpful to avoid problems in the digestion process and would allow for a
more efficient process.
5.1.2 For food and beverage producers
Today many food and beverage producers have the possibility to valorize the majority of their
food and beverage waste as pet food or other ways of valorization, leaving less room for the
alternative to valorize the waste through the production of biogas. Although the food industry
dominates the industrial market, with 64% of the biogas production, and although biogas
plants are becoming more common in the sector (the market dynamic is starting to stabilize,
with the construction of 2-4 new installations per year on average), some problems
experienced by the industry are limiting the development of plants.
Since 1978, since the opening of the first biogas plant, 133 installations have been built, and
45 have since shut down. It is believed that the financial crisis is one limiting factor, but also
technical factors are to blame. The distilleries and vineyards sector has the largest number of
operational units. It is also the sector with the greatest number of plants that have been
closed. This is mainly due to technical reasons : problems with the conception of the plants,
decantation problems, and overly complex exploitation. The dairy sector is the second
industrial sector in terms of the number of installations. The plants are generally recent in the
dairy sector, on average less than 10 years old. Two plants have closed down in the dairy
sector, one because the industrial site was closed down, and the other because of technical
problems (the variability of the substrate was not compatible with the microbial flora of the
digestor). In the fruit and vegetable sector, 4 plants have closed since being built, 2 of them
because of the closing of the industrial plant itself. In the category “other food industries”, at
least 3 plants have shut down, for technical-economical reasons. In the brewery and drinks
sectors, 3 closures have been observed, because of the closing down of the site itself for 2 of
them, and one because of technical problems with the unit. In the meat sector, some plants
have closed because of the irregularity of the waste, but generally meat sector waste is
coveted in centralized multi-sector plants because of the quality of the waste. In the starch
and yeast sector, one plant is known to have been closed down for economic reasons
(closing of the plant).
In conclusion, two sectors stand out: the dairy sector and the slaughterhouse sector. The
dairy sector is the most dynamic, and is constituted mainly of SMEs, looking for a cheap way
to handle their effluents, which are voluminous and expensive to have taken away. The
slaughterhouse sector is starting to become interested in alternatives to petfood for valorizing

15 /19
their animal by-products. Considering that these sectors are closely linked to the agricultural
sector, it is easy for them to practice co-digestion with agricultural products and valorize the
digestate via application to farmland. However, considering the deep crisis currently affecting
the dairy sector, it is likely that this is going to negatively affect the development of biogas
plants in the food and beverage sector in the future.
5.1.3 General observations and conclusions
The majority of substances which end up in an anaerobic digestion plant are liquid effluents,
because releasing these substances into water is strongly regulated today. As regards some
solid wastes, such as greases and animal flour, anaerobic digestion and in particular
recovery of the energy can be a complementary way to valorize the food and beverage
industry waste, because pet food is also strictly regulated today. Certain food industry
sectors (such as alcohols, molasses, starch, whey and animal oils and greases have high
methanogenic potential, and are therefor of interest for developing anaerobic digestion.
Anaerobic digestion is also a viable alternative for liquid wastes, which can be onerous to
transport over longer distances, although energy recovery is not currently necessarily very
economically interesting.
The reasons for the uptake of anaerobic digestion are the following:
-anaerobic digestion is more efficient for treating the effluents in question
-anaerobic digestion takes less place
-the quantity of by-product slurries is lesser
-energy recovery is a source of supplementary income and is economically sensible as
regards the anterior logic for waste treatment
All new plants practice energy recovery as opposed to torching. In France, the energy
recovered is generally used directly by the industry, in the form of heat or electricity
(boiler or cogeneration) because the plants are generally of a modest size. In other
European countries where plants are bigger and the prices at which the energy is
purchased are higher, the industry sells the gas for injection in the public gas grid.
Biogas production is very slowly being taken up for treatment of effluents, but the pace is
very slow because of the economic crisis, which is hindering the industry to invest in
waste treatment.
Criteria which could speed up the creation of new plants in France (currently at 2-4 new
plants per year) are:

16 /19
-more lucrative installations (fixing more inciting buying prices)
-better access to loans (digestion is today considered to be more risky tan solar
energy or windpower, and banks are thus reluctant to invest
-lighter administrative procedures for new plants (in progress)
-developing co-digestion with other types of wastes (agricultural waste, other
industries, territorial collectivities…)
Codigestion is viewed as an interesting potential way of developing anaerobic digestion. This
brings about some questions regarding contract issues for waste streams with the digestion
plants, as well as the question of the valorization of the digestate itself.
It is expected that the share of biogas produced and torched without energy recovery will go
down in the future. Valorization via cogeneration is likely to take up a more important role as
well. It is also expected that injection in the grid will become more common. As regards
valorization in the form of carburants, there are only two sites in France which practice this.
This form of valorization might develop if purification techniques evolve.
When a project is launched, there will be an arbitrating between cogeneration and injection of
the biomethane, considering the cost of either a cogenerator or a purification unit. It is also
foreseen that the incitations provided via buying prices and obligations to purchase biogas
produced will take the upper hand over investment aids, because of the long duration of
buying-in contracts as opposed to the non-guaranteed permanence of state aids.
Finally, unless the aides for different types of valorization bring about market distortions, the
choice of the mode of valorization should be determined case-by-case as a function of the
site constraints (heat needs, geographical location vis-à-vis the gas grid or a factory, quality
of the biogas obtained, profitability).
In general and not only for the food and beverage industry, but for all sectors where
anaerobic digestion is observed, three main levers have been identified in France which
would allow biogas production to take off :
-Profitability of the facilities
-Positive experience feedback
-Reduction of administrative difficulties.

17 /19
6 References
ATEE, Association Technique Energie Environnement. Carte des installations biogaz
françaises - Club Biogaz. http://www.atee.fr/biogaz/carte-des-installations-biogaz-en-france
Bastide, G (coord). Estimation des gisements potentiels de substrats utilisables en
méthanisation. ADEME, 2013.
Interview, Sylvie Padilla, Chief of Service, Enterprises and Ecotechnologies, ADEME The
French Environment and Energy Management Agency. 2013.
Interview, Yvan Deloche, Expert in anaerobic digestion in the food industry. ACTIA/CRITT
PACA. 2013.
Théobald, O., Brecq, C. (coord), Ernst et Young. Etude de marché de la méthanisation et
des valorizations du biogas. ADEME et GrDF, 2010