ieee std 1490-1998) eee standards ieee standards software ...price/cs410/standard.pdfieee std...
TRANSCRIPT

IEEE Std 1490™-2003(Revision of
IEEE Std 1490-1998)IE
EE
Sta
nd
ard
s 1490TM
IEEE GuideAdoption of PMI StandardA Guide to the Project ManagementBody of Knowledge
Published by The Institute of Electrical and Electronics Engineers, Inc.3 Park Avenue, New York, NY 10016-5997, USA
24 May 2004
IEEE Computer Society
Sponsored by theSoftware Engineering Standards Committee
IEE
E S
tan
dar
ds
Print: SH95196PDF: SS95196
Authorized licensed use limited to: Old Dominion University. Downloaded on September 15,2010 at 18:15:01 UTC from IEEE Xplore. Restrictions apply.

Auth
Recognized as anAmerican National Standard (ANSI)
The Institute of Electrical and Electronics Engineers, Inc.3 Park Avenue, New York, NY 10016-5997, USA
Copyright © 2004 by the Institute of Electrical and Electronics Engineers, Inc.All rights reserved. Published 24 May 2004. Printed in the United States of America.
IEEE is a registered trademark in the U.S. Patent & Trademark Office, owned by the Institute of Electrical and ElectronicsEngineers, Incorporated.
Print: ISBN 0-7381-3893-2 SH95196PDF: ISBN 0-7381-3894-0 SS95196
No part of this publication may be reproduced in any form, in an electronic retrieval system or otherwise, without the priorwritten permission of the publisher.
IEEE Std 1490™-2003(Revision of
IEEE Std 1490-1998)
IEEE Guide
Adoption of PMI Standard
A Guide to the Project Management Body of Knowledge
Sponsor
Software Engineering Standards Committeeof theIEEE Computer Society
Approved 26 April 2004
American National Standards Institute
Approved 10 December 2003
IEEE-SA Standards Board
Abstract: The subset of the Project Management Body of Knowledge that is generally accepted isidentified and described in this guide. Generally accepted means that the knowledge and practicesdescribed are applicable to most projects most of the time, and that there is widespread consensusabout their value and usefulness. It does not mean that the knowledge and practices should be ap-plied uniformly to all projects without considering whether they are appropriate.Keywords: body of knowledge, project, project management
orized licensed use limited to: Old Dominion University. Downloaded on September 15,2010 at 18:15:01 UTC from IEEE Xplore. Restrictions apply.

IEEE Standards documents are developed within the IEEE Societies and the Standards Coordinating Committees of theIEEE Standards Association (IEEE-SA) Standards Board. The IEEE develops its standards through a consensus develop-ment process, approved by the American National Standards Institute, which brings together volunteers representing variedviewpoints and interests to achieve the final product. Volunteers are not necessarily members of the Institute and serve with-out compensation. While the IEEE administers the process and establishes rules to promote fairness in the consensus devel-opment process, the IEEE does not independently evaluate, test, or verify the accuracy of any of the information containedin its standards.
Use of an IEEE Standard is wholly voluntary. The IEEE disclaims liability for any personal injury, property or other dam-age, of any nature whatsoever, whether special, indirect, consequential, or compensatory, directly or indirectly resultingfrom the publication, use of, or reliance upon this, or any other IEEE Standard document.
The IEEE does not warrant or represent the accuracy or content of the material contained herein, and expressly disclaimsany express or implied warranty, including any implied warranty of merchantability or fitness for a specific purpose, or thatthe use of the material contained herein is free from patent infringement. IEEE Standards documents are supplied “AS IS.”
The existence of an IEEE Standard does not imply that there are no other ways to produce, test, measure, purchase, market,or provide other goods and services related to the scope of the IEEE Standard. Furthermore, the viewpoint expressed at thetime a standard is approved and issued is subject to change brought about through developments in the state of the art andcomments received from users of the standard. Every IEEE Standard is subjected to review at least every five years for revi-sion or reaffirmation. When a document is more than five years old and has not been reaffirmed, it is reasonable to concludethat its contents, although still of some value, do not wholly reflect the present state of the art. Users are cautioned to checkto determine that they have the latest edition of any IEEE Standard.
In publishing and making this document available, the IEEE is not suggesting or rendering professional or other servicesfor, or on behalf of, any person or entity. Nor is the IEEE undertaking to perform any duty owed by any other person orentity to another. Any person utilizing this, and any other IEEE Standards document, should rely upon the advice of a com-petent professional in determining the exercise of reasonable care in any given circumstances.
Interpretations: Occasionally questions may arise regarding the meaning of portions of standards as they relate to specificapplications. When the need for interpretations is brought to the attention of IEEE, the Institute will initiate action to prepareappropriate responses. Since IEEE Standards represent a consensus of concerned interests, it is important to ensure that anyinterpretation has also received the concurrence of a balance of interests. For this reason, IEEE and the members of its soci-eties and Standards Coordinating Committees are not able to provide an instant response to interpretation requests except inthose cases where the matter has previously received formal consideration. At lectures, symposia, seminars, or educationalcourses, an individual presenting information on IEEE standards shall make it clear that his or her views should be consideredthe personal views of that individual rather than the formal position, explanation, or interpretation of the IEEE.
Comments for revision of IEEE Standards are welcome from any interested party, regardless of membership affiliation withIEEE. Suggestions for changes in documents should be in the form of a proposed change of text, together with appropriatesupporting comments. Comments on standards and requests for interpretations should be addressed to:
Secretary, IEEE-SA Standards Board
445 Hoes Lane
P.O. Box 1331
Piscataway, NJ 08855-1331USA
Authorization to photocopy portions of any individual standard for internal or personal use is granted by the Institute ofElectrical and Electronics Engineers, Inc., provided that the appropriate fee is paid to Copyright Clearance Center. Toarrange for payment of licensing fee, please contact Copyright Clearance Center, Customer Service, 222 Rosewood Drive,Danvers, MA 01923 USA; +1 978 750 8400. Permission to photocopy portions of any individual standard for educationalclassroom use can also be obtained through the Copyright Clearance Center.
NOTE−Attention is called to the possibility that implementation of this standard may require use of subjectmatter covered by patent rights. By publication of this standard, no position is taken with respect to the exist-ence or validity of any patent rights in connection therewith. The IEEE shall not be responsible for identifyingpatents for which a license may be required by an IEEE standard or for conducting inquiries into the legal valid-ity or scope of those patents that are brought to its attention.
Authorized licensed use limited to: Old Dominion University. Downloaded on September 15,2010 at 18:15:01 UTC from IEEE Xplore. Restrictions apply.

Auth
Introduction
(This introduction is not part of IEEE Std 1490-2003, IEEE Guide−Adoption of PMI Standard−A Guide to the ProjectManagement Body of Knowledge.)1
Notice to users
Errata
Errata, if any, for this and all other standards can be accessed at the following URL: http://standards.ieee.org/reading/ieee/updates/errata/index.html. Users are encouraged to check this URL forerrata periodically.
Interpretations
Current interpretations can be accessed at the following URL: http://standards.ieee.org/reading/ieee/interp/index.html.
Patents
Attention is called to the possibility that implementation of this standard may require use of subject mattercovered by patent rights. By publication of this standard, no position is taken with respect to the existence orvalidity of any patent rights in connection therewith. The IEEE shall not be responsible for identifyingpatents or patent applications for which a license may be required by to implement an IEEE standard or forconducting inquiries into the legal validity or scope of those patents that are brought to its attention.
Participants
The following is a list of participants in the PMBOK 2000 Adoption Working Group.
Susan K. Land, Chair
1The Project Management Institute, Inc. (PMI) did not participate in the development of this publication and has not reviewed thecontent for accuracy. Accordingly, PMI does not endorse this publication, and makes no warranty, guarantee, or representation,expressed or implied, as to its accuracy or content. Additionally, PMI makes no warranty, guarantee, or representation of any kind thatthe information contained in this publication is suitable for any particular purpose. All such information, content, and related graphicsare provided “as is.”
Edward R. ByrnePaul R. CrollScott P. DuncanRoger U. Fujii
Mark O. HenleyDennis LawrenceClaire L. Lohr
Symon M. MoldavskyJames W. MooreNorman F. SchneidewindDavid J. Schultz
Copyright © 2004 IEEE. All rights reserved
orized licensed use limited to: Old Dominion Unive
.
rsity. Downloaded on September 15,2010 at 18:1
iii
5:01 UTC from IEEE Xplore. Restrictions apply.

Auth
The following individual members of the balloting committee voted on this standard. Balloters may havevoted for approval, disapproval, or abstention.
When the IEEE-SA Standards Board approved this standard on 10 December 2003, it had the followingmembership:
Don Wright, ChairHoward M. Frazier, Vice Chair
Judith Gorman, Secretary
*Member Emeritus
Also included are the following nonvoting IEEE-SA Standards Board liaisons:
Alan Cookson, NIST RepresentativeSatish K. Aggarwal, NRC Representative
Noelle D. HumenickIEEE Standards Project Editor
Alexander BerlerRichard BiehlJohn BloxhamJuris BorzovsJoseph ButchkoAntonio M. CicuPatricia DaggettGeoffrey DarntonJohn DonaldsonDr. Sourav DuttaChristof EbertWilliam EventoffJohn FendrichYaacov FensterKirby FortenberryAndrew Gabb
John Garth GlynnLawrence GuntherJon HagarJohn HarauzMark HenleyJohn HorchPeter HungWilliam JunkThomas M. KuriharaRon KenettIan McChesneyDenis MeredithRobert MortonsonGerald OuradaLou PintoAnnette Reilly
Garry RoedlerTerence RoutJames RuggieriHelmut SandmayrRobert SchaafRobert W. ShillatoCarl SingerJoyce StatzBooker ThomasPeter ThomasGlenn VenablesDavid WaldenJohn WalzStephanie WhiteOren Yuen
H. Stephen BergerJoe BruderBob DavisRichard DeBlasioJulian Forster*Toshio FukudaArnold M. GreenspanRaymond Hapeman
Donald M. HeirmanLaura HitchcockRichard H. HulettAnant JainLowell G. JohnsonJoseph L. Koepfinger*Tom McGeanSteve Mills
Daleep C. MohlaWilliam J. MoylanPaul NikolichGary RobinsonMalcolm V. ThadenGeoffrey O. ThompsonDoug ToppingHoward L. Wolfman
iv
orized licensed use limited to: Old Dominion Unive
Copyri
rsity. Downloaded on September 15,2010 at 18:1
ght © 2004 IEEE. All rights reserved.
5:01 UTC from IEEE Xplore. Restrictions apply.

Auth
Contents
1. Overview.............................................................................................................................................. 1
2. References............................................................................................................................................ 1
3. IEEE Adoption implementation considerations .................................................................................. 2
3.1 Terminology correlation .............................................................................................................. 2
Copyright © 2004 IEEE. All rights reserved. v
orized licensed use limited to: Old Dominion University. Downloaded on September 15,2010 at 18:15:01 UTC from IEEE Xplore. Restrictions apply.

Auth
vi Copyright © 2004 IEEE. All rights reserved.
orized licensed use limited to: Old Dominion University. Downloaded on September 15,2010 at 18:15:01 UTC from IEEE Xplore. Restrictions apply.
Auth
IEEE Guide
Adoption of PMI Standard
A Guide to the Project Management Body of Knowledge
1. Overview
IEEE Std 1490-2003 is an adoption of PMI, A Guide to Project Management Body of Knowledge (Guideto PMBOK).
2. References
This standard may be used separately from, or in conjunction with, one or more of the following publica-tions. When the following standards are superseded by an approved revision, the revision shall apply.
IEEE/EIA 12207.0-1996, IEEE/EIA Standard−Industry Implementation of ISO/IEC 12207: 1995, Standardfor Information Technology−Software life cycle processes.
IEEE/EIA 12207.1-1997, IEEE/EIA Guide−Industry Implementation of ISO/IEC 12207: 1995, Standard forInformation Technology−Software life cycle processes−Life cycle data.
IEEE/EIA 12207.2 -1997, IEEE/EIA Guide−Industry Implementation of ISO/IEC 12207: 1995, Standardfor Information Technology−Software life cycle processes−Implementation considerations.
IEEE Std 610.12-1990 (R 2002), IEEE Standard Glossary of Software Engineering Terminology.1,2
IEEE Std 1028-1997 (R 2002), IEEE Standard for Software Reviews.
IEEE Std 1044-1993 (R 2002), IEEE Standard Classification for Software Anomalies.
IEEE Std 1045-1992 (R 2002), IEEE Standard for Software Productivity Metrics.
1IEEE publications are available from the Institute of Electrical and Electronics Engineers, 445 Hoes Lane, P.O. Box 1331, Piscataway, NJ 08855-1331, USA (http://standards.ieee.org/).2The IEEE standards or products referred to in this clause are trademarks of the Institute of Electrical and Electronics Engineers, Inc.
Copyright © 2004 IEEE. All rights reserved. 1
orized licensed use limited to: Old Dominion University. Downloaded on September 15,2010 at 18:15:01 UTC from IEEE Xplore. Restrictions apply.

IEEEStd1490-2003
Auth
IEEE Std 1058-1998, IEEE Standard for Software Project Management Plans.
IEEE Std 1074-1997, IEEE Standard for Developing Software Life Cycle Processes.
3. IEEE Adoption implementation considerations
3.1 Terminology correlation
The purpose of this clause is to correlate key terminology in the Guide to PMBOK and IEEE Software Engi-neering Standards. Three key terms are examined: Life cycle, process, and project.
3.1.1 Life cycle
3.1.1.1 project life cycle: A collection of generally sequential project phases whose name and number aredetermined by the control needs of the organization or organizations involved in the project. (PMI, Guide toPMBOK).
3.1.1.2 software life cycle: The period of time that begins when a software project is conceived and endswhen the software is no longer available for use. (IEEE Std 610.12-1990).
Both definitions have a time dimension. The scope of the PMI definition is limited to a specific project. ThePMI definition focuses on the control aspect of the project, whereas the scope of the IEEE definitionincludes the entire life of the software. The IEEE definition focuses on the software product and its role.
3.1.2 Process
3.1.2.1 Process: A series of actions bringing about a result. (PMI, Guide to PMBOK)
3.1.2.2 process: A set of interrelated activities, which transforms inputs into outputs. (IEEE/EIA 12207.0-1996).
NOTE−The term “activities” covers use of resources.
Conceptually, the two definitions are the same.
3.1.3 Project
3.1.3.1 project: A temporary endeavor undertaken to create a unique product or service. (PMI, Guide toPMBOK).
3.1.3.2 software project: The set of work activities, both technical and managerial, required to satisfy theterms and conditions of a project agreement. A software project should have specific starting and endingdates, well-defined objectives and constraints, established responsibilities, and a budget and schedule. Asoftware project may be self-contained or may be part of a larger project. In some cases, a software projectmay span only a portion of the software development cycle. In other cases, a software project may spanmany years and consist of numerous subprojects, each being a well defined and self-contained softwareproject. (IEEE Std 1058, 1998 Edition)
At the conceptual level both terms have similar semantics. The PMI definition focuses on the essence of aproject. The IEEE definition includes a description of the characteristics of a project.
2 Copyright © 2004 IEEE. All rights reserved.
orized licensed use limited to: Old Dominion University. Downloaded on September 15,2010 at 18:15:01 UTC from IEEE Xplore. Restrictions apply.

m START m CHAPTER 7
m CONTENTS m CHAPTER 8
m LIST OF FIGURES m CHAPTER 9
m PREFACE m CHAPTER 10
m CHAPTER 1 m CHAPTER 11
m CHAPTER 2 m CHAPTER 12
m CHAPTER 3 m APPENDICES
m CHAPTER 4 m GLOSSARY
m CHAPTER 5 m INDEX
m CHAPTER 6
EXIT
A Guide to theProjectManagementBody of Knowledge(PMBOK® Guide)
Authorized licensed use limited to: Old Dominion University. Downloaded on September 15,2010 at 18:15:01 UTC from IEEE Xplore. Restrictions apply.

A Guide to theProjectManagementBody of Knowledge(PMBOK® Guide)
2000 Edition
Project Management InstituteNewtown Square, Pennsylvania USA
Authorized licensed use limited to: Old Dominion University. Downloaded on September 15,2010 at 18:15:01 UTC from IEEE Xplore. Restrictions apply.

Library of Congress Cataloging-in-Publication Data
A guide to the project management body of knowledge (PMBOK® guide).--2000 ed.p. cm.
Includes biobliographical references and index.ISBN 1-880410-22-2 (alk. paper)--ISBN 1-880410-23-0 (pbk. : alk. paper)1. Industrial project management. I. Title: PMBOK® guide. II. Project Management
Institute. HD69.P75 G845 2001658.4’04—dc21 00-051727
CIP
ISBN: 1-880410-23-0 (paperback)ISBN: 1-880410-22-2 (hardcover)ISBN: 1-880410-25-7 (CD-ROM)
Published by: Project Management Institute, Inc.Four Campus BoulevardNewtown Square, Pennsylvania 19073-3299 USAPhone: 610-356-4600 or Visit our website: www.pmi.orgE-mail: [email protected]
© 2000 Project Management Institute, Inc. All rights reserved.
PMI Publishing Division welcomes corrections and comments on its documents. In addition to comments directed toPMI about the substance of A Guide to the Project Management Body of Knowledge, please feel free to send commentson typographical, formatting, or other errors. Simply make a copy of the relevant page of the PMBOK® Guide, markthe error, and send it to: PMI Publishing Division, Forty Colonial Square, Sylva, North Carolina 28779 USA, phone:828/586-3715, fax: 828/586-4020, e-mail: [email protected].
“PMI” and the PMI logo are service and trademarks registered in the United States and other nations; “PMP” andthe PMP logo are certification marks registered in the United States and other nations; “PMBOK”, “PM Network”,and “PMI Today” are trademarks registered in the United States and other nations; and “Project ManagementJournal” and “Building professionalism in project management.” are trademarks of the Project Management Insti-tute, Inc.
PMI® books are available at special quantity discounts to use as premiums and sales promotions, or for use in cor-porate training programs as well as other educational programs. For more information, please write to the Business Manager, PMI Publishing Division, Forty Colonial Square, Sylva, NC 28779 USA. Or contact your local bookstore.
Printed in the United States of America. No part of this work may be reproduced or transmitted in any form or byany means, electronic, manual, photocopying, recording, or by any information storage and retrieval system,without prior written permission of the publisher.
The paper used in this book complies with the Permanent Paper Standard issued by the National Information Stan-dards Organization (Z39.48—1984).
Printed and bound by Automated Graphic Systems, White Plains, Maryland, USA.
1 0 9 8 7 6 5 4 3 2 1
Authorized licensed use limited to: Old Dominion University. Downloaded on September 15,2010 at 18:15:01 UTC from IEEE Xplore. Restrictions apply.

Contents
List of Figures – – – – – – – – – – – – – – – – – – – – – – – – – – – – – – – viiPreface to the 2000 Edition – – – – – – – – – – – – – – – – – – – – – – – ix
Section I—The Project Management Framework – – – – – – – – – – – 1Chapter 1—Introduction – – – – – – – – – – – – – – – – – – – – – – – – – 3
1.1 Purpose of This Guide – – – – – – – – – – – – – – – – – – – – – – – – – 31.2 What Is a Project? – – – – – – – – – – – – – – – – – – – – – – – – – – – 41.3 What Is Project Management? – – – – – – – – – – – – – – – – – – – – 61.4 Relationship to Other Management Disciplines – – – – – – – – – – – – 91.5 Related Endeavors – – – – – – – – – – – – – – – – – – – – – – – – – – – 10
Chapter 2—The Project Management Context – – – – – – – – – – – – – 112.1 Project Phases and the Project Life Cycle – – – – – – – – – – – – – – – 112.2 Project Stakeholders – – – – – – – – – – – – – – – – – – – – – – – – – – 162.3 Organizational Influences – – – – – – – – – – – – – – – – – – – – – – – 182.4 Key General Management Skills – – – – – – – – – – – – – – – – – – – – 212.5 Social-Economic-Environmental Influences – – – – – – – – – – – – – – 26
Chapter 3—Project Management Processes – – – – – – – – – – – – – – 293.1 Project Processes – – – – – – – – – – – – – – – – – – – – – – – – – – – 293.2 Process Groups – – – – – – – – – – – – – – – – – – – – – – – – – – – – 303.3 Process Interactions – – – – – – – – – – – – – – – – – – – – – – – – – – 323.4 Customizing Process Interactions – – – – – – – – – – – – – – – – – – – 373.5 Mapping of Project Management Processes – – – – – – – – – – – – – 38
Section II—The Project Management Knowledge Areas – – – – – – – 39Chapter 4—Project Integration Management – – – – – – – – – – – – – – 41
4.1 Project Plan Development – – – – – – – – – – – – – – – – – – – – – – – 424.2 Project Plan Execution – – – – – – – – – – – – – – – – – – – – – – – – – 464.3 Integrated Change Control – – – – – – – – – – – – – – – – – – – – – – – 47
Chapter 5—Project Scope Management – – – – – – – – – – – – – – – – 515.1 Initiation – – – – – – – – – – – – – – – – – – – – – – – – – – – – – – – – 535.2 Scope Planning – – – – – – – – – – – – – – – – – – – – – – – – – – – – 555.3 Scope Definition – – – – – – – – – – – – – – – – – – – – – – – – – – – – 575.4 Scope Verification – – – – – – – – – – – – – – – – – – – – – – – – – – – 615.5 Scope Change Control – – – – – – – – – – – – – – – – – – – – – – – – – 62
Chapter 6—Project Time Management – – – – – – – – – – – – – – – – – 656.1 Activity Definition – – – – – – – – – – – – – – – – – – – – – – – – – – – 656.2 Activity Sequencing – – – – – – – – – – – – – – – – – – – – – – – – – – 686.3 Activity Duration Estimating – – – – – – – – – – – – – – – – – – – – – – 716.4 Schedule Development – – – – – – – – – – – – – – – – – – – – – – – – 736.5 Schedule Control – – – – – – – – – – – – – – – – – – – – – – – – – – – 79
Chapter 7—Project Cost Management – – – – – – – – – – – – – – – – – 837.1 Resource Planning – – – – – – – – – – – – – – – – – – – – – – – – – – – 857.2 Cost Estimating – – – – – – – – – – – – – – – – – – – – – – – – – – – – 867.3 Cost Budgeting – – – – – – – – – – – – – – – – – – – – – – – – – – – – 897.4 Cost Control – – – – – – – – – – – – – – – – – – – – – – – – – – – – – – 90
A Guide to the Project Management Body of Knowledge (PMBOK® Guide) 2000 Edition©2000 Project Management Institute, Four Campus Boulevard, Newtown Square, PA 19073-3299 USA v
Authorized licensed use limited to: Old Dominion University. Downloaded on September 15,2010 at 18:15:01 UTC from IEEE Xplore. Restrictions apply.
Chapter 8—Project Quality Management – – – – – – – – – – – – – – – – 958.1 Quality Planning – – – – – – – – – – – – – – – – – – – – – – – – – – – – 978.2 Quality Assurance – – – – – – – – – – – – – – – – – – – – – – – – – – – 1018.3 Quality Control – – – – – – – – – – – – – – – – – – – – – – – – – – – – – 102
Chapter 9—Project Human Resource Management – – – – – – – – – – 1079.1 Organizational Planning – – – – – – – – – – – – – – – – – – – – – – – – 1089.2 Staff Acquisition – – – – – – – – – – – – – – – – – – – – – – – – – – – – 1129.3 Team Development – – – – – – – – – – – – – – – – – – – – – – – – – – 114
Chapter 10—Project Communications Management – – – – – – – – – 11710.1 Communications Planning – – – – – – – – – – – – – – – – – – – – – – – 11910.2 Information Distribution – – – – – – – – – – – – – – – – – – – – – – – – 12110.3 Performance Reporting – – – – – – – – – – – – – – – – – – – – – – – – 12210.4 Administrative Closure – – – – – – – – – – – – – – – – – – – – – – – – – 125
Chapter 11—Project Risk Management – – – – – – – – – – – – – – – – – 12711.1 Risk Management Planning – – – – – – – – – – – – – – – – – – – – – – 12911.2 Risk Identification – – – – – – – – – – – – – – – – – – – – – – – – – – – 13111.3 Qualitative Risk Analysis – – – – – – – – – – – – – – – – – – – – – – – – 13311.4 Quantitative Risk Analysis – – – – – – – – – – – – – – – – – – – – – – – 13711.5 Risk Response Planning – – – – – – – – – – – – – – – – – – – – – – – – 14011.6 Risk Monitoring and Control – – – – – – – – – – – – – – – – – – – – – – 144
Chapter 12—Project Procurement Management – – – – – – – – – – – – 14712.1 Procurement Planning – – – – – – – – – – – – – – – – – – – – – – – – – 14912.2 Solicitation Planning – – – – – – – – – – – – – – – – – – – – – – – – – – 15212.3 Solicitation – – – – – – – – – – – – – – – – – – – – – – – – – – – – – – – 15312.4 Source Selection – – – – – – – – – – – – – – – – – – – – – – – – – – – 15512.5 Contract Administration – – – – – – – – – – – – – – – – – – – – – – – – 15612.6 Contract Closeout – – – – – – – – – – – – – – – – – – – – – – – – – – – 158
Section III—Appendices – – – – – – – – – – – – – – – – – – – – – – – – – – 161Appendix A—The Project Management Institute
Standards-Setting Process – – – – – – – – – – – – – – – – 163Appendix B—Evolution of PMI’s A Guide to the
Project Management Body of Knowledge – – – – – – – – – – 167Appendix C—Contributors and Reviewers of
PMBOK® Guide 2000 Edition – – – – – – – – – – – – – – – – 175Appendix D—Notes – – – – – – – – – – – – – – – – – – – – – – – – – – – – 179Appendix E—Application Area Extensions – – – – – – – – – – – – – – – – 181Appendix F—Additional Sources of Information on
Project Management – – – – – – – – – – – – – – – – – – – – 185Appendix G—Summary of Project Management
Knowledge Areas – – – – – – – – – – – – – – – – – – – – – – 189
Section IV—Glossary and Index – – – – – – – – – – – – – – – – – – – – – 193Glossary – – – – – – – – – – – – – – – – – – – – – – – – – – – – – – – – – – 195Index – – – – – – – – – – – – – – – – – – – – – – – – – – – – – – – – – – – – – 211
A Guide to the Project Management Body of Knowledge (PMBOK® Guide) 2000 Edition©2000 Project Management Institute, Four Campus Boulevard, Newtown Square, PA 19073-3299 USAvi
Authorized licensed use limited to: Old Dominion University. Downloaded on September 15,2010 at 18:15:01 UTC from IEEE Xplore. Restrictions apply.

A Guide to the Project Management Body of Knowledge (PMBOK® Guide) 2000 Edition©2000 Project Management Institute, Four Campus Boulevard, Newtown Square, PA 19073-3299 USA vii
List of Figures
Figure 1–1. Overview of Project Management Knowledge Areas and Project Management Processes – – – 8Figure 1–2. Relationship of Project Management to Other Management Disciplines – – – – – – – – – – – – 9Figure 2–1. Sample Generic Life Cycle – – – – – – – – – – – – – – – – – – – – – – – – – – – – – – – – – – – – 13Figure 2–2. Representative Life Cycle for Defense Acquisition, per US DODI 5000.2
(Final Coordination Draft, April 2000) – – – – – – – – – – – – – – – – – – – – – – – – – – – – – – 14Figure 2–3. Representative Construction Project Life Cycle, per Morris – – – – – – – – – – – – – – – – – – – 15Figure 2–4. Representative Life Cycle for a Pharmaceuticals Project, per Murphy – – – – – – – – – – – – – 16Figure 2–5. Representative Software Development Life Cycle, per Muench – – – – – – – – – – – – – – – – – 17Figure 2–6. Organizational Structure Influences on Projects – – – – – – – – – – – – – – – – – – – – – – – – – 19Figure 2–7. Functional Organization – – – – – – – – – – – – – – – – – – – – – – – – – – – – – – – – – – – – – 20Figure 2–8. Projectized Organization – – – – – – – – – – – – – – – – – – – – – – – – – – – – – – – – – – – – – 21Figure 2–9. Weak Matrix Organization – – – – – – – – – – – – – – – – – – – – – – – – – – – – – – – – – – – – 22
Figure 2–10. Balanced Matrix Organization – – – – – – – – – – – – – – – – – – – – – – – – – – – – – – – – – – 22Figure 2–11. Strong Matrix Organization – – – – – – – – – – – – – – – – – – – – – – – – – – – – – – – – – – – 23Figure 2–12. Composite Organization – – – – – – – – – – – – – – – – – – – – – – – – – – – – – – – – – – – – – 23Figure 3–1. Links among Process Groups in a Phase – – – – – – – – – – – – – – – – – – – – – – – – – – – – 31Figure 3–2. Overlap of Process Groups in a Phase – – – – – – – – – – – – – – – – – – – – – – – – – – – – – – 31Figure 3–3. Interaction between Phases – – – – – – – – – – – – – – – – – – – – – – – – – – – – – – – – – – – 31Figure 3–4. Relationships among the Initiating Processes – – – – – – – – – – – – – – – – – – – – – – – – – – 32Figure 3–5. Relationships among the Planning Processes – – – – – – – – – – – – – – – – – – – – – – – – – – 33Figure 3–6. Relationships among the Executing Processes – – – – – – – – – – – – – – – – – – – – – – – – – 35Figure 3–7. Relationships among the Controlling Processes – – – – – – – – – – – – – – – – – – – – – – – – – 36Figure 3–8. Relationships among the Closing Processes – – – – – – – – – – – – – – – – – – – – – – – – – – 37Figure 3–9. Mapping of Project Management Processes to the Process Groups and Knowledge Areas – – 38Figure 4–1. Project Integration Management Overview – – – – – – – – – – – – – – – – – – – – – – – – – – – 42Figure 4–2. Coordinating Changes Across the Entire Project – – – – – – – – – – – – – – – – – – – – – – – – 48Figure 5–1. Project Scope Management Overview – – – – – – – – – – – – – – – – – – – – – – – – – – – – – – 52Figure 5–2. Sample Work Breakdown Structure for Defense Material Items – – – – – – – – – – – – – – – – 58Figure 5–3. Sample Work Breakdown Structure Organized by Phase – – – – – – – – – – – – – – – – – – – – 59Figure 5–4. Sample Work Breakdown Structure for Wastewater Treatment Plant – – – – – – – – – – – – – – 60Figure 6–1. Project Time Management Overview – – – – – – – – – – – – – – – – – – – – – – – – – – – – – – 66Figure 6–2. Network Logic Diagram Drawn Using the Precedence Diagramming Method – – – – – – – – – – 69Figure 6–3. Network Logic Diagram Drawn Using the Arrow Diagramming Method – – – – – – – – – – – – – 70Figure 6–4. PERT Duration Calculation for a Single Activity – – – – – – – – – – – – – – – – – – – – – – – – – 76Figure 6–5. Project Network Diagram with Dates – – – – – – – – – – – – – – – – – – – – – – – – – – – – – – 77Figure 6–6. Bar (Gantt) Chart – – – – – – – – – – – – – – – – – – – – – – – – – – – – – – – – – – – – – – – – 78Figure 6–7. Milestone Chart – – – – – – – – – – – – – – – – – – – – – – – – – – – – – – – – – – – – – – – – – 79Figure 7–1. Project Cost Management Overview – – – – – – – – – – – – – – – – – – – – – – – – – – – – – – – 84Figure 7–2. Illustrative Cost Baseline Display – – – – – – – – – – – – – – – – – – – – – – – – – – – – – – – – 90Figure 8–1. Project Quality Management Overview – – – – – – – – – – – – – – – – – – – – – – – – – – – – – 96Figure 8–2. Cause-and-Effect Diagram – – – – – – – – – – – – – – – – – – – – – – – – – – – – – – – – – – – 99Figure 8–3. Sample Process Flowchart – – – – – – – – – – – – – – – – – – – – – – – – – – – – – – – – – – – 100Figure 8–4. Control Chart of Project Schedule Performance – – – – – – – – – – – – – – – – – – – – – – – – – 104Figure 8–5. Pareto Diagram – – – – – – – – – – – – – – – – – – – – – – – – – – – – – – – – – – – – – – – – – 105
Authorized licensed use limited to: Old Dominion University. Downloaded on September 15,2010 at 18:15:01 UTC from IEEE Xplore. Restrictions apply.

Figure 9–1. Project Human Resource Management Overview – – – – – – – – – – – – – – – – – – – – – – – – 108Figure 9–2. Responsibility Assignment Matrix – – – – – – – – – – – – – – – – – – – – – – – – – – – – – – – – 111Figure 9–3. Illustrative Resource Histogram – – – – – – – – – – – – – – – – – – – – – – – – – – – – – – – – – 112
Figure 10–1. Project Communications Management Overview – – – – – – – – – – – – – – – – – – – – – – – – 118Figure 10–2. Illustrative Graphic Performance Report – – – – – – – – – – – – – – – – – – – – – – – – – – – – – 124Figure 10–3. Illustrative Tabular Performance Report – – – – – – – – – – – – – – – – – – – – – – – – – – – – – 124Figure 11–1. Project Risk Management Overview – – – – – – – – – – – – – – – – – – – – – – – – – – – – – – – 128Figure 11–2. Rating Impacts for a Risk – – – – – – – – – – – – – – – – – – – – – – – – – – – – – – – – – – – – 136Figure 11–3. Probability-Impact Matrix – – – – – – – – – – – – – – – – – – – – – – – – – – – – – – – – – – – – 137Figure 11–4. Cost Estimates and Ranges from the Risk Interview – – – – – – – – – – – – – – – – – – – – – – 139Figure 11–5. Examples of Commonly Used Probability Distributions – – – – – – – – – – – – – – – – – – – – – 140Figure 11–6. Decision Tree Analysis – – – – – – – – – – – – – – – – – – – – – – – – – – – – – – – – – – – – – – 141Figure 11–7. Cost Risk Simulation – – – – – – – – – – – – – – – – – – – – – – – – – – – – – – – – – – – – – – 142Figure 12–1. Project Procurement Management Overview – – – – – – – – – – – – – – – – – – – – – – – – – – 148
A Guide to the Project Management Body of Knowledge (PMBOK® Guide) 2000 Edition©2000 Project Management Institute, Four Campus Boulevard, Newtown Square, PA 19073-3299 USAviii
Authorized licensed use limited to: Old Dominion University. Downloaded on September 15,2010 at 18:15:01 UTC from IEEE Xplore. Restrictions apply.

Preface to the 2000 Edition
A Guide to the Project Manageme©2000 Project Management Insti
Authorized licensed use limite
This document supersedes the Project Management Institute’s (PMI®) A Guide tothe Project Management Body of Knowledge (PMBOK® Guide), published in 1996.
The scope of the project to update the 1996 publication was to:■ Add new material reflecting the growth of the knowledge and practices in the
field of project management by capturing those practices, tools, techniques,and other relevant items that have become generally accepted. (Generallyaccepted means being applicable to most projects most of the time and havingwidespread consensus about their value and usefulness.)
■ Add clarification to text and figures to make this document more beneficial tousers.
■ Correct existing errors in the predecessor document.To assist users of this document, who may be familiar with its predecessor, we
have summarized the major differences here.1. Throughout the document, we clarified that projects manage to requirements,
which emerge from needs, wants, and expectations.2. We strengthened linkages to organizational strategy throughout the document. 3. We provided more emphasis on progressive elaboration in Section 1.2.3.4. We acknowledged the role of the Project Office in Section 2.3.4.5. We added references to project management involving developing economies,
as well as social, economic, and environmental impacts, in Section 2.5.4.6. We added expanded treatment of Earned Value Management in Chapter 4
(Project Integration Management), Chapter 7 (Project Cost Management), andChapter 10 (Project Communications Management).
7. We rewrote Chapter 11 (Project Risk Management). The chapter now containssix processes instead of the previous four processes. The six processes are Risk Man-agement Planning, Risk Identification, Qualitative Risk Analysis, Quantitative RiskAnalysis, Risk Response Planning, and Risk Monitoring and Control.
8. We moved scope verification from an executing process to a controlling process.9. We changed the name of Process 4.3 from Overall Change Control to Inte-
grated Change Control to emphasize the importance of change control throughoutthe entirety of the project.
10. We added a chart that maps the thirty-nine Project Management processesagainst the five Project Management Process Groups and the nine Project Manage-ment Knowlege Areas in Figure 3-9.
11. We standardized terminology throughout the document from “supplier” to“seller.”
12. We added several Tools and Techniques:■ Chapter 4 (Project Integration Management)
◆ Earned Value Management (EVM)◆ Preventive Action
nt Body of Knowledge (PMBOK® Guide) 2000 Editiontute, Four Campus Boulevard, Newtown Square, PA 19073-3299 USA ix
d to: Old Dominion University. Downloaded on September 15,2010 at 18:15:01 UTC from IEEE Xplore. Restrictions apply.

x
Authorized licensed use lim
■ Chapter 5 (Project Scope Management)◆ Scope Statement Updates◆ Project Plan◆ Adjusted Baseline
■ Chapter 6 (Project Time Management)◆ Quantitatively Based Durations◆ Reserve Time (contingency)◆ Coding Structure◆ Variance Analysis◆ Milestones◆ Activity Attributes◆ Computerized Tools
■ Chapter 7 (Project Cost Management)◆ Estimating Publications◆ Earned Value Measurement
■ Chapter 8 (Project Quality Management)◆ Cost of Quality
■ Chapter 10 (Project Communications Management)◆ Project Reports◆ Project Presentations◆ Project Closure
■ Chapter 11 (Project Risk Management— this chapter is rewritten)The body of knowledge of the project management profession continues to
grow, and PMI intends to update the PMBOK® Guide on a periodic basis. There-fore, if you have any comments about this document or suggestions about howthis document can be improved, please send them to:
PMI Project Management Standards ProgramProject Management InstituteFour Campus BoulevardNewtown Square, PA 19073-3299 USAPhone: +610-356-4600Fax: +610-356-4647Email: [email protected]: http://www.pmi.org
A Guide to the Project Management Body of Knowledge (PMBOK® Guide) 2000 Edition©2000 Project Management Institute, Four Campus Boulevard, Newtown Square, PA 19073-3299 USA
ited to: Old Dominion University. Downloaded on September 15,2010 at 18:15:01 UTC from IEEE Xplore. Restrictions apply.

SECTION I
THE PROJECT MANAGEMENT FRAMEWORK
1. Introduction
2. The Project Management Context
3. Project Management Processes
Authorized licensed use limited to: Old Dominion University. Downloaded on September 15,2010 at 18:15:01 UTC from IEEE Xplore. Restrictions apply.

Chapter 1
Introduction
A Guide to the Project©2000 Project Mana
Authorized licens
The Project Management Body of Knowledge (PMBOK®) is an inclusive term thatdescribes the sum of knowledge within the profession of project management. Aswith other professions such as law, medicine, and accounting, the body of knowl-edge rests with the practitioners and academics that apply and advance it. Thefull project management body of knowledge includes knowledge of proven tra-ditional practices that are widely applied, as well as knowledge of innovative andadvanced practices that have seen more limited use, and includes both publishedand unpublished material.
This chapter defines and explains several key terms and provides an overviewof the rest of the document. It includes the following major sections:
1.1 Purpose of This Guide1.2 What Is a Project?1.3 What Is Project Management?1.4 Relationship to Other Management Disciplines1.5 Related Endeavors1.1 PURPOSE OF THIS GUIDEProject management is an emerging profession. The primary purpose of this doc-ument is to identify and describe that subset of the PMBOK® that is generallyaccepted. Generally accepted means that the knowledge and practices describedare applicable to most projects most of the time, and that there is widespreadconsensus about their value and usefulness. Generally accepted does not meanthat the knowledge and practices described are or should be applied uniformlyon all projects; the project management team is always responsible for deter-mining what is appropriate for any given project.
This document is also intended to provide a common lexicon within the pro-fession and practice for talking and writing about project management. Projectmanagement is a relatively young profession, and while there is substantial com-monality around what is done, there is relatively little commonality in the termsused.
This document provides a basic reference for anyone interested in the profes-sion of project management. This includes, but is not limited to:
Management Body of Knowledge (PMBOK® Guide) 2000 Editiongement Institute, Four Campus Boulevard, Newtown Square, PA 19073-3299 USA 3
ed use limited to: Old Dominion University. Downloaded on September 15,2010 at 18:15:01 UTC from IEEE Xplore. Restrictions apply.

Chapter 1—Introduction
4
1.2
|1.
2.3
Authorized licensed u
■ Senior executives.■ Managers of project managers.■ Project managers and other project team members.■ Project customers and other project stakeholders.■ Functional managers with employees assigned to project teams.■ Educators teaching project management and related subjects.■ Consultants and other specialists in project management and related fields.■ Trainers developing project management educational programs.
As a basic reference, this document is neither comprehensive nor all inclusive.Appendix E discusses application area extensions while Appendix F lists sourcesof further information on project management.
This document is also used by the Project Management Institute as a basic ref-erence about project management knowledge and practices for its professionaldevelopment programs including:■ Certification of Project Management Professionals (PMP®).■ Accreditation of educational programs in project management.
1.2 WHAT IS A PROJECT?Organizations perform work. Work generally involves either operations or proj-ects, although the two may overlap. Operations and projects share many charac-teristics; for example, they are:■ Performed by people.■ Constrained by limited resources.■ Planned, executed, and controlled.
Projects are often implemented as a means of achieving an organization’sstrategic plan. Operations and projects differ primarily in that operations areongoing and repetitive while projects are temporary and unique. A project canthus be defined in terms of its distinctive characteristics—a project is a temporaryendeavor undertaken to create a unique product or service. Temporary means thatevery project has a definite beginning and a definite end. Unique means that theproduct or service is different in some distinguishing way from all other productsor services. For many organizations, projects are a means to respond to thoserequests that cannot be addressed within the organization’s normal operationallimits.
Projects are undertaken at all levels of the organization. They may involve asingle person or many thousands. Their duration ranges from a few weeks to morethan five years. Projects may involve a single unit of one organization or may crossorganizational boundaries, as in joint ventures and partnering. Projects are criticalto the realization of the performing organization’s business strategy because proj-ects are a means by which strategy is implemented. Examples of projects include:■ Developing a new product or service.■ Effecting a change in structure, staffing, or style of an organization.■ Designing a new transportation vehicle.■ Developing or acquiring a new or modified information system.■ Constructing a building or facility.■ Building a water system for a community in a developing country.■ Running a campaign for political office.■ Implementing a new business procedure or process.
A Guide to the Project Management Body of Knowledge (PMBOK® Guide) 2000 Edition©2000 Project Management Institute, Four Campus Boulevard, Newtown Square, PA 19073-3299 USA
se limited to: Old Dominion University. Downloaded on September 15,2010 at 18:15:01 UTC from IEEE Xplore. Restrictions apply.

Chapter 1—Introduction
A Guide to the Proje©2000 Project Man
Authorized licen
1.2.1 TemporaryTemporary means that every project has a definite beginning and a definite end.The end is reached when the project’s objectives have been achieved, or whenit becomes clear that the project objectives will not or cannot be met, or the needfor the project no longer exists and the project is terminated. Temporary does notnecessarily mean short in duration; many projects last for several years. In everycase, however, the duration of a project is finite; projects are not ongoing efforts.
In addition, temporary does not generally apply to the product or service cre-ated by the project. Projects may often have intended and unintended social, eco-nomic, and environmental impacts that far outlast the projects themselves. Mostprojects are undertaken to create a lasting result. For example, a project to erecta national monument will create a result expected to last centuries. A series ofprojects and/or complementary projects in parallel may be required to achieve astrategic objective.
The objectives of projects and operations are fundamentally different. Theobjective of a project is to attain the objective and close the project. The objectiveof an ongoing nonprojectized operation is normally to sustain the business. Proj-ects are fundamentally different because the project ceases when its declaredobjectives have been attained, while nonproject undertakings adopt a new set ofobjectives and continue to work.
The temporary nature of projects may apply to other aspects of the endeavoras well:■ The opportunity or market window is usually temporary—most projects have
a limited time frame in which to produce their product or service.■ The project team, as a team, seldom outlives the project—most projects are
performed by a team created for the sole purpose of performing the project,and the team is disbanded when the project is complete.
1.2.2 Unique Product, Service, or ResultProjects involve doing something that has not been done before and which is,therefore, unique. A product or service may be unique even if the category towhich it belongs is large. For example, many thousands of office buildings havebeen developed, but each individual facility is unique—different owner, differentdesign, different location, different contractors, and so on. The presence of repet-itive elements does not change the fundamental uniqueness of the project work.For example:■ A project to develop a new commercial airliner may require multiple proto-
types.■ A project to bring a new drug to market may require thousands of doses of the
drug to support clinical trials.■ A real estate development project may include hundreds of individual units.■ A development project (e.g., water and sanitation) may be implemented in
five geographic areas.
1.2.3 Progressive ElaborationProgressive elaboration is a characteristic of projects that integrates the conceptsof temporary and unique. Because the product of each project is unique, the char-acteristics that distinguish the product or service must be progressively elaborated.Progressively means “proceeding in steps; continuing steadily by increments,”
ct Management Body of Knowledge (PMBOK® Guide) 2000 Editionagement Institute, Four Campus Boulevard, Newtown Square, PA 19073-3299 USA 5
sed use limited to: Old Dominion University. Downloaded on September 15,2010 at 18:15:01 UTC from IEEE Xplore. Restrictions apply.

Chapter 1—Introduction
6
1.3
|1.
3.2
Authorized licensed use l
while elaborated means “worked out with care and detail; developed thoroughly”(1). These distinguishing characteristics will be broadly defined early in theproject, and will be made more explicit and detailed as the project team developsa better and more complete understanding of the product.
Progressive elaboration of product characteristics must be carefully coordinatedwith proper project scope definition, particularly if the project is performed undercontract. When properly defined, the scope of the project—the work to be done—should remain constant even as the product characteristics are progressively elab-orated. The relationship between product scope and project scope is discussedfurther in the introduction to Chapter 5.
The following two examples illustrate progressive elaboration in two differentapplication areas.
Example 1. Development of a chemical processing plant begins with processengineering to define the characteristics of the process. These characteristics areused to design the major processing units. This information becomes the basis forengineering design, which defines both the detail plant layout and the mechanicalcharacteristics of the process units and ancillary facilities. All of these result indesign drawings that are elaborated to produce fabrication drawings (constructionisometrics). During construction, interpretations and adaptations are made asneeded and subject to proper approval. This further elaboration of the character-istics is captured by as-built drawings. During test and turnover, further elaborationof the characteristics is often made in the form of final operating adjustments.
Example 2. The product of an economic development project may initially bedefined as: “Improve the quality of life of the lowest income residents of commu-nity X.” As the project proceeds, the products may be described more specificallyas, for example: “Provide access to food and water to 500 low income residents incommunity X.” The next round of progressive elaboration might focus exclusivelyon increasing agriculture production and marketing, with provision of waterdeemed to be secondary priority to be initiated once the agriculture component iswell under way.
1.3 WHAT IS PROJECT MANAGEMENT?Project management is the application of knowledge, skills, tools, and techniquesto project activities to meet project requirements. Project management is accom-plished through the use of the processes such as: initiating, planning, executing,controlling, and closing. The project team manages the work of the projects, andthe work typically involves:■ Competing demands for: scope, time, cost, risk, and quality.■ Stakeholders with differing needs and expectations.■ Identified requirements.
It is important to note that many of the processes within project managementare iterative in nature. This is in part due to the existence of and the necessity forprogressive elaboration in a project throughout the project life cycle; i.e., themore you know about your project, the better you are able to manage it.
The term project management is sometimes used to describe an organizationalapproach to the management of ongoing operations. This approach, more prop-erly called management by projects, treats many aspects of ongoing operationsas projects to apply project management techniques to them. Although an
A Guide to the Project Management Body of Knowledge (PMBOK® Guide) 2000 Edition©2000 Project Management Institute, Four Campus Boulevard, Newtown Square, PA 19073-3299 USA
imited to: Old Dominion University. Downloaded on September 15,2010 at 18:15:01 UTC from IEEE Xplore. Restrictions apply.

Chapter 1—Introduction
A Guide to the Project Mana©2000 Project Manageme
Authorized licensed us
understanding of project management is critical to an organization that is man-aging by projects, a detailed discussion of the approach itself is outside the scopeof this document.
Knowledge about project management can be organized in many ways. Thisdocument has two major sections and twelve chapters, as described below.
1.3.1 The Project Management FrameworkSection I, The Project Management Framework, provides a basic structure forunderstanding project management.
Chapter 1, Introduction, defines key terms and provides an overview of therest of the document.
Chapter 2, The Project Management Context, describes the environment inwhich projects operate. The project management team must understand thisbroader context—managing the day-to-day activities of the project is necessary forsuccess but not sufficient.
Chapter 3, Project Management Processes, describes a generalized view ofhow the various project management processes commonly interact. Understandingthese interactions is essential to understanding the material presented in Chapters4 through 12.
1.3.2 The Project Management Knowledge AreasSection II, The Project Management Knowledge Areas, describes project man-agement knowledge and practice in terms of their component processes. Theseprocesses have been organized into nine knowledge areas, as described belowand as illustrated in Figure 1-1.
Chapter 4, Project Integration Management, describes the processes requiredto ensure that the various elements of the project are properly coordinated. It con-sists of project plan development, project plan execution, and integrated changecontrol.
Chapter 5, Project Scope Management, describes the processes required toensure that the project includes all the work required, and only the workrequired, to complete the project successfully. It consists of initiation, scope plan-ning, scope definition, scope verification, and scope change control.
Chapter 6, Project Time Management, describes the processes required toensure timely completion of the project. It consists of activity definition, activitysequencing, activity duration estimating, schedule development, and schedulecontrol.
Chapter 7, Project Cost Management, describes the processes required toensure that the project is completed within the approved budget. It consists ofresource planning, cost estimating, cost budgeting, and cost control.
Chapter 8, Project Quality Management, describes the processes required toensure that the project will satisfy the needs for which it was undertaken. It con-sists of quality planning, quality assurance, and quality control.
Chapter 9, Project Human Resource Management, describes the processesrequired to make the most effective use of the people involved with the project.It consists of organizational planning, staff acquisition, and team development.
Chapter 10, Project Communications Management, describes the processesrequired to ensure timely and appropriate generation, collection, dissemination,
gement Body of Knowledge (PMBOK® Guide) 2000 Editionnt Institute, Four Campus Boulevard, Newtown Square, PA 19073-3299 USA 7
e limited to: Old Dominion University. Downloaded on September 15,2010 at 18:15:01 UTC from IEEE Xplore. Restrictions apply.

Chapter 1—Introduction
8
Figure 1–1. Overview of Project Management Knowledge Areas and Project Management Processes
PROJECTMANAGEMENT
Project Plan DevelopmentProject Plan ExecutionIntegrated Change Control
4.
4.14.24.3
Project IntegrationManagement
InitiationScope PlanningScope DefinitionScope VerificationScope Change Control
5.
5.15.25.35.45.5
Project ScopeManagement
Activity DefinitionActivity SequencingActivity Duration EstimatingSchedule DevelopmentSchedule Control
6.
6.16.26.36.46.5
Project TimeManagement
Resource PlanningCost EstimatingCost BudgetingCost Control
7.
7.17.27.37.4
Project CostManagement
Communications PlanningInformation DistributionPerformance ReportingAdministrative Closure
10.
10.110.210.310.4
Project CommunicationsManagement
Quality PlanningQuality AssuranceQuality Control
8.
8.18.28.3
Project QualityManagement
Risk Management PlanningRisk IdentificationQualitative Risk AnalysisQuantitative Risk AnalysisRisk Response PlanningRisk Monitoring and Control
11.
11.111.211.311.411.511.6
Project RiskManagement
Organizational PlanningStaff AcquisitionTeam Development
9.
9.19.29.3
Project HumanResource Management
Procurement PlanningSolicitation PlanningSolicitationSource SelectionContract AdministrationContract Closeout
12.
12.112.212.312.412.512.6
Project ProcurementManagement
Figu
re 1
–1|
1.4
Authorized licensed use limited
storage, and ultimate disposition of project information. It consists of commu-nications planning, information distribution, performance reporting, and admin-istrative closure.
Chapter 11, Project Risk Management, describes the processes concernedwith identifying, analyzing, and responding to project risk. It consists of risk man-agement planning, risk identification, qualitative risk analysis, quantitative riskanalysis, risk response planning, and risk monitoring and control.
Chapter 12, Project Procurement Management, describes the processesrequired to acquire goods and services from outside the performing organization.It consists of procurement planning, solicitation planning, solicitation, source selec-tion, contract administration, and contract closeout.
A Guide to the Project Management Body of Knowledge (PMBOK® Guide) 2000 Edition©2000 Project Management Institute, Four Campus Boulevard, Newtown Square, PA 19073-3299 USA
to: Old Dominion University. Downloaded on September 15,2010 at 18:15:01 UTC from IEEE Xplore. Restrictions apply.

Chapter 1—Introduction
A Guide to the Project Mana©2000 Project Manageme
Figure 1–2. Relationship of Project Management to Other Management Disciplines
This figure is a conceptual view of these relationships.The overlaps shown are not proportional.
ApplicationArea Knowledge
and Practice
GeneralManagementKnowledge
and Practice
The ProjectManagement
Body of Knowledge
Generally AcceptedProject Management
Knowledge and Practice
Authorized licensed us
1.4 RELATIONSHIP TO OTHER MANAGEMENT DISCIPLINESMuch of the knowledge needed to manage projects is unique to project manage-ment (e.g., critical path analysis and work breakdown structures). However, thePMBOK® does overlap other management disciplines, as illustrated in Figure 1-2.
General management encompasses planning, organizing, staffing, executing, andcontrolling the operations of an ongoing enterprise. General management alsoincludes supporting disciplines such as law, strategic planning, logistics, and humanresources management. The PMBOK® overlaps or modifies general managementin many areas—organizational behavior, financial forecasting, and planning tech-niques, to name just a few. Section 2.4 provides a more detailed discussion of gen-eral management.
Application areas are categories of projects that have common elements signif-icant in such projects, but are not needed or present in all projects. Applicationareas are usually defined in terms of:■ Functional departments and supporting disciplines, such as legal, production
and inventory management, marketing, logistics and personnel.■ Technical elements, such as software development, pharmaceuticals, water
and sanitation engineering, or construction engineering.■ Management specializations, such as government contracting, community
development, or new product development.■ Industry groups, such as automotive, chemicals, agriculture, or financial services.
Appendix E includes a more detailed discussion of project management appli-cation areas.
gement Body of Knowledge (PMBOK® Guide) 2000 Editionnt Institute, Four Campus Boulevard, Newtown Square, PA 19073-3299 USA 9
e limited to: Old Dominion University. Downloaded on September 15,2010 at 18:15:01 UTC from IEEE Xplore. Restrictions apply.

Chapter 1—Introduction
10
1.5
|2.
1.1
Authorized licensed use
1.5 RELATED ENDEAVORSCertain types of endeavors are closely related to projects. There is often a hier-archy of strategic plan, program, project, and subproject, in which a programconsisting of several associated projects will contribute to the achievement of astrategic plan. These related undertakings are described below.
Programs. A program is a group of projects managed in a coordinated way toobtain benefits not available from managing them individually (2). Many pro-grams also include elements of ongoing operations. For example:■ The “XYZ airplane program” includes both the project or projects to design
and develop the aircraft, as well as the ongoing manufacturing and support ofthat craft in the field.
■ Many electronics firms have program managers who are responsible for bothindividual product releases (projects) and the coordination of multiple releasesover time (an ongoing operation).Programs may also involve a series of repetitive or cyclical undertakings; for
example:■ Utilities often speak of an annual “construction program,” a regular, ongoing
operation that involves many projects.■ Many nonprofit organizations have a “fundraising program,” an ongoing effort
to obtain financial support that often involves a series of discrete projects,such as a membership drive or an auction.
■ Publishing a newspaper or magazine is also a program—the periodical itselfis an ongoing effort, but each individual issue is a project.In some application areas, program management and project management are
treated as synonyms; in others, project management is a subset of program man-agement. This diversity of meaning makes it imperative that any discussion ofprogram management versus project management be preceded by agreement ona clear and consistent definition of each term.
Subprojects. Projects are frequently divided into more manageable compo-nents or subprojects. Subprojects are often contracted to an external enterprise orto another functional unit in the performing organization. Examples include:■ Subprojects based on the project process, such as a single phase.■ Subprojects according to human resource skill requirements, such as the
installation of plumbing or electrical fixtures on a construction project.■ Subprojects involving technology, such as automated testing of computer pro-
grams on a software development project.Subprojects are typically referred to as projects and managed as such.Project Portfolio Management. Project portfolio management refers to the
selection and support of projects or program investments. These investments inprojects and programs are guided by the organization’s strategic plan and avail-able resources.
A Guide to the Project Management Body of Knowledge (PMBOK® Guide) 2000 Edition©2000 Project Management Institute, Four Campus Boulevard, Newtown Square, PA 19073-3299 USA
limited to: Old Dominion University. Downloaded on September 15,2010 at 18:15:01 UTC from IEEE Xplore. Restrictions apply.

Chapter 2
The Project Management Context
A Guide to the Project Mana©2000 Project Manageme
Authorized licensed us
Projects and project management operate in an environment broader than that ofthe project itself. The project management team must understand this broadercontext—managing the day-to-day activities of the project is necessary for successbut not sufficient. This chapter describes key aspects of the project managementcontext not covered elsewhere in this document. The topics included here are:
2.1 Project Phases and the Project Life Cycle2.2 Project Stakeholders2.3 Organizational Influences2.4 Key General Management Skills2.5 Social-Economic-Environmental Influences2.1 PROJECT PHASES AND THE PROJECT LIFE CYCLEBecause projects are unique undertakings, they involve a degree of uncertainty.Organizations performing projects will usually divide each project into severalproject phases to improve management control and provide for links to theongoing operations of the performing organization. Collectively, the projectphases are known as the project life cycle.
2.1.1 Characteristics of Project PhasesEach project phase is marked by completion of one or more deliverables. A deliv-erable is a tangible, verifiable work product such as a feasibility study, a detaildesign, or a working prototype. The deliverables, and hence the phases, are partof a generally sequential logic designed to ensure proper definition of the productof the project.
The conclusion of a project phase is generally marked by a review of both keydeliverables and project performance to date, to a) determine if the project shouldcontinue into its next phase and b) detect and correct errors cost effectively. Thesephase-end reviews are often called phase exits, stage gates, or kill points.
gement Body of Knowledge (PMBOK® Guide) 2000 Editionnt Institute, Four Campus Boulevard, Newtown Square, PA 19073-3299 USA 11
e limited to: Old Dominion University. Downloaded on September 15,2010 at 18:15:01 UTC from IEEE Xplore. Restrictions apply.
Chapter 2—The Project Management Context
12
2.1.
2|
2.1.
3
Authorized licensed u
Each project phase normally includes a set of defined deliverables designed toestablish the desired level of management control. The majority of these itemsare related to the primary phase deliverable, and the phases typically take theirnames from these items: requirements, design, build, test, startup, turnover, andothers, as appropriate. Several representative project life cycles are described inSection 2.1.3.
2.1.2 Characteristics of the Project Life CycleThe project life cycle serves to define the beginning and the end of a project. Forexample, when an organization identifies an opportunity to which it would liketo respond, it will often authorize a needs assessment and/or a feasibility studyto decide if it should undertake a project. The project life-cycle definition willdetermine whether the feasibility study is treated as the first project phase or asa separate, standalone project.
The project life-cycle definition will also determine which transitional actionsat the beginning and the end of the project are included and which are not. Inthis manner, the project life-cycle definition can be used to link the project to theongoing operations of the performing organization.
The phase sequence defined by most project life cycles generally involves someform of technology transfer or handoff such as requirements to design, construc-tion to operations, or design to manufacturing. Deliverables from the precedingphase are usually approved before work starts on the next phase. However, a sub-sequent phase is sometimes begun prior to approval of the previous phase deliv-erables when the risks involved are deemed acceptable. This practice ofoverlapping phases is often called fast tracking.
Project life cycles generally define:■ What technical work should be done in each phase (e.g., is the work of the
architect part of the definition phase or part of the execution phase?).■ Who should be involved in each phase (e.g., implementers who need to be
involved with requirements and design).Project life-cycle descriptions may be very general or very detailed. Highly
detailed descriptions may have numerous forms, charts, and checklists to providestructure and consistency. Such detailed approaches are often called project man-agement methodologies.
Most project life-cycle descriptions share a number of common characteristics:■ Cost and staffing levels are low at the start, higher toward the end, and drop
rapidly as the project draws to a conclusion. This pattern is illustrated inFigure 2-1.
■ The probability of successfully completing the project is lowest, and hence riskand uncertainty are highest, at the start of the project. The probability of suc-cessful completion generally gets progressively higher as the project continues.
■ The ability of the stakeholders to influence the final characteristics of theproject’s product and the final cost of the project is highest at the start andgets progressively lower as the project continues. A major contributor to thisphenomenon is that the cost of changes and error correction generallyincreases as the project continues.Care should be taken to distinguish the project life cycle from the product life
cycle. For example, a project undertaken to bring a new desktop computer tomarket is but one phase or stage of the product life cycle.
A Guide to the Project Management Body of Knowledge (PMBOK® Guide) 2000 Edition©2000 Project Management Institute, Four Campus Boulevard, Newtown Square, PA 19073-3299 USA
se limited to: Old Dominion University. Downloaded on September 15,2010 at 18:15:01 UTC from IEEE Xplore. Restrictions apply.

Chapter 2—The Project Management Context
A Guide to the Project Mana©2000 Project Managemen
Figure 2–1. Sample Generic Life Cycle
Time
InitialPhase
FinishStart
Intermediate Phases(one or more)
FinalPhase
Cost andStaffing
Level
Authorized licensed us
Although many project life cycles have similar phase names with similar deliv-erables required, few are identical. Most have four or five phases, but some havenine or more. Even within a single application area, there can be significant vari-ations—one organization’s software development life cycle may have a singledesign phase while another’s has separate phases for functional and detail design.
Subprojects within projects may also have distinct project life cycles. Forexample, an architectural firm hired to design a new office building is firstinvolved in the owner’s definition phase when doing the design, and in theowner’s implementation phase when supporting the construction effort. Thearchitect’s design project, however, will have its own series of phases from con-ceptual development through definition and implementation to closure. Thearchitect may even treat designing the facility and supporting the construction asseparate projects with their own distinct phases.
2.1.3 Representative Project Life CyclesThe following project life cycles have been chosen to illustrate the diversity ofapproaches in use. The examples shown are typical; they are neither recom-mended nor preferred. In each case, the phase names and major deliverables arethose described by the author for each of the figures.
Defense acquisition. The United States Department of Defense Instruction5000.2 in Final Coordination Draft, April 2000, describes a series of acquisitionmilestones and phases as illustrated in Figure 2-2.■ Concept and technology development—paper studies of alternative concepts
for meeting a mission need; development of subsystems/components and con-cept/technology demonstration of new system concepts. Ends with selectionof a system architecture and a mature technology to be used.
■ System development and demonstration—system integration; risk reduction;demonstration of engineering development models; development and earlyoperational test and evaluation. Ends with system demonstration in an oper-ational environment.
■ Production and deployment—low rate initial production (LRIP); completedevelopment of manufacturing capability; phase overlaps with ongoing oper-ations and support.
gement Body of Knowledge (PMBOK® Guide) 2000 Editiont Institute, Four Campus Boulevard, Newtown Square, PA 19073-3299 USA 13
e limited to: Old Dominion University. Downloaded on September 15,2010 at 18:15:01 UTC from IEEE Xplore. Restrictions apply.

Chapter 2—The Project Management Context
14
Figure 2–2. Representative Life Cycle for Defense Acquisition, per US DODI 5000.2 (Final Coordination Draft, April 2000)
System Developmentand Demonstration Support
Technology Opportunities and User Needs
A B C
Pre-SystemsAcquisition
Systems Acquisition(Engineering Development, Demonstration,
LRIP, and Production)
Sustainment andMaintenance
MNS ORDAll validated by JROC
Relationship to Requirements Process
IOC
Single Step orEvolution to Full
Capacity
Process entry at Milestones A, B,or C (or within phases)Program outyear funding when it makessense, but no later than Milestone B
•
•
Concept andTechnology
Development
Production andDeployment
Figu
re 2
–2|
Figu
re 2
–3
Authorized licensed use limited
■ Support—this phase is part of the product life cycle, but is really ongoing man-agement. Various projects may be conducted during this phase to improvecapability, correct defects, etc.Construction. Adapted from Morris (1), describes a construction project life
cycle, as illustrated in Figure 2-3.■ Feasibility—project formulation, feasibility studies, and strategy design and
approval. A go/no-go decision is made at the end of this phase.■ Planning and design—base design, cost and schedule, contract terms and con-
ditions, and detailed planning. Major contracts are let at the end of this phase.■ Construction—manufacturing, delivery, civil works, installation, and testing.
The facility is substantially complete at the end of this phase.■ Turnover and startup—final testing and maintenance. The facility is in full
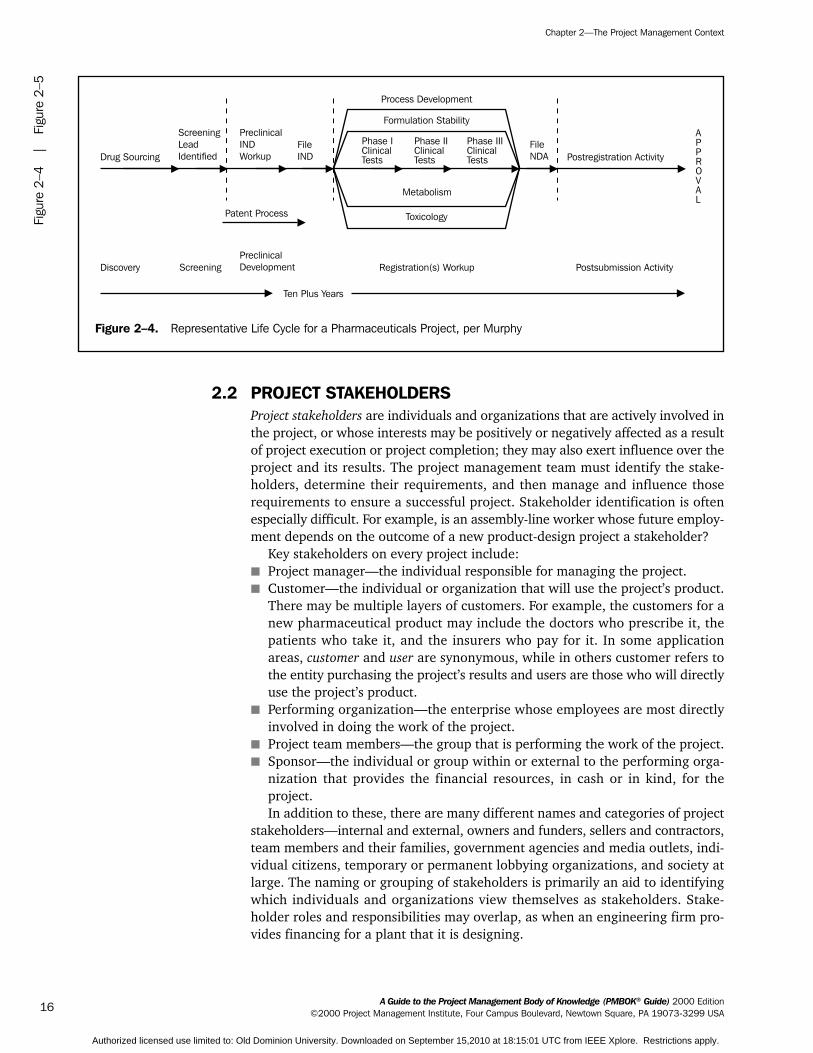
operation at the end of this phase.Pharmaceuticals. Murphy (2) describes a project life cycle for pharmaceutical
new product development in the United States, as illustrated in Figure 2-4.■ Discovery and screening—includes basic and applied research to identify can-
didates for preclinical testing.■ Preclinical development—includes laboratory and animal testing to determine
safety and efficacy, as well as preparation and filing of an Investigational NewDrug (IND) application.
■ Registration(s) workup—includes Clinical Phase I, II, and III tests, as well aspreparation and filing of a New Drug Application (NDA).
■ Postsubmission activity—includes additional work as required to support Foodand Drug Administration review of the NDA.
A Guide to the Project Management Body of Knowledge (PMBOK® Guide) 2000 Edition©2000 Project Management Institute, Four Campus Boulevard, Newtown Square, PA 19073-3299 USA
to: Old Dominion University. Downloaded on September 15,2010 at 18:15:01 UTC from IEEE Xplore. Restrictions apply.

Chapter 2—The Project Management Context
A Guide to the Project Managemen©2000 Project Management Institu
Figure 2–3. Representative Construction Project Life Cycle, per Morris
Project“GO”
Decision
MajorContracts
Let
InstallationSubstantially
Complete
FullOperations
Perc
ent
Com
plet
e
100%
STAGE I STAGE II STAGE III STAGE IV
FEASIBILITY• Project Formulation
• Feasibility Studies• Strategy Design
and Approval
PLANNINGand DESIGN
• Base Design• Cost and Schedule
• Contract Termsand Conditions
• Detailed Planning
CONSTRUCTION• Manufacturing
• Delivery• Civil Works• Installation
• Testing
TURNOVERand STARTUP• Final Testing
• Maintenance
Life-Cycle Stage
Authorized licensed use limite
Software development. There are a number of software life-cycle models inuse such as the waterfall model. Muench, et al. (3) describe a spiral model forsoftware development with four cycles and four quadrants, as illustrated inFigure 2-5.■ Proof-of-concept cycle—capture business requirements, define goals for proof
of concept, produce conceptual system design and logic design, and constructthe proof of concept, produce acceptance test plans, conduct risk analysis, andmake recommendations.
■ First-build cycle—derive system requirements, define goals for first build, pro-duce logical system design, design and construct the first build, producesystem test plans, evaluate the first build, and make recommendations.
■ Second-build cycle—derive subsystem requirements, define goals for secondbuild, produce physical design, construct the second build, produce subsystemtest plans, evaluate the second build, and make recommendations.
■ Final cycle—complete unit requirements and final design, construct finalbuild, and perform unit, subsystem, system, and acceptance tests.
t Body of Knowledge (PMBOK® Guide) 2000 Editionte, Four Campus Boulevard, Newtown Square, PA 19073-3299 USA 15
d to: Old Dominion University. Downloaded on September 15,2010 at 18:15:01 UTC from IEEE Xplore. Restrictions apply.
Chapter 2—The Project Management Context
16
Figure 2–4. Representative Life Cycle for a Pharmaceuticals Project, per Murphy
Drug Sourcing
Discovery ScreeningPreclinicalDevelopment Registration(s) Workup Postsubmission Activity
Patent Process
ScreeningLeadIdentified
PreclinicalINDWorkup
FileIND
FileNDA Postregistration Activity
Phase IClinicalTests
Phase IIClinicalTests
Phase IIIClinicalTests
APPROVAL
Formulation Stability
Process Development
Metabolism
Toxicology
Ten Plus Years
Figu
re 2
–4|
Figu
re 2
–5
Authorized licensed us
2.2 PROJECT STAKEHOLDERSProject stakeholders are individuals and organizations that are actively involved inthe project, or whose interests may be positively or negatively affected as a resultof project execution or project completion; they may also exert influence over theproject and its results. The project management team must identify the stake-holders, determine their requirements, and then manage and influence thoserequirements to ensure a successful project. Stakeholder identification is oftenespecially difficult. For example, is an assembly-line worker whose future employ-ment depends on the outcome of a new product-design project a stakeholder?
Key stakeholders on every project include:■ Project manager—the individual responsible for managing the project.■ Customer—the individual or organization that will use the project’s product.
There may be multiple layers of customers. For example, the customers for anew pharmaceutical product may include the doctors who prescribe it, thepatients who take it, and the insurers who pay for it. In some applicationareas, customer and user are synonymous, while in others customer refers tothe entity purchasing the project’s results and users are those who will directlyuse the project’s product.
■ Performing organization—the enterprise whose employees are most directlyinvolved in doing the work of the project.
■ Project team members—the group that is performing the work of the project.■ Sponsor—the individual or group within or external to the performing orga-
nization that provides the financial resources, in cash or in kind, for theproject.In addition to these, there are many different names and categories of project
stakeholders—internal and external, owners and funders, sellers and contractors,team members and their families, government agencies and media outlets, indi-vidual citizens, temporary or permanent lobbying organizations, and society atlarge. The naming or grouping of stakeholders is primarily an aid to identifyingwhich individuals and organizations view themselves as stakeholders. Stake-holder roles and responsibilities may overlap, as when an engineering firm pro-vides financing for a plant that it is designing.
A Guide to the Project Management Body of Knowledge (PMBOK® Guide) 2000 Edition©2000 Project Management Institute, Four Campus Boulevard, Newtown Square, PA 19073-3299 USA
e limited to: Old Dominion University. Downloaded on September 15,2010 at 18:15:01 UTC from IEEE Xplore. Restrictions apply.

Chapter 2—The Project Management Context
A Guide to the Project Management Bo©2000 Project Management Institute,
Figure 2–5. Representative Software Development Life Cycle, per Muench
Construct
Evaluate Identify
Design
Test
Evaluation
Evaluation
RiskAnalysis Business
Requirements
SystemRequirements
SubsystemRequirements
UnitRequirements
ConceptualDesign
LogicalDesign
PhysicalDesign
FinalDesign
Proof ofConcept
FirstBuild
SecondBuild
FinalBuild
Deploy Operations andProduction Support
Authorized licensed use limited to
Managing stakeholder expectations may be difficult because stakeholdersoften have very different objectives that may come into conflict. For example:■ The manager of a department that has requested a new management infor-
mation system may desire low cost, the system architect may emphasize tech-nical excellence, and the programming contractor may be most interested inmaximizing its profit.
dy of Knowledge (PMBOK® Guide) 2000 Edition Four Campus Boulevard, Newtown Square, PA 19073-3299 USA 17
: Old Dominion University. Downloaded on September 15,2010 at 18:15:01 UTC from IEEE Xplore. Restrictions apply.

Chapter 2—The Project Management Context
18
2.3
|2.
3.3
Authorized licensed use
■ The vice president of research at an electronics firm may define new productsuccess as state-of-the-art technology, the vice president of manufacturing maydefine it as world-class practices, and the vice president of marketing may beprimarily concerned with the number of new features.
■ The owner of a real estate development project may be focused on timely per-formance, the local governing body may desire to maximize tax revenue, anenvironmental group may wish to minimize adverse environmental impacts,and nearby residents may hope to relocate the project.In general, differences between or among stakeholders should be resolved in
favor of the customer. This does not, however, mean that the needs and expec-tations of other stakeholders can or should be disregarded. Finding appropriateresolutions to such differences can be one of the major challenges of projectmanagement.
2.3 ORGANIZATIONAL INFLUENCESProjects are typically part of an organization larger than the project—corpora-tions, government agencies, health-care institutions, international bodies, pro-fessional associations, and others. Even when the project is the organization(joint ventures, partnering), the project will still be influenced by the organiza-tion or organizations that set it up. The maturity of the organization with respectto its project management systems, culture, style, organizational structure, andproject management office can also influence the project. The following sectionsdescribe key aspects of these larger organizational structures that are likely toinfluence the project.
2.3.1 Organizational SystemsProject-based organizations are those whose operations consist primarily of proj-ects. These organizations fall into two categories:■ Organizations that derive their revenue primarily from performing projects for
others—architectural firms, engineering firms, consultants, construction con-tractors, government contractors, nongovernmental organizations, etc.
■ Organizations that have adopted management by projects (see Section 1.3).These organizations tend to have management systems in place to facilitate
project management. For example, their financial systems are often specificallydesigned for accounting, tracking, and reporting on multiple simultaneousprojects.
Nonproject-based organizations often lack management systems designed tosupport project needs efficiently and effectively. The absence of project-orientedsystems usually makes project management more difficult. In some cases, non-project-based organizations will have departments or other subunits that operateas project-based organizations with systems to match.
The project management team should be acutely aware of how the organiza-tion’s systems affect the project. For example, if the organization rewards its func-tional managers for charging staff time to projects, then the project managementteam may need to implement controls to ensure that assigned staff members arebeing used effectively on the project.
A Guide to the Project Management Body of Knowledge (PMBOK® Guide) 2000 Edition©2000 Project Management Institute, Four Campus Boulevard, Newtown Square, PA 19073-3299 USA
limited to: Old Dominion University. Downloaded on September 15,2010 at 18:15:01 UTC from IEEE Xplore. Restrictions apply.

Chapter 2—The Project Management Context
A Guide to the Project M©2000 Project Manage
Figure 2–6. Organizational Structure Influences on Projects
Project Manager’sAuthority
Percent of PerformingOrganization’s Personnel AssignedFull Time to Project Work
Common Titles for Project Manager’s Role
Project ManagementAdministrative Staff
Functional
Little or None
VirtuallyNone
ProjectCoordinator/
Project Leader
ProjectCoordinator/
Project Leader
ProjectManager/
Project Officer
ProjectManager/
Program Manager
ProjectManager/
Program Manager
Matrix
Weak Matrix Balanced Matrix Strong MatrixProjectized
Limited
0 – 25%
Project Manager’s Role
Part-time Part-time Part-time Full-time Full-time
Low toModerate
Moderateto High
High toAlmost Total
15 –60% 50 – 95% 85–100%
ProjectCharacteristics
OrganizationStructure
Part-time Part-time Full-time Full-time Full-time
Authorized licensed
2.3.2 Organizational Cultures and StylesMost organizations have developed unique and describable cultures. These cul-tures are reflected in their shared values, norms, beliefs, and expectations; intheir policies and procedures; in their view of authority relationships; and innumerous other factors. Organizational cultures often have a direct influence onthe project. For example:■ A team proposing an unusual or high-risk approach is more likely to secure
approval in an aggressive or entrepreneurial organization.■ A project manager with a highly participative style is apt to encounter prob-
lems in a rigidly hierarchical organization, while a project manager with anauthoritarian style will be equally challenged in a participative organization.
2.3.3 Organizational StructureThe structure of the performing organization often constrains the availability ofor terms under which resources become available to the project. Organizationalstructures can be characterized as spanning a spectrum from functional to projec-tized, with a variety of matrix structures in between. Figure 2-6 shows key project-related characteristics of the major types of enterprise organizational structures.Project organization is discussed in Section 9.1, Organizational Planning.
The classic functional organization, shown in Figure 2-7, is a hierarchy whereeach employee has one clear superior. Staff members are grouped by specialty, suchas production, marketing, engineering, and accounting at the top level, with engi-neering further subdivided into functional organizations that support the businessof the larger organization (e.g., mechanical and electrical). Functional organiza-tions still have projects, but the perceived scope of the project is limited to theboundaries of the function: the engineering department in a functional organiza-tion will do its work independent of the manufacturing or marketing departments.
anagement Body of Knowledge (PMBOK® Guide) 2000 Editionment Institute, Four Campus Boulevard, Newtown Square, PA 19073-3299 USA 19
use limited to: Old Dominion University. Downloaded on September 15,2010 at 18:15:01 UTC from IEEE Xplore. Restrictions apply.

Chapter 2—The Project Management Context
20
Figure 2–7. Functional Organization
(Black boxes represent staff engaged in project activities.)
ChiefExecutive
ProjectCoordination
FunctionalManager
Staff
Staff
Staff
FunctionalManager
Staff
Staff
Staff
FunctionalManager
Staff
Staff
Staff
Figu
re 2
–7|
2.4
Authorized licensed use limited
For example, when a new product development is undertaken in a purely func-tional organization, the design phase is often called a design project and includesonly engineering department staff. If questions about manufacturing arise, they arepassed up the hierarchy to the department head, who consults with the head of themanufacturing department. The engineering department head then passes theanswer back down the hierarchy to the engineering project manager.
At the opposite end of the spectrum is the projectized organization, shown inFigure 2-8. In a projectized organization, team members are often collocated.Most of the organization’s resources are involved in project work, and projectmanagers have a great deal of independence and authority. Projectized organi-zations often have organizational units called departments, but these groupseither report directly to the project manager or provide support services to thevarious projects.
Matrix organizations, as shown in Figures 2-9 through 2-11, are a blend offunctional and projectized characteristics. Weak matrices maintain many of thecharacteristics of a functional organization, and the project manager role is morethat of a coordinator or expediter than that of a manager. In similar fashion,strong matrices have many of the characteristics of the projectizedorganization—full-time project managers with considerable authority and full-time project administrative staff.
Most modern organizations involve all these structures at various levels, asshown in Figure 2-12. For example, even a fundamentally functional organiza-tion may create a special project team to handle a critical project. Such a teammay have many of the characteristics of a project in a projectized organization.The team may include full-time staff from different functional departments, itmay develop its own set of operating procedures, and it may operate outside thestandard, formalized reporting structure.
A Guide to the Project Management Body of Knowledge (PMBOK® Guide) 2000 Edition©2000 Project Management Institute, Four Campus Boulevard, Newtown Square, PA 19073-3299 USA
to: Old Dominion University. Downloaded on September 15,2010 at 18:15:01 UTC from IEEE Xplore. Restrictions apply.

Chapter 2—The Project Management Context
A Guide to the Project Man©2000 Project Manageme
Figure 2–8. Projectized Organization
(Black boxes represent staff engaged in project activities.)
ProjectCoordination
ProjectManager
Staff
Staff
ProjectManager
Staff
ProjectManager
Staff
Staff
Staff Staff
Staff Staff
ChiefExecutive
Authorized licensed u
2.3.4 Project OfficeThere is a range of uses for what constitutes a project office. A project office mayoperate on a continuum from providing support functions to project managers inthe form of training, software, templates, etc. to actually being responsible forthe results of the project.
2.4 KEY GENERAL MANAGEMENT SKILLSGeneral management is a broad subject dealing with every aspect of managing anongoing enterprise. Among other topics, it includes:■ Finance and accounting, sales and marketing, research and development, and
manufacturing and distribution.■ Strategic planning, tactical planning, and operational planning.■ Organizational structures, organizational behavior, personnel administration,
compensation, benefits, and career paths.■ Managing work relationships through motivation, delegation, supervision,
team building, conflict management, and other techniques.■ Managing oneself through personal time management, stress management,
and other techniques.General management skills provide much of the foundation for building
project management skills. They are often essential for the project manager. Onany given project, skill in any number of general management areas may berequired. This section describes key general management skills that are highlylikely to affect most projects and that are not covered elsewhere in this document.
agement Body of Knowledge (PMBOK® Guide) 2000 Editionnt Institute, Four Campus Boulevard, Newtown Square, PA 19073-3299 USA 21
se limited to: Old Dominion University. Downloaded on September 15,2010 at 18:15:01 UTC from IEEE Xplore. Restrictions apply.

A Guide to the Project Management Body of Knowledge (PMBOK® Guide) 2000 Edition©2000 Project Management Institute, Four Campus Boulevard, Newtown Square, PA 19073-3299 USA
Chapter 2—The Project Management Context
22
Figure 2–9. Weak Matrix Organization
(Black boxes represent staff engaged in project activities.)Project
Coordination
FunctionalManager
Staff
FunctionalManager
Staff
FunctionalManager
Staff
StaffStaff
Staff
Staff
Staff Staff
ChiefExecutive
Figure 2–10. Balanced Matrix Organization
FunctionalManager
Staff
Project Manager
FunctionalManager
Staff
FunctionalManager
Staff
StaffStaff
Staff
Staff Staff
ChiefExecutive
(Black boxes represent staff engaged in project activities.)Project
Coordination
Figu
re 2
–9|
Figu
re 2
–12
Authorized licensed use limited to: Old Dominion University. Downloaded on September 15,2010 at 18:15:01 UTC from IEEE Xplore. Restrictions apply.

Chapter 2—The Project Management Context
A Guide to the Project Management Body of Knowledge (PMBOK® Guide) 2000 Edition©2000 Project Management Institute, Four Campus Boulevard, Newtown Square, PA 19073-3299 USA 23
Figure 2–11. Strong Matrix Organization
(Black boxes represent staff engaged in project activities.)
FunctionalManager
Manager ofProject Managers
Staff
Staff
Staff
Staff
Staff
Staff
Staff
Staff
Staff
Project Manager
Project Manager
Project Manager
FunctionalManager
FunctionalManager
ChiefExecutive
ProjectCoordination
Figure 2–12. Composite Organization
(Black boxes represent staff engaged in project activities.)
Staff
Staff
Staff
FunctionalManager
Staff
Staff
Staff
FunctionalManager
Staff
Staff
Staff
FunctionalManager
Project Manager
Project Manager
Project Manager
Manager ofProject Managers
Project BCoordination
ChiefExecutive
Project ACoordination
Authorized licensed use limited to: Old Dominion University. Downloaded on September 15,2010 at 18:15:01 UTC from IEEE Xplore. Restrictions apply.

Chapter 2—The Project Management Context
24
2.4.
1|
2.4.
5
Authorized licensed
These skills are well documented in the general management literature, and theirapplication is fundamentally the same on a project.
There are also many general management skills that are relevant only on cer-tain projects or in certain application areas. For example, team member safetyis critical on virtually all construction projects and of little concern on most soft-ware development projects.
2.4.1 LeadingKotter (4) distinguishes between leading and managing while emphasizing theneed for both: one without the other is likely to produce poor results. He saysthat managing is primarily concerned with “consistently producing key resultsexpected by stakeholders,” while leading involves:■ Establishing direction—developing both a vision of the future and strategies
for producing the changes needed to achieve that vision.■ Aligning people—communicating the vision by words and deeds to all those
whose cooperation may be needed to achieve the vision.■ Motivating and inspiring—helping people energize themselves to overcome
political, bureaucratic, and resource barriers to change.On a project, particularly a larger project, the project manager is generally
expected to be the project’s leader as well. Leadership is not, however, limitedto the project manager: it may be demonstrated by many different individualsat many different times during the project. Leadership must be demonstratedat all levels of the project (project leadership, technical leadership, and teamleadership).
2.4.2 CommunicatingCommunicating involves the exchange of information. The sender is responsiblefor making the information clear, unambiguous, and complete so that thereceiver can receive it correctly. The receiver is responsible for making sure thatthe information is received in its entirety and understood correctly. Communi-cating has many dimensions:■ Written and oral, listening and speaking.■ Internal (within the project) and external (to the customer, the media, the
public, etc.).■ Formal (reports, briefings, etc.) and informal (memos, ad hoc conversations, etc.).■ Vertical (up and down the organization) and horizontal (with peers and
partner organization).The general management skill of communicating is related to, but not the
same as, Project Communications Management (described in Chapter 10). Com-municating is the broader subject and involves a substantial body of knowledgethat is not unique to the project context, for example:■ Sender-receiver models—feedback loops, barriers to communications, etc.■ Choice of media—when to communicate in writing, when to communicate
orally, when to write an informal memo, when to write a formal report, etc.
A Guide to the Project Management Body of Knowledge (PMBOK® Guide) 2000 Edition©2000 Project Management Institute, Four Campus Boulevard, Newtown Square, PA 19073-3299 USA
use limited to: Old Dominion University. Downloaded on September 15,2010 at 18:15:01 UTC from IEEE Xplore. Restrictions apply.

Chapter 2—The Project Management Context
A Guide to the Project Ma©2000 Project Managem
Authorized licensed u
■ Writing style—active versus passive voice, sentence structure, word choice, etc.■ Presentation techniques—body language, design of visual aids, etc.■ Meeting management techniques—preparing an agenda, dealing with conflict,
etc.Project Communications Management is the application of these broad con-
cepts to the specific needs of a project—for example, deciding how, when, inwhat form, and to whom to report project performance.
2.4.3 NegotiatingNegotiating involves conferring with others to come to terms with them or reachan agreement. Agreements may be negotiated directly or with assistance; medi-ation and arbitration are two types of assisted negotiation.
Negotiations occur around many issues, at many times, and at many levels ofthe project. During the course of a typical project, project staff is likely to nego-tiate for any or all of the following:■ Scope, cost, and schedule objectives.■ Changes to scope, cost, or schedule.■ Contract terms and conditions.■ Assignments.■ Resources.
2.4.4 Problem SolvingProblem solving involves a combination of problem definition and decision-making.
Problem definition requires distinguishing between causes and symptoms.Problems may be internal (a key employee is reassigned to another project) orexternal (a permit required to begin work is delayed). Problems may be technical(differences of opinion about the best way to design a product), managerial (afunctional group is not producing according to plan), or interpersonal (person-ality or style clashes).
Decision-making includes analyzing the problem to identify viable solutions, andthen making a choice from among them. Decisions can be made or obtained (fromthe customer, from the team, or from a functional manager). Once made, decisionsmust be implemented. Decisions also have a time element to them—the “right”decision may not be the “best” decision if it is made too early or too late.
2.4.5 Influencing the OrganizationInfluencing the organization involves the ability to “get things done.” It requiresan understanding of both the formal and informal structures of all the organi-zations involved—the performing organization, customer, partners, contractors,and numerous others, as appropriate. Influencing the organization also requiresan understanding of the mechanics of power and politics.
nagement Body of Knowledge (PMBOK® Guide) 2000 Editionent Institute, Four Campus Boulevard, Newtown Square, PA 19073-3299 USA 25
se limited to: Old Dominion University. Downloaded on September 15,2010 at 18:15:01 UTC from IEEE Xplore. Restrictions apply.

Chapter 2—The Project Management Context
26
2.5
|2.
5.4
Authorized licensed u
Both power and politics are used here in their positive senses. Pfeffer (5)defines power as “the potential ability to influence behavior, to change the courseof events, to overcome resistance, and to get people to do things that they wouldnot otherwise do.” In similar fashion, Eccles et al. (6) say that “politics is aboutgetting collective action from a group of people who may have quite differentinterests. It is about being willing to use conflict and disorder creatively. The neg-ative sense, of course, derives from the fact that attempts to reconcile these inter-ests result in power struggles and organizational games that can sometimes takeon a thoroughly unproductive life of their own.”
2.5 SOCIAL-ECONOMIC-ENVIRONMENTAL INFLUENCESLike general management, socioeconomic influences include a wide range of topicsand issues. The project management team must understand that current condi-tions and trends in this area may have a major effect on its project: a smallchange here can translate, usually with a time lag, into cataclysmic upheavalsin the project itself. Of the many potential socioeconomic influences, severalmajor categories that frequently affect projects are described briefly below.
2.5.1 Standards and RegulationsThe International Organization for Standardization (ISO) differentiates betweenstandards and regulations as follows (7):■ A standard is a “document approved by a recognized body, that provides, for
common and repeated use, rules, guidelines, or characteristics for products,processes or services with which compliance is not mandatory.” There arenumerous standards in use covering everything from thermal stability ofhydraulic fluids to the size of computer diskettes.
■ A regulation is a “document, which lays down product, process or service char-acteristics, including the applicable administrative provisions, with whichcompliance is mandatory.” Building codes are an example of regulations.Care must be used in discussing standards and regulations since there is a vast
gray area between the two; for example:■ Standards often begin as guidelines that describe a preferred approach, and
later, with widespread adoption, become de facto regulations (e.g., the use ofthe Critical Path Method for scheduling major construction projects).
■ Compliance may be mandated at different levels (e.g., by a governmentagency, by the management of the performing organization, or by the projectmanagement team).For many projects, standards and regulations (by whatever definition) are well
known, and project plans can reflect their effects. In other cases, the influence isunknown or uncertain and must be considered under Project Risk Management(described in Chapter 11).
A Guide to the Project Management Body of Knowledge (PMBOK® Guide) 2000 Edition©2000 Project Management Institute, Four Campus Boulevard, Newtown Square, PA 19073-3299 USA
se limited to: Old Dominion University. Downloaded on September 15,2010 at 18:15:01 UTC from IEEE Xplore. Restrictions apply.

Chapter 2—The Project Management Context
A Guide to the Project Ma©2000 Project Managem
Authorized licensed
2.5.2 InternationalizationAs more and more organizations engage in work that spans national boundaries,more and more projects span national boundaries as well. In addition to the tra-ditional concerns of scope, cost, time, and quality, the project management teammust also consider the effect of time-zone differences, national and regional hol-idays, travel requirements for face-to-face meetings, the logistics of teleconfer-encing, and often volatile political differences.
2.5.3 Cultural InfluencesCulture is the “totality of socially transmitted behavior patterns, arts, beliefs,institutions, and all other products of human work and thought” (8). Everyproject must operate within a context of one or more cultural norms. This areaof influence includes political, economic, demographic, educational, ethical,ethnic, religious, and other areas of practice, belief, and attitudes that affect theway that people and organizations interact.
2.5.4 Social-Economic-Environmental SustainabilityVirtually all projects are planned and implemented in a social, economic, andenvironmental context, and have intended and unintended positive and/or neg-ative impacts. Organizations are increasingly accountable for impacts resultingfrom a project (e.g., accidental destruction of archeological sites in a road con-struction project), as well as for the effects of a project on people, the economy,and the environment long after it has been completed (e.g., a roadway can facil-itate the access to and destruction of a once pristine environment).
nagement Body of Knowledge (PMBOK® Guide) 2000 Editionent Institute, Four Campus Boulevard, Newtown Square, PA 19073-3299 USA 27
use limited to: Old Dominion University. Downloaded on September 15,2010 at 18:15:01 UTC from IEEE Xplore. Restrictions apply.

Chapter 3
Project Management Processes
A Guide to the Project Managemen©2000 Project Management Instit
Authorized licensed use limite
Project management is an integrative endeavor—an action, or failure to takeaction, in one area will usually affect other areas. The interactions may bestraightforward and well understood, or they may be subtle and uncertain. Forexample, a scope change will almost always affect project cost, but it may or maynot affect team morale or product quality.
These interactions often require tradeoffs among project objectives—perfor-mance in one area may be enhanced only by sacrificing performance in another.The specific performance tradeoffs may vary from project to project and organi-zation to organization. Successful project management requires actively man-aging these interactions. Many project management practitioners refer to theproject triple constraint as a framework for evaluating competing demands. Theproject triple constraint is often depicted as a triangle where either the sides orcorners represent one of the parameters being managed by the project team.
To help in understanding the integrative nature of project management, andto emphasize the importance of integration, this document describes projectmanagement in terms of its component processes and their interactions. Thischapter provides an introduction to the concept of project management as anumber of interlinked processes, and thus provides an essential foundation forunderstanding the process descriptions in Chapters 4 through 12. It includes thefollowing major sections:
3.1 Project Processes3.2 Process Groups3.3 Process Interactions3.4 Customizing Process Interactions3.5 Mapping of Project Management Processes3.1 PROJECT PROCESSESProjects are composed of processes. A process is “a series of actions bringingabout a result” (1). Project processes are performed by people and generally fallinto one of two major categories:
t Body of Knowledge (PMBOK® Guide) 2000 Editionute, Four Campus Boulevard, Newtown Square, PA 19073-3299 USA 29
d to: Old Dominion University. Downloaded on September 15,2010 at 18:15:01 UTC from IEEE Xplore. Restrictions apply.

Chapter 3—Project Management Processes
30
3.2
|Fi
gure
3–3
Authorized licensed use
■ Project management processes describe, organize, and complete the work of theproject. The project management processes that are applicable to most proj-ects, most of the time, are described briefly in this chapter and in detail inChapters 4 through 12.
■ Product-oriented processes specify and create the project’s product. Product-ori-ented processes are typically defined by the project life cycle (discussed in Sec-tion 2.1) and vary by application area (discussed in Appendix E).Project management processes and product-oriented processes overlap and
interact throughout the project. For example, the scope of the project cannot bedefined in the absence of some basic understanding of how to create the product.
3.2 PROCESS GROUPSProject management processes can be organized into five groups of one or moreprocesses each:■ Initiating processes—authorizing the project or phase.■ Planning processes—defining and refining objectives and selecting the best of
the alternative courses of action to attain the objectives that the project wasundertaken to address.
■ Executing processes—coordinating people and other resources to carry out theplan.
■ Controlling processes—ensuring that project objectives are met by monitoringand measuring progress regularly to identify variances from plan so that cor-rective action can be taken when necessary.
■ Closing processes—formalizing acceptance of the project or phase and bringingit to an orderly end.The process groups are linked by the results they produce—the result or out-
come of one often becomes an input to another. Among the central processgroups, the links are iterated—planning provides executing with a documentedproject plan early on, and then provides documented updates to the plan as theproject progresses. These connections are illustrated in Figure 3-1. In addition,the project management process groups are not discrete, one-time events; theyare overlapping activities that occur at varying levels of intensity throughout eachphase of the project. Figure 3-2 illustrates how the process groups overlap andvary within a phase.
Finally, the process group interactions also cross phases such that closing onephase provides an input to initiating the next. For example, closing a designphase requires customer acceptance of the design document. Simultaneously, thedesign document defines the product description for the ensuing implementationphase. This interaction is illustrated in Figure 3-3.
Repeating the initiation processes at the start of each phase helps to keep theproject focused on the business need that it was undertaken to address. It shouldalso help ensure that the project is halted if the business need no longer exists,or if the project is unlikely to satisfy that need. Business needs are discussed inmore detail in the introduction to Section 5.1, Initiation.
It is important to note that the actual inputs and outputs of the processesdepend upon the phase in which they are carried out. Although Figure 3-3 isdrawn with discrete phases and discrete processes, in an actual project there willbe many overlaps. The planning process, for example, must not only provide details
A Guide to the Project Management Body of Knowledge (PMBOK® Guide) 2000 Edition©2000 Project Management Institute, Four Campus Boulevard, Newtown Square, PA 19073-3299 USA
limited to: Old Dominion University. Downloaded on September 15,2010 at 18:15:01 UTC from IEEE Xplore. Restrictions apply.

Chapter 3—Project Management Processes
A Guide to the Project Management Body of Knowledge (PMBOK® Guide) 2000 Edition©2000 Project Management Institute, Four Campus Boulevard, Newtown Square, PA 19073-3299 USA 31
Figure 3–1. Links among Process Groups in a Phase
(arrows represent flowof information)
ClosingProcesses
ExecutingProcesses
ControllingProcesses
PlanningProcesses
InitiatingProcesses
Figure 3–2. Overlap of Process Groups in a Phase
Levelof
Activity
ExecutingProcesses
PlanningProcesses
InitiatingProcesses
PhaseFinish
PhaseStart
Controlling Processes
Time
ClosingProcesses
Figure 3–3. Interaction between Phases
ClosingProcesses
ExecutingProcesses
ControllingProcesses
PlanningProcesses
InitiatingProcesses
ClosingProcesses
ExecutingProcesses
ControllingProcesses
PlanningProcesses
InitiatingProcesses
Design Phase
Implementation Phase
...... Subsequent
Phases
PriorPhases
Authorized licensed use limited to: Old Dominion University. Downloaded on September 15,2010 at 18:15:01 UTC from IEEE Xplore. Restrictions apply.

Chapter 3—Project Management Processes
32
Figure 3–4. Relationships among the Initiating Processes
To thePlanningProcesses(Figure 3–5)
Initiating Processes
5.1 Initiation
SCOPE
Figu
re 3
–4|
Figu
re 3
–5
Authorized licensed us
of the work to be done to bring the current phase of the project to successful com-pletion, but must also provide some preliminary description of work to be done inlater phases. This progressive detailing of the project plan is often called rollingwave planning, indicating that planning is an iterative and ongoing process.
Involving stakeholders in the project phases generally improves the probabilityof satisfying customer requirements and realizes the buy-in or shared ownershipof the project by the stakeholders, which is often critical to project success.
3.3 PROCESS INTERACTIONSWithin each process group, the individual processes are linked by their inputs andoutputs. By focusing on these links, we can describe each process in terms of its:■ Inputs—documents or documentable items that will be acted upon.■ Tools and techniques—mechanisms applied to the inputs to create the outputs.■ Outputs—documents or documentable items that are a result of the process.
The project management processes common to most projects in most appli-cation areas are listed here and described in detail in Chapters 4 through 12. Thenumbers in parentheses after the process names identify the chapter and sectionwhere each is described. The process interactions illustrated here are also typicalof most projects in most application areas. Section 3.4 discusses customizing bothprocess descriptions and interactions.
3.3.1 Initiating ProcessesFigure 3-4 illustrates the single process in this process group.■ Initiation (5.1)—authorizing the project or phase is part of project scope man-
agement.
3.3.2 Planning ProcessesPlanning is of major importance to a project because the project involves doingsomething that has not been done before. As a result, there are relatively moreprocesses in this section. However, the number of processes does not mean thatproject management is primarily planning—the amount of planning performedshould be commensurate with the scope of the project and the usefulness of theinformation developed. Planning is an ongoing effort throughout the life of theproject.
A Guide to the Project Management Body of Knowledge (PMBOK® Guide) 2000 Edition©2000 Project Management Institute, Four Campus Boulevard, Newtown Square, PA 19073-3299 USA
e limited to: Old Dominion University. Downloaded on September 15,2010 at 18:15:01 UTC from IEEE Xplore. Restrictions apply.

Chapter 3—Project Management Processes
A Guide to the Project Management©2000 Project Management Institu
Figure 3–5. Relationships among the Planning Processes
Planning Processes
To theExecutingProcesses(Figure 3-6)
From theInitiating
Processes(Figure 3-4)
From theControllingProcesses
(Figure 3-7)
Facilitating Processes
8.1Quality Planning
9.1OrganizationalPlanning
9.2Staff Acquisition
12.1ProcurementPlanning
12.2SolicitationPlanning
10.1CommunicationsPlanning
11.2Risk Identification
11.3Qualitative RiskAnalysis
11.4Quantitative RiskAnalysis
11.5Risk ResponsePlanning
Core Processes
5.2Scope Planning
6.1Activity Definition
6.2Activity Sequencing
6.4ScheduleDevelopment
5.3Scope Definition
7.1Resource Planning
6.3Activity DurationEstimating
7.3Cost Budgeting
7.2Cost Estimating
11.1Risk ManagementPlanning
4.1Project PlanDevelopment
Quality Human Resources Human Resources Procurement
Communication Risk Risk Risk Risk
Procurement
Scope Time Time Time
Scope
Cost
TimeCost
Cost
Risk
Integration
Authorized licensed use limited
The relationships among the project planning processes are shown in Figure3-5 (this chart is an explosion of the ellipse labeled “Planning Processes” inFigure 3-1). These processes are subject to frequent iterations prior to com-pleting the project plan. For example, if the initial completion date is unaccept-able, project resources, cost, or even scope may need to be redefined. In addition,planning is not an exact science—two different teams could generate very dif-ferent plans for the same project.
Core processes. Some planning processes have clear dependencies that requirethem to be performed in essentially the same order on most projects. Forexample, activities must be defined before they can be scheduled or costed. Thesecore planning processes may be iterated several times during any one phase of aproject. They include:
Body of Knowledge (PMBOK® Guide) 2000 Editionte, Four Campus Boulevard, Newtown Square, PA 19073-3299 USA 33
to: Old Dominion University. Downloaded on September 15,2010 at 18:15:01 UTC from IEEE Xplore. Restrictions apply.

Chapter 3—Project Management Processes
34
3.3.
2|
3.3.
3
Authorized licensed use limited
■ Scope Planning (5.2)—developing a written scope statement as the basis forfuture project decisions.
■ Scope Definition (5.3)—subdividing the major project deliverables into smaller,more manageable components.
■ Activity Definition (6.1)—identifying the specific activities that must be per-formed to produce the various project deliverables.
■ Activity Sequencing (6.2)—identifying and documenting interactivity depen-dencies.
■ Activity Duration Estimating (6.3)—estimating the number of work periodsthat will be needed to complete individual activities.
■ Schedule Development (6.4)—analyzing activity sequences, activity durations,and resource requirements to create the project schedule.
■ Risk Management Planning (11.1)—deciding how to approach and plan forrisk management in a project.
■ Resource Planning (7.1)—determining what resources (people, equipment,materials, etc.) and what quantities of each should be used to perform projectactivities.
■ Cost Estimating (7.2)—developing an approximation (estimate) of the costsof the resources required to complete project activities.
■ Cost Budgeting (7.3)—allocating the overall cost estimate to individual workpackages.
■ Project Plan Development (4.1)—taking the results of other planning processesand putting them into a consistent, coherent document.Facilitating processes. Interactions among the other planning processes are
more dependent on the nature of the project. For example, on some projects,there may be little or no identifiable risk until after most of the planning has beendone and the team recognizes that the cost and schedule targets are extremelyaggressive and thus involve considerable risk. Although these facilitating processesare performed intermittently and as needed during project planning, they are notoptional. They include:■ Quality Planning (8.1)—identifying which quality standards are relevant to
the project and determining how to satisfy them.■ Organizational Planning (9.1)—identifying, documenting, and assigning project
roles, responsibilities, and reporting relationships.■ Staff Acquisition (9.2)—getting the human resources needed assigned to and
working on the project.■ Communications Planning (10.1)—determining the information and commu-
nications needs of the stakeholders: who needs what information, when willthey need it, and how will it be given to them.
■ Risk Identification (11.2)—determining which risks are likely to affect theproject and documenting the characteristics of each.
■ Qualitative Risk Analysis (11.3)—performing a qualitative analysis of risksand conditions to prioritize their effects on project objectives.
■ Quantitative Risk Analysis (11.4)—measuring the probability and impact ofrisks and estimating their implications for project objectives.
■ Risk Response Planning (11.5)—developing procedures and techniques toenhance opportunities and to reduce threats to the project’s objectives from risk.
A Guide to the Project Management Body of Knowledge (PMBOK® Guide) 2000 Edition©2000 Project Management Institute, Four Campus Boulevard, Newtown Square, PA 19073-3299 USA
to: Old Dominion University. Downloaded on September 15,2010 at 18:15:01 UTC from IEEE Xplore. Restrictions apply.

Chapter 3—Project Management Processes
A Guide to the Project Man©2000 Project Manageme
Figure 3–6. Relationships among the Executing Processes
Executing Processes
To theControllingProcesses(Figure 3–7)
From thePlanning
Processes(Figure 3–5)
From theControllingProcesses
(Figure 3–7)
12.3Solicitation
Procurement
12.4Source Selection
Procurement
8.2Quality Assurance
Quality
12.5ContractAdministration
Procurement
10.2InformationDistribution
Communications
9.3Team Development
Human Resources
Facilitating Processes
4.2Project PlanExecution
Integration
Authorized licensed u
■ Procurement Planning (12.1)—determining what to procure, how much toprocure, and when.
■ Solicitation Planning (12.2)—documenting product requirements and iden-tifying potential sources.
3.3.3 Executing ProcessesThe executing processes include core processes and facilitating processes. Figure3-6 illustrates how the following core and facilitating processes interact:■ Project Plan Execution (4.2)—carrying out the project plan by performing the
activities included therein.■ Quality Assurance (8.2)—evaluating overall project performance on a regular
basis to provide confidence that the project will satisfy the relevant qualitystandards.
■ Team Development (9.3)—developing individual and group skills/competen-cies to enhance project performance.
■ Information Distribution (10.2)—making needed information available toproject stakeholders in a timely manner.
■ Solicitation (12.3)—obtaining quotations, bids, offers, or proposals as appro-priate.
■ Source Selection (12.4)—choosing from among potential sellers.■ Contract Administration (12.5)—managing the relationship with the seller.
agement Body of Knowledge (PMBOK® Guide) 2000 Editionnt Institute, Four Campus Boulevard, Newtown Square, PA 19073-3299 USA 35
se limited to: Old Dominion University. Downloaded on September 15,2010 at 18:15:01 UTC from IEEE Xplore. Restrictions apply.

Chapter 3—Project Management Processes
36
Figure 3–7. Relationships among the Controlling Processes
Controlling Processes
To the PlanningProcesses(Figure 3-5)
From theExecutingProcesses
(Figure 3-6)
To the ClosingProcesses(Figure 3-8)
Facilitating Processes
5.4Scope Verification
Scope
5.5Scope ChangeControl
Scope
8.3Quality Control
Quality
7.4Cost Control
Cost
6.5Schedule Control
Time
11.6Risk Monitoringand Control
Risk
4.3IntegratedChange Control
10.3PerformanceReporting
Communications Integration
To the ExecutingProcesses(Figure 3-6)
Figu
re 3
–7|
3.4
Authorized licensed
3.3.4 Controlling ProcessesProject performance must be monitored and measured regularly to identify vari-ances from the plan. Variances are fed into the control processes in the variousknowledge areas. To the extent that significant variances are observed (i.e., thosethat jeopardize the project objectives), adjustments to the plan are made byrepeating the appropriate project planning processes. For example, a missedactivity finish date may require adjustments to the current staffing plan, relianceon overtime, or tradeoffs between budget and schedule objectives. Controllingalso includes taking preventive action in anticipation of possible problems.
The controlling process group contains core processes and facilitating processes.Figure 3-7 illustrates how the following core and facilitating processes interact:
■ Integrated Change Control (4.3)—coordinating changes across the entireproject.
■ Scope Verification (5.4)—formalizing acceptance of the project scope.■ Scope Change Control (5.5)—controlling changes to project scope.■ Schedule Control (6.5)—controlling changes to the project schedule.■ Cost Control (7.4)—controlling changes to the project budget.■ Quality Control (8.3)—monitoring specific project results to determine if they
comply with relevant quality standards and identifying ways to eliminatecauses of unsatisfactory performance.
■ Performance Reporting (10.3)—collecting and disseminating performance infor-mation. This includes status reporting, progress measurement, and forecasting.
■ Risk Monitoring and Control (11.6)—keeping track of identified risks, moni-toring residual risks and identifying new risks, ensuring the execution of riskplans, and evaluating their effectiveness in reducing risk.
A Guide to the Project Management Body of Knowledge (PMBOK® Guide) 2000 Edition©2000 Project Management Institute, Four Campus Boulevard, Newtown Square, PA 19073-3299 USA
use limited to: Old Dominion University. Downloaded on September 15,2010 at 18:15:01 UTC from IEEE Xplore. Restrictions apply.

Chapter 3—Project Management Processes
A Guide to the Project M©2000 Project Manag
Figure 3–8. Relationships among the Closing Processes
Closing Processes
From theControllingProcesses
(Figure 3-7) 12.6Contract Closeout
Procurement
10.4AdministrativeClosure
Communications
Authorized license
3.3.5 Closing ProcessesFigure 3-8 illustrates how the following core processes interact:■ Contract Closeout (12.6)—completion and settlement of the contract, including
resolution of any open items.■ Administrative Closure (10.4)—generating, gathering, and disseminating
information to formalize phase or project completion, including evaluating theproject and compiling lessons learned for use in planning future projects orphases.
3.4 CUSTOMIZING PROCESS INTERACTIONSThe processes and interactions in Section 3.3 meet the test of general accep-tance—they apply to most projects most of the time. However, not all of theprocesses will be needed on all projects, and not all of the interactions will applyto all projects. For example:■ An organization that makes extensive use of contractors may explicitly describe
where in the planning process each procurement process occurs.■ The absence of a process does not mean that it should not be performed. The
project management team should identify and manage all the processes thatare needed to ensure a successful project.
■ Projects that are dependent on unique resources (commercial software develop-ment, biopharmaceuticals, etc.) may define roles and responsibilities prior toscope definition, since what can be done may be a function of who will be avail-able to do it.
■ Some process outputs may be predefined as constraints. For example, manage-ment may specify a target completion date, rather than allowing it to be deter-mined by the planning process. An imposed completion date may increaseproject risk, add cost, and compromise quality.
■ Larger projects may need relatively more detail. For example, risk identifica-tion might be further subdivided to focus separately on identifying cost risks,schedule risks, technical risks, and quality risks.
■ On subprojects and smaller projects, relatively little effort will be spent onprocesses whose outputs have been defined at the project level (e.g., a subcon-tractor may ignore risks explicitly assumed by the prime contractor), or onprocesses that provide only marginal utility (e.g., there may be no formal com-munications plan on a four-person project).
anagement Body of Knowledge (PMBOK® Guide) 2000 Editionement Institute, Four Campus Boulevard, Newtown Square, PA 19073-3299 USA 37
d use limited to: Old Dominion University. Downloaded on September 15,2010 at 18:15:01 UTC from IEEE Xplore. Restrictions apply.
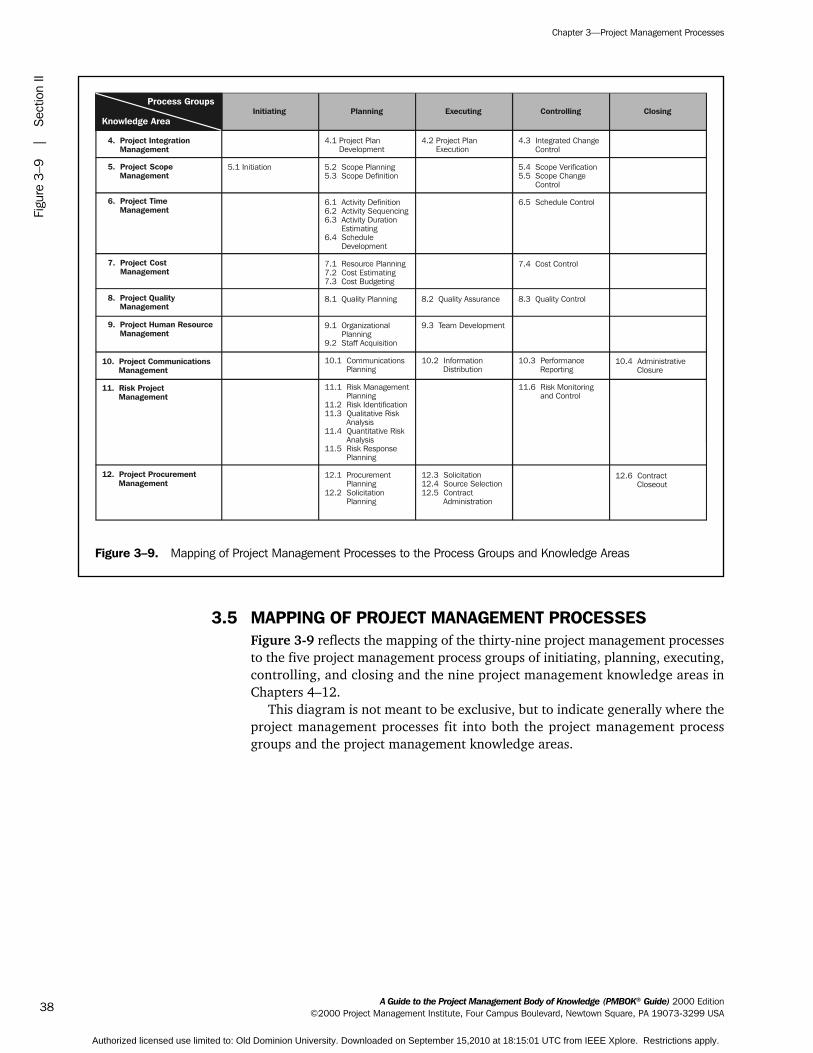
Chapter 3—Project Management Processes
38
Figure 3–9. Mapping of Project Management Processes to the Process Groups and Knowledge Areas
4. Project Integration Management
5. Scope Management
Project
6. Time Management
Project
7. Cost
Project Management
8. Project Quality Management
9. Project Human Resource Management
10. Project Communications Management
11. Risk Project Management
12. Project Procurement Management
5.1 Initiation
4.1 Project Plan Development
5.2 Scope Planning5.3 Scope Definition
6.1 Activity Definition6.2 Activity Sequencing6.3 Activity Duration Estimating6.4 Schedule Development
7.1 Resource Planning7.2 Cost Estimating7.3 Cost Budgeting
8.1 Quality Planning
9.1 Organizational Planning
9.2 Staff Acquisition
10.1 Communications Planning
11.1 Risk Management Planning11.2 Risk Identification11.3 Qualitative Risk Analysis11.4 Quantitative Risk
Analysis11.5 Risk Response
Planning
12.1 Procurement Planning
12.2 Solicitation Planning
4.2 Project Plan Execution
8.2 Quality Assurance
10.2 Information Distribution
12.3 Solicitation12.4 Source Selection12.5 Contract Administration
9.3 Team Development
4.3 Integrated Change Control
5.4 Scope Verification5.5 Scope Change Control
6.5 Schedule Control
7.4 Cost Control
8.3 Quality Control
10.3 Performance Reporting
11.6 Risk Monitoring Controland
10.4 Administrative Closure
12.6 Contract Closeout
Knowledge Area
Process GroupsPlanningInitiating ControllingExecuting Closing
Figu
re 3
–9|
Sect
ion
II
Authorized licensed use
3.5 MAPPING OF PROJECT MANAGEMENT PROCESSESFigure 3-9 reflects the mapping of the thirty-nine project management processesto the five project management process groups of initiating, planning, executing,controlling, and closing and the nine project management knowledge areas inChapters 4–12.
This diagram is not meant to be exclusive, but to indicate generally where theproject management processes fit into both the project management processgroups and the project management knowledge areas.
A Guide to the Project Management Body of Knowledge (PMBOK® Guide) 2000 Edition©2000 Project Management Institute, Four Campus Boulevard, Newtown Square, PA 19073-3299 USA
limited to: Old Dominion University. Downloaded on September 15,2010 at 18:15:01 UTC from IEEE Xplore. Restrictions apply.

SECTION II
THE PROJECT MANAGEMENT KNOWLEDGE AREAS
4. Project Integration Management
5. Project Scope Management
6. Project Time Management
7. Project Cost Management
8. Project Quality Management
9. Project Human Resource Management
10. Project Communications Management
11. Project Risk Management
12. Project Procurement Management
Authorized licensed use limited to: Old Dominion University. Downloaded on September 15,2010 at 18:15:01 UTC from IEEE Xplore. Restrictions apply.

Chapter 4
Project Integration Management
A Guide to the Project Manageme©2000 Project Management Inst
Authorized licensed use limit
Project Integration Management includes the processes required to ensure thatthe various elements of the project are properly coordinated. It involves makingtradeoffs among competing objectives and alternatives to meet or exceed stake-holder needs and expectations. While all project management processes are inte-grative to some extent, the processes described in this chapter are primarilyintegrative. Figure 4-1 provides an overview of the following major processes:
i
4.1 Project Plan Development—integrating and coordinating all project plans tocreate a consistent, coherent document.
4.2 Project Plan Execution—carrying out the project plan by performing the activ-ities included therein.
4.3 Integrated Change Control—coordinating changes across the entire project.
e
These processes interact with each other and with the processes in the otherknowledge areas as well. Each process may involve effort from one or more indi-viduals or groups of individuals, based on the needs of the project. Each processgenerally occurs at least once in every project phase.
Although the processes are presented here as discrete elements with well-defined interfaces, in practice they may overlap and interact in ways not detailedhere. Process interactions are discussed in detail in Chapter 3.
The processes, tools, and techniques used to integrate project managementprocesses are the focus of this chapter. For example, project integration manage-ment comes into play when a cost estimate is needed for a contingency plan, orwhen risks associated with various staffing alternatives must be identified. How-ever, for a project to be completed successfully, integration must also occur in anumber of other areas as well. For example:■ The work of the project must be integrated with the ongoing operations of the
performing organization.■ Product scope and project scope must be integrated (the difference between
product and project scope is discussed in the introduction to Chapter 5).One of the techniques used to both integrate the various processes and to mea-
sure the performance of the project as it moves from initiation through to com-pletion is Earned Value Management (EVM). EVM will be discussed in this chapteras a project integrating methodology, while earned value (EV), the technique, will
nt Body of Knowledge (PMBOK® Guide) 2000 Editiontute, Four Campus Boulevard, Newtown Square, PA 19073-3299 USA 41
d to: Old Dominion University. Downloaded on September 15,2010 at 18:15:01 UTC from IEEE Xplore. Restrictions apply.

Chapter 4—Project Integration Management
42
Figure 4–1. Project Integration Management Overview
PROJECT INTEGRATIONMANAGEMENT
4.2 Project Plan Execution
4.3 Integrated Change Control
4.1
.1 Inputs
.2 Tools and Techniques
.3 Outputs
.1 Other planning outputs
.2 Historical information
.3 Organizational policies
.4 Constraints
.5 Assumptions
.1 Project planning methodology
.2 Stakeholder skills and knowledge
.3 Project management information system(PMIS)
.4 Earned value management (EVM)
.1 Project plan
.2 Supporting detail
.1 Inputs
.2 Tools and Techniques
.3 Outputs
.1 Project plan
.2 Supporting detail
.3 Organizational policies
.4 Preventive action
.5 Corrective action
.1 General managementskills
.2 Product skills andknowledge
.3 Work authorization system
.4 Status review meetings
.5 Project managementinformation system
.6 Organizational procedures
.1 Work results
.2 Change requests
.1 Inputs
.2 Tools and Techniques
.3 Outputs
.1 Project plan
.2 Performance reports
.3 Change requests
.1 Change control system
.2 Configurationmanagement
.3 Performancemeasurement
.4 Additional planning
.5 Project managementinformation system
.1 Project plan updates
.2 Corrective action
.3 Lessons learned
Project Plan Development
Figu
re 4
.1|
4.1.
1.5
Authorized licensed use l
be discussed in other chapters as a tool to measure performance against theproject plan.
Project management software is a tool that aids integration within a project.And it may span all project management processes.
4.1 PROJECT PLAN DEVELOPMENTProject plan development uses the outputs of the other planning processes,including strategic planning, to create a consistent, coherent document that canbe used to guide both project execution and project control. This process isalmost always iterated several times. For example, the initial draft may includegeneric resource requirements and an undated sequence of activities while thesubsequent versions of the plan will include specific resources and explicit dates.The project scope of work is an iterative process that is generally done by theproject team with the use of a Work Breakdown Structure (WBS), allowing theteam to capture and then decompose all of the work of the project. All of thedefined work must be planned, estimated and scheduled, and authorized withthe use of detailed integrated management control plans sometimes called Con-trol Account Plans, or CAPs, in the EVM process. The sum of all the integratedmanagement control plans will constitute the total project scope.
A Guide to the Project Management Body of Knowledge (PMBOK® Guide) 2000 Edition©2000 Project Management Institute, Four Campus Boulevard, Newtown Square, PA 19073-3299 USA
imited to: Old Dominion University. Downloaded on September 15,2010 at 18:15:01 UTC from IEEE Xplore. Restrictions apply.

Chapter 4—Project Integration Management
A Guide to the Project Ma©2000 Project Managem
Authorized licensed u
The project plan is used to:■ Guide project execution.■ Document project planning assumptions.■ Document project planning decisions regarding alternatives chosen.■ Facilitate communication among stakeholders.■ Define key management reviews as to content, extent, and timing.■ Provide a baseline for progress measurement and project control.
4.1.1 Inputs to Project Plan Development.1 Other planning outputs. All of the outputs of the planning processes in the other
knowledge areas (Section 3.3 provides a summary of these project planningprocesses) are inputs to developing the project plan. Other planning outputsinclude both base documents, such as the WBS, and the supporting detail. Manyprojects will also require application area-specific inputs (e.g., most major proj-ects will require a cash-flow forecast).
.2 Historical information. The available historical information (e.g., estimating data-bases, records of past project performance) should have been consulted duringthe other project planning processes. This information should also be availableduring project plan development to assist with verifying assumptions andassessing alternatives that are identified as part of this process.
.3 Organizational policies. Any and all of the organizations involved in the project mayhave formal and informal policies whose effects must be considered. Organizationalpolicies that typically must be considered include, but are not limited to:■ Quality management—process audits, continuous improvement targets.■ Personnel administration—hiring and firing guidelines, employee performance
reviews.■ Financial controls—time reporting, required expenditure and disbursement
reviews, accounting codes, standard contract provisions..4 Constraints. A constraint is an applicable restriction that will affect the perfor-
mance of the project. For example, a predefined budget is a constraint that ishighly likely to limit the team’s options regarding scope, staffing, and schedule.When a project is performed under contract, contractual provisions will gener-ally be constraints.
.5 Assumptions. Assumptions are factors that, for planning purposes, are consid-ered to be true, real, or certain. Assumptions affect all aspects of project plan-ning, and are part of the progressive elaboration of the project. Project teamsfrequently identify, document, and validate assumptions as part of their planning
.1
.2
.3
.4
.5
Other planning outputsHistorical informationOrganizational policiesConstraintsAssumptions
.1
.2
.3
.4
Project planningmethodologyStakeholder skills andknowledgeProject managementinformation system (PMIS)Earned value management(EVM)
.1
.2Project planSupporting detail
Inputs Tools & Techniques Outputs
nagement Body of Knowledge (PMBOK® Guide) 2000 Editionent Institute, Four Campus Boulevard, Newtown Square, PA 19073-3299 USA 43
se limited to: Old Dominion University. Downloaded on September 15,2010 at 18:15:01 UTC from IEEE Xplore. Restrictions apply.

Chapter 4—Project Integration Management
44
4.1.
2|
4.1.
3.2
Authorized licensed use
process. For example, if the date that a key person will become available is uncer-tain, the team may assume a specific start date. Assumptions generally involvea degree of risk.
4.1.2 Tools and Techniques for Project Plan Development.1 Project planning methodology. A project planning methodology is any structured
approach used to guide the project team during development of the project plan.It may be as simple as standard forms and templates (whether paper or elec-tronic, formal or informal) or as complex as a series of required simulations (e.g.,Monte Carlo analysis of schedule risk). Most project planning methodologiesmake use of a combination of “hard” tools, such as project management software,and “soft” tools, such as facilitated startup meetings.
.2 Stakeholder skills and knowledge. Every stakeholder has skills and knowledgethat may be useful in developing the project plan. The project management teammust create an environment in which the stakeholders can contribute appropri-ately (see also Section 9.3, Team Development). Who contributes, what they con-tribute, and when they contribute will vary. For example:■ On a construction project being done under a lump-sum contract, the profes-
sional cost engineer will make a major contribution to the profitability objectiveduring proposal preparation when the contract amount is being determined.
■ On a project where staffing is defined in advance, the individual contributorsmay contribute significantly to meeting cost and schedule objectives byreviewing duration and effort estimates for reasonableness.
.3 Project management information system (PMIS). A PMIS consists of the tools andtechniques used to gather, integrate, and disseminate the outputs of project man-agement processes. It is used to support all aspects of the project from initiatingthrough closing, and can include both manual and automated systems.
.4 Earned value management (EVM). A technique used to integrate the project’sscope, schedule, and resources and to measure and report project performancefrom initiation to closeout. Further discussions on EVM can be found in Section7.4.2.3.
4.1.3 Outputs from Project Plan Development.1 Project plan. The project plan is a formal, approved document used to manage
project execution. The project schedule lists planned dates for performing activ-ities and meeting milestones identified in the project plan (see Section 6.4.3.1).The project plan and schedule should be distributed as defined in the commu-nications management plan (e.g., management of the performing organizationmay require broad coverage with little detail, while a contractor may requirecomplete details on a single subject). In some application areas, the term inte-grated project plan is used to refer to this document.
A clear distinction should be made between the project plan and the projectperformance measurement baselines. The project plan is a document or collec-tion of documents that should be expected to change over time as more infor-mation becomes available about the project. The performance measurementbaselines will usually change only intermittently, and then generally only inresponse to an approved scope of work or deliverable change.
A Guide to the Project Management Body of Knowledge (PMBOK® Guide) 2000 Edition©2000 Project Management Institute, Four Campus Boulevard, Newtown Square, PA 19073-3299 USA
limited to: Old Dominion University. Downloaded on September 15,2010 at 18:15:01 UTC from IEEE Xplore. Restrictions apply.

Chapter 4—Project Integration Management
A Guide to the Project Managem©2000 Project Management In
Authorized licensed use lim
There are many ways to organize and present the project plan, but it com-monly includes all of the following (these items are described in more detail else-where):■ Project charter.■ A description of the project management approach or strategy (a summary of
the individual management plans from the other knowledge areas).■ Scope statement, which includes the project objectives and the project deliv-
erables.■ WBS to the level at which control will be exercised, as a baseline scope doc-
ument.■ Cost estimates, scheduled start and finish dates (schedule), and responsibility
assignments for each deliverable within the WBS to the level at which controlwill be exercised.
■ Performance measurement baselines for technical scope, schedule, and cost—i.e., the schedule baseline (project schedule) and the cost baseline (time-phased project budget).
■ Major milestones and target dates for each.■ Key or required staff and their expected cost and/or effort.■ Risk management plan, including: key risks, including constraints and
assumptions, and planned responses and contingencies (where appropriate)for each.
■ Subsidiary management plans, namely:◆ Scope management plan (Section 5.2.3.3).◆ Schedule management plan (Section 6.4.3.3).◆ Cost management plan (Section 7.2.3.3).◆ Quality management plan (Section 8.1.3.1).◆ Staffing management plan (Section 9.1.3.2).◆ Communications management plan (Section 10.1.3.1).◆ Risk response plan (Section 11.5.3.1).◆ Procurement management plan (Section 12.1.3.1).
Each of these plans could be included if needed and with detail to theextent required for each specific project.
■ Open issues and pending decisions.Other project planning outputs should be included in the formal plan, based
upon the needs of the individual project. For example, the project plan for a largeproject will generally include a project organization chart.
.2 Supporting detail. Supporting detail for the project plan includes:■ Outputs from other planning processes that are not included in the project
plan.■ Additional information or documentation generated during development of
the project plan (e.g., constraints and assumptions that were not previouslyknown).
■ Technical documentation; such as, a history of all requirements, specifications,and conceptual designs.
■ Documentation of relevant standards.■ Specifications from early project development planning.
This material should be organized as needed to facilitate its use during projectplan execution.
ent Body of Knowledge (PMBOK® Guide) 2000 Editionstitute, Four Campus Boulevard, Newtown Square, PA 19073-3299 USA 45
ited to: Old Dominion University. Downloaded on September 15,2010 at 18:15:01 UTC from IEEE Xplore. Restrictions apply.

Chapter 4—Project Integration Management
46
4.2
|4.
3
Authorized licensed
4.2 PROJECT PLAN EXECUTIONProject plan execution is the primary process for carrying out the project plan—the vast majority of the project’s budget will be expended in performing thisprocess. In this process, the project manager and the project management teammust coordinate and direct the various technical and organizational interfacesthat exist in the project. It is the project process that is most directly affected bythe project application area in that the product of the project is actually createdhere. Performance against the project baseline must be continuously monitoredso that corrective actions can be taken based on actual performance against theproject plan. Periodic forecasts of the final cost and schedule results will be madeto support the analysis.
4.2.1 Inputs to Project Plan Execution.1 Project plan. The project plan is described in Section 4.1.3.1. The subsidiary
management plans (scope management plan, risk management plan, procure-ment management plan, configuration management plan, etc.) and the perfor-mance measurement baselines are key inputs to project plan execution.
.2 Supporting detail. Supporting detail is described in Section 4.1.3.2.
.3 Organizational policies. Organizational policies are described in Section 4.1.1.3.Any and all of the organizations involved in the project may have formal andinformal policies that may affect project plan execution.
.4 Preventive action. Preventive action is anything that reduces the probability ofpotential consequences of project risk events.
.5 Corrective action. Corrective action is anything done to bring expected futureproject performance in line with the project plan. Corrective action is an outputof the various control processes—as an input here it completes the feedback loopneeded to ensure effective project management.
4.2.2 Tools and Techniques for Project Plan Execution.1 General management skills. General management skills such as leadership, com-
municating, and negotiating are essential to effective project plan execution.General management skills are described in Section 2.4.
.2 Product skills and knowledge. The project team must have access to an appro-priate set of skills and knowledge about the project’s product. The necessary skillsare defined as part of planning (especially in resource planning, Section 7.1) andare provided through the staff acquisition process (described in Section 9.2).
.1
.2
.3
.4
.5
Project planSupporting detailOrganizational policiesPreventive actionCorrective action
.1
.2
.3
.4
.5
.6
General managementskillsProduct skills andknowledgeWork authorization systemStatus review meetingsProject managementinformation systemOrganizational procedures
.1
.2Work resultsChange requests
Inputs Tools & Techniques Outputs
A Guide to the Project Management Body of Knowledge (PMBOK® Guide) 2000 Edition©2000 Project Management Institute, Four Campus Boulevard, Newtown Square, PA 19073-3299 USA
use limited to: Old Dominion University. Downloaded on September 15,2010 at 18:15:01 UTC from IEEE Xplore. Restrictions apply.

Chapter 4—Project Integration Management
A Guide to the Project Mana©2000 Project Managemen
Authorized licensed use
.3 Work authorization system. A work authorization system is a formal procedure forsanctioning project work to ensure that work is done at the right time and in theproper sequence. The primary mechanism is typically a written authorization tobegin work on a specific activity or work package.
The design of a work authorization system should balance the value of thecontrol provided with the cost of that control. For example, on many smaller proj-ects, verbal authorizations will be adequate.
.4 Status review meetings. Status review meetings are regularly scheduled meet-ings held to exchange information about the project. On most projects, statusreview meetings will be held at various frequencies and on different levels (e.g.,the project management team may meet weekly by itself and monthly with thecustomer).
.5 Project management information system. The PMIS is described in Section 4.1.2.3.
.6 Organizational procedures. Any and all of the organizations involved in the projectmay have formal and informal procedures that are useful during project execution.
4.2.3 Outputs from Project Plan Execution.1 Work results. Work results are the outcomes of the activities performed to accom-
plish the project. Information on work results—which deliverables have beencompleted and which have not, to what extent quality standards are being met,what costs have been incurred or committed, etc.—is collected as part of projectplan execution and fed into the performance reporting process (see Section 10.3for a more detailed discussion of performance reporting). It should be noted thatalthough outcomes are frequently tangible deliverables such as buildings, roads,etc., they are also often intangibles such as people trained who can effectivelyapply that training.
.2 Change requests. Change requests (e.g., to expand or contract project scope, tomodify cost [budgets], or schedule estimates [dates, etc.]) are often identifiedwhile the work of the project is being done.
4.3 INTEGRATED CHANGE CONTROLIntegrated change control is concerned with a) influencing the factors that createchanges to ensure that changes are agreed upon , b) determining that a changehas occurred, and c) managing the actual changes when and as they occur. Theoriginal defined project scope and the integrated performance baseline must bemaintained by continuously managing changes to the baseline, either by rejectingnew changes or by approving changes and incorporating them into a revisedproject baseline. Integrated change control requires:■ Maintaining the integrity of the performance measurement baselines.■ Ensuring that changes to the product scope are reflected in the definition of
the project scope. (The difference between product and project scope is dis-cussed in the introduction to Chapter 5.)
■ Coordinating changes across knowledge areas, as illustrated in Figure 4-2. Forexample, a proposed schedule change will often affect cost, risk, quality, andstaffing.
gement Body of Knowledge (PMBOK® Guide) 2000 Editiont Institute, Four Campus Boulevard, Newtown Square, PA 19073-3299 USA 47
limited to: Old Dominion University. Downloaded on September 15,2010 at 18:15:01 UTC from IEEE Xplore. Restrictions apply.

Chapter 4—Project Integration Management
48
Figure 4–2. Coordinating Changes Across the Entire Project
Subsidiary Change Control
• Scope Change Control• Schedule Change Control• Cost Change Control• Quality Control• Risk Change Control• Contract Administration
4.3IntegratedChange Control
10.3PerformanceReporting
Communications Integration
4.3.
1|
4.3.
3.3
Authorized licensed us
4.3.1 Inputs to Integrated Change Control.1 Project plan. The project plan provides the baseline against which changes will
be controlled (see Section 4.1.3.1)..2 Performance reports. Performance reports (described in Section 10.3) provide
information on project performance. Performance reports may also alert theproject team to issues that may cause problems in the future.
.3 Change requests. Change requests may occur in many forms—oral or written, director indirect, externally or internally initiated, and legally mandated or optional.
4.3.2 Tools and Techniques for Integrated Change Control.1 Change control system. A change control system is a collection of formal, docu-
mented procedures that defines how project performance will be monitored andevaluated, and includes the steps by which official project documents may bechanged. It includes the paperwork, tracking systems, processes, and approvallevels necessary for authorizing changes.
.1
.2
.3
Project planPerformance reportsChange requests
.1
.2
.3
.4
.5
Change control systemConfiguration managementPerformance measurementAdditional planningProject managementinformation system
.1
.2
.3
Project plan updatesCorrective actionLessons learned
Inputs Tools & Techniques Outputs
A Guide to the Project Management Body of Knowledge (PMBOK® Guide) 2000 Edition©2000 Project Management Institute, Four Campus Boulevard, Newtown Square, PA 19073-3299 USA
e limited to: Old Dominion University. Downloaded on September 15,2010 at 18:15:01 UTC from IEEE Xplore. Restrictions apply.

Chapter 4—Project Integration Management
A Guide to the Project Manage©2000 Project Management I
Authorized licensed use li
In many cases, the performing organization will have a change control systemthat can be adopted “as is” for use by the project. However, if an appropriatesystem is not available, the project management team will need to develop oneas part of the project.
Many change control systems include a group responsible for approving orrejecting proposed changes. The roles and responsibilities of these groups areclearly defined within the change control system and agreed upon by all keystakeholders. Organizations vary by the definition of the board; however, somecommon occurrences are Configuration Control Board (CCB), EngineeringReview Board (ERB), Technical Review Board (TRB), Technical Assessment Board(TAB), and a variety of others. The change control system must also include pro-cedures to handle changes that may be approved without prior review, forexample, as the result of emergencies. Typically, a change control system willallow for “automatic” approval of defined categories of changes. These changesmust still be documented and captured so that the evolution of the baseline canbe documented.
.2 Configuration management. Configuration management is any documented pro-cedure used to apply technical and administrative direction and surveillance to:■ Identify and document the functional and physical characteristics of an item
or system.■ Control any changes to such characteristics.■ Record and report the change and its implementation status.■ Audit the items and system to verify conformance to requirements.
In many application areas, configuration management is a subset of the changecontrol system and is used to ensure that the description of the project’s productis correct and complete. In other application areas, change control refers to anysystematic effort to manage project change.
.3 Performance measurement. Performance measurement techniques such as EV(described in Section 10.3.2.4) help to assess whether variances from the planrequire corrective action.
.4 Additional planning. Projects seldom run exactly according to plan. Prospectivechanges may require new or revised cost estimates, modified activity sequences,schedules, resource requirements, analysis of risk response alternatives, or otheradjustments to the project plan.
.5 Project management information system. PMIS is described in Section 4.1.2.3.
4.3.3 Outputs from Integrated Change Control.1 Project plan updates. Project plan updates are any modification to the contents
of the project plan or the supporting detail (described in Sections 4.1.3.1 and4.1.3.2, respectively). Appropriate stakeholders must be notified as needed.
.2 Corrective action. Corrective action is described in Section 4.2.1.5.
.3 Lessons learned. The causes of variances, the reasoning behind the correctiveaction chosen, and other types of lessons learned should be documented so thatthey become part of the historical database for both this project and other proj-ects of the performing organization. The database is also the basis for knowledgemanagement.
ment Body of Knowledge (PMBOK® Guide) 2000 Editionnstitute, Four Campus Boulevard, Newtown Square, PA 19073-3299 USA 49
mited to: Old Dominion University. Downloaded on September 15,2010 at 18:15:01 UTC from IEEE Xplore. Restrictions apply.

Chapter 5
Project Scope Management
A Guide to the Project Managemen©2000 Project Management Institu
Authorized licensed use limite
Project Scope Management includes the processes required to ensure that theproject includes all the work required, and only the work required, to completethe project successfully (1). It is primarily concerned with defining and control-ling what is or is not included in the project. Figure 5-1 provides an overviewof the major project scope management processes:
t
5.1 Initiation—authorizing the project or phase.5.2 Scope Planning—developing a written scope statement as the basis for future
project decisions.5.3 Scope Definition—subdividing the major project deliverables into smaller, more
manageable components.5.4 Scope Verification—formalizing acceptance of the project scope.5.5 Scope Change Control—controlling changes to project scope.
d
These processes interact with each other and with the processes in the otherknowledge areas as well. Each process may involve effort from one or more indi-viduals or groups of individuals, based on the needs of the project. Each processgenerally occurs at least once in every project phase.
Although the processes are presented here as discrete components with well-defined interfaces, in practice they may overlap and interact in ways not detailedhere. Process interactions are discussed in detail in Chapter 3.
In the project context, the term scope may refer to:■ Product scope—the features and functions that characterize a product or service.■ Project scope—the work that must be done to deliver a product with the spec-
ified features and functions.The processes, tools, and techniques used to manage project scope are the
focus of this chapter. The processes, tools, and techniques used to manageproduct scope vary by application area and are usually defined as part of theproject life cycle (the project life cycle is discussed in Section 2.1).
A project generally results in a single product, but that product may includesubsidiary components, each with its own separate but interdependent productscopes. For example, a new telephone system would generally include four sub-sidiary components—hardware, software, training, and implementation.
Completion of the project scope is measured against the project plan, but com-pletion of the product scope is measured against the product requirements. Bothtypes of scope management must be well integrated to ensure that the work ofthe project will result in delivery of the specified product.
Body of Knowledge (PMBOK® Guide) 2000 Editionte, Four Campus Boulevard, Newtown Square, PA 19073-3299 USA 51
to: Old Dominion University. Downloaded on September 15,2010 at 18:15:01 UTC from IEEE Xplore. Restrictions apply.

A Guide to the Project Management Body of Knowledge (PMBOK® Guide) 2000 Edition©2000 Project Management Institute, Four Campus Boulevard, Newtown Square, PA 19073-3299 USA
Chapter 5—Project Scope Management
52
Figure 5–1. Project Scope Management Overview
PROJECT SCOPEMANAGEMENT
5.2 Scope Planning 5.3 Scope Definition5.1
.1 Inputs
.2 Tools and Techniques
.3 Outputs
.1 Product description
.2 Strategic plan
.3 Project selection criteria
.4 Historical information
.1 Project selectionmethods
.2 Expert judgment
.1 Project charter
.2 Project manageridentified/assigned
.3 Constraints
.4 Assumptions
.1 Inputs
.2 Tools and Techniques
.3 Outputs
.1 Product description
.2 Project charter
.3 Constraints
.4 Assumptions
.1 Product analysis
.2 Benefit/cost analysis
.3 Alternatives identification
.4 Expert judgment
.1 Scope statement
.2 Supporting detail
.3 Scope management plan
.1 Inputs
.2 Tools and Techniques
.3 Outputs
.1 Scope statement
.2 Constraints
.3 Assumptions
.4 Other planning outputs
.5 Historical information
.1 Work breakdownstructure templates
.2 Decomposition
.1 Work breakdownstructure
.2 Scope statementupdates
Initiation
5.5 Scope Change Control5.4
.1 Inputs
.2 Tools and Techniques
.3 Outputs
.1 Work results
.2 Product documentation
.3 Work breakdownstructure
.4 Scope statement
.5 Project plan
.1 Inspection
.1 Formal acceptance
.1 Inputs
.2 Tools and Techniques
.3 Outputs
.1 Work breakdownstructure
.2 Performance reports
.3 Change requests
.4 Scope management plan
.1 Scope change controlsystem
.2 Performancemeasurement
.3 Additional planning
.1 Scope changes
.2 Corrective action
.3 Lessons learned
.4 Adjusted baseline
Scope Verification
|Fi
gure
5–1
|5.
1.1.
1
Authorized licensed use limited to: Old Dominion University. Downloaded on September 15,2010 at 18:15:01 UTC from IEEE Xplore. Restrictions apply.

Chapter 5—Project Scope Management
A Guide to the Project M©2000 Project Manage
Authorized licensed
5.1 INITIATIONInitiation is the process of formally authorizing a new project or that an existingproject should continue into its next phase (see Section 2.1 for a more detaileddiscussion of project phases). This formal initiation links the project to theongoing work of the performing organization. In some organizations, a project isnot formally initiated until after completion of a needs assessment, a feasibilitystudy, a preliminary plan, or some other equivalent form of analysis that was itselfseparately initiated. Some types of projects, especially internal service projects andnew product development projects, are initiated informally, and some limitedamount of work is done to secure the approvals needed for formal initiation. Proj-ects are typically authorized as a result of one or more of the following:■ A market demand (e.g., a car company authorizes a project to build more fuel-
efficient cars in response to gasoline shortages).■ A business need (e.g., a training company authorizes a project to create a new
course to increase its revenues).■ A customer request (e.g., an electric utility authorizes a project to build a new
substation to serve a new industrial park).■ A technological advance (e.g., an electronics firm authorizes a new project to
develop a video game player after advances in computer memory).■ A legal requirement (e.g., a paint manufacturer authorizes a project to estab-
lish guidelines for the handling of toxic materials).■ A social need (e.g., a nongovernmental organization in a developing country
authorizes a project to provide potable water systems, latrines, and sanitationeducation to low-income communities suffering from high rates of cholera).These stimuli may also be called problems, opportunities, or business require-
ments. The central theme of all these terms is that management generally mustmake a decision about how to respond.
5.1.1 Inputs to Initiation.1 Product description. The product description documents the characteristics of the
product or service that the project was undertaken to create. The productdescription will generally have less detail in early phases and more detail in laterones as the product characteristics are progressively elaborated.
The product description should also document the relationship between theproduct or service being created and the business need or other stimulus thatgave rise to the project (see the list in Section 5.1). While the form and substanceof the product description will vary, it should always be detailed enough to sup-port later project planning.
.1
.2
.3
.4
Product descriptionStrategic planProject selection criteriaHistorical information
.1
.2Project selection methodsExpert judgment
.1
.2
.3
.4
Project charterProject manageridentified/assignedConstraintsAssumptions
Inputs Tools & Techniques Outputs
anagement Body of Knowledge (PMBOK® Guide) 2000 Editionment Institute, Four Campus Boulevard, Newtown Square, PA 19073-3299 USA 53
use limited to: Old Dominion University. Downloaded on September 15,2010 at 18:15:01 UTC from IEEE Xplore. Restrictions apply.

Chapter 5—Project Scope Management
54
5.1.
1.2
|5.
2.1.
4
Authorized licensed u
Many projects involve one organization (the seller) doing work under contractto another (the buyer). In such circumstances, the initial product description isusually provided by the buyer.
.2 Strategic plan. All projects should be supportive of the performing organization’sstrategic goals—the strategic plan of the performing organization should be con-sidered as a factor in project selection decisions.
.3 Project selection criteria. Project selection criteria are typically defined in termsof the merits of the product of the project and can cover the full range of possiblemanagement concerns (financial return, market share, public perceptions, etc.).
.4 Historical information. Historical information about both the results of previousproject selection decisions and previous project performance should be consideredto the extent that it is available. When initiation involves approval for the nextphase of a project, information about the results of previous phases is often critical.
5.1.2 Tools and Techniques for Initiation.1 Project selection methods. Project selection methods involve measuring value or
attractiveness to the project owner. Project selection methods include consideringthe decision criterion (multiple criteria, if used, should be combined into a singlevalue function) and a means to calculate value under uncertainty. These areknown as the decision model and calculation method. Project selection also appliesto choosing the alternative ways of doing the project. Optimization tools can beused to search for the optimal combination of decision variables. Project selec-tion methods generally fall into one of two broad categories (2):■ Benefit measurement methods—comparative approaches, scoring models,
benefit contribution, or economic models.■ Constrained optimization methods—mathematical models using linear, non-
linear, dynamic, integer, and multi-objective programming algorithms.These methods are often referred to as decision models. Decision models
include generalized techniques (Decision Trees, Forced Choice, and others), aswell as specialized ones (Analytic Hierarchy Process, Logical FrameworkAnalysis, and others). Applying complex project selection criteria in a sophisti-cated model is often treated as a separate project phase.
.2 Expert judgment. Expert judgment will often be required to assess the inputs tothis process. Such expertise may be provided by any group or individual with spe-cialized knowledge or training, and is available from many sources, including:■ Other units within the performing organization.■ Consultants.■ Stakeholders, including customers.■ Professional and technical associations.■ Industry groups.
5.1.3 Outputs from Initiation.1 Project charter. A project charter is a document that formally authorizes a
project. It should include, either directly or by reference to other documents:■ The business need that the project was undertaken to address.■ The product description (described in Section 5.1.1.1).
The project charter should be issued by a manager external to the project, andat a level appropriate to the needs of the project. It provides the project managerwith the authority to apply organizational resources to project activities.
A Guide to the Project Management Body of Knowledge (PMBOK® Guide) 2000 Edition©2000 Project Management Institute, Four Campus Boulevard, Newtown Square, PA 19073-3299 USA
se limited to: Old Dominion University. Downloaded on September 15,2010 at 18:15:01 UTC from IEEE Xplore. Restrictions apply.

Chapter 5—Project Scope Management
A Guide to the Project Mana©2000 Project Manageme
Authorized licensed us
When a project is performed under contract, the signed contract will generallyserve as the project charter for the seller.
.2 Project manager identified/assigned. In general, the project manager should beidentified and assigned as early in the project as is feasible. The project managershould always be assigned prior to the start of project plan execution (describedin Section 4.2) and preferably before much project planning has been done (theproject planning processes are described in Section 3.3.2).
.3 Constraints. Constraints are factors that will limit the project management team’soptions. For example, a predefined budget is a constraint that is highly likely tolimit the team’s options regarding scope, staffing, and schedule.
When a project is performed under contract, contractual provisions will gen-erally be constraints. Another example is a requirement that the product of theproject be socially, economically, and environmentally sustainable, which will alsohave an effect on the project’s scope, staffing, and schedule.
.4 Assumptions. See Section 4.1.1.5.
5.2 SCOPE PLANNINGScope planning is the process of progressively elaborating and documenting theproject work (project scope) that produces the product of the project. Projectscope planning starts with the initial inputs of product description, the projectcharter, and the initial definition of constraints and assumptions. Note that theproduct description incorporates product requirements that reflect agreed-uponcustomer needs and the product design that meets the product requirements. Theoutputs of scope planning are the scope statement and scope management plan,with the supporting detail. The scope statement forms the basis for an agreementbetween the project and the project customer by identifying both the projectobjectives and the project deliverables. Project teams develop multiple scopestatements that are appropriate for the level of project work decomposition.
5.2.1 Inputs to Scope Planning.1 Product description. The product description is discussed in Section 5.1.1.1..2 Project charter. The project charter is described in Section 5.1.3.1..3 Constraints. Constraints are described in Section 5.1.3.3..4 Assumptions. Assumptions are described in Section 4.1.1.5.
.1
.2
.3
.4
Product descriptionProject charterConstraintsAssumptions
.1
.2
.3
.4
Product analysisBenefit/cost analysisAlternatives identificationExpert judgment
.1
.2
.3
Scope statementSupporting detailScope management plan
Inputs Tools & Techniques Outputs
gement Body of Knowledge (PMBOK® Guide) 2000 Editionnt Institute, Four Campus Boulevard, Newtown Square, PA 19073-3299 USA 55
e limited to: Old Dominion University. Downloaded on September 15,2010 at 18:15:01 UTC from IEEE Xplore. Restrictions apply.

Chapter 5—Project Scope Management
56
5.2.
2|
5.3.
2.1
Authorized licensed
5.2.2 Tools and Techniques for Scope Planning.1 Product analysis. Product analysis involves developing a better understanding of
the product of the project. It includes techniques such as product breakdownanalysis systems engineering, value engineering, value analysis, function analysis,and quality function deployment.
.2 Benefit/cost analysis. Benefit/cost analysis involves estimating tangible andintangible costs (outlays) and benefits (returns) of various project and productalternatives, and then using financial measures, such as return on investment orpayback period, to assess the relative desirability of the identified alternatives.
.3 Alternatives identification. This is a general term for any technique used to gen-erate different approaches to the project. There is a variety of general manage-ment techniques often used here, the most common of which are brainstormingand lateral thinking.
.4 Expert judgment. Expert judgment is described in Section 5.1.2.2.
5.2.3 Outputs from Scope Planning.1 Scope statement. The scope statement provides a documented basis for making
future project decisions and for confirming or developing common understandingof project scope among the stakeholders. As the project progresses, the scopestatement may need to be revised or refined to reflect approved changes to thescope of the project. The scope statement should include, either directly or by ref-erence to other documents:■ Project justification—the business need that the project was undertaken to
address. The project justification provides the basis for evaluating futuretradeoffs.
■ Project’s product—a brief summary of the product description (the productdescription is discussed in Section 5.1.1.1).
■ Project deliverables—a list of the summary-level subproducts whose full and sat-isfactory delivery marks completion of the project. For example, the major deliv-erables for a software development project might include the working computercode, a user manual, and an interactive tutorial. When known, exclusionsshould be identified, but anything not explicitly included is implicitly excluded.
■ Project objectives—the quantifiable criteria that must be met for the projectto be considered successful. Project objectives must include at least cost,schedule, and quality measures. Project objectives should have an attribute(e.g., cost), a metric (e.g., United States [U.S.] dollars), and an absolute orrelative value (e.g., less than 1.5 million). Unquantified objectives (e.g., “cus-tomer satisfaction”) entail high risk to successful accomplishment.
.2 Supporting detail. Supporting detail for the scope statement should be docu-mented and organized as needed to facilitate its use by other project managementprocesses. Supporting detail should always include documentation of all identi-fied assumptions and constraints. The amount of additional detail may vary byapplication area.
.3 Scope management plan. This document describes how project scope will bemanaged and how scope changes will be integrated into the project. It shouldalso include an assessment of the expected stability of the project scope (i.e., howlikely is it to change, how frequently, and by how much). The scope managementplan should also include a clear description of how scope changes will be iden-tified and classified. (This is particularly difficult—and therefore absolutelyessential—when the product characteristics are still being elaborated.)
A Guide to the Project Management Body of Knowledge (PMBOK® Guide) 2000 Edition©2000 Project Management Institute, Four Campus Boulevard, Newtown Square, PA 19073-3299 USA
use limited to: Old Dominion University. Downloaded on September 15,2010 at 18:15:01 UTC from IEEE Xplore. Restrictions apply.

Chapter 5—Project Scope Management
A Guide to the Project M©2000 Project Manage
Authorized licensed
A scope management plan may be formal or informal, highly detailed orbroadly framed, based on the needs of the project. It is a subsidiary componentof the project plan (described in Section 4.1.3.1).
5.3 SCOPE DEFINITIONScope definition involves subdividing the major project deliverables (as identi-fied in the scope statement as defined in Section 5.2.3.1) into smaller, more man-ageable components to:■ Improve the accuracy of cost, duration, and resource estimates.■ Define a baseline for performance measurement and control.■ Facilitate clear responsibility assignments.
Proper scope definition is critical to project success. “When there is poor scopedefinition, final project costs can be expected to be higher because of theinevitable changes which disrupt project rhythm, cause rework, increase projecttime, and lower the productivity and morale of the workforce” (3).
5.3.1 Inputs to Scope Definition.1 Scope statement. The scope statement is described in Section 5.2.3.1..2 Constraints. Constraints are described in Section 5.1.3.3. When a project is done
under contract, the constraints defined by contractual provisions are often impor-tant considerations during scope definition.
.3 Assumptions. Assumptions are described in Section 4.1.1.5.
.4 Other planning outputs. The outputs of the processes in other knowledge areasshould be reviewed for possible impact on project scope definition.
.5 Historical information. Historical information about previous projects should beconsidered during scope definition. Information about errors and omissions onprevious projects should be especially useful.
5.3.2 Tools and Techniques for Scope Definition.1 Work breakdown structure templates. A WBS (described in Section 5.3.3.1) from
a previous project can often be used as a template for a new project. Althougheach project is unique, WBSs can often be “reused” since most projects willresemble another project to some extent. For example, most projects within agiven organization will have the same or similar project life cycles, and will thushave the same or similar deliverables required from each phase.
.1
.2
.3
.4
.5
Scope statementConstraintsAssumptionsOther planning outputsHistorical information
.1
.2
Work breakdown structuretemplatesDecomposition
.1
.2Work breakdown structureScope statement updates
Inputs Tools & Techniques Outputs
anagement Body of Knowledge (PMBOK® Guide) 2000 Editionment Institute, Four Campus Boulevard, Newtown Square, PA 19073-3299 USA 57
use limited to: Old Dominion University. Downloaded on September 15,2010 at 18:15:01 UTC from IEEE Xplore. Restrictions apply.

Chapter 5—Project Scope Management
58
Figure 5–2. Sample Work Breakdown Structure for Defense Material Items
Airframe Engine CommunicationSystem
NavigationSystem
Fire ControlSystem
Test
ServicesTraining
ManagementData
DepotLevel SE
DevelopmentalTest
SupportingPM Activities
FacilitiesTraining
EngineeringData
IntermediateLevel SE
MaintenanceFacility
OperationalTest
SystemsEngineering
Management
EquipmentTraining
TechnicalOrders
OrganizationalLevel SE Base Buildings Mock-ups
ProjectManagement Training Data
AircraftSystem
SupportEquipment
Facilities Test andEvaluation
AirVehicle
This WBS is illustrative only. It is not intended to represent the full project scope of any specific project,nor to imply that this is the only way to organize a WBS on this type of project.
Figu
re 5
–2|
5.3.
3.1
Authorized licensed use lim
Many application areas or performing organizations have standard or semi-standard WBSs that can be used as templates. For example, the U.S. Departmentof Defense has recommended standards WBSs for Defense Material Items (MIL-HDBK-881). A portion of one of these templates is shown as Figure 5-2.
.2 Decomposition. Decomposition involves subdividing the major project deliver-ables or subdeliverables into smaller, more manageable components until thedeliverables are defined in sufficient detail to support development of projectactivities (planning, executing, controlling, and closing). Decomposition involvesthe following major steps:
(1) Identify the major deliverables of the project, including project manage-ment. The major deliverables should always be defined in terms of how theproject will actually be organized. For example:■ The phases of the project life cycle may be used as the first level of decompo-
sition with the project deliverables repeated at the second level, as illustratedin Figure 5-3.
■ The organizing principle within each branch of the WBS may vary, as illus-trated in Figure 5-4.(2) Decide if adequate cost and duration estimates can be developed at this
level of detail for each deliverable. The meaning of adequate may change over thecourse of the project—decomposition of a deliverable that will be produced farin the future may not be possible. For each deliverable, proceed to Step 4 if thereis adequate detail, to Step 3 if there is not—this means that different deliverablesmay have differing levels of decomposition.
A Guide to the Project Management Body of Knowledge (PMBOK® Guide) 2000 Edition©2000 Project Management Institute, Four Campus Boulevard, Newtown Square, PA 19073-3299 USA
ited to: Old Dominion University. Downloaded on September 15,2010 at 18:15:01 UTC from IEEE Xplore. Restrictions apply.

Chapter 5—Project Scope Management
A Guide to the Project Ma©2000 Project Managem
Figure 5–3. Sample Work Breakdown Structure Organized by Phase
Administration
Meetings
Planning
Training ProgramMaterials
UserDocumentation
Software
Training ProgramMaterials
UserDocumentation
Software
Training ProgramMaterials
UserDocumentation
Software
Training ProgramMaterials
UserDocumentation
Software
ProjectManagement
ProductRequirements
Software ProductRelease 5.0
Construct Integrationand Test
DetailDesign
This WBS is illustrative only. It is not intended to represent the full project scope of any specific project,nor to imply that this is the only way to organize a WBS on this type of project.
Authorized licensed u
(3) Identify constituent components of the deliverable. Constituent componentsshould be described in terms of tangible, verifiable results to facilitate performancemeasurement. As with the major components, the constituent components shouldbe defined in terms of how the work of the project will actually be organized andthe work of the project accomplished. Tangible, verifiable results can include ser-vices as well as products (e.g., status reporting could be described as weekly statusreports; for a manufactured item, constituent components might include severalindividual components plus final assembly). Repeat Step 2 on each constituentcomponent.
(4) Verify the correctness of the decomposition:■ Are the lower-level items both necessary and sufficient for completion of the
decomposed item? If not, the constituent components must be modified(added to, deleted from, or redefined).
■ Is each item clearly and completely defined? If not, the descriptions must berevised or expanded.
■ Can each item be appropriately scheduled? Budgeted? Assigned to a specificorganizational unit (e.g., department, team, or person) who will acceptresponsibility for satisfactory completion of the item? If not, revisions areneeded to provide adequate management control.
5.3.3 Outputs from Scope Definition.1 Work breakdown structure. A WBS is a deliverable-oriented grouping of project
components that organizes and defines the total scope of the project; work not
nagement Body of Knowledge (PMBOK® Guide) 2000 Editionent Institute, Four Campus Boulevard, Newtown Square, PA 19073-3299 USA 59
se limited to: Old Dominion University. Downloaded on September 15,2010 at 18:15:01 UTC from IEEE Xplore. Restrictions apply.
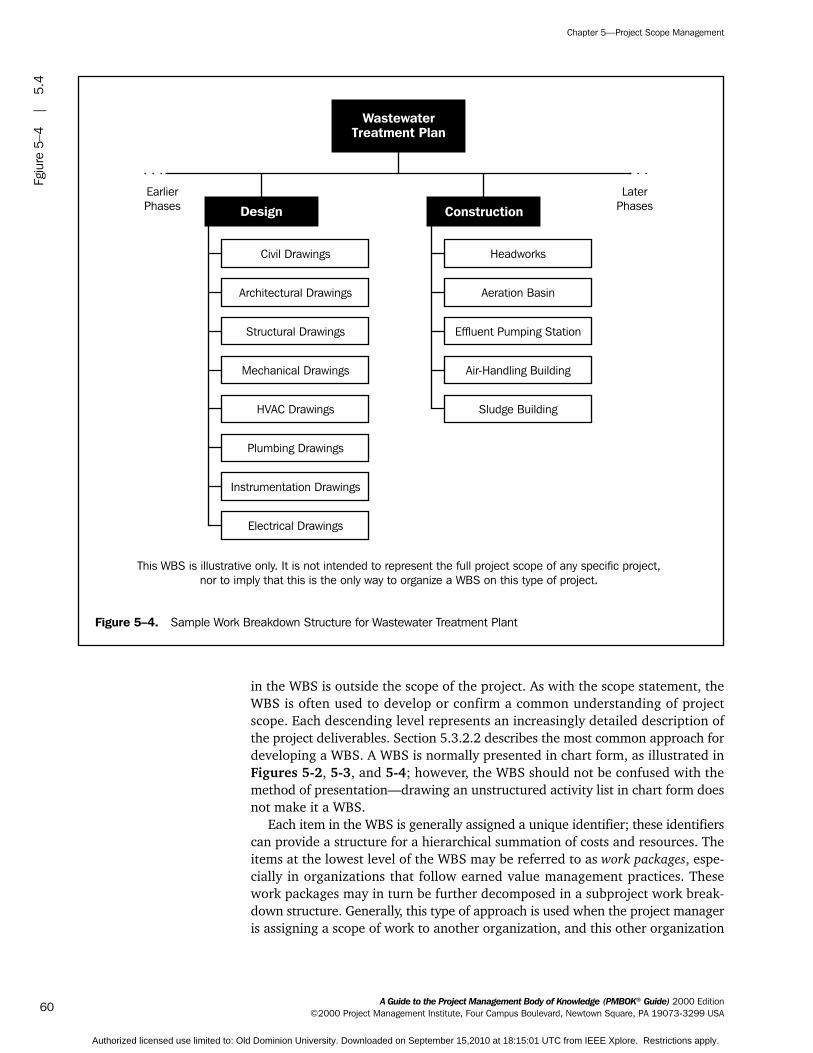
Chapter 5—Project Scope Management
60
Figure 5–4. Sample Work Breakdown Structure for Wastewater Treatment Plant
WastewaterTreatment Plan
This WBS is illustrative only. It is not intended to represent the full project scope of any specific project,nor to imply that this is the only way to organize a WBS on this type of project.
Civil Drawings
Architectural Drawings
Structural Drawings
Mechanical Drawings
HVAC Drawings
Plumbing Drawings
Instrumentation Drawings
Electrical Drawings
Design
Headworks
Aeration Basin
Effluent Pumping Station
Air-Handling Building
Sludge Building
Construction
EarlierPhases
LaterPhases
Fgiu
re 5
–4|
5.4
Authorized licensed use limite
in the WBS is outside the scope of the project. As with the scope statement, theWBS is often used to develop or confirm a common understanding of projectscope. Each descending level represents an increasingly detailed description ofthe project deliverables. Section 5.3.2.2 describes the most common approach fordeveloping a WBS. A WBS is normally presented in chart form, as illustrated inFigures 5-2, 5-3, and 5-4; however, the WBS should not be confused with themethod of presentation—drawing an unstructured activity list in chart form doesnot make it a WBS.
Each item in the WBS is generally assigned a unique identifier; these identifierscan provide a structure for a hierarchical summation of costs and resources. Theitems at the lowest level of the WBS may be referred to as work packages, espe-cially in organizations that follow earned value management practices. Thesework packages may in turn be further decomposed in a subproject work break-down structure. Generally, this type of approach is used when the project manageris assigning a scope of work to another organization, and this other organization
A Guide to the Project Management Body of Knowledge (PMBOK® Guide) 2000 Edition©2000 Project Management Institute, Four Campus Boulevard, Newtown Square, PA 19073-3299 USA
d to: Old Dominion University. Downloaded on September 15,2010 at 18:15:01 UTC from IEEE Xplore. Restrictions apply.

Chapter 5—Project Scope Management
A Guide to the Project Mana©2000 Project Managemen
Authorized licensed use
must plan and manage the scope of work at a more detailed level than the projectmanager in the main project. These work packages may be further decomposed inthe project plan and schedule, as described in Sections 5.3.2.2 and 6.1.2.1.
Work component descriptions are often collected in a WBS dictionary. A WBSdictionary will typically include work package descriptions, as well as other plan-ning information such as schedule dates, cost budgets, and staff assignments.
The WBS should not be confused with other kinds of “breakdown” structuresused to present project information. Other structures commonly used in someapplication areas include:■ Contractual WBS (CWBS), which is used to define the level of reporting that
the seller will provide the buyer. The CWBS generally includes less detail thanthe WBS used by the seller to manage the seller’s work.
■ Organizational breakdown structure (OBS), which is used to show whichwork components have been assigned to which organizational units.
■ Resource breakdown structure (RBS), which is a variation of the OBS and istypically used when work components are assigned to individuals.
■ Bill of materials (BOM), which presents a hierarchical view of the physicalassemblies, subassemblies, and components needed to fabricate a manufac-tured product.
■ Project breakdown structure (PBS), which is fundamentally the same as aproperly done WBS. The term PBS is widely used in application areas wherethe term WBS is incorrectly used to refer to a BOM.
.2 Scope statement updates. Include any modification of the contents of the scopestatement (described in Section 5.2.3.1). Appropriate stakeholders must be noti-fied as needed.
5.4 SCOPE VERIFICATIONScope verification is the process of obtaining formal acceptance of the projectscope by the stakeholders (sponsor, client, customer, etc.). It requires reviewingdeliverables and work results to ensure that all were completed correctly and sat-isfactorily. If the project is terminated early, the scope verification process shouldestablish and document the level and extent of completion. Scope verification dif-fers from quality control (described in Section 8.3) in that it is primarily con-cerned with acceptance of the work results while quality control is primarilyconcerned with the correctness of the work results. These processes are generallyperformed in parallel to ensure both correctness and acceptance.
.1
.2
.3
.4
.5
Work resultsProduct documentationWork breakdown structureScope statementProject plan
.1 Inspection .1 Formal acceptance
Inputs Tools & Techniques Outputs
gement Body of Knowledge (PMBOK® Guide) 2000 Editiont Institute, Four Campus Boulevard, Newtown Square, PA 19073-3299 USA 61
limited to: Old Dominion University. Downloaded on September 15,2010 at 18:15:01 UTC from IEEE Xplore. Restrictions apply.
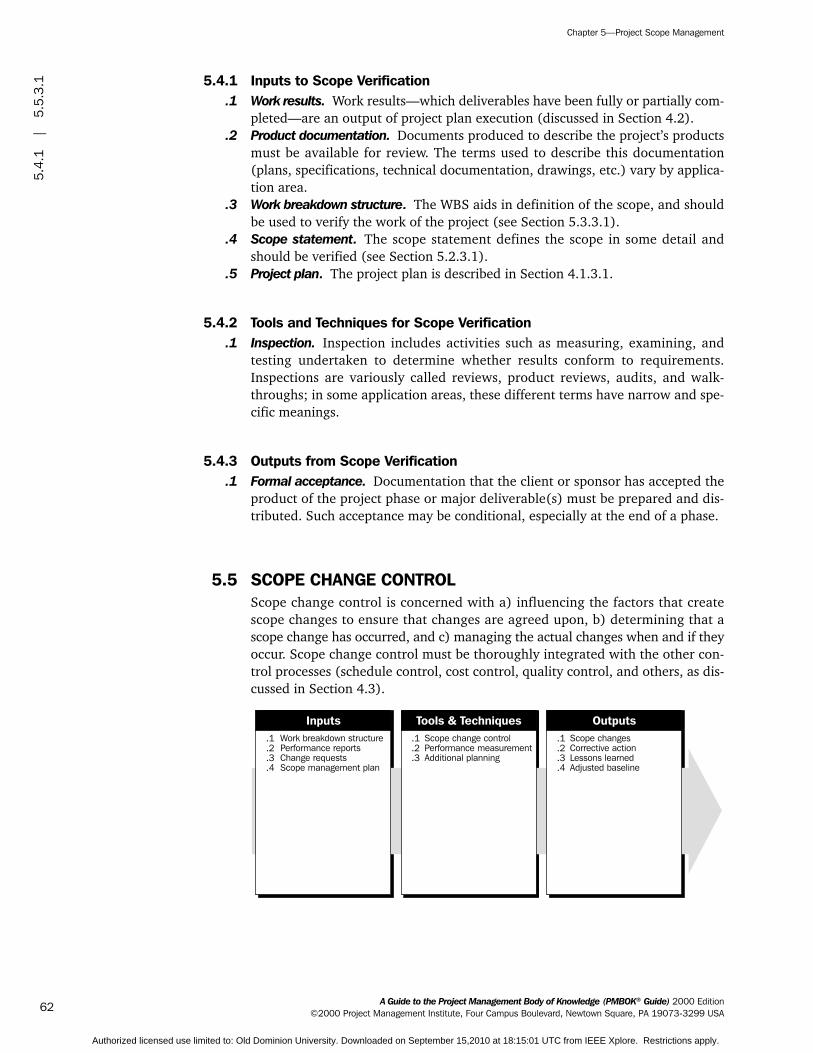
Chapter 5—Project Scope Management
62
5.4.
1|
5.5.
3.1
Authorized licensed
5.4.1 Inputs to Scope Verification.1 Work results. Work results—which deliverables have been fully or partially com-
pleted—are an output of project plan execution (discussed in Section 4.2)..2 Product documentation. Documents produced to describe the project’s products
must be available for review. The terms used to describe this documentation(plans, specifications, technical documentation, drawings, etc.) vary by applica-tion area.
.3 Work breakdown structure. The WBS aids in definition of the scope, and shouldbe used to verify the work of the project (see Section 5.3.3.1).
.4 Scope statement. The scope statement defines the scope in some detail andshould be verified (see Section 5.2.3.1).
.5 Project plan. The project plan is described in Section 4.1.3.1.
5.4.2 Tools and Techniques for Scope Verification.1 Inspection. Inspection includes activities such as measuring, examining, and
testing undertaken to determine whether results conform to requirements.Inspections are variously called reviews, product reviews, audits, and walk-throughs; in some application areas, these different terms have narrow and spe-cific meanings.
5.4.3 Outputs from Scope Verification.1 Formal acceptance. Documentation that the client or sponsor has accepted the
product of the project phase or major deliverable(s) must be prepared and dis-tributed. Such acceptance may be conditional, especially at the end of a phase.
5.5 SCOPE CHANGE CONTROLScope change control is concerned with a) influencing the factors that createscope changes to ensure that changes are agreed upon, b) determining that ascope change has occurred, and c) managing the actual changes when and if theyoccur. Scope change control must be thoroughly integrated with the other con-trol processes (schedule control, cost control, quality control, and others, as dis-cussed in Section 4.3).
.1
.2
.3
.4
Work breakdown structurePerformance reportsChange requestsScope management plan
.1
.2
.3
Scope change controlPerformance measurementAdditional planning
.1
.2
.3
.4
Scope changesCorrective actionLessons learnedAdjusted baseline
Inputs Tools & Techniques Outputs
A Guide to the Project Management Body of Knowledge (PMBOK® Guide) 2000 Edition©2000 Project Management Institute, Four Campus Boulevard, Newtown Square, PA 19073-3299 USA
use limited to: Old Dominion University. Downloaded on September 15,2010 at 18:15:01 UTC from IEEE Xplore. Restrictions apply.

Chapter 5—Project Scope Management
A Guide to the Project M©2000 Project Manage
Authorized licensed
5.5.1 Inputs to Scope Change Control.1 Work breakdown structure. The WBS is described in Section 5.3.3.1. It defines the
project’s scope baseline..2 Performance reports. Performance reports, discussed in Section 10.3.3.1, provide
information on scope performance, such as which interim deliverables have beencompleted and which have not. Performance reports may also alert the projectteam to issues that may cause problems in the future.
.3 Change requests. Change requests may occur in many forms—oral or written,direct or indirect, externally or internally initiated, and legally mandated oroptional. Changes may require expanding the scope or may allow shrinking it.Most change requests are the result of:■ An external event (e.g., a change in a government regulation).■ An error or omission in defining the scope of the product (e.g., failure to
include a required feature in the design of a telecommunications system).■ An error or omission in defining the scope of the project (e.g., using a BOM
instead of a WBS).■ A value-adding change (e.g., an environmental remediation project is able to
reduce costs by taking advantage of technology that was not available whenthe scope was originally defined).
■ Implementing a contingency plan or workaround plan to respond to a risk, asdescribed in Section 11.6.3.3.
.4 Scope management plan. The scope management plan is described in Section5.2.3.3.
5.5.2 Tools and Techniques for Scope Change Control.1 Scope change control. A scope change control defines the procedures by which
the project scope may be changed. It includes the paperwork, tracking systems,and approval levels necessary for authorizing changes. The scope change controlshould be integrated with the integrated change control described in Section 4.3and, in particular, with any system or systems in place to control product scope.When the project is done under contract, the scope change control must alsocomply with all relevant contractual provisions.
.2 Performance measurement. Performance measurement techniques, described inSection 10.3.2, help to assess the magnitude of any variations that do occur. Deter-mining what is causing the variance relative to the baseline and deciding if thevariance requires corrective action are important parts of scope change control.
.3 Additional planning. Few projects run exactly according to plan. Prospectivescope changes may require modifications to the WBS or analysis of alternativeapproaches (see Sections 5.3.3.1 and 5.2.2.3, respectively).
5.5.3 Outputs from Scope Change Control.1 Scope changes. A scope change is any modification to the agreed-upon project
scope as defined by the approved WBS. Scope changes often require adjustmentsto cost, time, quality, or other project objectives.
Project scope changes are fed back through the planning process, technicaland planning documents are updated as needed, and stakeholders are notified asappropriate.
anagement Body of Knowledge (PMBOK® Guide) 2000 Editionment Institute, Four Campus Boulevard, Newtown Square, PA 19073-3299 USA 63
use limited to: Old Dominion University. Downloaded on September 15,2010 at 18:15:01 UTC from IEEE Xplore. Restrictions apply.

Chapter 5—Project Scope Management
64
5.5.
3.2
|6.
1
Authorized licensed use l
.2 Corrective action. Corrective action is anything done to bring expected futureproject performance in line with the project plan.
.3 Lessons learned. The causes of variances, the reasoning behind the correctiveaction chosen, and other types of lessons learned from scope change controlshould be documented, so that this information becomes part of the historicaldatabase for both this project and other projects of the performing organization.
.4 Adjusted baseline. Depending upon the nature of the change, the correspondingbaseline document may be revised and reissued to reflect the approved changeand form the new baseline for future changes.
A Guide to the Project Management Body of Knowledge (PMBOK® Guide) 2000 Edition©2000 Project Management Institute, Four Campus Boulevard, Newtown Square, PA 19073-3299 USA
imited to: Old Dominion University. Downloaded on September 15,2010 at 18:15:01 UTC from IEEE Xplore. Restrictions apply.

Chapter 6
Project Time Management
A Guide to the Project Manage©2000 Project Management I
Authorized licensed use li
Project Time Management includes the processes required to ensure timely com-pletion of the project. Figure 6-1 provides an overview of the following majorprocesses in developing the project time schedule:
6.1 Activity Definition—identifying the specific activities that must be performed toproduce the various project deliverables.6.2 Activity Sequencing—identifying and documenting interactivity dependencies.6.3 Activity Duration Estimating—estimating the number of work periods that will
be needed to complete individual activities.6.4 Schedule Development—analyzing activity sequences, activity durations, and
resource requirements to create the project schedule.6.5 Schedule Control—controlling changes to the project schedule.
These processes interact with each other and with the processes in the otherknowledge areas as well. Each process may involve effort from one or more indi-viduals or groups of individuals, based on the needs of the project. Each processgenerally occurs at least once in every project phase.
Although the processes are presented here as discrete elements with well-defined interfaces, in practice they may overlap and interact in ways not detailedhere. Process interactions are discussed in detail in Chapter 3.
On some projects, especially smaller ones, activity sequencing, activity dura-tion estimating, and schedule development are so tightly linked that they areviewed as a single process (e.g., they may be performed by a single individualover a relatively short period of time). They are presented here as distinctprocesses because the tools and techniques for each are different.
6.1 ACTIVITY DEFINITIONActivity definition involves identifying and documenting the specific activitiesthat must be performed to produce the deliverables and subdeliverables identi-fied in the Work Breakdown Structure (WBS). Implicit in this process is the needto define the activities such that the project objectives will be met.
ment Body of Knowledge (PMBOK® Guide) 2000 Editionnstitute, Four Campus Boulevard, Newtown Square, PA 19073-3299 USA 65
mited to: Old Dominion University. Downloaded on September 15,2010 at 18:15:01 UTC from IEEE Xplore. Restrictions apply.

A Guide to the Project Management Body of Knowledge (PMBOK® Guide) 2000 Edition©2000 Project Management Institute, Four Campus Boulevard, Newtown Square, PA 19073-3299 USA
Chapter 6—Project Time Management
66
Figure 6–1. Project Time Management Overview
6.2 Activity Sequencing 6.3 Activity DurationEstimating
6.1
.1 Work breakdownstructure
.2 Scope statement
.3 Historical information
.4 Constraints
.5 Assumptions
.6 Expert judgment
.1 Decomposition
.2 Templates
.1 Activity list
.2 Supporting detail
.3 Work breakdownstructure updates
.1 Inputs
.2 Tools and Techniques
.3 Outputs
.1 Activity list
.2 Product description
.3 Mandatory dependencies
.4 Discretionarydependencies
.5 External dependencies
.6 Milestones
.1 Precedence diagrammingmethod (PDM)
.2 Arrow diagrammingmethod (ADM)
.3 Conditional diagrammingmethods
.4 Network templates
.1 Project network diagrams
.2 Activity list updates
.1 Inputs
.2 Tools and Techniques
.3 Outputs
.1 Inputs
.2 Tools and Techniques
.3 Outputs
.1 Activity list
.2 Constraints
.3 Assumptions
.4 Resource requirements
.5 Resource capabilities
.6 Historical information
.7 Identified risks
.1 Expert judgment
.2 Analogous estimating
.3 Quantitatively baseddurations
.4 Reserve time(contingency)
.1 Activity duration estimates
.2 Basis of estimates
.3 Activity list updates
Activity Definition
6.5 Schedule Control6.4
.1 Inputs
.2 Tools and Techniques
.3 Outputs
.1 Project network diagrams
.2 Activity duration estimates
.3 Resource requirements
.4 Resource pool description
.5 Calendars
.6 Constraints
.7 Assumptions
.8 Leads and lags
.9 Risk management plan.10 Activity attributes
.1 Mathematical analysis
.2 Duration compression
.3 Simulation
.4 Resource leveling heuristics
.5 Project managementsoftware
.6 Coding structure
.1 Project schedule
.2 Supporting detail
.3 Schedule managementplan
.4 Resource requirementupdates
.1 Inputs
.2 Tools and Techniques
.3 Outputs
.1 Project schedule
.2 Performance reports
.3 Change requests
.4 Schedule managementplan
.1 Schedule changecontrol system
.2 Performancemeasurement
.3 Additional planning
.4 Project managementsoftware
.5 Variance analysis
.1 Schedule updates
.2 Corrective action
.3 Lessons learned
Schedule Development
PROJECT TIMEMANAGEMENT
Figu
re 6
–1|
6.1.
3.1
Authorized licensed use limited to: Old Dominion University. Downloaded on September 15,2010 at 18:15:01 UTC from IEEE Xplore. Restrictions apply.

Chapter 6—Project Time Management
A Guide to the Project Ma©2000 Project Managem
Authorized licensed
6.1.1 Inputs to Activity Definition.1 Work breakdown structure. The WBS is the primary input to activity definition
(see Section 5.3.3.1 for a more detailed discussion of the WBS)..2 Scope statement. The project justification and the project objectives contained
in the scope statement must be considered explicitly during activity definition(see Section 5.2.3.1 for a more detailed discussion of the scope statement).
.3 Historical information. Historical information (what activities were actuallyrequired on previous, similar projects) should be considered in defining projectactivities.
.4 Constraints. Constraints are factors that will limit the project management team’soptions; an example would be the use of desired maximum activity durations.
.5 Assumptions. See Section 4.1.1.5.
.6 Expert judgment. Expert judgment is discussed in Sections 5.1.2.2 and 6.3.2.1.
6.1.2 Tools and Techniques for Activity Definition.1 Decomposition. Within the context of the process of Activity Definition, decom-
position involves subdividing project work packages into smaller, more manage-able components to provide better management control. The technique ofdecomposition is described in more detail in Section 5.3.2.2. The major differ-ence between decomposition here and in Scope Definition is that the final out-puts here are described as activities rather than as deliverables. The WBS and theactivity list are usually developed sequentially, with the WBS being the basis fordevelopment of the final activity list. In some application areas, the WBS and theactivity list are developed concurrently.
.2 Templates. An activity list (described in Section 6.1.3.1), or a portion of anactivity list from a previous project, is often usable as a template for a newproject. The activities in templates can also contain a list of resource skills andtheir required hours of effort, identification of risks, expected deliverables, andother descriptive information.
6.1.3 Outputs from Activity Definition.1 Activity list. The activity list must include all activities that will be performed on
the project. It should be organized as an extension to the WBS to help ensure thatit is complete, and that it does not include any activities that are not required as
.1
.2
.3
.4
.5
.6
Work breakdown structureScope statementHistorical informationConstraintsAssumptionsExpert judgment
.1
.2DecompositionTemplates
.1
.2
.3
Activity listSupporting detailWork breakdown structureupdates
Inputs Tools & Techniques Outputs
nagement Body of Knowledge (PMBOK® Guide) 2000 Editionent Institute, Four Campus Boulevard, Newtown Square, PA 19073-3299 USA 67
use limited to: Old Dominion University. Downloaded on September 15,2010 at 18:15:01 UTC from IEEE Xplore. Restrictions apply.

Chapter 6—Project Time Management
68
6.1.
3.2
|6.
2.2.
1
Authorized licensed
part of the project scope. As with the WBS, the activity list should includedescriptions of each activity to ensure that the project team members will under-stand how the work is to be done.
.2 Supporting detail. Supporting detail for the activity list should be documentedand organized as needed to facilitate its use by other project managementprocesses. Supporting detail should always include documentation of all identi-fied assumptions and constraints. The amount of additional detail varies by appli-cation area.
.3 Work breakdown structure updates. In using the WBS to identify which activitiesare needed, the project team may identify missing deliverables, or may determinethat the deliverable descriptions need to be clarified or corrected. Any suchupdates must be reflected in the WBS and related documentation, such as costestimates. These updates are often called refinements and are most likely whenthe project involves new or unproven technology.
6.2 ACTIVITY SEQUENCINGActivity sequencing involves identifying and documenting interactivity logicalrelationships. Activities must be sequenced accurately to support later develop-ment of a realistic and achievable schedule. Sequencing can be performed withthe aid of a computer (e.g., by using project management software) or withmanual techniques. Manual techniques are often more effective on smaller proj-ects and in the early phases of larger ones when little detail is available. Manualand automated techniques may also be used in combination.
6.2.1 Inputs to Activity Sequencing.1 Activity list. The activity list is described in Section 6.1.3.1..2 Product description. The product description is discussed in Section 5.1.1.1.
Product characteristics often affect activity sequencing (e.g., the physical layoutof a plant to be constructed, subsystem interfaces on a software project). Whilethese effects are often apparent in the activity list, the product description shouldgenerally be reviewed to ensure accuracy.
.3 Mandatory dependencies. Mandatory dependencies are those that are inherentin the nature of the work being done. They often involve physical limitations.(On a construction project, it is impossible to erect the superstructure until afterthe foundation has been built; on an electronics project, a prototype must be builtbefore it can be tested.) Mandatory dependencies are also called hard logic.
.1
.2
.3
.4
.5
.6
Activity listProduct descriptionMandatory dependenciesDiscretionarydependenciesExternal dependenciesMilestones
.1
.2
.3
.4
Precedence diagrammingmethod (PDM)Arrow diagrammingmethod (ADM)Conditional diagrammingmethodsNetwork templates
.1
.2Project network diagramsActivity list updates
Inputs Tools & Techniques Outputs
A Guide to the Project Management Body of Knowledge (PMBOK® Guide) 2000 Edition©2000 Project Management Institute, Four Campus Boulevard, Newtown Square, PA 19073-3299 USA
use limited to: Old Dominion University. Downloaded on September 15,2010 at 18:15:01 UTC from IEEE Xplore. Restrictions apply.

Chapter 6—Project Time Management
A Guide to the Project Mana©2000 Project Managemen
Figure 6–2. Network Logic Diagram Drawn Using the Precedence Diagramming Method
C
F
A
D
B
E
Start Finish
Authorized licensed use
.4 Discretionary dependencies. Discretionary dependencies are those that aredefined by the project management team. They should be used with care (andfully documented), since they may limit later scheduling options. Discretionarydependencies are usually defined based on knowledge of:■ “Best practices” within a particular application area.■ Some unusual aspect of the project where a specific sequence is desired, even
though there are other acceptable sequences.Discretionary dependencies may also be called preferred logic, preferential
logic, or soft logic..5 External dependencies. External dependencies are those that involve a relation-
ship between project activities and nonproject activities. For example, the testingactivity in a software project may be dependent on delivery of hardware from anexternal source, or environmental hearings may need to be held before sitepreparation can begin on a construction project.
.6 Milestones. Milestone events need to be part of the activity sequencing to assurethat the requirements for meeting the milestone(s) are met.
6.2.2 Tools and Techniques for Activity Sequencing.1 Precedence diagramming method (PDM). This is a method of constructing a project
network diagram that uses boxes or rectangles (nodes) to represent the activities andconnects them with arrows that show the dependencies (see also Section 6.2.3.1).Figure 6-2 shows a simple network logic diagram drawn using PDM. This techniqueis also called activity-on-node (AON) and is the method used by most project man-agement software packages. PDM can be done manually or on a computer.
It includes four types of dependencies or precedence relationships:■ Finish-to-start—the initiation of the work of the successor depends upon the
completion of the work of the predecessor.■ Finish-to-finish—the completion of the work of the successor depends upon
the completion of the work of the predecessor.■ Start-to-start—the initiation of the work of the successor depends upon the
initiation of the work of the predecessor.■ Start-to-finish—the completion of the successor is dependent upon the initi-
ation of the predecessor.In PDM, finish-to-start is the most commonly used type of logical relationship.
Start-to-finish relationships are rarely used, and then typically only by profes-sional scheduling engineers. Using start-to-start, finish-to-finish, or start-to-finishrelationships with project management software can produce unexpected results,since these types of relationships have not been consistently implemented.
gement Body of Knowledge (PMBOK® Guide) 2000 Editiont Institute, Four Campus Boulevard, Newtown Square, PA 19073-3299 USA 69
limited to: Old Dominion University. Downloaded on September 15,2010 at 18:15:01 UTC from IEEE Xplore. Restrictions apply.

Chapter 6—Project Time Management
70
Figure 6–3. Network Logic Diagram Drawn Using the Arrow Diagramming Method
Start
A
D
B
E
C
FFinish
The dashed line represents a dummy activity.
Figu
re 6
–3|
6.3.
1.4
Authorized licensed use
.2 Arrow diagramming method (ADM). This method of constructing a project net-work diagram uses arrows to represent the activities and connects them at nodesto show their dependencies (see also Section 6.2.3.1). Figure 6-3 shows a simplenetwork logic diagram drawn using ADM. This technique is also called activity-on-arrow (AOA) and, although less prevalent than PDM, is still the technique ofchoice in some application areas. ADM uses only finish-to-start dependencies andmay require the use of dummy activities to define all logical relationships cor-rectly. ADM can be done manually or on a computer.
.3 Conditional diagramming methods. Diagramming techniques such as GraphicalEvaluation and Review Technique (GERT) and System Dynamics models allowfor nonsequential activities such as loops (e.g., a test that must be repeated morethan once) or conditional branches (e.g., a design update that is only needed ifthe inspection detects errors). Neither PDM nor ADM allows loops or conditionalbranches.
.4 Network templates. Standardized networks can be used to expedite the prepara-tion of project network diagrams. They can include an entire project or only a por-tion of it. Portions of a network are often referred to as subnets or fragnets. Subnetsare especially useful when a project includes several identical or nearly identicalfeatures, such as floors on a high-rise office building, clinical trials on a pharma-ceutical research project, program modules on a software project, or the start-upphase of a development project.
6.2.3 Outputs from Activity Sequencing.1 Project network diagrams. Project network diagrams are schematic displays of the
project’s activities and the logical relationships (dependencies) among them. Fig-ures 6-2 and 6-3 illustrate two different approaches to drawing a project net-work diagram. A project network diagram may be produced manually or on acomputer. It may include full project details, or have one or more summary activ-ities (hammocks). The diagram should be accompanied by a summary narrativethat describes the basic sequencing approach. Any unusual sequences should befully described.
A project network diagram is often referred to as a PERT chart. HistoricallyPERT (Program Evaluation and Review Technique) was a specific type of networkdiagram (see also Section 6.4.2.1).
A Guide to the Project Management Body of Knowledge (PMBOK® Guide) 2000 Edition©2000 Project Management Institute, Four Campus Boulevard, Newtown Square, PA 19073-3299 USA
limited to: Old Dominion University. Downloaded on September 15,2010 at 18:15:01 UTC from IEEE Xplore. Restrictions apply.

Chapter 6—Project Time Management
A Guide to the Project M©2000 Project Manage
Authorized licensed
.2 Activity list updates. In much the same manner that the activity definition processmay generate updates to the WBS, preparation of project network diagrams mayreveal instances where an activity must be divided or otherwise redefined to dia-gram the correct logical relationships.
6.3 ACTIVITY DURATION ESTIMATINGActivity duration estimating is the process of taking information on project scopeand resources and then developing durations for input to schedules. The inputsfor the estimates of duration typically originate from the person or group on theproject team who is most familiar with the nature of a specific activity. The esti-mate is often progressively elaborated, and the process considers the quality andavailability of the input data. Thus, the estimate can be assumed to be progres-sively more accurate and of known quality. The person or group on the projectteam who is most familiar with the nature of a specific activity should make, orat least approve, the estimate.
Estimating the number of work periods required to complete an activity willoften require consideration of elapsed time as well. For example, if “concretecuring” will require four days of elapsed time, it may require from two to fourwork periods, based on a) which day of the week it begins, and b) whether or notweekend days are treated as work periods. Most computerized scheduling soft-ware will handle this problem by using alternative work-period calendars.
Overall project duration may also be estimated using the tools and techniquespresented here, but it is more properly calculated as the output of schedule devel-opment (described in Section 6.4). The project team can consider the projectduration a probability distribution (using probabilistic techniques) or as a single-point estimate (using deterministic techniques).
6.3.1 Inputs to Activity Duration Estimating.1 Activity list. The activity list is described in Section 6.1.3.1..2 Constraints. Constraints are described in Section 6.1.1.4..3 Assumptions. Assumptions are described in Section 4.1.1.5. An example would
be reporting periods for the duration of the project that could dictate maximumdurations, i.e., two reporting periods.
.4 Resource requirements. Resource requirements are described in Section 7.1.3.1.The duration of most activities will be significantly influenced by the resourcesassigned to them. For example, two people working together may be able to
.1
.2
.3
.4
.5
.6
.7
Activity listConstraintsAssumptionsResource requirementsResource capabilitiesHistorical informationIdentified risks
.1
.2
.3
.4
Expert judgmentAnalogous estimatingQuantitatively baseddurationsReserve time (contingency)
.1
.2
.3
Activity duration estimatesBasis of estimatesActivity list updates
Inputs Tools & Techniques Outputs
anagement Body of Knowledge (PMBOK® Guide) 2000 Editionment Institute, Four Campus Boulevard, Newtown Square, PA 19073-3299 USA 71
use limited to: Old Dominion University. Downloaded on September 15,2010 at 18:15:01 UTC from IEEE Xplore. Restrictions apply.

Chapter 6—Project Time Management
72
6.3.
1.5
|6.
4
Authorized licensed us
complete a design activity in half the time it takes either of them individually,while a person working half time on an activity will generally take at least twiceas much time as the same person working full time. However, as additionalresources are added, projects can experience communication overload, whichreduces productivity and causes production to improve proportionally less thanthe increase in resource.
.5 Resource capabilities. The duration of most activities will be significantly influ-enced by the capabilities of the human and material resources assigned to them.For example, if both are assigned full time, a senior staff member can generallybe expected to complete a given activity in less time than a junior staff member.
.6 Historical information. Historical information on the likely durations of many cat-egories of activities is often available from one or more of the following sources:■ Project files—one or more of the organizations involved in the project may
maintain records of previous project results that are detailed enough to aid indeveloping duration estimates. In some application areas, individual teammembers may maintain such records.
■ Commercial duration estimating databases—historical information is oftenavailable commercially. These databases tend to be especially useful whenactivity durations are not driven by the actual work content (e.g., how longit takes concrete to cure; how long a government agency usually takes torespond to certain types of requests).
■ Project team knowledge—the individual members of the project team mayremember previous actuals or estimates. While such recollections may beuseful, they are generally far less reliable than documented results.
.7 Identified risks. The project team considers information on identified risks (seeSection 11.2) when producing estimates of activity durations, since risks (eitherthreats or opportunities) can have a significant influence on duration. The projectteam considers the extent to which the effect of risks is included in the baselineduration estimate for each activity, including risks with high probabilities orimpact.
6.3.2 Tools and Techniques for Activity Duration Estimating.1 Expert judgment. Expert judgment is described in Section 5.1.2.2. Durations are
often difficult to estimate because of the number of factors that can influencethem (e.g., resource levels, resource productivity). Expert judgment guided byhistorical information should be used whenever possible. If such expertise is notavailable, the estimates are inherently uncertain and risky (see Chapter 11,Project Risk Management).
.2 Analogous estimating. Analogous estimating, also called top-down estimating,means using the actual duration of a previous, similar activity as the basis forestimating the duration of a future activity. It is frequently used to estimateproject duration when there is a limited amount of detailed information aboutthe project (e.g., in the early phases). Analogous estimating is a form of expertjudgment (described in Section 6.3.2.1).
Analogous estimating is most reliable when a) the previous activities are sim-ilar in fact and not just in appearance, and b) the individuals preparing the esti-mates have the needed expertise.
A Guide to the Project Management Body of Knowledge (PMBOK® Guide) 2000 Edition©2000 Project Management Institute, Four Campus Boulevard, Newtown Square, PA 19073-3299 USA
e limited to: Old Dominion University. Downloaded on September 15,2010 at 18:15:01 UTC from IEEE Xplore. Restrictions apply.

Chapter 6—Project Time Management
A Guide to the Project Mana©2000 Project Manageme
Authorized licensed us
.3 Quantitatively based durations. The quantities to be performed for each specificwork category (i.e., number of drawing, meters of cable, tons of steel, etc.)defined by the engineering/design effort, when multiplied by the productivityunit rate (i.e., hours per drawing, meters of cable per hour, etc.), can be used toestimate activity durations.
.4 Reserve time (contingency). Project teams may choose to incorporate an addi-tional time frame, called time reserve, contingency, or buffer, that can be added tothe activity duration or elsewhere in the schedule as recognition of schedule risk.This reserve time can be a percentage of the estimated duration, or a fixednumber of work periods. The reserve time can later be reduced or eliminated, asmore precise information about the project becomes available. Such reserve timeshould be documented along with other data and assumptions.
6.3.3 Outputs from Activity Duration Estimating.1 Activity duration estimates. Activity duration estimates are quantitative assess-
ments of the likely number of work periods that will be required to complete anactivity.
Activity duration estimates should always include some indication of the rangeof possible results. For example:■ 2 weeks ± 2 days to indicate that the activity will take at least eight days and
no more than twelve (assuming a five-day workweek).■ 15 percent probability of exceeding three weeks to indicate a high proba-
bility—85 percent—that the activity will take three weeks or less.Chapter 11 on Project Risk Management includes a more detailed discussion
of estimating uncertainty..2 Basis of estimates. Assumptions made in developing the estimates must be doc-
umented..3 Activity list updates. Activity list updates are described in Section 6.2.3.2.
6.4 SCHEDULE DEVELOPMENTSchedule development means determining start and finish dates for project activ-ities. If the start and finish dates are not realistic, then the project is unlikely tobe finished as scheduled. The schedule development process must often be iter-ated (along with the processes that provide inputs, especially duration estimatingand cost estimating) prior to determination of the project schedule.
.1
.2
.3
.4
.5
.6
.7
.8
.9.10
Project network diagramsActivity duration estimatesResource requirementsResource pool descriptionCalendarsConstraintsAssumptionsLeads and lagsRisk management planActivity attributes
.1
.2
.3
.4
.5
.6
Mathematical analysisDuration compressionSimulationResource levelingheuristicsProject managementsoftwareCoding structure
.1
.2
.3
.4
Project scheduleSupporting detailSchedule managementplanResource requirementupdates
Inputs Tools & Techniques Outputs
gement Body of Knowledge (PMBOK® Guide) 2000 Editionnt Institute, Four Campus Boulevard, Newtown Square, PA 19073-3299 USA 73
e limited to: Old Dominion University. Downloaded on September 15,2010 at 18:15:01 UTC from IEEE Xplore. Restrictions apply.

Chapter 6—Project Time Management
74
6.4.
1|
6.4.
2.3
Authorized license
6.4.1 Inputs to Schedule Development.1 Project network diagrams. Project network diagrams are described in Section
6.2.3.1..2 Activity duration estimates. Activity duration estimates are described in Section
6.3.3.1..3 Resource requirements. Resource requirements are described in Section 6.3.1.4..4 Resource pool description. Knowledge of what resources will be available at what
times and in what patterns is necessary for schedule development. For example,shared or critical resources can be especially difficult to schedule since their avail-ability may be highly variable. The amount of detail and the level of specificity inthe resource pool description will vary. For example, one need only know thattwo consultants will be available in a particular time frame for preliminaryschedule development of a consulting project. The final schedule for the sameproject, however, identifies which specific consultants will be available.
.5 Calendars. Project and resource calendars identify periods when work is allowed.Project calendars affect all resources (e.g., some projects will work only duringnormal business hours, while others will work a full three shifts). A five-dayworkweek is an example of calendar usage. Resource calendars affect a specificresource or category of resources (e.g., a project team member may be on vaca-tion or in a training program; a labor contract may limit certain workers to cer-tain days of the week).
.6 Constraints. Constraints are factors that will limit the project management team’soptions. There are two major categories of time constraints considered duringschedule development:■ Imposed dates—imposed dates on activity starts or finishes can be used to
restrict the start or finish to occur either no earlier than a specified date or nolater than a specified date. While all four date constraints are typically avail-able in project management software, the “Start No Earlier Than” and the“Finish No Later Than” constraints are the most commonly used. Typical usesof date constraints include such situations as a market window on a tech-nology project, weather restrictions on outdoor activities, government-man-dated compliance with environmental remediation, delivery of material fromparties not represented in the project schedule, etc.
■ Key events or major milestones—completion of certain deliverables by a spec-ified date may be requested by the project sponsor, the project customer, orother stakeholders. Once scheduled, these dates become expected and oftenmay be moved only with great difficulty. Milestones may also be used to indi-cate interfaces with work outside of the project. Such work is typically not inthe project database, and milestones with constraint dates can provide theappropriate schedule interface.
.7 Assumptions. See Section 4.1.1.5.
.8 Leads and lags. Any of the dependencies may require specification of a lead or alag to accurately define the relationship. An example of a lag: there might be adesire to schedule a two-week delay (lag) between ordering a piece of equipmentand installing or using it. An example of a lead, in a finish-to-start dependencywith a ten-day lead: the successor activity starts ten days before the predecessorhas completed.
.9 Risk management plan. The risk management plan is discussed in 11.1.3..10 Activity attributes. Attributes of the activities—including responsibility (i.e., who
will perform the work), geographic area or building (where the work has to beperformed), and activity type (i.e., summary or detailed)—are very important for
A Guide to the Project Management Body of Knowledge (PMBOK® Guide) 2000 Edition©2000 Project Management Institute, Four Campus Boulevard, Newtown Square, PA 19073-3299 USA
d use limited to: Old Dominion University. Downloaded on September 15,2010 at 18:15:01 UTC from IEEE Xplore. Restrictions apply.

Chapter 6—Project Time Management
A Guide to the Project Mana©2000 Project Manageme
Authorized licensed us
further selection and sorting of the planned activities in a convenient way for theusers. WBS classification is also an important attribute that allows useful activityordering and sorting.
6.4.2 Tools and Techniques for Schedule Development.1 Mathematical analysis. Mathematical analysis involves calculating theoretical
early and late start and finish dates for all project activities without regard forany resource pool limitations. The resulting dates are not the schedule, but ratherindicate the time periods within which the activity could be scheduled givenresource limits and other known constraints. The most widely known mathemat-ical analysis techniques are:■ Critical Path Method (CPM)—calculates a single, deterministic early and late
start and finish date for each activity based on specified, sequential networklogic and a single duration estimate. The focus of CPM is calculating float todetermine which activities have the least scheduling flexibility. The underlyingCPM algorithms are often used in other types of mathematical analysis.
■ Graphical Evaluation and Review Technique (GERT)—allows for probabilistictreatment of both network logic and activity duration estimates (i.e., someactivities may not be performed at all, some may be performed only in part,and others may be performed more than once).
■ Program Evaluation and Review Technique (PERT)—uses a weighted averageduration estimate to calculate activity durations. Although there are surfacedifferences, PERT differs from CPM primarily in that it uses the distribution’smean (expected value) instead of the most likely estimate originally used inCPM (see Figure 6-4). PERT itself is seldom used today.
.2 Duration compression. Duration compression is a special case of mathematicalanalysis that looks for ways to shorten the project schedule without changing theproject scope (e.g., to meet imposed dates or other schedule objectives). Dura-tion compression includes techniques such as:■ Crashing—in which cost and schedule tradeoffs are analyzed to determine
how, if at all, to obtain the greatest amount of compression for the least incre-mental cost. Crashing does not always produce a viable alternative and oftenresults in increased cost.
■ Fast tracking—doing activities in parallel that would normally be done insequence (e.g., starting to write code on a software project before the designis complete, or starting to build the foundation for a petroleum processingplant before the 25 percent engineering point is reached). Fast tracking oftenresults in rework and usually increases risk.
.3 Simulation. Simulation involves calculating multiple project durations with dif-ferent sets of activity assumptions. The most common technique is Monte CarloAnalysis, in which a distribution of probable results is defined for each activityand used to calculate a distribution of probable results for the total project (seealso Section 11.4.2.4). In addition, what-if analyses can be made using the logicnetwork to simulate different scenarios, such as delaying a major componentdelivery, extending specific engineering durations, or introducing external factors(such as a strike, or a change in the permitting process). The outcome of thewhat-if simulations can be used to assess the feasibility of the schedule underadverse conditions, and in preparing contingency/response plans to overcome ormitigate the impact of unexpected situations.
gement Body of Knowledge (PMBOK® Guide) 2000 Editionnt Institute, Four Campus Boulevard, Newtown Square, PA 19073-3299 USA 75
e limited to: Old Dominion University. Downloaded on September 15,2010 at 18:15:01 UTC from IEEE Xplore. Restrictions apply.

Chapter 6—Project Time Management
76
Figure 6–4. PERT Duration Calculation for a Single Activity
( )
Possible Durations
Probability ofOccurrence
Shorter
Optimistic
Most Likely(used in original CPM calculations)
Beta Distribution
Pessimistic
Longer
PERT Weighted Average =Optimistic + 4 × Most Likely + Pessimistic
6
Lower
Higher
Figu
re 6
–4|
6.4.
3.1
Authorized licensed u
.4 Resource leveling heuristics. Mathematical analysis often produces a preliminaryearly-start schedule that requires more resources during certain time periods thanare available, or requires changes in resource levels that are not manageable.Heuristics, such as, “Allocate scarce resources to critical path activities first,” canbe applied to develop a schedule that reflects such constraints. Resource levelingoften results in a project duration that is longer than the preliminary schedule.This technique is sometimes called the resource-based method, especially whenimplemented with computerized optimization. Resource reallocation from non-critical to critical activities is a common way to bring the schedule back, or asclose as possible, to its originally intended overall duration. Utilization ofextended hours, weekends, or multiple shifts should also be considered to reducethe durations of critical activities. Productivity increases based on the use of dif-ferent technologies and/or machinery (i.e., automatic welding, electrical pipecutters, etc.) are another way to shorten durations that have extended the pre-liminary schedule. Fact tracking, if feasible (as described in Section 6.4.2.2), isanother way to reduce the overall project duration. Some projects may have afinite and critical project resource, requiring that this resource be scheduled inreverse from the project ending date; this is known as reverse resource allocationscheduling. Critical chain is a technique that modifies the project schedule toaccount for limited resources.
.5 Project management software. Project management software is widely used toassist with schedule development. Other software may be capable of interactingdirectly or indirectly within themselves, or with other software, to carry out therequirements of other knowledge areas. These products automate the calculation
A Guide to the Project Management Body of Knowledge (PMBOK® Guide) 2000 Edition©2000 Project Management Institute, Four Campus Boulevard, Newtown Square, PA 19073-3299 USA
se limited to: Old Dominion University. Downloaded on September 15,2010 at 18:15:01 UTC from IEEE Xplore. Restrictions apply.

Chapter 6—Project Time Management
A Guide to the Project Mana©2000 Project Managemen
Figure 6–5. Project Network Diagram with Dates
WriteManual
CodeEntries
UnitTest
CodeUpdateDesign
CodeQuery
UnitTest
UnitTest
SystemTest
15 Aug1 Aug
16 Jul 31 Jul
1 Jul 15 Jul
24 Jun 30 Jun
16 Jun 15 Jul
16 Jun 23 Jun
16 Jun 30 Jun
16 Jun
1 Jun 15 Jun
15 Jul
There are many other acceptable ways to display date information on a project network diagram.This figure shows start and finish dates without time-of-day information.
Authorized licensed us
of the mathematical analysis and resource leveling, and thus allow for rapid con-sideration of many schedule alternatives. They are also widely used to print ordisplay the outputs of schedule development.
.6 Coding structure. The activities should have a coding structure that will allowsorting and/or extractions based on different attributes assigned to the activities,such as responsibility, geographic area or building, project phase, schedule level,activity type, and WBS classification.
6.4.3 Outputs from Schedule Development.1 Project schedule. The project schedule includes at least planned start and expected
finish dates for each activity. (Note: The project schedule remains preliminary untilresource assignments have been confirmed. This would usually happen no laterthan the completion of Project Plan Development, Section 4.1.)
The project schedule may be presented in summary form (the master schedule),or in detail. Although it can be presented in tabular form, it is more often pre-sented graphically, using one or more of the following formats:■ Project network diagrams with date information added (see Figure 6-5). These
charts usually show both the project logic and the project’s critical path activ-ities (see Section 6.2.3.1 for more information on project network diagrams).
gement Body of Knowledge (PMBOK® Guide) 2000 Editiont Institute, Four Campus Boulevard, Newtown Square, PA 19073-3299 USA 77
e limited to: Old Dominion University. Downloaded on September 15,2010 at 18:15:01 UTC from IEEE Xplore. Restrictions apply.

Chapter 6—Project Time Management
78
Figure 6–6. Bar (Gantt) Chart
Activity A
Activity B
Activity C
Activity D
Jun
Time
Jul Aug Sep Oct Nov
There are many other acceptable ways to display project information on a bar chart.
Figu
re 6
–6|
6.5.
1.1
Authorized licensed use lim
■ Bar charts, also called Gantt charts (see Figure 6-6), show activity start andend dates, as well as expected durations, and sometimes show dependencies.They are relatively easy to read, and are frequently used in management pre-sentations.
■ Milestone charts (see Figure 6-7) are similar to bar charts, but only identifythe scheduled start or completion of major deliverables and key external inter-faces.
.2 Supporting detail. Supporting detail for the project schedule includes at least doc-umentation of all identified assumptions and constraints. The amount of addi-tional detail varies by application area. For example:■ On a construction project, it will most likely include such items as resource
histograms, cash-flow projections, and order and delivery schedules.■ On an electronics project, it will most likely include resource histograms only.
Information frequently supplied as supporting detail includes, but is not lim-ited to:■ Resource requirements by time period, often in the form of a resource histo-
gram.■ Alternative schedules (e.g., best case or worst case, resource leveled or not,
with or without imposed dates).■ Schedule contingency reserves (see Section 11.4).
.3 Schedule management plan. A schedule management plan defines how changesto the schedule will be managed. It may be formal or informal, highly detailed orbroadly framed, based on the needs of the project. It is a subsidiary element ofthe overall project plan (see Section 4.1).
.4 Resource requirement updates. Resource leveling updates may have a significanteffect on preliminary estimates of resource requirements.
A Guide to the Project Management Body of Knowledge (PMBOK® Guide) 2000 Edition©2000 Project Management Institute, Four Campus Boulevard, Newtown Square, PA 19073-3299 USA
ited to: Old Dominion University. Downloaded on September 15,2010 at 18:15:01 UTC from IEEE Xplore. Restrictions apply.

Chapter 6—Project Time Management
A Guide to the Project Mana©2000 Project Managemen
Figure 6–7. Milestone Chart
Event
Subcontracts Signed
Specifications Finalized
Design Reviewed
Subsystem Tested
First Unit Delivered
Production Plan Completed
FebJan Mar
CurrentDate
May Jun Jul AugApr
There are many other acceptable ways to display project information on a milestone chart.
Planned Actual
Authorized licensed us
6.5 SCHEDULE CONTROLSchedule control is concerned with a) influencing the factors that create schedulechanges to ensure that changes are agreed upon, b) determining that theschedule has changed, and c) managing the actual changes when and as theyoccur. Schedule control must be thoroughly integrated with the other controlprocesses, as described in Section 4.3, Integrated Change Control.
6.5.1 Inputs to Schedule Control.1 Project schedule. The project schedule is described in Section 6.4.3.1. The
approved project schedule, called the schedule baseline (which must be feasibletechnically and in terms of resources), is a component of the project plandescribed in Section 4.1.3.1. It provides the basis for measuring and reportingschedule performance.
.1
.2
.3
.4
Project schedulePerformance reportsChange requestsSchedule managementplan
.1
.2
.3
.4
.5
Schedule change controlsystemPerformance measurementAdditional planningProject managementsoftwareVariance analysis
.1
.2
.3
Schedule updatesCorrective actionLessons learned
Inputs Tools & Techniques Outputs
gement Body of Knowledge (PMBOK® Guide) 2000 Editiont Institute, Four Campus Boulevard, Newtown Square, PA 19073-3299 USA 79
e limited to: Old Dominion University. Downloaded on September 15,2010 at 18:15:01 UTC from IEEE Xplore. Restrictions apply.

Chapter 6—Project Time Management
80
6.5.
5.2
|6.
5.3.
3
Authorized licensed u
.2 Performance reports. Performance reports, discussed in Section 10.3.3.1, provideinformation on schedule performance, such as which planned dates have beenmet and which have not. Performance reports may also alert the project team toissues that may cause problems in the future.
.3 Change requests. Change requests may occur in many forms—oral or written,direct or indirect, externally or internally initiated, and legally mandated oroptional. Changes may require extending the schedule or may allow acceleratingit (see Section 4.3.1.3).
.4 Schedule management plan. The schedule management plan is described in Section6.4.3.3.
6.5.2 Tools and Techniques for Schedule Control.1 Schedule change control system. A schedule change control system defines the
procedures by which the project schedule may be changed. It includes the paper-work, tracking systems, and approval levels necessary for authorizing changes.Schedule change control should be integrated with the integrated change controlsystem described in Section 4.3.
.2 Performance measurement. Performance measurement techniques such as thosedescribed in Section 10.3.2 help to assess the magnitude of any variations thatdo occur. An important part of schedule control is to decide if the schedule vari-ation requires corrective action. For example, a major delay on a noncriticalactivity may have little effect on the overall project, while a much shorter delayon a critical or near-critical activity may require immediate action.
.3 Additional planning. Few projects run exactly according to plan. Prospectivechanges may require new or revised activity duration estimates, modified activitysequences, or analysis of alternative schedules.
.4 Project management software. Project management software is described in Sec-tion 6.4.2.5. The ability of project management software to track planned datesversus actual dates and to forecast the effects of schedule changes, real or poten-tial, makes it a useful tool for schedule control.
.5 Variance analysis. Performance of the variance analysis during the schedule-mon-itoring process is a key element for time control. Comparing target dates with theactual/forecast start and finish dates provides useful information for the detectionof deviations and for the implementation of corrective solutions in case of delays.The float variance is also an essential planning component to evaluate projecttime-performance. Particular attention has to be given to critical and subcriticalactivities (i.e., analyzing the ten subcritical paths, in order of ascending float).
6.5.3 Outputs from Schedule Control.1 Schedule updates. A schedule update is any modification to the schedule infor-
mation that is used to manage the project. Appropriate stakeholders must benotified as needed. Schedule updates may or may not require adjustments toother aspects of the project plan.
Revisions are a special category of schedule updates. Revisions are changes tothe schedule start and finish dates in the approved project schedule. Thesechanges are generally incorporated in response to scope changes or changes toestimates. In some cases, schedule delays may be so severe that rebaselining is
A Guide to the Project Management Body of Knowledge (PMBOK® Guide) 2000 Edition©2000 Project Management Institute, Four Campus Boulevard, Newtown Square, PA 19073-3299 USA
se limited to: Old Dominion University. Downloaded on September 15,2010 at 18:15:01 UTC from IEEE Xplore. Restrictions apply.

Chapter 6—Project Time Management
A Guide to the Project Managem©2000 Project Management Ins
Authorized licensed use lim
needed to provide realistic data to measure performance. However, care must betaken before rebaselining, as historical data will be lost for the project schedule.Rebaselining should only be used as a last resort in controlling the schedule; newtarget schedules should be the normal mode of schedule revision.
.2 Corrective action. Corrective action is anything done to bring expected futureschedule performance in line with the project plan. Corrective action in the areaof time management often involves expediting: special actions taken to ensurecompletion of an activity on time or with the least possible delay. Correctiveaction frequently requires root-cause analysis to identify the cause of the varia-tion, and schedule recovery can be planned and executed for activities delineatedlater in the schedule and need not only address the activity causing the deviation.
.3 Lessons learned. The causes of variances, the reasoning behind the correctiveaction chosen, and other types of lessons learned from schedule control shouldbe documented, so that they become part of the historical database for both thisproject and other projects of the performing organization.
ent Body of Knowledge (PMBOK® Guide) 2000 Editiontitute, Four Campus Boulevard, Newtown Square, PA 19073-3299 USA 81
ited to: Old Dominion University. Downloaded on September 15,2010 at 18:15:01 UTC from IEEE Xplore. Restrictions apply.

Chapter 7
Project Cost Management
A Guide to the Project Management©2000 Project Management Institu
Authorized licensed use limited
Project Cost Management includes the processes required to ensure that theproject is completed within the approved budget. Figure 7-1 provides an overviewof the following major processes:
7.1 Resource Planning—determining what resources (people, equipment, mate-rials) and what quantities of each should be used to perform project activities.7.2 Cost Estimating—developing an approximation (estimate) of the costs of the
resources needed to complete project activities.7.3 Cost Budgeting—allocating the overall cost estimate to individual work activities.7.4 Cost Control—controlling changes to the project budget.
These processes interact with each other and with the processes in the otherknowledge areas as well. Each process may involve effort from one or more indi-viduals or groups of individuals, based on the needs of the project. Each processgenerally occurs at least once in every project phase.
Although the processes are presented here as discrete elements with well-defined interfaces, in practice they may overlap and interact in ways not detailedhere. Process interactions are discussed in detail in Chapter 3.
Project cost management is primarily concerned with the cost of the resourcesneeded to complete project activities. However, project cost management shouldalso consider the effect of project decisions on the cost of using the project’sproduct. For example, limiting the number of design reviews may reduce the costof the project at the expense of an increase in the customer’s operating costs. Thisbroader view of project cost management is often called life-cycle costing. Life-cycle costing together with Value Engineering techniques are used to reduce costand time, improve quality and performance, and optimize the decision-making.
In many application areas, predicting and analyzing the prospective financialperformance of the project’s product is done outside the project. In others (e.g.,capital facilities projects), project cost management also includes this work.When such predictions and analyses are included, project cost management willinclude additional processes and numerous general management techniques suchas return on investment, discounted cash flow, payback analysis, and others.
Project cost management should consider the information needs of the projectstakeholders—different stakeholders may measure project costs in different waysand at different times. For example, the cost of a procurement item may be mea-sured when committed, ordered, delivered, incurred, or recorded for accountingpurposes.
Body of Knowledge (PMBOK® Guide) 2000 Editionte, Four Campus Boulevard, Newtown Square, PA 19073-3299 USA 83
to: Old Dominion University. Downloaded on September 15,2010 at 18:15:01 UTC from IEEE Xplore. Restrictions apply.

A Guide to the Project Management Body of Knowledge (PMBOK® Guide) 2000 Edition©2000 Project Management Institute, Four Campus Boulevard, Newtown Square, PA 19073-3299 USA
Chapter 7—Project Cost Management
84
Figure 7–1. Project Cost Management Overview
PROJECT COSTMANAGEMENT
7.2 Cost Estimating 7.3 Cost Budgeting7.1
.1 Inputs
.2 Tools and Techniques
.3 Outputs
.1 Work breakdownstructure
.2 Historical information
.3 Scope statement
.4 Resource pooldescription
.5 Organizational policies
.6 Activity durationestimates
.1 Expert judgment
.2 Alternatives identification
.3 Project managementsoftware
.1 Resource requirements
.1 Inputs
.2 Tools and Techniques
.3 Outputs
.1 Work breakdownstructure
.2 Resource requirements
.3 Resource rates
.4 Activity duration estimates
.5 Estimating publications
.6 Historical information
.7 Chart of accounts
.1 Analogous estimating
.2 Parametric modeling
.3 Bottom-up estimating
.4 Computerized tools
.5 Other cost estimatingmethods
.1 Cost estimates
.2 Supporting detail
.3 Cost management plan
.8 Risks
.1 Inputs
.2 Tools and Techniques
.3 Outputs
.1 Cost estimates
.2 Work breakdownstructure
.3 Project schedule
.4 Risk management plan
.1 Cost budgeting toolsand techniques
.1 Cost baseline
Resource Planning
7.4
.1 Inputs
.2 Tools and Techniques
.3 Outputs
.1 Cost baseline
.2 Performance reports
.3 Change requests
.4 Cost management plan
.1 Cost change controlsystem
.2 Performancemeasurement
.3 Earned valuemanagement (EVM)
.4 Additional planning
.5 Computerized tools
.1 Revised cost estimates
.2 Budget updates
.3 Corrective action
.4 Estimate at completion
.5 Project closeout
.6 Lessons learned
Cost Control
Figu
re 7
–1|
7.1.
1.2
Authorized licensed use limited to: Old Dominion University. Downloaded on September 15,2010 at 18:15:01 UTC from IEEE Xplore. Restrictions apply.

Chapter 7—Project Cost Management
A Guide to the Project Mana©2000 Project Managemen
Authorized licensed use
When project costs are used as a component of a reward and recognitionsystem (discussed in Section 9.3.2.3), controllable and uncontrollable costsshould be estimated and budgeted separately to ensure that rewards reflectactual performance.
On some projects, especially smaller ones, resource planning, cost estimating,and cost budgeting are so tightly linked that they are viewed as a single process(e.g., they may be performed by a single individual over a relatively short periodof time). They are presented here as distinct processes because the tools andtechniques for each are different. The ability to influence cost is greatest at theearly stages of the project, and this is why early scope definition is critical, as wellas thorough requirements identification and execution of a sound plan.
7.1 RESOURCE PLANNINGResource planning involves determining what physical resources (people, equip-ment, materials) and what quantities of each should be used and when theywould be needed to perform project activities. It must be closely coordinatedwith cost estimating (described in Section 7.2). For example:■ A construction project team will need to be familiar with local building codes.
Such knowledge is often readily available from local sellers. However, if thelocal labor pool lacks experience with unusual or specialized constructiontechniques, the additional cost for a consultant might be the most effectiveway to secure knowledge of the local building codes.
■ An automotive design team should be familiar with the latest in automatedassembly techniques. The requisite knowledge might be obtained by hiring aconsultant, by sending a designer to a seminar on robotics, or by includingsomeone from manufacturing as a member of the team.
7.1.1 Inputs to Resource Planning.1 Work breakdown structure. The work breakdown structure (WBS, described in
Section 5.3.3.1) identifies the project deliverables and processes that will needresources, and thus is the primary input to resource planning. Any relevant out-puts from other planning processes should be provided through the WBS toensure proper control.
.2 Historical information. Historical information regarding what types of resourceswere required for similar work on previous projects should be used if available.
.1
.2
.3
.4
.5
.6
Work breakdown structureHistorical informationScope statementResource pool descriptionOrganizational policiesActivity duration estimates
.1
.2
.3
Expert judgmentAlternatives identificationProject managementsoftware
.1 Resource requirements
Inputs Tools & Techniques Outputs
gement Body of Knowledge (PMBOK® Guide) 2000 Editiont Institute, Four Campus Boulevard, Newtown Square, PA 19073-3299 USA 85
limited to: Old Dominion University. Downloaded on September 15,2010 at 18:15:01 UTC from IEEE Xplore. Restrictions apply.
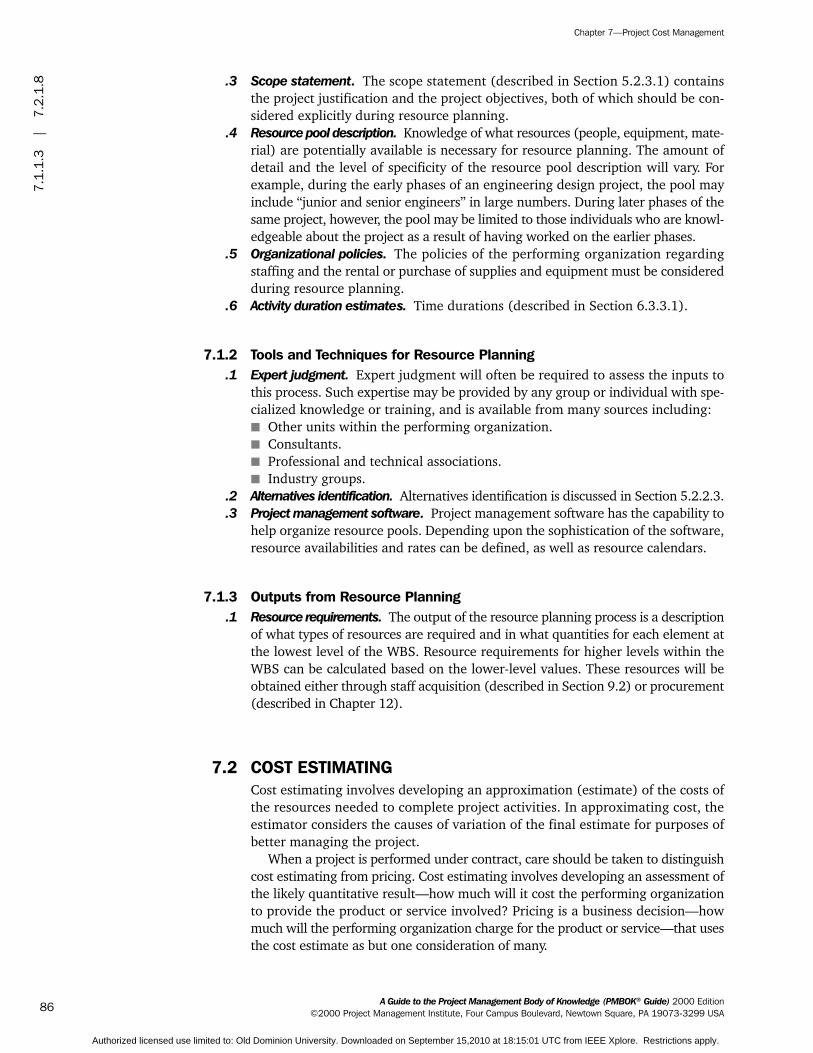
Chapter 7—Project Cost Management
86
7.1.
1.3
|7.
2.1.
8
Authorized licensed use
.3 Scope statement. The scope statement (described in Section 5.2.3.1) containsthe project justification and the project objectives, both of which should be con-sidered explicitly during resource planning.
.4 Resource pool description. Knowledge of what resources (people, equipment, mate-rial) are potentially available is necessary for resource planning. The amount ofdetail and the level of specificity of the resource pool description will vary. Forexample, during the early phases of an engineering design project, the pool mayinclude “junior and senior engineers” in large numbers. During later phases of thesame project, however, the pool may be limited to those individuals who are knowl-edgeable about the project as a result of having worked on the earlier phases.
.5 Organizational policies. The policies of the performing organization regardingstaffing and the rental or purchase of supplies and equipment must be consideredduring resource planning.
.6 Activity duration estimates. Time durations (described in Section 6.3.3.1).
7.1.2 Tools and Techniques for Resource Planning.1 Expert judgment. Expert judgment will often be required to assess the inputs to
this process. Such expertise may be provided by any group or individual with spe-cialized knowledge or training, and is available from many sources including:■ Other units within the performing organization.■ Consultants.■ Professional and technical associations.■ Industry groups.
.2 Alternatives identification. Alternatives identification is discussed in Section 5.2.2.3.
.3 Project management software. Project management software has the capability tohelp organize resource pools. Depending upon the sophistication of the software,resource availabilities and rates can be defined, as well as resource calendars.
7.1.3 Outputs from Resource Planning.1 Resource requirements. The output of the resource planning process is a description
of what types of resources are required and in what quantities for each element atthe lowest level of the WBS. Resource requirements for higher levels within theWBS can be calculated based on the lower-level values. These resources will beobtained either through staff acquisition (described in Section 9.2) or procurement(described in Chapter 12).
7.2 COST ESTIMATINGCost estimating involves developing an approximation (estimate) of the costs ofthe resources needed to complete project activities. In approximating cost, theestimator considers the causes of variation of the final estimate for purposes ofbetter managing the project.
When a project is performed under contract, care should be taken to distinguishcost estimating from pricing. Cost estimating involves developing an assessment ofthe likely quantitative result—how much will it cost the performing organizationto provide the product or service involved? Pricing is a business decision—howmuch will the performing organization charge for the product or service—that usesthe cost estimate as but one consideration of many.
A Guide to the Project Management Body of Knowledge (PMBOK® Guide) 2000 Edition©2000 Project Management Institute, Four Campus Boulevard, Newtown Square, PA 19073-3299 USA
limited to: Old Dominion University. Downloaded on September 15,2010 at 18:15:01 UTC from IEEE Xplore. Restrictions apply.

Chapter 7—Project Cost Management
A Guide to the Project Mana©2000 Project Managemen
Authorized licensed us
Cost estimating includes identifying and considering various costing alterna-tives. For example, in most application areas, additional work during a designphase is widely held to have the potential for reducing the cost of the productionphase. The cost-estimating process must consider whether the cost of the addi-tional design work will be offset by the expected savings.
7.2.1 Inputs to Cost Estimating.1 Work breakdown structure. The WBS is described in Section 5.3.3.1. It is used to orga-
nize the cost estimates and to ensure that all identified work has been estimated..2 Resource requirements. Resource requirements are described in Section 7.1.3.1..3 Resource rates. The individual or group preparing the estimates must know the
unit rates (e.g., staff cost per hour, bulk material cost per cubic yard) for eachresource to calculate project costs. If actual rates are not known, the rates them-selves may have to be estimated.
.4 Activity duration estimates. Activity duration estimates (described in Section 6.3.3.1)will affect cost estimates on any project where the project budget includes anallowance for the cost of financing (i.e., interest charges).
.5 Estimating publications. Commercially available data on cost estimating.
.6 Historical information. Information on the cost of many categories of resources isoften available from one or more of the following sources:■ Project files—one or more of the organizations involved in the project may
maintain records of previous project results that are detailed enough to aid indeveloping cost estimates. In some application areas, individual team mem-bers may maintain such records.
■ Commercial cost-estimating databases—historical information is often avail-able commercially.
■ Project team knowledge—the individual members of the project team may remember previous actuals or estimates. While such recollections may beuseful, they are generally far less reliable than documented results.
.7 Chart of accounts. A chart of accounts describes the coding structure used by theperforming organization to report financial information in its general ledger.Project cost estimates must be assigned to the correct accounting category.
.8 Risks. The project team considers information on risks (see Section 11.2.3.1)when producing cost estimates, since risks (either threats or opportunities) canhave a significant impact on cost. The project team considers the extent to whichthe effect of risk is included in the cost estimates for each activity.
.1
.2
.3
.4
.5
.6
.7
.8
Work breakdown structureResource requirementsResource ratesActivity duration estimatesEstimating publicationsHistorical informationChart of accountsRisks
.1
.2
.3
.4
.5
Analogous estimatingParametric modelingBottom-up estimatingComputerized toolsOther cost estimating methods
.1
.2
.3
Cost estimatesSupporting detailCost management plan
Inputs Tools & Techniques Outputs
gement Body of Knowledge (PMBOK® Guide) 2000 Editiont Institute, Four Campus Boulevard, Newtown Square, PA 19073-3299 USA 87
e limited to: Old Dominion University. Downloaded on September 15,2010 at 18:15:01 UTC from IEEE Xplore. Restrictions apply.
Chapter 7—Project Cost Management
88
7.2.
2|
7.3.
1.2
Authorized licensed
7.2.2 Tools and Techniques for Cost Estimating.1 Analogous estimating. Analogous estimating, also called top-down estimating,
means using the actual cost of a previous, similar project as the basis for esti-mating the cost of the current project. It is frequently used to estimate totalproject costs when there is a limited amount of detailed information about theproject (e.g., in the early phases). Analogous estimating is a form of expert judg-ment (described in Section 7.1.2.1).
Analogous estimating is generally less costly than other techniques, but it isalso generally less accurate. It is most reliable when a) the previous projects aresimilar in fact and not just in appearance, and b) the individuals or groupspreparing the estimates have the needed expertise.
.2 Parametric modeling. Parametric modeling involves using project characteristics(parameters) in a mathematical model to predict project costs. Models may besimple (residential home construction will cost a certain amount per square footof living space) or complex (one model of software development costs uses thir-teen separate adjustment factors, each of which has five to seven points on it).
Both the cost and accuracy of parametric models vary widely. They are mostlikely to be reliable when a) the historical information used to develop the modelwas accurate, b) the parameters used in the model are readily quantifiable, andc) the model is scalable (i.e., it works as well for a very large project as for a verysmall one).
.3 Bottom-up estimating. This technique involves estimating the cost of individualactivities or work packages, then summarizing or rolling up the individual esti-mates to get a project total.
The cost and accuracy of bottom-up estimating is driven by the size and com-plexity of the individual activity or work package: smaller activities increase bothcost and accuracy of the estimating process. The project management team mustweigh the additional accuracy against the additional cost.
.4 Computerized tools. Computerized tools, such as project management softwarespreadsheets and simulation/statistical tools, are widely used to assist with costestimating. Such products can simplify the use of the tools described earlier andthereby facilitate rapid consideration of many costing alternatives.
.5 Other cost estimating methods. For example, vendor bid analysis.
7.2.3 Outputs from Cost Estimating.1 Cost estimates. Cost estimates are quantitative assessments of the likely costs of
the resources required to complete project activities. They may be presented insummary or in detail.
Costs must be estimated for all resources that will be charged to the project.This includes, but is not limited to, labor, materials, supplies, and special cate-gories such as an inflation allowance or cost reserve.
Cost estimates are generally expressed in units of currency (dollars, euros,yen, etc.) to facilitate comparisons both within and across projects. In some cases,the estimator may use units of measure to estimate cost, such as staff hours orstaff days, along with their cost estimates to facilitate appropriate managementcontrol. Cost estimating generally includes considering appropriate risk responseplanning, such as contingency plans.
A Guide to the Project Management Body of Knowledge (PMBOK® Guide) 2000 Edition©2000 Project Management Institute, Four Campus Boulevard, Newtown Square, PA 19073-3299 USA
use limited to: Old Dominion University. Downloaded on September 15,2010 at 18:15:01 UTC from IEEE Xplore. Restrictions apply.

Chapter 7—Project Cost Management
A Guide to the Project Manage©2000 Project Management
Authorized licensed use l
Cost estimates may benefit from being refined during the course of the projectto reflect the additional detail available. In some application areas, there areguidelines for when such refinements should be made and what degree of accu-racy is expected. For example, The Association for the Advancement of Cost Engi-neering (AACE) International has identified a progression of five types ofestimates of construction costs during engineering: order of magnitude, concep-tual, preliminary, definitive, and control.
.2 Supporting detail. Supporting detail for the cost estimates should include:■ A description of the scope of work estimated. This is often provided by a ref-
erence to the WBS.■ Documentation of the basis for the estimate; i.e., how it was developed.■ Documentation of any assumptions made.■ An indication of the range of possible results; for example, $10,000 ± $1,000
to indicate that the item is expected to cost between $9,000 and $11,000.The amount and type of additional details vary by application area. Retaining
even rough notes may prove valuable by providing a better understanding of howthe estimate was developed.
.3 Cost management plan. The cost management plan describes how cost varianceswill be managed (e.g., different responses to major problems than to minorones). A cost management plan may be formal or informal, highly detailed orbroadly framed, based on the needs of the project stakeholders. It is a subsidiaryelement of the project plan (discussed in Section 4.1.3.1).
7.3 COST BUDGETINGCost budgeting involves allocating the overall cost estimates to individual activi-ties or work packages to establish a cost baseline for measuring project perfor-mance. Reality may dictate that estimates are done after budgetary approval isprovided, but estimates should be done prior to budget request wherever possible.
7.3.1 Inputs to Cost Budgeting.1 Cost estimates. Cost estimates are described in Section 7.2.3.1..2 Work breakdown structure. The WBS (described in Section 5.3.3.1) identifies the
project elements to which costs will be allocated.
.1
.2
.3
.4
Cost estimatesWork breakdown structureProject scheduleRisk management plan
.1 Cost budgetingtools and techniques
.1 Cost baseline
Inputs Tools & Techniques Outputs
ment Body of Knowledge (PMBOK® Guide) 2000 EditionInstitute, Four Campus Boulevard, Newtown Square, PA 19073-3299 USA 89
imited to: Old Dominion University. Downloaded on September 15,2010 at 18:15:01 UTC from IEEE Xplore. Restrictions apply.

Chapter 7—Project Cost Management
90
Figure 7–2. Illustrative Cost Baseline Display
Time
ExpectedCashFlow
CostBaseline
CumulativeValues
Figu
re 7
–2|
7.4.
2.2
Authorized licensed use
.3 Project schedule. The project schedule (described in Section 6.4.3.1) includesplanned start and expected finish dates for the project components to which costswill be allocated. This information is needed to assign costs to the time periodwhen the cost will be incurred.
.4 Risk management plan. The risk management plan is discussed in Section 11.1.3.In addition to this, the risk management plan often includes cost contingency,which can be determined on the basis of the expected accuracy of the estimate.
7.3.2 Tools and Techniques for Cost Budgeting.1 Cost budgeting tools and techniques. The tools and techniques described in Sec-
tion 7.2.2 for developing project cost estimates are used to develop budgets foractivities or work packages as well.
7.3.3 Outputs from Cost Budgeting.1 Cost baseline. The cost baseline is a time-phased budget that will be used to
measure and monitor cost performance on the project. It is developed by sum-ming estimated costs by period and is usually displayed in the form of an S-curve,as illustrated in Figure 7-2.
Many projects, especially larger ones, may have multiple cost baselines tomeasure different aspects of cost performance. For example, a spending plan orcash-flow forecast is a cost baseline for measuring disbursements.
7.4 COST CONTROLCost control is concerned with a) influencing the factors that create changes tothe cost baseline to ensure that changes are agreed upon, b) determining that thecost baseline has changed, and c) managing the actual changes when and as theyoccur. Cost control includes:
A Guide to the Project Management Body of Knowledge (PMBOK® Guide) 2000 Edition©2000 Project Management Institute, Four Campus Boulevard, Newtown Square, PA 19073-3299 USA
limited to: Old Dominion University. Downloaded on September 15,2010 at 18:15:01 UTC from IEEE Xplore. Restrictions apply.
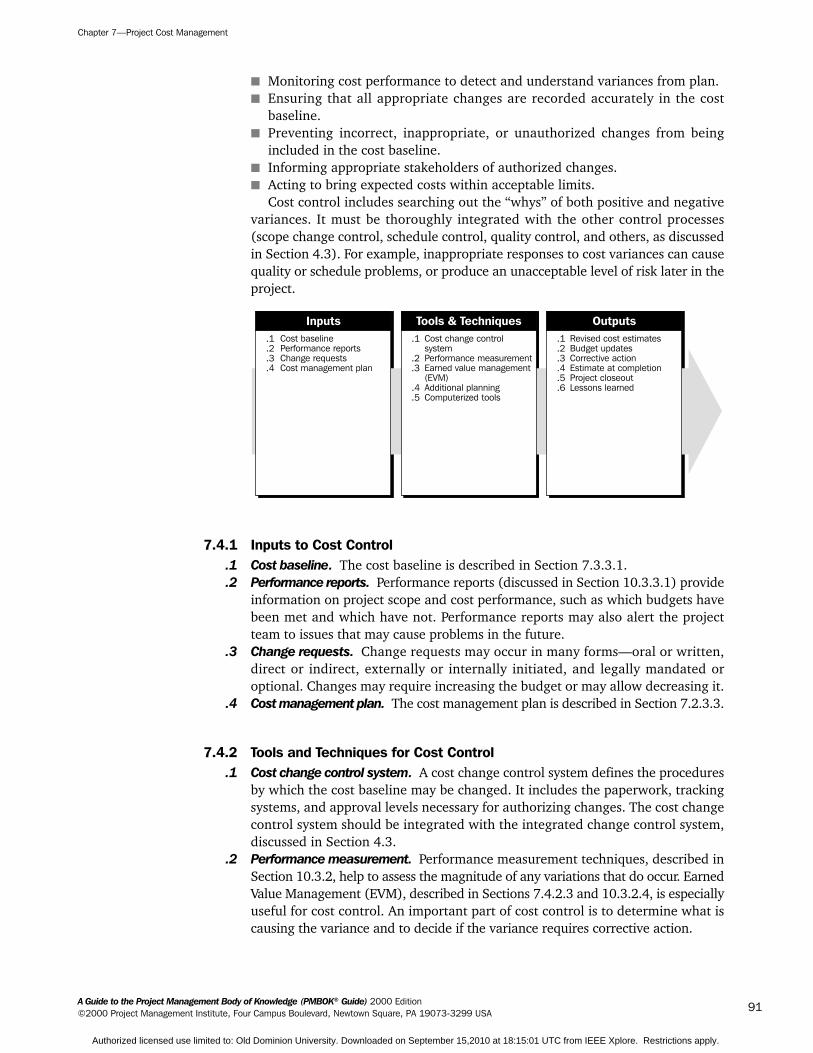
Chapter 7—Project Cost Management
A Guide to the Project Mana©2000 Project Manageme
Authorized licensed us
■ Monitoring cost performance to detect and understand variances from plan.■ Ensuring that all appropriate changes are recorded accurately in the cost
baseline.■ Preventing incorrect, inappropriate, or unauthorized changes from being
included in the cost baseline.■ Informing appropriate stakeholders of authorized changes.■ Acting to bring expected costs within acceptable limits.
Cost control includes searching out the “whys” of both positive and negativevariances. It must be thoroughly integrated with the other control processes(scope change control, schedule control, quality control, and others, as discussedin Section 4.3). For example, inappropriate responses to cost variances can causequality or schedule problems, or produce an unacceptable level of risk later in theproject.
7.4.1 Inputs to Cost Control.1 Cost baseline. The cost baseline is described in Section 7.3.3.1..2 Performance reports. Performance reports (discussed in Section 10.3.3.1) provide
information on project scope and cost performance, such as which budgets havebeen met and which have not. Performance reports may also alert the projectteam to issues that may cause problems in the future.
.3 Change requests. Change requests may occur in many forms—oral or written,direct or indirect, externally or internally initiated, and legally mandated oroptional. Changes may require increasing the budget or may allow decreasing it.
.4 Cost management plan. The cost management plan is described in Section 7.2.3.3.
7.4.2 Tools and Techniques for Cost Control.1 Cost change control system. A cost change control system defines the procedures
by which the cost baseline may be changed. It includes the paperwork, trackingsystems, and approval levels necessary for authorizing changes. The cost changecontrol system should be integrated with the integrated change control system,discussed in Section 4.3.
.2 Performance measurement. Performance measurement techniques, described inSection 10.3.2, help to assess the magnitude of any variations that do occur. EarnedValue Management (EVM), described in Sections 7.4.2.3 and 10.3.2.4, is especiallyuseful for cost control. An important part of cost control is to determine what iscausing the variance and to decide if the variance requires corrective action.
.1
.2
.3
.4
Cost baselinePerformance reportsChange requestsCost management plan
.1
.2
.3
.4
.5
Cost change controlsystemPerformance measurementEarned value management(EVM)Additional planningComputerized tools
.1
.2
.3
.4
.5
.6
Revised cost estimatesBudget updatesCorrective actionEstimate at completionProject closeoutLessons learned
Inputs Tools & Techniques Outputs
gement Body of Knowledge (PMBOK® Guide) 2000 Editionnt Institute, Four Campus Boulevard, Newtown Square, PA 19073-3299 USA 91
e limited to: Old Dominion University. Downloaded on September 15,2010 at 18:15:01 UTC from IEEE Xplore. Restrictions apply.

Chapter 7—Project Cost Management
92
7.4.
2.3
|7.
4.3.
6
Authorized licensed use l
.3 Earned value management (EVM). All EVM Control Account Plans (CAPs) mustcontinuously measure project performance by relating three independent vari-ables: 1) The Planned Value, the physical work scheduled to be performed,including the estimated value of this work (previously called the Budgeted Costsfor Work Scheduled [BCWS]), as compared against the 2) The Earned Value,physical work actually accomplished, including the estimated value of this work(previously called the Budgeted Costs for Work Performed [BCWP]), and to the3) Actual Costs incurred to accomplish the Earned Value. The relationship of 2)Earned Value less 1) Planned Value constitutes the Schedule Variance (SV). Therelationship of 2) Earned Value less 3) Actual Costs constitutes the Cost Variance(CV) for the project. See also Section 10.3.2.4.
.4 Additional planning. Few projects run exactly according to plan. Prospective changesmay require new or revised cost estimates or analysis of alternative approaches.
.5 Computerized tools. Computerized tools, such as project management softwareand spreadsheets, are often used to track planned costs versus actual costs, andto forecast the effects of cost changes.
7.4.3 Outputs from Cost Control.1 Revised cost estimates. Revised cost estimates are modifications to the cost
information used to manage the project. Appropriate stakeholders must be noti-fied as needed. Revised cost estimates may or may not require adjustments toother aspects of the project plan.
.2 Budget updates. Budget updates are a special category of revised cost estimates.Budget updates are changes to an approved cost baseline. These numbers are gen-erally revised only in response to scope changes. In some cases, cost variancesmay be so severe that rebaselining is needed to provide a realistic measure ofperformance.
.3 Corrective action. Corrective action is anything done to bring expected futureproject performance in line with the project plan.
.4 Estimate at completion. An Estimate at Completion (EAC) is a forecast of mostlikely total project costs based on project performance and risk quantification,described in Section 11.4.3. The most common forecasting techniques are somevariation of:■ EAC = Actuals to date plus a new estimate for all remaining work. This
approach is most often used when past performance shows that the originalestimating assumptions were fundamentally flawed, or that they are no longerrelevant to a change in conditions. Formula: EAC = AC + ETC.
■ EAC = Actuals to date plus remaining budget (BAC – EV). This approach ismost often used when current variances are seen as atypical and the projectmanagement team expectations are that similar variances will not occur in thefuture. Formula: EAC = AC + BAC – EV.
■ EAC = Actuals to date plus the remaining project budget (BAC – EV) modifiedby a performance factor, often the cumulative cost performance index (CPI).This approach is most often used when current variances are seen as typicalof future variances. Formula: EAC = (AC + (BAC – EV)/CPI)—this CPI is thecumulative CPI.
A Guide to the Project Management Body of Knowledge (PMBOK® Guide) 2000 Edition©2000 Project Management Institute, Four Campus Boulevard, Newtown Square, PA 19073-3299 USA
imited to: Old Dominion University. Downloaded on September 15,2010 at 18:15:01 UTC from IEEE Xplore. Restrictions apply.
Chapter 7—Project Cost Management
A Guide to the Project Manage©2000 Project Management
Authorized licensed use l
Each of these approaches may be the correct approach for any given projectand will provide the project management team with a signal if the EAC forecastsgo beyond acceptable tolerances.
.5 Project closeout. Processes and procedures should be developed for the closing orcanceling of projects. For example, the Statement of Position (SOP 98-1 issued bythe American Institute of Certified Public Accountants—AICPA) requires that allthe costs for a failed information technology project be written off in the quarterthat the project is canceled.
.6 Lessons learned. The causes of variances, the reasoning behind the correctiveaction chosen, and other types of lessons learned from cost control should bedocumented so that they become part of the historical database for both thisproject and other projects of the performing organization (see Section 4.3.3.3).
ment Body of Knowledge (PMBOK® Guide) 2000 EditionInstitute, Four Campus Boulevard, Newtown Square, PA 19073-3299 USA 93
imited to: Old Dominion University. Downloaded on September 15,2010 at 18:15:01 UTC from IEEE Xplore. Restrictions apply.

Chapter 8
Project Quality Management
A Guide to the Project Management B©2000 Project Management Institut
Authorized licensed use limited
Project Quality Management includes the processes required to ensure that theproject will satisfy the needs for which it was undertaken. It includes “all activi-ties of the overall management function that determine the quality policy, objec-tives, and responsibilities and implements them by means such as qualityplanning, quality assurance, quality control, and quality improvement, within thequality system” (1). Figure 8-1 provides an overview of the following majorproject quality management processes:
8.1 Quality Planning—identifying which quality standards are relevant to the projectand determining how to satisfy them.8.2 Quality Assurance—evaluating overall project performance on a regular basis
to provide confidence that the project will satisfy the relevant quality standards.8.3 Quality Control—monitoring specific project results to determine if they comply
with relevant quality standards and identifying ways to eliminate causes of unsat-isfactory performance.
These processes interact with each other and with the processes in the otherknowledge areas as well. Each process may involve effort from one or more indi-viduals or groups of individuals, based on the needs of the project. Each processgenerally occurs at least once in every project phase.
Although the processes are presented here as discrete elements with well-defined interfaces, in practice they may overlap and interact in ways not detailedhere. Process interactions are discussed in detail in Chapter 3.
The basic approach to quality management described in this section isintended to be compatible with that of the International Organization for Stan-dardization (ISO), as detailed in the ISO 9000 and 10000 series of standards andguidelines. This generalized approach should also be compatible with a) propri-etary approaches to quality management such as those recommended byDeming, Juran, Crosby, and others, and b) nonproprietary approaches such asTotal Quality Management (TQM), Continuous Improvement, and others.
Project quality management must address both the management of the projectand the product of the project. The generic term product is occasionally used, inliterature regarding quality, to refer to both goods and services. Failure to meetquality requirements in either dimension can have serious negative consequencesfor any or all of the project stakeholders. For example:
ody of Knowledge (PMBOK® Guide) 2000 Editione, Four Campus Boulevard, Newtown Square, PA 19073-3299 USA 95
to: Old Dominion University. Downloaded on September 15,2010 at 18:15:01 UTC from IEEE Xplore. Restrictions apply.

Chapter 8—Project Quality Management
96
Figure 8–1. Project Quality Management Overview
PROJECT QUALITYMANAGEMENT
8.2 Quality Assurance 8.3 Quality Control8.1
.1 Inputs
.2 Tools and Techniques
.3 Outputs
.1 Quality policy
.2 Scope statement
.3 Product description
.4 Standards andregulations
.5 Other process outputs
.1 Benefit/cost analysis
.2 Benchmarking
.3 Flow-charting
.4 Design of experiments
.5 Cost of quality
.1 Quality management plan
.2 Operational definitions
.3 Checklists
.4 Inputs to otherprocesses
.1 Inputs
.2 Tools and Techniques
.3 Outputs
.1 Quality management plan
.2 Results of qualitycontrol measurements
.3 Operational definitions
.1 Quality planning toolsand techniques
.2 Quality audits
.1 Quality improvement
.1 Inputs
.2 Tools and Techniques
.3 Outputs
.1 Work results
.2 Quality management plan
.3 Operational definitions
.4 Checklists
.1 Inspection
.2 Control charts
.3 Pareto diagrams
.4 Statistical sampling
.5 Flow-charting
.6 Trend analysis
.1 Quality improvement
.2 Acceptance decisions
.3 Rework
.4 Completed checklists
.5 Process adjustments
Quality Planning
Figu
re 8
–1|
8.1
Authorized licensed use limit
■ Meeting customer requirements by overworking the project team may producenegative consequences in the form of increased employee attrition.
■ Meeting project schedule objectives by rushing planned quality inspectionsmay produce negative consequences when errors go undetected.Quality is “the totality of characteristics of an entity that bear on its ability to
satisfy stated or implied needs” (2). Stated and implied needs are the inputs todeveloping project requirements. A critical aspect of quality management in theproject context is the necessity to turn implied needs into requirements throughproject scope management, which is described in Chapter 5.
The project management team must be careful not to confuse quality withgrade. Grade is “a category or rank given to entities having the same functionaluse but different technical characteristics” (3). Low quality is always a problem;low grade may not be. For example, a software product may be of high quality(no obvious bugs, readable manual) and low grade (a limited number of fea-tures), or of low quality (many bugs, poorly organized user documentation) andhigh grade (numerous features). Determining and delivering the required levelsof both quality and grade are the responsibilities of the project manager and theproject management team.
The project management team should also be aware that modern qualitymanagement complements project management. For example, both disciplinesrecognize the importance of:
A Guide to the Project Management Body of Knowledge (PMBOK® Guide) 2000 Edition©2000 Project Management Institute, Four Campus Boulevard, Newtown Square, PA 19073-3299 USA
ed to: Old Dominion University. Downloaded on September 15,2010 at 18:15:01 UTC from IEEE Xplore. Restrictions apply.

Chapter 8—Project Quality Management
A Guide to the Project Manag©2000 Project Management
Authorized licensed use
■ Customer satisfaction—understanding, managing, and influencing needs so thatcustomer expectations are met. This requires a combination of conformance torequirements (the project must produce what it said it would produce) and fit-ness for use (the product or service produced must satisfy real needs).
■ Prevention over inspection—the cost of preventing mistakes is always muchless than the cost of correcting them, as revealed by inspection.
■ Management responsibility—success requires the participation of all membersof the team, but it remains the responsibility of management to provide theresources needed to succeed.
■ Processes within phases—the repeated plan-do-check-act cycle described byDeming and others is highly similar to the combination of phases andprocesses discussed in Chapter 3, Project Management Processes.In addition, quality improvement initiatives undertaken by the performing
organization (e.g., TQM, Continuous Improvement, and others) can improve thequality of the project’s management as well as the quality of the project’s product.
However, there is an important difference of which the project management teammust be acutely aware—the temporary nature of the project means that investmentsin product quality improvement, especially defect prevention and appraisal, mustoften be borne by the performing organization since the project may not last longenough to reap the rewards.
8.1 QUALITY PLANNINGQuality planning involves identifying which quality standards are relevant to theproject and determining how to satisfy them. It is one of the key facilitatingprocesses during project planning (see Section 3.3.2, Planning Processes) andshould be performed regularly and in parallel with the other project planningprocesses. For example, the changes in the product of the project required tomeet identified quality standards may require cost or schedule adjustments, orthe desired product quality may require a detailed risk analysis of an identifiedproblem. Prior to development of the ISO 9000 Series, the activities describedhere as quality planning were widely discussed as part of quality assurance.
The quality planning techniques discussed here are those most frequently usedon projects. There are many others that may be useful on certain projects or insome application areas.
The project team should also be aware of one of the fundamental tenets ofmodern quality management—quality is planned in, not inspected in.
.1
.2
.3
.4
.5
Quality policyScope statementProduct descriptionStandards and regulationsOther process outputs
.1
.2
.3
.4
.5
Benefit/cost analysisBenchmarkingFlowchartingDesign of experimentsCost of quality
.1
.2
.3
.4
Quality management planOperational definitionsChecklistsInputs to other processes
Inputs Tools & Techniques Outputs
ement Body of Knowledge (PMBOK® Guide) 2000 Edition Institute, Four Campus Boulevard, Newtown Square, PA 19073-3299 USA 97
limited to: Old Dominion University. Downloaded on September 15,2010 at 18:15:01 UTC from IEEE Xplore. Restrictions apply.

Chapter 8—Project Quality Management
98
8.1.
1|
8.1.
3.1
Authorized licensed u
8.1.1 Inputs to Quality Planning.1 Quality policy. Quality policy is “the overall intentions and direction of an orga-
nization with regard to quality, as formally expressed by top management” (4).The quality policy of the performing organization can often be adopted “as is” foruse by the project. However, if the performing organization lacks a formal qualitypolicy, or if the project involves multiple performing organizations (as with a jointventure), then the project management team will need to develop a qualitypolicy for the project.
Regardless of the origin of the quality policy, the project management teamis responsible for ensuring that the project stakeholders are fully aware of it (e.g.,through appropriate information distribution, as described in Section 10.2).
.2 Scope statement. The scope statement (described in Section 5.2.3.1) is a keyinput to quality planning since it documents major project deliverables, as wellas the project objectives that serve to define important stakeholder requirements.
.3 Product description. Although elements of the product description (described inSection 5.1.1.1) may be embodied in the scope statement, the product descrip-tion will often contain details of technical issues and other concerns that mayaffect quality planning.
.4 Standards and regulations. The project management team must consider anyapplication area-specific standards or regulations that may affect the project. Sec-tion 2.5.1 discusses standards and regulations.
.5 Other process outputs. In addition to the scope statement and product descrip-tion, processes in other knowledge areas may produce outputs that should beconsidered as part of quality planning. For example, procurement planning(described in Section 12.1) may identify contractor quality requirements thatshould be reflected in the overall quality management plan.
8.1.2 Tools and Techniques for Quality Planning.1 Benefit/cost analysis. The quality planning process must consider benefit/cost
tradeoffs, as described in Section 5.2.2.2. The primary benefit of meeting qualityrequirements is less rework, which means higher productivity, lower costs, andincreased stakeholder satisfaction. The primary cost of meeting quality require-ments is the expense associated with project quality management activities. It isaxiomatic of the quality management discipline that the benefits outweigh thecosts.
.2 Benchmarking. Benchmarking involves comparing actual or planned projectpractices to those of other projects to generate ideas for improvement and to pro-vide a standard by which to measure performance. The other projects may bewithin the performing organization or outside of it, and may be within the sameapplication area or in another.
.3 Flowcharting. A flow chart is any diagram that shows how various elements of asystem relate. Flowcharting techniques commonly used in quality managementinclude:■ Cause-and-effect diagrams, also called Ishikawa diagrams or fishbone diagrams,
which illustrate how various factors might be linked to potential problems oreffects. Figure 8-2 is an example of a generic cause-and-effect diagram.
■ System or process flow charts, which show how various elements of a systeminterrelate. Figure 8-3 is an example of a process flow chart for design reviews.
A Guide to the Project Management Body of Knowledge (PMBOK® Guide) 2000 Edition©2000 Project Management Institute, Four Campus Boulevard, Newtown Square, PA 19073-3299 USA
se limited to: Old Dominion University. Downloaded on September 15,2010 at 18:15:01 UTC from IEEE Xplore. Restrictions apply.

Chapter 8—Project Quality Management
A Guide to the Project Manage©2000 Project Management
Figure 8–2. Cause-and-Effect Diagram
Energy Measurement Personnel Environment
Time Machine Method Material
MajorDefect
Potential Causes Effect
Authorized licensed use l
Flowcharting can help the project team anticipate what and where qualityproblems might occur, and thus can help develop approaches for dealing withthem.
.4 Design of experiments. Design of experiments is a statistical method that helpsidentify which factors might influence specific variables. The technique is appliedmost frequently to the product of the project (e.g., automotive designers mightwish to determine which combination of suspension and tires will produce themost desirable ride characteristics at a reasonable cost).
However, it can also be applied to project management issues, such as cost andschedule tradeoffs. For example, senior engineers will cost more than junior engi-neers, but can also be expected to complete the assigned work in less time. Anappropriately designed “experiment” (in this case, computing project costs anddurations for various combinations of senior and junior engineers) will often allowdetermination of an optimal solution from a relatively limited number of cases.
.5 Cost of quality. Cost of quality refers to the total cost of all efforts to achieve product/service quality, and includes all work to ensure conformance to requirements, as wellas all work resulting from nonconformance to requirements. There are three types ofcosts that are incurred: prevention costs, appraisal costs, and failure costs, where thelatter is broken down into internal and external costs.
8.1.3 Outputs from Quality Planning.1 Quality management plan. The quality management plan should describe how
the project management team will implement its quality policy. In ISO 9000 ter-minology, it should describe the project quality system: “the organizational struc-ture, responsibilities, procedures, processes, and resources needed to implementquality management” (5).
The quality management plan provides input to the overall project plan(described in Section 4.1, Project Plan Development), and must address qualitycontrol, quality assurance, and quality improvement for the project.
The quality management plan may be formal or informal, highly detailed, orbroadly framed, based on the requirements of the project.
ment Body of Knowledge (PMBOK® Guide) 2000 EditionInstitute, Four Campus Boulevard, Newtown Square, PA 19073-3299 USA 99
imited to: Old Dominion University. Downloaded on September 15,2010 at 18:15:01 UTC from IEEE Xplore. Restrictions apply.

Chapter 8—Project Quality Management
100
Figure 8–3. Sample Process Flowchart
1ProjectRequest
2Compliance
Copy
3DevelopArtworkNO
NO
NO
YES
YES
YES
4Artwork
Approved5
Change Controlfor Specs
6Artwork Out
for Proofs
7Vendors Make
Proofs
8Package
DevelopmentReview/Approval
9QA Review/
Approval 10ApprovedProof Backto Vendor
11Specs Signed
(Package and QA)
12Order Materials
|Fi
gure
8–3
|8.
2.2.
2
Authorized licensed use lim
.2 Operational definitions. An operational definition describes, in very specific terms,what something is and how it is measured by the quality control process. Forexample, it is not enough to say that meeting the planned schedule dates is a mea-sure of management quality; the project management team must also indicatewhether every activity must start on time or only finish on time; whether indi-vidual activities will be measured, or only certain deliverables, and if so, whichones. Operational definitions are also called metrics in some application areas.
A Guide to the Project Management Body of Knowledge (PMBOK® Guide) 2000 Edition©2000 Project Management Institute, Four Campus Boulevard, Newtown Square, PA 19073-3299 USA
ited to: Old Dominion University. Downloaded on September 15,2010 at 18:15:01 UTC from IEEE Xplore. Restrictions apply.

Chapter 8—Project Quality Management
A Guide to the Project Ma©2000 Project Managem
Authorized licensed
.3 Checklists. A checklist is a structured tool, usually item specific, used to verify thata set of required steps has been performed. Checklists may be simple or complex.They are usually phrased as imperatives (“Do this!”) or interrogatories (“Have youdone this?”). Many organizations have standardized checklists available to ensureconsistency in frequently performed tasks. In some application areas, checklistsare also available from professional associations or commercial service providers.
.4 Inputs to other processes. The quality planning process may identify a need forfurther activity in another area.
8.2 QUALITY ASSURANCEQuality assurance is all the planned and systematic activities implemented withinthe quality system to provide confidence that the project will satisfy the relevantquality standards (6). It should be performed throughout the project. Prior todevelopment of the ISO 9000 Series, the activities described under quality plan-ning were widely included as part of quality assurance.
Quality assurance is often provided by a Quality Assurance Department orsimilarly titled organizational unit, but it does not have to be.
Assurance may be provided to the project management team and to the man-agement of the performing organization (internal quality assurance), or it maybe provided to the customer and others not actively involved in the work of theproject (external quality assurance).
8.2.1 Inputs to Quality Assurance.1 Quality management plan. The quality management plan is described in Section
8.1.3.1..2 Results of quality control measurements. Quality control measurements are records
of quality control testing and measurement in a format for comparison and analysis..3 Operational definitions. Operational definitions are described in Section 8.1.3.2.
8.2.2 Tools and Techniques for Quality Assurance.1 Quality planning tools and techniques. The quality planning tools and techniques
described in Section 8.1.2 can be used for quality assurance as well..2 Quality audits. A quality audit is a structured review of other quality management
activities. The objective of a quality audit is to identify lessons learned that canimprove performance of this project or of other projects within the performing
.1
.2
.3
Quality management planResults of quality controlmeasurementsOperational definitions
.1
.2
Quality planning tools andtechniquesQuality audits
.1 Quality improvement
Inputs Tools & Techniques Outputs
nagement Body of Knowledge (PMBOK® Guide) 2000 Editionent Institute, Four Campus Boulevard, Newtown Square, PA 19073-3299 USA 101
use limited to: Old Dominion University. Downloaded on September 15,2010 at 18:15:01 UTC from IEEE Xplore. Restrictions apply.
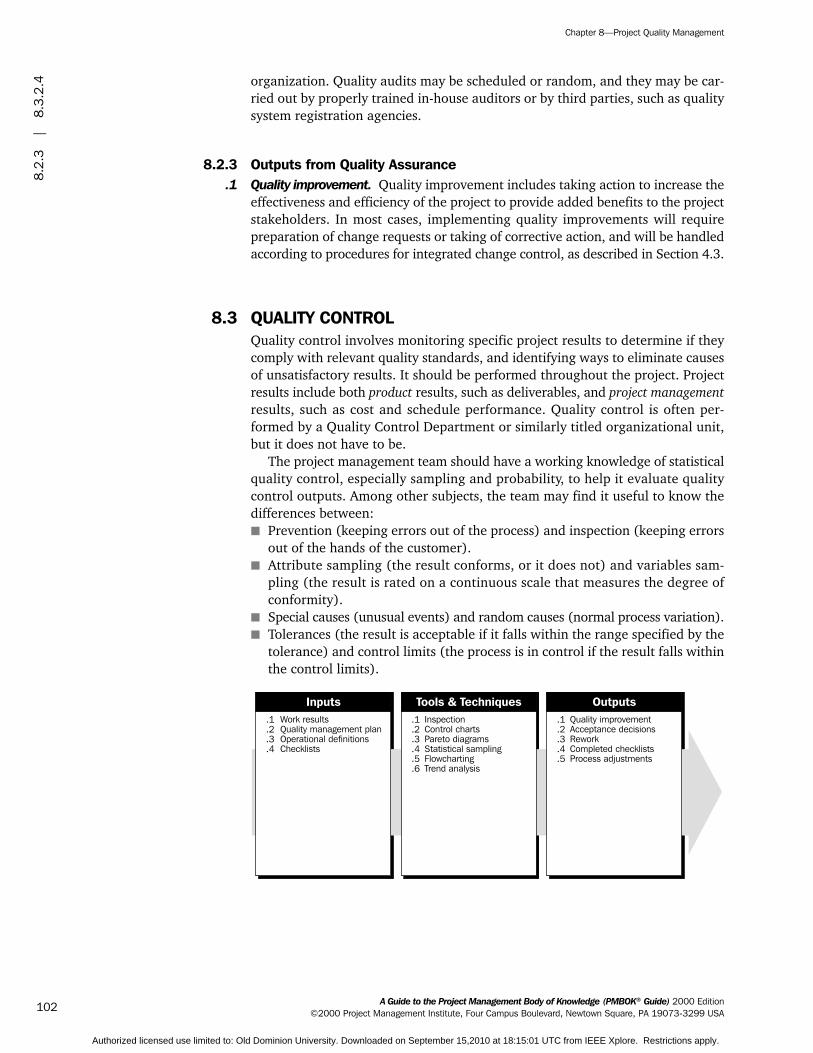
Chapter 8—Project Quality Management
102
8.2.
3|
8.3.
2.4
Authorized licensed us
organization. Quality audits may be scheduled or random, and they may be car-ried out by properly trained in-house auditors or by third parties, such as qualitysystem registration agencies.
8.2.3 Outputs from Quality Assurance.1 Quality improvement. Quality improvement includes taking action to increase the
effectiveness and efficiency of the project to provide added benefits to the projectstakeholders. In most cases, implementing quality improvements will requirepreparation of change requests or taking of corrective action, and will be handledaccording to procedures for integrated change control, as described in Section 4.3.
8.3 QUALITY CONTROLQuality control involves monitoring specific project results to determine if theycomply with relevant quality standards, and identifying ways to eliminate causesof unsatisfactory results. It should be performed throughout the project. Projectresults include both product results, such as deliverables, and project managementresults, such as cost and schedule performance. Quality control is often per-formed by a Quality Control Department or similarly titled organizational unit,but it does not have to be.
The project management team should have a working knowledge of statisticalquality control, especially sampling and probability, to help it evaluate qualitycontrol outputs. Among other subjects, the team may find it useful to know thedifferences between:■ Prevention (keeping errors out of the process) and inspection (keeping errors
out of the hands of the customer).■ Attribute sampling (the result conforms, or it does not) and variables sam-
pling (the result is rated on a continuous scale that measures the degree ofconformity).
■ Special causes (unusual events) and random causes (normal process variation).■ Tolerances (the result is acceptable if it falls within the range specified by the
tolerance) and control limits (the process is in control if the result falls withinthe control limits).
.1
.2
.3
.4
Work resultsQuality management planOperational definitionsChecklists
.1
.2
.3
.4
.5
.6
InspectionControl chartsPareto diagramsStatistical samplingFlowchartingTrend analysis
.1
.2
.3
.4
.5
Quality improvementAcceptance decisionsReworkCompleted checklistsProcess adjustments
Inputs Tools & Techniques Outputs
A Guide to the Project Management Body of Knowledge (PMBOK® Guide) 2000 Edition©2000 Project Management Institute, Four Campus Boulevard, Newtown Square, PA 19073-3299 USA
e limited to: Old Dominion University. Downloaded on September 15,2010 at 18:15:01 UTC from IEEE Xplore. Restrictions apply.

Chapter 8—Project Quality Management
A Guide to the Project M©2000 Project Manage
Authorized licensed
8.3.1 Inputs to Quality Control.1 Work results. Work results (described in Section 4.2.3.1) include both process
results and product results. Information about the planned or expected results(from the project plan) should be available along with information about theactual results.
.2 Quality management plan. The quality management plan is described in Section8.1.3.1.
.3 Operational definitions. Operational definitions are described in Section 8.1.3.2.
.4 Checklists. Checklists are described in Section 8.1.3.3.
8.3.2 Tools and Techniques for Quality Control.1 Inspection. Inspection includes activities such as measuring, examining, and
testing undertaken to determine whether results conform to requirements.Inspections may be conducted at any level (e.g., the results of a single activitymay be inspected, or the final product of the project may be inspected). Inspec-tions are variously called reviews, product reviews, audits, and walkthroughs; insome application areas, these terms have narrow and specific meanings.
.2 Control charts. Control charts are a graphic display of the results, over time, of aprocess. They are used to determine if the process is “in control” (e.g., are dif-ferences in the results created by random variations, or are unusual events occur-ring whose causes must be identified and corrected?). When a process is incontrol, the process should not be adjusted. The process may be changed to pro-vide improvements, but it should not be adjusted when it is in control.
Control charts may be used to monitor any type of output variable. Althoughused most frequently to track repetitive activities, such as manufactured lots, con-trol charts can also be used to monitor cost and schedule variances, volume andfrequency of scope changes, errors in project documents, or other managementresults to help determine if the project management process is in control. Figure8-4 is a control chart of project schedule performance.
.3 Pareto diagrams. A Pareto diagram is a histogram, ordered by frequency of occur-rence, that shows how many results were generated by type or category of identi-fied cause (see Figure 8-5). Rank ordering is used to guide corrective action—theproject team should take action to fix the problems that are causing the greatestnumber of defects first. Pareto diagrams are conceptually related to Pareto’s Law,which holds that a relatively small number of causes will typically produce a largemajority of the problems or defects. This is commonly referred to as the 80/20principle, where 80 percent of the problems are due to 20 percent of the causes.
.4 Statistical sampling. Statistical sampling involves choosing part of a populationof interest for inspection (e.g., selecting ten engineering drawings at randomfrom a list of seventy-five). Appropriate sampling can often reduce the cost ofquality control. There is a substantial body of knowledge on statistical sampling;in some application areas, it is necessary for the project management team to befamiliar with a variety of sampling techniques.
anagement Body of Knowledge (PMBOK® Guide) 2000 Editionment Institute, Four Campus Boulevard, Newtown Square, PA 19073-3299 USA 103
use limited to: Old Dominion University. Downloaded on September 15,2010 at 18:15:01 UTC from IEEE Xplore. Restrictions apply.

Chapter 8—Project Quality Management
104
Figu
re 8
–4|
Figu
re 8
–5
Figure 8–4. Control Chart of Project Schedule Performance
Lower ControlLimit
Upper ControlLimit
–X
The x axis of all control charts consists of sample numbers (usually the time of the sample).Control charts have three common lines:
A center line, designated with an “x–,” which provides the average (x) of the process data.
An upper line designating the upper control limit (UCL), drawn at a calculated distanceabove the center line, showing the upper range of data.
The lower line designating the lower control limit (LCL), which shows the lower range of data.Points outside of the UCL and LCL are indicative that the process is out of control and/or unstable.
I.
II.
III.
Authorized licensed u
.5 Flowcharting. Flowcharting is described in Section 8.1.2.3. Flowcharting is usedin quality control to help analyze how problems occur.
.6 Trend analysis. Trend analysis involves using mathematical techniques to forecastfuture outcomes based on historical results. Trend analysis is often used to monitor:■ Technical performance—how many errors or defects have been identified,
how many remain uncorrected.■ Cost and schedule performance—how many activities per period were com-
pleted with significant variances.
8.3.3 Outputs from Quality Control.1 Quality improvement. Quality improvement is described in Section 8.2.3.1..2 Acceptance decisions. The items inspected will be either accepted or rejected.
Rejected items may require rework (described in Section 8.3.3.3)..3 Rework. Rework is action taken to bring a defective or nonconforming item into
compliance with requirements or specifications. Rework, especially unanticipatedrework, is a frequent cause of project overruns in most application areas. Theproject team should make every reasonable effort to minimize rework.
.4 Completed checklists. See Section 8.1.3.3. When checklists are used, the com-pleted checklists should become part of the project’s records.
.5 Process adjustments. Process adjustments involve immediate corrective or pre-ventive action as a result of quality control measurements. In some cases, theprocess adjustment may need to be handled according to procedures for inte-grated change control, as described in Section 4.3.
A Guide to the Project Management Body of Knowledge (PMBOK® Guide) 2000 Edition©2000 Project Management Institute, Four Campus Boulevard, Newtown Square, PA 19073-3299 USA
se limited to: Old Dominion University. Downloaded on September 15,2010 at 18:15:01 UTC from IEEE Xplore. Restrictions apply.

Chapter 8—Project Quality Management
A Guide to the Project Management Body of Knowledge (PMBOK® Guide) 2000 Edition©2000 Project Management Institute, Four Campus Boulevard, Newtown Square, PA 19073-3299 USA 105
Figure 8–5. Pareto Diagram
Impro
per Rota
tion
40
30
20
100
75
50
25
0
10
0
Noise
Wobble
Pressur
e
Axle Cau
lking
Case W
obbles
Other
Num
ber
of D
efec
tive
Cas
es
Perc
enta
ge o
f D
efec
tive
Cas
es
CumulativePercentage
Frequency by Cause
Car Problems
Authorized licensed use limited to: Old Dominion University. Downloaded on September 15,2010 at 18:15:01 UTC from IEEE Xplore. Restrictions apply.

Chapter 9
Project Human ResourceManagement
A Guide to the Project Manageme©2000 Project Management Insti
Authorized licensed use limite
Project Human Resource Management includes the processes required to makethe most effective use of the people involved with the project. It includes all theproject stakeholders—sponsors, customers, partners, individual contributors, andothers described in Section 2.2. Figure 9-1 provides an overview of the followingmajor processes:
n
9.1 Organizational Planning—identifying, documenting, and assigning project roles,responsibilities, and reporting relationships.
9.2 Staff Acquisition—getting the human resources needed assigned to and workingon the project.
9.3 Team Development—developing individual and group competencies to enhanceproject performance.
These processes interact with each other and with the processes in the otherknowledge areas as well. Each process may involve effort from one or more indi-viduals or groups of individuals, based on the needs of the project.
Although the processes are presented here as discrete elements with well-defined interfaces, in practice they may overlap and interact in ways not detailedhere. Process interactions are discussed in detail in Chapter 3.
There is a substantial body of literature about dealing with people in an oper-ational, ongoing context. Some of the many topics include:■ Leading, communicating, negotiating, and others discussed in Section 2.4, Key
General Management Skills.■ Delegating, motivating, coaching, mentoring, and other subjects related to
dealing with individuals.■ Team building, dealing with conflict, and other subjects related to dealing with
groups.■ Performance appraisal, recruitment, retention, labor relations, health and
safety regulations, and other subjects related to administering the humanresource function.Most of this material is directly applicable to leading and managing people on
projects, and the project manager and project management team should be familiarwith it. However, they must also be sensitive as to how this knowledge is appliedon the project. For example:
t Body of Knowledge (PMBOK® Guide) 2000 Editiontute, Four Campus Boulevard, Newtown Square, PA 19073-3299 USA 107
d to: Old Dominion University. Downloaded on September 15,2010 at 18:15:01 UTC from IEEE Xplore. Restrictions apply.

Chapter 9—Project Human Resource Management
108
Figure 9–1. Project Human Resource Management Overview
PROJECT HUMANRESOURCE MANAGEMENT
9.2 Staff Acquisition 9.3 Team Development9.1
.1 Inputs
.2 Tools and Techniques
.3 Outputs
.1 Project interfaces
.2 Staffing requirements
.3 Constraints
.1 Templates
.2 Human resourcepractices
.3 Organizational theory
.4 Stakeholder analysis
.1 Role and responsibilityassignments
.2 Staffing managementplan
.3 Organization chart
.4 Supporting detail
.1 Inputs
.2 Tools and Techniques
.3 Outputs
.1 Staffing managementplan
.2 Staffing pool description
.3 Recruitment practices
.1 Negotiations
.2 Preassignment
.3 Procurement
.1 Project staff assigned
.2 Project team directory
.1 Inputs
.2 Tools and Techniques
.3 Outputs
.1 Project staff
.2 Project plan
.3 Staffing managementplan
.4 Performance reports
.5 External feedback
.1 Team-building activities
.2 General managementskills
.3 Reward and recognitionsystems
.4 Collocation
.5 Training
.1 Performanceimprovements
.2 Input to performanceappraisals
Organizational PlanningFigu
re 9
–1|
9.1.
1.2
Authorized licensed use
■ The temporary nature of projects means that the personal and organizationalrelationships will generally be both temporary and new. The project manage-ment team must take care to select techniques that are appropriate for suchtransient relationships.
■ The nature and number of project stakeholders will often change as theproject moves from phase to phase of its life cycle. As a result, techniques thatare effective in one phase may not be effective in another. The project man-agement team must take care to use techniques that are appropriate to thecurrent needs of the project.
■ Human resource administrative activities are seldom a direct responsibility ofthe project management team. However, the team must be sufficiently awareof administrative requirements to ensure compliance.Note: Project managers may also have responsibilities for human resource
redeployment and release, depending upon the industry or organization to whichthey belong.
9.1 ORGANIZATIONAL PLANNINGOrganizational planning involves identifying, documenting, and assigning projectroles, responsibilities, and reporting relationships. Roles, responsibilities, and
A Guide to the Project Management Body of Knowledge (PMBOK® Guide) 2000 Edition©2000 Project Management Institute, Four Campus Boulevard, Newtown Square, PA 19073-3299 USA
limited to: Old Dominion University. Downloaded on September 15,2010 at 18:15:01 UTC from IEEE Xplore. Restrictions apply.

Chapter 9—Project Human Resource Management
A Guide to the Project Man©2000 Project Managem
Authorized licensed u
reporting relationships may be assigned to individuals or to groups. The individ-uals and groups may be part of the organization performing the project, or theymay be external to it. Internal groups are often associated with a specific func-tional department such as engineering, marketing, or accounting.
On most projects, the majority of organizational planning is done as part ofthe earliest project phases. However, the results of this process should bereviewed regularly throughout the project to ensure continued applicability. If theinitial organization is no longer effective, then it should be revised promptly.
Organizational planning is often tightly linked with communications planning(described in Section 10.1), since the project’s organizational structure will havea major effect on the project’s communications requirements.
9.1.1 Inputs to Organizational Planning.1 Project interfaces. Project interfaces generally fall into one of three categories:
■ Organizational interfaces—formal and informal reporting relationships amongdifferent organizational units. Organizational interfaces may be highly com-plex or very simple. For example, developing a complex telecommunicationssystem may require coordinating numerous subcontractors over several years,while fixing a programming error in a system installed at a single site mayrequire little more than notifying the user and the operations staff upon com-pletion.
■ Technical interfaces—formal and informal reporting relationships among dif-ferent technical disciplines. Technical interfaces occur both within projectphases (e.g., the site design developed by the civil engineers must be com-patible with the superstructure developed by the structural engineers) andbetween project phases (e.g., when an automotive design team passes theresults of its work along to the retooling team that must create the manufac-turing capability for the vehicle).
■ Interpersonal interfaces—formal and informal reporting relationships amongdifferent individuals working on the project.These interfaces often occur simultaneously, as when an architect employed
by a design firm explains key design considerations to an unrelated constructioncontractor’s project management team.
.2 Staffing requirements. Staffing requirements define what kinds of competenciesare required from what kinds of individuals or groups and in what time frames.Staffing requirements are a subset of the overall resource requirements identifiedduring resource planning (described in Section 7.1).
.1
.2
.3
Project interfacesStaffing requirementsConstraints
.1
.2
.3
.4
TemplatesHuman resource practicesOrganizational theoryStakeholder analysis
.1
.2
.3
.4
Role and responsibilityassignmentsStaffing management planOrganization chartSupporting detail
Inputs Tools & Techniques Outputs
agement Body of Knowledge (PMBOK® Guide) 2000 Editionent Institute, Four Campus Boulevard, Newtown Square, PA 19073-3299 USA 109
se limited to: Old Dominion University. Downloaded on September 15,2010 at 18:15:01 UTC from IEEE Xplore. Restrictions apply.

Chapter 9—Project Human Resource Management
110
9.1.
1.3
|9.
1.3.
4
Authorized licensed
.3 Constraints. Constraints are factors that limit the project team’s options. Aproject’s organizational options may be constrained in many ways. Common fac-tors that may constrain how the team is organized include, but are not limited to,the following:■ Organizational structure of the performing organization—an organization
whose basic structure is a strong matrix means a relatively stronger role for theproject manager than one whose basic structure is a weak matrix (see Section2.3.3 for a more detailed discussion of organizational structures).
■ Collective bargaining agreements—contractual agreements with unions orother employee groups may require certain roles or reporting relationships (inessence, the employee group is a stakeholder).
■ Preferences of the project management team—if members of the project man-agement team have had success with certain structures in the past, then theyare likely to advocate similar structures in the future.
■ Expected staff assignments—how the project is organized is often influencedby the competencies of specific individuals.
9.1.2 Tools and Techniques for Organizational Planning.1 Templates. Although each project is unique, most projects will resemble another
project to some extent. Using the role and responsibility definitions or reportingrelationships of a similar project can help expedite the process of organizationalplanning.
.2 Human resource practices. Many organizations have a variety of policies, guide-lines, and procedures that can help the project management team with variousaspects of organizational planning. For example, an organization that views man-agers as “coaches” is likely to have documentation on how the role of “coach” isto be performed.
.3 Organizational theory. There is a substantial body of literature describing howorganizations can and should be structured. Although only a small subset of thisbody of literature is specifically targeted toward project organizations, the projectmanagement team should be generally familiar with the subject of organizationaltheory so as to be better able to respond to project requirements.
.4 Stakeholder analysis. The identification of stakeholders and the needs of the var-ious stakeholders should be analyzed to ensure that their needs will be met. Sec-tion 10.1.2.1 discusses stakeholder analysis in more detail.
9.1.3 Outputs from Organizational Planning.1 Role and responsibility assignments. Project roles (who does what) and responsi-
bilities (who decides what) must be assigned to the appropriate project stakeholders.Roles and responsibilities may vary over time. Most roles and responsibilities willbe assigned to stakeholders who are actively involved in the work of the project,such as the project manager, other members of the project management team,and the individual contributors.
The roles and responsibilities of the project manager are generally critical onmost projects, but vary significantly by application area.
Project roles and responsibilities should be closely linked to the project scopedefinition. A Responsibility Assignment Matrix (or RAM, see Figure 9-2) is oftenused for this purpose. On larger projects, RAMs may be developed at various
A Guide to the Project Management Body of Knowledge (PMBOK® Guide) 2000 Edition©2000 Project Management Institute, Four Campus Boulevard, Newtown Square, PA 19073-3299 USA
use limited to: Old Dominion University. Downloaded on September 15,2010 at 18:15:01 UTC from IEEE Xplore. Restrictions apply.

Chapter 9—Project Human Resource Management
A Guide to the Project Manage©2000 Project Management
Figure 9–2. Responsibility Assignment Matrix
P = Participant A = Accountable R = Review RequiredI = Input Required S = Sign-off Required
A B C D E F
S R A P P
S A P P
S R A I
R S A P
S P I A
...
P
P
P
PERSONPHASE
Requirements
Functional
Design
Development
Testing
Authorized licensed use l
levels. For example, a high-level RAM may define which group or unit is respon-sible for each component of the work breakdown structure, while lower-levelRAMs are used within the group to assign roles and responsibilities for specificactivities to particular individuals.
.2 Staffing management plan. The staffing management plan describes when andhow human resources will be brought onto and taken off of the project team. Thestaffing plan may be formal or informal, highly detailed or broadly framed, basedon the needs of the project. It is a subsidiary element of the overall project plan(see Section 4.1, Project Plan Development).
The staffing management plan often includes resource histograms, as illus-trated in Figure 9-3.
Particular attention should be paid to how project team members (individualsor groups) will be released when they are no longer needed on the project.Appropriate reassignment procedures may:■ Reduce costs by reducing or eliminating the tendency to “make work” to fill
the time between this assignment and the next.■ Improve morale by reducing or eliminating uncertainty about future employ-
ment opportunities..3 Organization chart. An organization chart is any graphic display of project
reporting relationships. It may be formal or informal, highly detailed or broadlyframed, based on the needs of the project. For example, the organization chartfor a three- to four-person internal service project is unlikely to have the rigorand detail of the organization chart for a 3,000-person disaster response team.
An Organizational Breakdown Structure (OBS) is a specific type of organiza-tion chart that shows which organizational units are responsible for which workpackages.
.4 Supporting detail. Supporting detail for organizational planning varies by appli-cation area and project size. Information frequently supplied as supporting detailincludes, but is not limited to:
ment Body of Knowledge (PMBOK® Guide) 2000 EditionInstitute, Four Campus Boulevard, Newtown Square, PA 19073-3299 USA 111
imited to: Old Dominion University. Downloaded on September 15,2010 at 18:15:01 UTC from IEEE Xplore. Restrictions apply.

Chapter 9—Project Human Resource Management
112
Figure 9–3. Illustrative Resource Histogram
Resource Usage Staff Hours
Senior DesignersR
esou
rce
Usa
ge
Staff Hours
300
275
250
225
200
175
150
125
100
75
50
25
0
Jan Feb Mar Apr May
9 16 23 30 6 13 20 27 6 13 20 27 3 10 17 24 1 8 15 22
Figu
re 9
–3|
9.2.
2.1
Authorized licensed use
■ Organizational impact—what alternatives are precluded by organizing in thismanner.
■ Job descriptions—written outlines by job title of the competencies, responsi-bilities, authority, physical environment, and other characteristics involved inperforming a given job. Also called position descriptions.
■ Training needs—if the staff to be assigned is not expected to have the compe-tencies needed by the project, those competencies will need to be developedas part of the project.
9.2 STAFF ACQUISITIONStaff acquisition involves getting the needed human resources (individuals orgroups) assigned to and working on the project. In most environments, the “best”resources may not be available, and the project management team must take careto ensure that the resources that are available will meet project requirements.
A Guide to the Project Management Body of Knowledge (PMBOK® Guide) 2000 Edition©2000 Project Management Institute, Four Campus Boulevard, Newtown Square, PA 19073-3299 USA
limited to: Old Dominion University. Downloaded on September 15,2010 at 18:15:01 UTC from IEEE Xplore. Restrictions apply.

Chapter 9—Project Human Resource Management
A Guide to the Project Ma©2000 Project Managem
Authorized licensed
9.2.1 Inputs to Staff Acquisition.1 Staffing management plan. The staffing management plan is described in Section
9.1.3.2. It includes the project’s staffing requirements, as described in Section9.1.1.2.
.2 Staffing pool description. When the project management team is able to influenceor direct staff assignments, it must consider the characteristics of the potentiallyavailable staff. Considerations include, but are not limited to:■ Previous experience—have the individuals or groups done similar or related
work before? Have they done it well?■ Personal interests—are the individuals or groups interested in working on this
project?■ Personal characteristics—are the individuals or groups likely to work well
together as a team?■ Availability—will the most desirable individuals or groups be available in the
necessary time frames?■ Competencies and proficiency—what competencies are required and at what
level?.3 Recruitment practices. One or more of the organizations involved in the project
may have policies, guidelines, or procedures governing staff assignments. Whenthey exist, such practices act as a constraint on the staff-acquisition process.
9.2.2 Tools and Techniques for Staff Acquisition.1 Negotiations. Staff assignments must be negotiated on most projects. For
example, the project management team may need to negotiate with:■ Responsible functional managers to ensure that the project receives appropri-
ately competent staff in the necessary time frame.■ Other project management teams within the performing organization to
assign scarce or specialized resources appropriately.The team’s influencing competencies (see Section 2.4.5, Influencing the Orga-
nization) play an important role in negotiating staff assignments, as do the pol-itics of the organizations involved. For example, a functional manager may berewarded based on staff utilization. This creates an incentive for the manager toassign available staff who may not meet all of the project’s requirements.
.1
.2
.3
Staffing management planStaffing pool descriptionRecruitment practices
.1
.2
.3
NegotiationsPreassignmentProcurement
.1
.2Project staff assignedProject team directory
Inputs Tools & Techniques Outputs
nagement Body of Knowledge (PMBOK® Guide) 2000 Editionent Institute, Four Campus Boulevard, Newtown Square, PA 19073-3299 USA 113
use limited to: Old Dominion University. Downloaded on September 15,2010 at 18:15:01 UTC from IEEE Xplore. Restrictions apply.

Chapter 9—Project Human Resource Management
114
9.2.
2.2
|9.
3.2.
4
Authorized licensed
.2 Preassignment. In some cases, staff may be preassigned to the project. This isoften the case when a) the project is the result of a competitive proposal, andspecific staff were promised as part of the proposal, or b) the project is aninternal service project, and staff assignments were defined within the projectcharter.
.3 Procurement. Project procurement management (described in Chapter 12) canbe used to obtain the services of specific individuals or groups of individuals toperform project activities. Procurement is required when the performing orga-nization lacks the in-house staff needed to complete the project (e.g., as a resultof a conscious decision not to hire such individuals as full-time employees, as aresult of having all appropriately competent staff previously committed to otherprojects, or as a result of other circumstances).
9.2.3 Outputs from Staff Acquisition.1 Project staff assigned. The project is staffed when appropriate people have been
reliably assigned to work on it. Staff may be assigned full time, part time, or vari-ably, based on the needs of the project.
.2 Project team directory. A project team directory lists all the project team mem-bers and other stakeholders. The directory may be formal or informal, highlydetailed or broadly framed, based on the needs of the project.
9.3 TEAM DEVELOPMENTTeam development includes both enhancing the ability of stakeholders to con-tribute as individuals as well as enhancing the ability of the team to function asa team. Individual development (managerial and technical) is the foundationnecessary to develop the team. Development as a team is critical to the project’sability to meet its objectives.
Team development on a project is often complicated when individual teammembers are accountable to both a functional manager and the project manager(see Section 2.3.3 for a discussion of matrix organizational structures). Effectivemanagement of this dual reporting relationship is often a critical success factorfor the project, and is generally the responsibility of the project manager.
Although team development is positioned in Chapter 3 as one of the executingprocesses, team development occurs throughout the project.
.1
.2
.3
.4
.5
Project staffProject planStaffing management planPerformance reportsExternal feedback
.1
.2
.3
.4
.5
Team-building activitiesGeneral managementskillsReward and recognitionsystemsCollocationTraining
.1
.2
PerformanceimprovementsInput to performanceappraisals
Inputs Tools & Techniques Outputs
A Guide to the Project Management Body of Knowledge (PMBOK® Guide) 2000 Edition©2000 Project Management Institute, Four Campus Boulevard, Newtown Square, PA 19073-3299 USA
use limited to: Old Dominion University. Downloaded on September 15,2010 at 18:15:01 UTC from IEEE Xplore. Restrictions apply.
Chapter 9—Project Human Resource Management
A Guide to the Project M©2000 Project Manage
Authorized licensed
9.3.1 Inputs to Team Development.1 Project staff. Project staffing is described in Section 9.2.3.1. The staff assign-
ments implicitly define the individual competencies and team competenciesavailable upon which to build.
.2 Project plan. The project plan is described in Section 4.1.3.1. The project plandescribes the technical context within which the team operates.
.3 Staffing management plan. The staffing management plan is described in Section9.1.3.2.
.4 Performance reports. Performance reports (described in Section 10.3.3.1) pro-vide feedback to the project team about performance against the project plan.
.5 External feedback. The project team must periodically measure itself against theexpectations of those outside the project.
9.3.2 Tools and Techniques for Team Development.1 Team-building activities. Team-building activities include management and indi-
vidual actions taken specifically and primarily to improve team performance.Many actions—such as involving nonmanagement-level team members in theplanning process, or establishing ground rules for surfacing and dealing with con-flict—may enhance team performance as a secondary effect. Team-building activ-ities can vary from a five-minute agenda item in a regular status review meetingto an extended, off-site, professionally facilitated experience designed to improveinterpersonal relationships among key stakeholders.
There is a substantial body of literature on team building. The project man-agement team should be generally familiar with a variety of team-building activ-ities.
.2 General management skills. General management skills (discussed in Section2.4) are of particular importance to team development.
.3 Reward and recognition systems. Reward and recognition systems are formalmanagement actions that promote or reinforce desired behavior. To be effective,such systems must make the link between project performance and reward clear,explicit, and achievable. For example, a project manager who is to be rewardedfor meeting the project’s cost objective should have an appropriate level of con-trol over staffing and procurement decisions.
Projects must often have their own reward and recognition systems since thesystems of the performing organization may not be appropriate. For example, thewillingness to work overtime to meet an aggressive schedule objective should berewarded or recognized; needing to work overtime as the result of poor planningshould not be.
Reward and recognition systems must also consider cultural differences. Forexample, developing an appropriate team reward mechanism in a culture thatprizes individualism may be very difficult.
.4 Collocation. Collocation involves placing all, or almost all, of the most activeproject team members in the same physical location to enhance their ability toperform as a team. Collocation is widely used on larger projects and can also beeffective for smaller projects (e.g., with a war room, where the team congregatesand posts schedules, updates, etc.). On some projects, collocation may not be anoption; where it is not viable, an alternative may be scheduling frequent face-to-face meetings to encourage interaction.
anagement Body of Knowledge (PMBOK® Guide) 2000 Editionment Institute, Four Campus Boulevard, Newtown Square, PA 19073-3299 USA 115
use limited to: Old Dominion University. Downloaded on September 15,2010 at 18:15:01 UTC from IEEE Xplore. Restrictions apply.

Chapter 9—Project Human Resource Management
116
9.3.
2.5
|Ch
apte
r 10
Authorized licensed us
.5 Training. Training includes all activities designed to enhance the competencies ofthe project team. Some authors distinguish among training, education, anddevelopment, but the distinctions are neither consistent nor widely accepted.Training may be formal (e.g., classroom training, computer-based training) orinformal (e.g., feedback from other team members). There is a substantial bodyof literature on how to provide training to adults.
If the project team members lack necessary management or technical skills,such skills must be developed as part of the project, or steps must be taken torestaff the project appropriately. Direct and indirect costs for training are gener-ally paid by the performing organization.
9.3.3 Outputs from Team Development.1 Performance improvements. Team performance improvements can come from
many sources and can affect many areas of project performance; for example:■ Improvements in individual skills may allow a specific person to perform
assigned activities more effectively.■ Improvements in team behaviors (e.g., surfacing and dealing with conflict)
may allow project team members to devote a greater percentage of theirefforts to technical activities.
■ Improvements in either individual or team competencies may facilitate iden-tifying and developing better ways of doing project work.
.2 Input to performance appraisals. Project staff should generally provide input tothe appraisals of any project staff members with whom they interact in a signif-icant way.
A Guide to the Project Management Body of Knowledge (PMBOK® Guide) 2000 Edition©2000 Project Management Institute, Four Campus Boulevard, Newtown Square, PA 19073-3299 USA
e limited to: Old Dominion University. Downloaded on September 15,2010 at 18:15:01 UTC from IEEE Xplore. Restrictions apply.

Chapter 10
Project CommunicationsManagement
A Guide to the Project Manageme©2000 Project Management Inst
Authorized licensed use limit
Project Communications Management includes the processes required to ensuretimely and appropriate generation, collection, dissemination, storage, and ulti-mate disposition of project information. It provides the critical links amongpeople, ideas, and information that are necessary for success. Everyone involvedin the project must be prepared to send and receive communications, and mustunderstand how the communications in which they are involved as individualsaffect the project as a whole. Figure 10-1 provides an overview of the followingmajor processes:
10.1 Communications Planning—determining the information and communicationsneeds of the stakeholders: who needs what information, when they will need it,and how it will be given to them.
10.2 Information Distribution—making needed information available to projectstakeholders in a timely manner.
10.3 Performance Reporting—collecting and disseminating performance informa-tion. This includes status reporting, progress measurement, and forecasting.
10.4 Administrative Closure—generating, gathering, and disseminating informationto formalize a phase or project completion.
These processes interact with each other and with the processes in the otherknowledge areas as well. Each process may involve effort from one or more indi-viduals or groups of individuals, based on the needs of the project. Each processgenerally occurs at least once in every project phase.
Although the processes are presented here as discrete elements with well-defined interfaces, in practice they may overlap and interact in ways not detailedhere. Process interactions are discussed in detail in Chapter 3.
The general management skill of communicating (discussed in Section 2.4.2)is related to, but not the same as, project communications management. Com-municating is a broader subject and involves a substantial body of knowledgethat is not unique to the project context. For example:■ Sender-receiver models—feedback loops, barriers to communications, etc.■ Choice of media—when to communicate in writing versus when to commu-
nicate orally, when to write an informal memo versus when to write a formalreport, etc.
nt Body of Knowledge (PMBOK® Guide) 2000 Editionitute, Four Campus Boulevard, Newtown Square, PA 19073-3299 USA 117
ed to: Old Dominion University. Downloaded on September 15,2010 at 18:15:01 UTC from IEEE Xplore. Restrictions apply.

A Guide to the Project Management Body of Knowledge (PMBOK® Guide) 2000 Edition©2000 Project Management Institute, Four Campus Boulevard, Newtown Square, PA 19073-3299 USA
Chapter 10—Project Communications Management
118
Figure 10–1. Project Communications Management Overview
PROJECT COMMUNICATIONSMANAGEMENT
10.2 Information Distribution 10.3 Performance Reporting10.1
.1 Inputs
.2 Tools and Techniques
.3 Outputs
.1 Communicationsrequirements
.2 Communicationstechnology
.3 Constraints
.4 Assumptions
.1 Stakeholder analysis
.1 Communicationsmanagement plan
.1 Inputs
.2 Tools and Techniques
.3 Outputs
.1 Work results
.2 Communicationsmanagement plan
.3 Project plan
.1 Communications skills
.2 Information retrievalsystems
.3 Information distributionmethods
.1 Project records
.2 Project reports
.3 Project presentations
.1 Inputs
.2 Tools and Techniques
.3 Outputs
.1 Project plan
.2 Work results
.3 Other project records
.1 Performance reviews
.2 Variance analysis
.3 Trend analysis
.4 Earned value analysis
.5 Information distributiontools and techniques
.1 Performance reports
.2 Change requests
CommunicationsPlanning
10.4
.1 Inputs
.2 Tools and Techniques
.3 Outputs
.1 Performancemeasurementdocumentation
.2 Product documentation
.3 Other project records
.1 Performance reportingtools and techniques
.2 Project reports
.3 Project presentations
.1 Project archives
.2 Project closure
.3 Lessons learned
AdministrativeClosure
Figu
re 1
0–1
|10
.1.1
.1
Authorized licensed use limited to: Old Dominion University. Downloaded on September 15,2010 at 18:15:01 UTC from IEEE Xplore. Restrictions apply.

Chapter 10—Project Communications Management
A Guide to the Project M©2000 Project Manage
Authorized licensed
■ Writing style—active versus passive voice, sentence structure, word choice,etc.
■ Presentation techniques—body language, design of visual aids, etc.■ Meeting management techniques—preparing an agenda, dealing with conflict,
etc.
10.1 COMMUNICATIONS PLANNINGCommunications planning involves determining the information and communica-tions needs of the stakeholders: who needs what information, when they will needit, how it will be given to them, and by whom. While all projects share the needto communicate project information, the informational needs and the methods ofdistribution vary widely. Identifying the informational needs of the stakeholdersand determining a suitable means of meeting those needs is an important factor forproject success.
On most projects, the majority of communications planning is done as part ofthe earliest project phases. However, the results of this process should be reviewedregularly throughout the project and revised as needed to ensure continued applic-ability.
Communications planning is often tightly linked with organizational planning(described in Section 9.1) since the project’s organizational structure will have amajor effect on the project’s communications requirements.
10.1.1 Inputs to Communications Planning.1 Communications requirements. Communications requirements are the sum of the
information requirements of the project stakeholders. Requirements are definedby combining the type and format of information required with an analysis of thevalue of that information. Project resources should be expended only on com-municating information that contributes to success or where a lack of commu-nication can lead to failure. Information typically required to determine projectcommunications requirements includes:■ Project organization and stakeholder responsibility relationships.■ Disciplines, departments, and specialties involved in the project.■ Logistics of how many individuals will be involved with the project and at
which locations.■ External information needs (e.g., communicating with the media).
.1
.2
.3
.4
CommunicationsrequirementsCommunicationstechnologyConstraintsAssumptions
.1 Stakeholder analysis .1 Communicationsmanagement plan
Inputs Tools & Techniques Outputs
anagement Body of Knowledge (PMBOK® Guide) 2000 Editionment Institute, Four Campus Boulevard, Newtown Square, PA 19073-3299 USA 119
use limited to: Old Dominion University. Downloaded on September 15,2010 at 18:15:01 UTC from IEEE Xplore. Restrictions apply.

Chapter 10—Project Communications Management
120
10.1
.1.2
|10
.2.2
.2
Authorized licensed
.2 Communications technology. The technologies or methods used to transfer infor-mation back and forth among project stakeholders can vary significantly: frombrief conversations to extended meetings, from simple written documents toimmediately accessible online schedules and databases.
Communications technology factors that may affect the project include:■ The immediacy of the need for information—is project success dependent
upon having frequently updated information available on a moment’s notice,or would regularly issued written reports suffice?
■ The availability of technology—are the systems that are already in place appro-priate, or do project needs warrant change?
■ The expected project staffing—are the proposed communications systemscompatible with the experience and expertise of the project participants, orwill extensive training and learning be required?
■ The length of the project—is the available technology likely to change beforethe project is over?
.3 Constraints. Constraints are factors that will limit the project management team’soptions. For example, if substantial project resources will be procured, more con-sideration will need to be given to handling contract information.
When a project is performed under contract, there are often specific contrac-tual provisions that affect communications planning.
.4 Assumptions. See Section 4.1.1.5.
10.1.2 Tools and Techniques for Communications Planning.1 Stakeholder analysis. The information needs of the various stakeholders should
be analyzed to develop a methodical and logical view of their information needsand sources to meet those needs (project stakeholders are discussed in more detailin Section 2.2). The analysis should consider methods and technologies suited tothe project that will provide the information needed. Care should be taken toavoid wasting resources on unnecessary information or inappropriate technology.
10.1.3 Outputs from Communications Planning.1 Communications management plan. A communications management plan is a
document that provides:■ A collection and filing structure that details what methods will be used to
gather and store various types of information. Procedures should also covercollecting and disseminating updates and corrections to previously distributedmaterial.
■ A distribution structure that details to whom information (status reports, data,schedule, technical documentation, etc.) will flow, and what methods (writtenreports, meetings, etc.) will be used to distribute various types of information.This structure must be compatible with the responsibilities and reporting rela-tionships described by the project organization chart.
■ A description of the information to be distributed, including format, content,level of detail, and conventions/definitions to be used.
■ Production schedules showing when each type of communication will beproduced.
■ Methods for accessing information between scheduled communications.■ A method for updating and refining the communications management plan as
the project progresses and develops.
A Guide to the Project Management Body of Knowledge (PMBOK® Guide) 2000 Edition©2000 Project Management Institute, Four Campus Boulevard, Newtown Square, PA 19073-3299 USA
use limited to: Old Dominion University. Downloaded on September 15,2010 at 18:15:01 UTC from IEEE Xplore. Restrictions apply.

Chapter 10—Project Communications Management
A Guide to the Project Man©2000 Project Manageme
Authorized licensed u
The communications management plan may be formal or informal, highlydetailed or broadly framed, based on the needs of the project. It is a subsidiarycomponent of the overall project plan (described in Section 4.1).
10.2 INFORMATION DISTRIBUTIONInformation distribution involves making needed information available to projectstakeholders in a timely manner. It includes implementing the communicationsmanagement plan, as well as responding to unexpected requests for information.
10.2.1 Inputs to Information Distribution.1 Work results. Work results are described in Section 4.2.3.1..2 Communications management plan. The communications management plan is
described in Section 10.1.3.1..3 Project plan. The project plan is described in Section 4.1.3.1.
10.2.2 Tools and Techniques for Information Distribution.1 Communications skills. Communications skills are used to exchange information.
The sender is responsible for making the information clear, unambiguous, andcomplete, so that the receiver can receive it correctly, and for confirming that itis properly understood. The receiver is responsible for making sure that the infor-mation is received in its entirety and understood correctly. Communicating hasmany dimensions:■ Written and oral, listening and speaking.■ Internal (within the project) and external (to the customer, the media, the
public, etc.).■ Formal (reports, briefings, etc.) and informal (memos, ad hoc conversations, etc.).■ Vertical (up and down the organization) and horizontal (with peers).
.2 Information retrieval systems. Information can be shared by team members andstakeholders through a variety of methods including manual filing systems, elec-tronic databases, project management software, and systems that allow access totechnical documentation such as engineering drawings, design specifications, testplans, etc.
.1
.2
.3
Work resultsCommunicationsmanagement planProject plan
.1
.2
.3
Communications skillsInformation retrievalsystemsInformation distributionmethods
.1
.2
.3
Project recordsProject reportsProject presentations
Inputs Tools & Techniques Outputs
agement Body of Knowledge (PMBOK® Guide) 2000 Editionnt Institute, Four Campus Boulevard, Newtown Square, PA 19073-3299 USA 121
se limited to: Old Dominion University. Downloaded on September 15,2010 at 18:15:01 UTC from IEEE Xplore. Restrictions apply.

Chapter 10—Project Communications Management
122
10.2
.2.3
|10
.3.2
.5
Authorized license
.3 Information distribution methods. Project information may be distributed using avariety of methods including project meetings, hard-copy document distribution,shared access to networked electronic databases, fax, electronic mail, voice mail,videoconferencing, and project intranet.
10.2.3 Outputs from Information Distribution.1 Project records. Project records may include correspondence, memos, and docu-
ments describing the project. This information should, to the extent possible andappropriate, be maintained in an organized fashion. Project team members mayoften maintain personal records in a project notebook.
.2 Project reports. Formal project reports on project status and/or issues.
.3 Project presentations. The project team provides information formally, or infor-mally, to any or all of the project stakeholders. The information is relevant to theneeds of the audience, and the method of presentation is appropriate.
10.3 PERFORMANCE REPORTINGPerformance reporting involves collecting and disseminating performance infor-mation to provide stakeholders with information about how resources are beingused to achieve project objectives. This process includes:■ Status reporting—describing where the project now stands—for example,
status related to schedule and budget metrics.■ Progress reporting—describing what the project team has accomplished—for
example, percent complete to schedule, or what is completed versus what isin process.
■ Forecasting—predicting future project status and progress.Performance reporting should generally provide information on scope, schedule,
cost, and quality. Many projects also require information on risk and procurement.Reports may be prepared comprehensively or on an exception basis.
10.3.1 Inputs to Performance Reporting.1 Project plan. The project plan is discussed in Section 4.1.3.1. The project plan
contains the various baselines that will be used to assess project performance.
.1
.2
.3
Project planWork resultsOther project records
.1
.2
.3
.4
.5
Performance reviewsVariance analysisTrend analysisEarned value analysisInformation distributiontools and techniques
.1
.2Performance reportsChange requests
Inputs Tools & Techniques Outputs
A Guide to the Project Management Body of Knowledge (PMBOK® Guide) 2000 Edition©2000 Project Management Institute, Four Campus Boulevard, Newtown Square, PA 19073-3299 USA
d use limited to: Old Dominion University. Downloaded on September 15,2010 at 18:15:01 UTC from IEEE Xplore. Restrictions apply.

Chapter 10—Project Communications Management
A Guide to the Project Ma©2000 Project Managem
Authorized licensed
.2 Work results. Work results—which deliverables have been fully or partially com-pleted, what costs (and/or resources) have been incurred or committed, etc.—are an output of project plan execution (discussed in Section 4.2.3.1). Workresults should be reported within the framework provided by the communica-tions management plan. Accurate, uniform information on work results is essen-tial to useful performance reporting.
.3 Other project records. Project records are discussed in Section 10.2.3.1. In addi-tion to the project plan and the project’s work results, other project documentsoften contain information pertaining to the project context that should be con-sidered when assessing project performance.
10.3.2 Tools and Techniques for Performance Reporting.1 Performance reviews. Performance reviews are meetings held to assess project
status and/or progress. Performance reviews are typically used in conjunctionwith one or more of the performance-reporting techniques described below.
.2 Variance analysis. Variance analysis involves comparing actual project results toplanned or expected results. Cost and schedule variances are the most frequentlyanalyzed, but variances from plan in the areas of scope, resource, quality, and riskare often of equal or greater importance.
.3 Trend analysis. Trend analysis involves examining project results over time to deter-mine if performance is improving or deteriorating.
.4 Earned value analysis. Earned value analysis in its various forms is the most com-monly used method of performance measurement. It integrates scope, cost (orresource), and schedule measures to help the project management team assessproject performance. Earned value (EV) involves calculating three key values foreach activity:■ The Planned Value (PV), previously called the budgeted cost of work sched-
uled (BCWS), is that portion of the approved cost estimate planned to bespent on the activity during a given period.
■ The Actual Cost (AC), previously called the actual cost of work performed(ACWP), is the total of costs incurred in accomplishing work on the activityduring a given period. This Actual Cost must correspond to whatever was bud-geted for the PV and the EV (example: direct hours only, direct costs only, or allcosts including indirect costs).
■ The EV, previously called the budgeted cost of work performed (BCWP), is thevalue of the work actually completed.These three values are used in combination to provide measures of whether
or not work is being accomplished as planned. The most commonly used mea-sures are the cost variance (CV) (CV= EV – AC), and the schedule variance (SV)(SV = EV – PV). These two values, the CV and SV, can be converted to efficiencyindicators to reflect the cost and schedule performance of any project. The costperformance index (CPI = EV/AC) is the most commonly used cost-efficiencyindicator. The cumulative CPI (the sum of all individual EV budgets divided bythe sum of all individual ACs) is widely used to forecast project costs at comple-tion. Also, the schedule performance index (SPI = EV/PV) is sometimes used inconjunction with the CPI to forecast the project completion estimates.
.5 Information distribution tools and techniques. Performance reports are distributedusing the tools and techniques described in Section 10.2.2.
nagement Body of Knowledge (PMBOK® Guide) 2000 Editionent Institute, Four Campus Boulevard, Newtown Square, PA 19073-3299 USA 123
use limited to: Old Dominion University. Downloaded on September 15,2010 at 18:15:01 UTC from IEEE Xplore. Restrictions apply.

Chapter 10—Project Communications Management
124
Figure 10–3. Illustrative Tabular Performance Report
1.0 Pre-Pilot Plan2.0 Checklists3.0 Curriculum4.0 Mid-Term Evaluation5.0 Implementation Support6.0 Manual of Practice7.0 Roll-Out Plan
63,00064,00023,00068,00012,0007,000
20,000
58,00048,00020,00068,00010,0006,200
13,500
62,50046,80023,50072,50010,0006,000
18,100
Budget Earned Value Actual Cost
Planned Earned Cost Performance Index
–4,5001,200
–3,500–4,500
0200
–4,600
–7.82.5
–17.5–6.60.03.2
–34.1
Cost Variance
($) (%)
–7.9–25.0–13.0
0.0–16.7–11.4–32.5
0.920.750.871.000.830.890.68
–5,000–16,000–3,000
0–2,000
–800–6,500
0.931.030.850.941.001.03.075
Schedule Variance Cost Schedule
($) CPI(%) SPI
WBS Element
Totals
(PV) (EV) (AC) (EV – AC) (CV÷ EV) (EV – PV) (EV ÷ AC)(SV÷ PV) (EV÷ PV)
Note: All figures are project-to-date.
257,000 223,700 239,400 –15,700 –7.0 –33,300 0.93–13.0 0.87
*Other units of measure that may be used in these calculations may include: labor hours, cubic yards of concrete, etc.
($) ($) ($)
Figure 10–2. Illustrative Graphic Performance Report
Time
ActualCosts
Data Date
PlannedValue
CumulativeValues
Earned ValueFigu
re 1
0–2
|10
.4.3
.1
Authorized licensed
10.3.3 Outputs from Performance Reporting.1 Performance reports. Performance reports organize and summarize the informa-
tion gathered and present the results of any analysis. Reports should provide thekinds of information and the level of detail required by various stakeholders, asdocumented in the communications management plan.
Common formats for performance reports include bar charts (also called Ganttcharts), S-curves, histograms, and tables. Figure 10-2 uses S-curves to displaycumulative EV analysis data, while Figure 10-3 displays a different set of EV datain tabular form.
.2 Change requests. Analysis of project performance often generates a request fora change to some aspect of the project. These change requests are handled asdescribed in the various change control processes (e.g., scope change manage-ment, schedule control, etc.).
A Guide to the Project Management Body of Knowledge (PMBOK® Guide) 2000 Edition©2000 Project Management Institute, Four Campus Boulevard, Newtown Square, PA 19073-3299 USA
use limited to: Old Dominion University. Downloaded on September 15,2010 at 18:15:01 UTC from IEEE Xplore. Restrictions apply.

Chapter 10—Project Communications Management
A Guide to the Project©2000 Project Mana
Authorized licens
10.4 ADMINISTRATIVE CLOSUREThe project or phase, after either achieving its objectives or being terminated forother reasons, requires closure. Administrative closure consists of documentingproject results to formalize acceptance of the product of the project by thesponsor, or customer. It includes collecting project records; ensuring that theyreflect final specifications; analyzing project success, effectiveness, and lessonslearned; and archiving such information for future use.
Administrative closure activities should not be delayed until project comple-tion. Each phase of the project should be properly closed to ensure that impor-tant and useful information is not lost. In addition, employee skills in the staffpool database should be updated to reflect new skills and proficiency increases.
10.4.1 Inputs to Administrative Closure.1 Performance measurement documentation. All documentation produced to record
and analyze project performance, including the planning documents that estab-lished the framework for performance measurement, must be available for reviewduring administrative closure.
.2 Product documentation. Documents produced to describe the product of theproject (plans, specifications, technical documentation, drawings, electronic files,etc.—the terminology varies by application area) must also be available for reviewduring administrative closure.
.3 Other project records. Project records are discussed in Section 10.2.3.1.
10.4.2 Tools and Techniques for Administrative Closure.1 Performance reporting tools and techniques. Performance reporting tools and tech-
niques are discussed in Section 10.3.2..2 Project reports. See Section 10.2.3.2..3 Project presentations. See Section 10.3.3.3.
10.4.3 Outputs from Administrative Closure.1 Project archives. A complete set of indexed project records should be prepared
for archiving by the appropriate parties. Any project-specific or programwide his-torical databases pertinent to the project should be updated. When projects aredone under contract, or when they involve significant procurement, particularattention must be paid to archiving of financial records.
.1
.2
.3
Performance measurementdocumentationProduct documentationOther project records
.1
.2
.3
Performance reportingtools and techniquesProject reportsProject presentations
.1
.2
.3
Project archivesProject closureLessons learned
Inputs Tools & Techniques Outputs
Management Body of Knowledge (PMBOK® Guide) 2000 Editiongement Institute, Four Campus Boulevard, Newtown Square, PA 19073-3299 USA 125
ed use limited to: Old Dominion University. Downloaded on September 15,2010 at 18:15:01 UTC from IEEE Xplore. Restrictions apply.

Chapter 10—Project Communications Management
126
10.4
.3.2
|Ch
apte
r 11
Authorized licensed use li
.2 Project closure. Confirmation that the project has met all customer requirementsfor the product of the project (the customer has formally accepted the projectresults and deliverables and the requirements of the delivering organization—forexample, staff evaluations, budget reports, lessons learned, etc.).
.3 Lessons learned. Lessons learned are discussed in Section 4.3.3.3.
A Guide to the Project Management Body of Knowledge (PMBOK® Guide) 2000 Edition©2000 Project Management Institute, Four Campus Boulevard, Newtown Square, PA 19073-3299 USA
mited to: Old Dominion University. Downloaded on September 15,2010 at 18:15:01 UTC from IEEE Xplore. Restrictions apply.

Chapter 11
Project Risk Management
A Guide to the Project Management B©2000 Project Management Institute
Authorized licensed use limited t
Risk management is the systematic process of identifying, analyzing, andresponding to project risk. It includes maximizing the probability and conse-quences of positive events and minimizing the probability and consequences ofadverse events to project objectives. Figure 11-1 provides an overview of the fol-lowing major processes:
o,
11.1 Risk Management Planning—deciding how to approach and plan the risk man-agement activities for a project.
11.2 Risk Identification—determining which risks might affect the project and doc-umenting their characteristics.
11.3 Qualitative Risk Analysis—performing a qualitative analysis of risks and con-ditions to prioritize their effects on project objectives.
11.4 Quantitative Risk Analysis—measuring the probability and consequences ofrisks and estimating their implications for project objectives.
11.5 Risk Response Planning—developing procedures and techniques to enhanceopportunities and reduce threats to the project’s objectives.
11.6 Risk Monitoring and Control—monitoring residual risks, identifying new risks,executing risk reduction plans, and evaluating their effectiveness throughout theproject life cycle.
o
These processes interact with each other and with the processes in the otherknowledge areas. Each process generally occurs at least once in every project.Although processes are presented here as discrete elements with well-defined inter-faces, in practice they may overlap and interact in ways not detailed here. Processinteractions are discussed in detail in Chapter 3.
Project risk is an uncertain event or condition that, if it occurs, has a positiveor a negative effect on a project objective. A risk has a cause and, if it occurs, aconsequence. For example, a cause may be requiring a permit or having limitedpersonnel assigned to the project. The risk event is that the permit may takelonger than planned, or the personnel may not be adequate for the task. If eitherof these uncertain events occur, there will be a consequence on the project cost,schedule, or quality. Risk conditions could include aspects of the project envi-ronment that may contribute to project risk such as poor project managementpractices, or dependency on external participants that cannot be controlled.
Project risk includes both threats to the project’s objectives and opportunitiesto improve on those objectives. It has its origins in the uncertainty that is presentin all projects. Known risks are those that have been identified and analyzed, and
dy of Knowledge (PMBOK® Guide) 2000 Edition Four Campus Boulevard, Newtown Square, PA 19073-3299 USA 127
: Old Dominion University. Downloaded on September 15,2010 at 18:15:01 UTC from IEEE Xplore. Restrictions apply.

A Guide to the Project Management Body of Knowledge (PMBOK® Guide) 2000 Edition©2000 Project Management Institute, Four Campus Boulevard, Newtown Square, PA 19073-3299 USA
Chapter 11—Project Risk Management
128
Figure 11–1. Project Risk Management Overview
PROJECT RISKMANAGEMENT
11.2 Risk Identification 11.3 Qualitative RiskAnalysis
11.1
.1 Inputs
.2 Tools and Techniques
.3 Outputs
.1 Project charter
.2 Organization’s riskmanagement policies
.3 Defined roles andresponsibilities
.4 Stakeholder risktolerances
.5 Template for theorganization’s riskmanagement plan
.6 Work breakdownstructure (WBS)
.1 Planning meetings
.1 Risk management plan
.1 Inputs
.2 Tools and Techniques
.3 Outputs
.1 Risk management plan
.2 Project planning outputs
.3 Risk categories
.4 Historical information
.1 Documentation reviews
.2 Information-gatheringtechniques
.3 Checklists
.4 Assumptions analysis
.5 Diagramming techniques
.1 Risks
.2 Triggers
.3 Inputs to other processes
.1 Inputs
.2 Tools and Techniques
.3 Outputs
.1 Risk management plan
.2 Identified risks
.3 Project status
.4 Project type
.5 Data precision
.6 Scales of probabilityand impact
.7 Assumptions
.1 Risk probability andimpact
.2 Probability/impactrisk rating matrix
.3 Project assumptionstesting
.4 Data precision ranking
.1 Overall risk rankingfor the project
.2 List of prioritized risks
.3 List of risks foradditional analysisand management
.4 Trends in qualitative riskanalysis results
Risk ManagementPlanning
11.5 Risk ResponsePlanning
11.6 Risk Monitoring andControl
11.4
.1 Inputs
.2 Tools and Techniques
.3 Outputs
.1 Risk management plan
.2 Identified risks
.3 List of prioritized risks
.4 List of risks foradditional analysisand management
.5 Historical information
.6 Expert judgment
.7 Other planning outputs
.1 Interviewing
.2 Sensitivity analysis
.3 Decision tree analysis
.4 Simulation
.1 Prioritized list ofquantified risks
.2 Probabilistic analysisof the project
.3 Probability of achievingthe cost and timeobjectives
.4 Trends in quantitativerisk analysis results
.1 Inputs
.2 Tools and Techniques
.3 Outputs
.1 Risk management plan
.2 List of prioritized risks
.3 Risk ranking of the project
.4 Prioritized list ofquantified risks
.5 Probabilistic analysis ofthe project
.6 Probability of achievingthe cost and timeobjectives
.7 List of potentialresponses
.8 Risk thresholds
.9 Risk owners.10 Common risk causes.11 Trends in qualitative
and quantitative riskanalysis results
.1 Avoidance
.2 Transference
.3 Mitigation
.4 Acceptance
.1 Risk response plan
.2 Residual risks
.3 Secondary risks
.4 Contractual agreements
.5 Contingency reserveamounts needed
.6 Inputs to other processes
.7 Inputs to a revisedproject plan
.1 Inputs
.2 Tools and Techniques
.3 Outputs
.1 Risk management plan
.2 Risk response plan
.3 Project communication
.4 Additional riskidentification andanalysis
.5 Scope changes
.1 Project risk responseaudits
.2 Periodic project riskreviews
.3 Earned value analysis
.4 Technical performancemeasurement
.5 Additional riskresponse planning
.1 Workaround plans
.2 Corrective action
.3 Project change requests
.4 Updates to the riskresponse plan
.5 Risk database
.6 Updates to riskidentification checklists
Quantitative RiskAnalysis
Figu
re 1
1–1
|11
.1.1
.6
Authorized licensed use limited to: Old Dominion University. Downloaded on September 15,2010 at 18:15:01 UTC from IEEE Xplore. Restrictions apply.

Chapter 11—Project Risk Management
A Guide to the Project Man©2000 Project Manageme
Authorized licensed us
it may be possible to plan for them. Unknown risks cannot be managed, althoughproject managers may address them by applying a general contingency based onpast experience with similar projects.
Organizations perceive risk as it relates to threats to project success. Risks thatare threats to the project may be accepted if they are in balance with the rewardthat may be gained by taking the risk. For example, adopting a fast-track schedulethat may be overrun is a risk taken to achieve an earlier completion date. Risksthat are opportunities may be pursued to benefit the project’s objectives.
To be successful, the organization must be committed to addressing risk man-agement throughout the project. One measure of the organizational commitment isits dedication to gathering high-quality data on project risks and their characteristics.
11.1 RISK MANAGEMENT PLANNINGRisk management planning is the process of deciding how to approach and planthe risk management activities for a project. It is important to plan for the riskmanagement processes that follow to ensure that the level, type, and visibility ofrisk management are commensurate with both the risk and importance of theproject to the organization.
11.1.1 Inputs to Risk Management Planning.1 Project charter. The project charter is discussed in Section 5.1.3.1. .2 Organization’s risk management policies. Some organizations may have prede-
fined approaches to risk analysis and response that have to be tailored to a par-ticular project.
.3 Defined roles and responsibilities. Predefined roles, responsibilities, and authoritylevels for decision-making will influence planning.
.4 Stakeholder risk tolerances. Different organizations and different individualshave different tolerances for risk. These may be expressed in policy statements orrevealed in actions.
.5 Template for the organization’s risk management plan. Some organizations havedeveloped templates (or a pro-forma standard) for use by the project team. Theorganization will continuously improve the template, based on its applicationand usefulness in the project.
.6 Work breakdown structure (WBS). The WBS is described in Section 5.3.3.1.
.1
.2
.3
.4
.5
.6
Project charterOrganization’s riskmanagement policiesDefined roles andresponsibilitiesStakeholder risktolerancesTemplate for theorganization’s riskmanagement planWork breakdownstructure (WBS)
.1 Planning meetings .1 Risk management plan
Inputs Tools & Techniques Outputs
agement Body of Knowledge (PMBOK® Guide) 2000 Editionnt Institute, Four Campus Boulevard, Newtown Square, PA 19073-3299 USA 129
e limited to: Old Dominion University. Downloaded on September 15,2010 at 18:15:01 UTC from IEEE Xplore. Restrictions apply.
Chapter 11—Project Risk Management
130
11.1
.2|
11.2
.1.3
Authorized license
11.1.2 Tools and Techniques for Risk Management Planning.1 Planning meetings. Project teams hold planning meetings to develop the risk
management plan. Attendees include the project manager, the project teamleaders, anyone in the organization with responsibility to manage the risk plan-ning and execution activities, key stakeholders, and others, as needed. They usethe risk management templates and other inputs as appropriate.
11.1.3 Outputs from Risk Management Planning.1 Risk management plan. The risk management plan describes how risk identifi-
cation, qualitative and quantitative analysis, response planning, monitoring, andcontrol will be structured and performed during the project life cycle. The riskmanagement plan does not address responses to individual risks—this is accom-plished in the risk response plan, which is discussed in Section 11.5.3.1. The riskmanagement plan may include the following.■ Methodology. Defines the approaches, tools, and data sources that may be used
to perform risk management on this project. Different types of assessmentsmay be appropriate, depending upon the project stage, amount of informationavailable, and flexibility remaining in risk management.
■ Roles and responsibilities. Defines the lead, support, and risk managementteam membership for each type of action in the risk management plan. Riskmanagement teams organized outside of the project office may be able to per-form more independent, unbiased risk analyses of project than those from thesponsoring project team.
■ Budgeting. Establishes a budget for risk managment for the project.■ Timing. Defines how often the risk management process will be performed
throughout the project life cycle. Results should be developed early enough toaffect decisions. The decisions should be revisited periodically during project execution.
■ Scoring and interpretation. The scoring and interpretation methods appropriatefor the type and timing of the qualitative and quantitative risk analysis beingperformed. Methods and scoring must be determined in advance to ensureconsistency.
■ Thresholds. The threshold criteria for risks that will be acted upon, by whom,and in what manner. The project owner, customer, or sponsor may have adifferent risk threshold. The acceptable threshold forms the target againstwhich the project team will measure the effectiveness of the risk responseplan execution.
■ Reporting formats. Describes the content and format of the risk response plandescribed in Section 11.5.3.1. Defines how the results of the risk managementprocesses will be documented, analyzed, and communicated to the projectteam, internal and external stakeholders, sponsors, and others.
■ Tracking. Documents how all facets of risk activities will be recorded for thebenefit of the current project, future needs, and lessons learned. Documentsif and how risk processes will be audited.
A Guide to the Project Management Body of Knowledge (PMBOK® Guide) 2000 Edition©2000 Project Management Institute, Four Campus Boulevard, Newtown Square, PA 19073-3299 USA
d use limited to: Old Dominion University. Downloaded on September 15,2010 at 18:15:01 UTC from IEEE Xplore. Restrictions apply.

Chapter 11—Project Risk Management
A Guide to the Project M©2000 Project Manage
Authorized licensed
11.2 RISK IDENTIFICATIONRisk identification involves determining which risks might affect the project anddocumenting their characteristics.
Participants in risk identification generally include the following, as possible:project team, risk management team, subject matter experts from other parts ofthe company, customers, end users, other project managers, stakeholders, andoutside experts.
Risk identification is an iterative process. The first iteration may be performedby a part of the project team, or by the risk management team. The entire projectteam and primary stakeholders may make a second iteration. To achieve anunbiased analysis, persons who are not involved in the project may perform thefinal iteration.
Often simple and effective risk responses can be developed and even imple-mented as soon as the risk is identified.
11.2.1 Inputs to Risk Identification.1 Risk management plan. This plan is described in Section 11.1.3..2 Project planning outputs. Risk identification requires an understanding of the
project’s mission, scope, and objectives of the owner, sponsor, or stakeholders.Outputs of other processes should be reviewed to identify possible risks acrossthe entire project. These may include, but are not limited to:■ Project charter.■ WBS.■ Product description.■ Schedule and cost estimates.■ Resource plan.■ Procurement plan.■ Assumption and constraint lists.
.3 Risk categories. Risks that may affect the project for better or worse can be iden-tified and organized into risk categories. Risk categories should be well definedand should reflect common sources of risk for the industry or application area.Categories include the following:■ Technical, quality, or performance risks—such as reliance on unproven or
complex technology, unrealistic performance goals, changes to the technologyused or to industry standards during the project.
.1
.2
.3
.4
Risk management planProject planning outputsRisk categoriesHistorical information
.12
.3
.4
.5
Documentation reviewsInformation-gatheringtechniquesChecklistsAssumptions analysisDiagramming techniques
.1
.2
.3
RisksTriggersInputs to other processes
Inputs Tools & Techniques Outputs
anagement Body of Knowledge (PMBOK® Guide) 2000 Editionment Institute, Four Campus Boulevard, Newtown Square, PA 19073-3299 USA 131
use limited to: Old Dominion University. Downloaded on September 15,2010 at 18:15:01 UTC from IEEE Xplore. Restrictions apply.

Chapter 11—Project Risk Management
132
11.2
.1.4
|11
.3
Authorized licensed use
■ Project-management risks—such as poor allocation of time and resources, inadequate quality of the project plan, poor use of project management dis-ciplines.
■ Organizational risks—such as cost, time, and scope objectives that are inter-nally inconsistent, lack of prioritization of projects, inadequacy or interruptionof funding, and resource conflicts with other projects in the organization.
■ External risks—such as shifting legal or regulatory environment, labor issues,changing owner priorities, country risk, and weather. Force majeure risks suchas earthquakes, floods, and civil unrest generally require disaster recoveryactions rather than risk management.
.4 Historical information. Information on prior projects may be available from thefollowing sources:■ Project files—one or more of the organizations involved in the project may
maintain records of previous project results that can be used to identify risks.These may be final project reports or risk response plans. They may includeorganized lessons learned that describe problems and their resolutions, or beavailable through the experience of the project stakeholders or others in theorganization.
■ Published information—commercial databases, academic studies, bench-marking, and other published studies may be available for many applicationareas.
11.2.2 Tools and Techniques for Risk Identification.1 Documentation reviews. Performing a structured review of project plans and
assumptions, both at the total project and detailed scope levels, prior project files,and other information is generally the initial step taken by project teams.
.2 Information-gathering techniques. Examples of information-gathering techniquesused in risk identification can include brainstorming; Delphi; interviewing; andstrengths, weaknesses, opportunities, and threats (SWOT) analysis.■ Brainstorming. Brainstorming is probably the most frequently used risk iden-
tification technique. The goal is to obtain a comprehensive list of risks that canbe addressed later in the qualitative and quantitative risk analysis processes.
The project team usually performs brainstorming, although a multidisci-plinary set of experts can also perform this technique. Under the leadership ofa facilitator, these people generate ideas about project risk. Sources of risk areidentified in broad scope and posted for all to examine during the meeting.Risks are then categorized by type of risk, and their definitions are sharpened.
■ Delphi technique. The Delphi technique is a way to reach a consensus ofexperts on a subject such as project risk. Project risk experts are identified butparticipate anonymously.
A facilitator uses a questionnaire to solicit ideas about the important projectrisks. The responses are submitted and are then circulated to the experts forfurther comment. Consensus on the main project risks may be reached in afew rounds of this process. The Delphi technique helps reduce bias in the dataand keeps any person from having undue influence on the outcome.
■ Interviewing. Risks can be identified by interviews of experienced project man-agers or subject-matter experts. The person responsible for risk identificationidentifies the appropriate individuals, briefs them on the project, and provides
A Guide to the Project Management Body of Knowledge (PMBOK® Guide) 2000 Edition©2000 Project Management Institute, Four Campus Boulevard, Newtown Square, PA 19073-3299 USA
limited to: Old Dominion University. Downloaded on September 15,2010 at 18:15:01 UTC from IEEE Xplore. Restrictions apply.

Chapter 11—Project Risk Management
A Guide to the Project Mana©2000 Project Managemen
Authorized licensed us
information such as the WBS and the list of assumptions. The intervieweesidentify risks on the project based on their experience, project information,and other sources that they find useful.
■ Strengths, weaknesses, opportunities, and threats (SWOT) analysis. Ensuresexamination of the project from each of the SWOT perspectives to increase thebreadth of the risks considered.
.3 Checklists. Checklists for risk identification can be developed based on historicalinformation and knowledge that has been accumulated from previous similarprojects and from other sources of information. One advantage of using a check-list is that risk identification is quick and simple. One disadvantage is that it isimpossible to build an exhaustive checklist of risks, and the user may be effec-tively limited to the categories in the list. Care should be taken to explore itemsthat do not appear on a standard checklist if they seem relevant to the specificproject. The checklist should itemize all types of possible risks to the project. It isimportant to review the checklist as a formal step of every project-closing pro-cedure to improve the list of potential risks, to improve the description of risks.
.4 Assumptions analysis. Every project is conceived and developed based on a set ofhypotheses, scenarios, or assumptions. Assumptions analysis is a technique thatexplores the assumptions’ validity. It identifies risks to the project from inaccu-racy, inconsistency, or incompleteness of assumptions.
.5 Diagramming techniques. Diagramming techniques may include:■ Cause-and-effect diagrams (also known as Ishikawa or fishbone diagrams)—
useful for identifying causes of risks (described in Section 8.1.2.3).■ System or process flow charts—show how various elements of a system inter-
relate and the mechanism of causation (described in Section 8.1.2.3).■ Influence diagrams—a graphical representation of a problem showing causal
influences, time ordering of events, and other relationships among variablesand outcomes.
11.2.3 Outputs from Risk Identification.1 Risks. A risk is an uncertain event or condition that, if it occurs, has a positive or
negative effect on a project objective..2 Triggers. Triggers, sometimes called risk symptoms or warning signs, are indications
that a risk has occurred or is about to occur. For example, failure to meet interme-diate milestones may be an early warning signal of an impending schedule delay.
.3 Inputs to other processes. Risk identification may identify a need for further actionin another area. For example, the WBS may not have sufficient detail to allow ade-quate identification of risks, or the schedule may not be complete or entirely logical.
11.3 QUALITATIVE RISK ANALYSISQualitative risk analysis is the process of assessing the impact and likelihood ofidentified risks. This process prioritizes risks according to their potential effect onproject objectives. Qualitative risk analysis is one way to determine the impor-tance of addressing specific risks and guiding risk responses. The time-criticalityof risk-related actions may magnify the importance of a risk. An evaluation of thequality of the available information also helps modify the assessment of the risk.Qualitative risk analysis requires that the probability and consequences of therisks be evaluated using established qualitative-analysis methods and tools.
gement Body of Knowledge (PMBOK® Guide) 2000 Editiont Institute, Four Campus Boulevard, Newtown Square, PA 19073-3299 USA 133
e limited to: Old Dominion University. Downloaded on September 15,2010 at 18:15:01 UTC from IEEE Xplore. Restrictions apply.
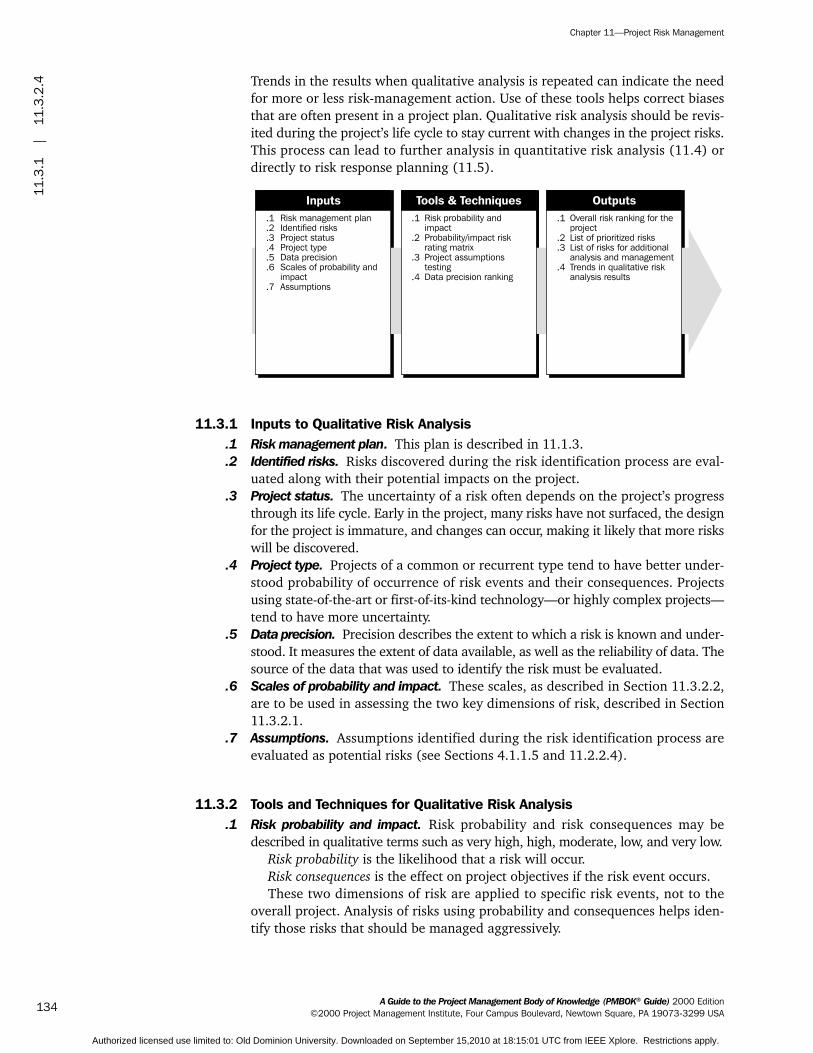
Chapter 11—Project Risk Management
134
11.3
.1|
11.3
.2.4
Authorized licensed u
Trends in the results when qualitative analysis is repeated can indicate the needfor more or less risk-management action. Use of these tools helps correct biasesthat are often present in a project plan. Qualitative risk analysis should be revis-ited during the project’s life cycle to stay current with changes in the project risks.This process can lead to further analysis in quantitative risk analysis (11.4) ordirectly to risk response planning (11.5).
11.3.1 Inputs to Qualitative Risk Analysis.1 Risk management plan. This plan is described in 11.1.3..2 Identified risks. Risks discovered during the risk identification process are eval-
uated along with their potential impacts on the project..3 Project status. The uncertainty of a risk often depends on the project’s progress
through its life cycle. Early in the project, many risks have not surfaced, the designfor the project is immature, and changes can occur, making it likely that more riskswill be discovered.
.4 Project type. Projects of a common or recurrent type tend to have better under-stood probability of occurrence of risk events and their consequences. Projectsusing state-of-the-art or first-of-its-kind technology—or highly complex projects—tend to have more uncertainty.
.5 Data precision. Precision describes the extent to which a risk is known and under-stood. It measures the extent of data available, as well as the reliability of data. Thesource of the data that was used to identify the risk must be evaluated.
.6 Scales of probability and impact. These scales, as described in Section 11.3.2.2,are to be used in assessing the two key dimensions of risk, described in Section11.3.2.1.
.7 Assumptions. Assumptions identified during the risk identification process areevaluated as potential risks (see Sections 4.1.1.5 and 11.2.2.4).
11.3.2 Tools and Techniques for Qualitative Risk Analysis.1 Risk probability and impact. Risk probability and risk consequences may be
described in qualitative terms such as very high, high, moderate, low, and very low.Risk probability is the likelihood that a risk will occur.Risk consequences is the effect on project objectives if the risk event occurs.These two dimensions of risk are applied to specific risk events, not to the
overall project. Analysis of risks using probability and consequences helps iden-tify those risks that should be managed aggressively.
.1
.2
.3
.4
.5
.6
.7
Risk management planIdentified risksProject statusProject typeData precisionScales of probability andimpactAssumptions
.1
.2
.3
.4
Risk probability andimpactProbability/impact riskrating matrixProject assumptionstestingData precision ranking
.1
.2
.3
.4
Overall risk ranking for theprojectList of prioritized risksList of risks for additionalanalysis and managementTrends in qualitative riskanalysis results
Inputs Tools & Techniques Outputs
A Guide to the Project Management Body of Knowledge (PMBOK® Guide) 2000 Edition©2000 Project Management Institute, Four Campus Boulevard, Newtown Square, PA 19073-3299 USA
se limited to: Old Dominion University. Downloaded on September 15,2010 at 18:15:01 UTC from IEEE Xplore. Restrictions apply.

Chapter 11—Project Risk Management
A Guide to the Project Mana©2000 Project Managemen
Authorized licensed use
.2 Probability/impact risk rating matrix. A matrix may be constructed that assigns riskratings (very low, low, moderate, high, and very high) to risks or conditions basedon combining probability and impact scales. Risks with high probability and highimpact are likely to require further analysis, including quantification, and aggres-sive risk management. The risk rating is accomplished using a matrix and riskscales for each risk.
A risk’s probability scale naturally falls between 0.0 (no probability) and 1.0(certainty). Assessing risk probability may be difficult because expert judgmentis used, often without benefit of historical data. An ordinal scale, representing rel-ative probability values from very unlikely to almost certain, could be used. Alter-natively, specific probabilities could be assigned by using a general scale (e.g.,.1 / .3 / .5 / .7 / .9).
The risk’s impact scale reflects the severity of its effect on the project objective.Impact can be ordinal or cardinal, depending upon the culture of the organizationconducting the analysis. Ordinal scales are simply rank-ordered values, such asvery low, low, moderate, high, and very high. Cardinal scales assign values tothese impacts. These values are usually linear (e.g., .1 / .3 / .5 / .7 / .9), but areoften nonlinear (e.g., .05 / .1 / .2 / .4 / .8), reflecting the organization’s desire toavoid high-impact risks. The intent of both approaches is to assign a relative valueto the impact on project objectives if the risk in question occurs. Well-definedscales, whether ordinal or cardinal, can be developed using definitions agreedupon by the organization. These definitions improve the quality of the data andmake the process more repeatable.
Figure 11-2 is an example of evaluating risk impacts by project objective. Itillustrates its use for either ordinal or cardinal approach. These scaled descriptorsof relative impact should be prepared by the organization before the project begins.
Figure 11-3 is a Probability-Impact (P-I) matrix. It illustrates the simple mul-tiplication of the scale values assigned to estimates of probability and impact, acommon way to combine these two dimensions, to determine whether a risk isconsidered low, moderate, or high. This figure presents a non-linear scale as anexample of aversion to high-impact risks, but linear scales are often used. Alter-natively, the P-I matrix can be developed using ordinal scales. The organizationmust determine which combinations of probability and impact result in a risk’sbeing classified as high risk (red condition), moderate risk (yellow condition),and low risk (green condition) for either approach. The risk score helps put therisk into a category that will guide risk response actions.
.3 Project assumptions testing. Identified assumptions must be tested against twocriteria: assumption stability and the consequences on the project if the assump-tion is false. Alternative assumptions that may be true should be identified andtheir consequences on the project objectives tested in the qualitative risk-analysisprocess.
.4 Data precision ranking. Qualitative risk analysis requires accurate and unbiaseddata if it is to be helpful to project management. Data precision ranking is a tech-nique to evaluate the degree to which the data about risks is useful for risk man-agement. It involves examining:■ Extent of understanding of the risk.■ Data available about the risk.■ Quality of the data.■ Reliability and integrity of the data.
gement Body of Knowledge (PMBOK® Guide) 2000 Editiont Institute, Four Campus Boulevard, Newtown Square, PA 19073-3299 USA 135
limited to: Old Dominion University. Downloaded on September 15,2010 at 18:15:01 UTC from IEEE Xplore. Restrictions apply.

Chapter 11—Project Risk Management
136
Figu
re 1
1–2
|11
.4
Figure 11–2. Rating Impacts for a Risk
Evaluating Impact of a Risk on Major Project Objectives(ordinal scale or cardinal, non-linear scale)
ProjectObjective
Very Low.05
Low.1
Moderate.2
High.4
Very High.8
Cost
Schedule
Scope
Quality
InsignificantCost Increase
InsignificantScheduleSlippage
Scope DecreaseBarelyNoticeable
QualityDegradationBarelyNoticeable
<5% CostIncrease
ScheduleSlippage<5%
Minor Areasof ScopeAre Affected
Only VeryDemandingApplicationsAre Affected
5–10% CostIncrease
Overall ProjectSlippage5–10%
Major Areas of
Are Affected
QualityReductionRequires ClientApproval
Scope
10–20% CostIncrease
Overall ProjectSlippage10–20%
ReductionUnacceptableto the Client
QualityReductionUnacceptableto the Client
Scope
>20% CostIncrease
OverallProjectScheduleSlips >20%
Project EndItem IsEffectivelyUseless
Project EndItem IsEffectivelyUnusable
The impacts on project objectives can be assessed on a scale from Very Low to Very High or on a numerical scale.The numerical (cardinal) scale shown here is non-linear, indicating that the organization wishes specificallyto avoid risks with high and very-high impact.
Authorized licensed
The use of data of low precision—for instance, if a risk is not well understood—may lead to a qualitative risk analysis of little use to the project manager. If aranking of data precision is unacceptable, it may be possible to gather better data.
11.3.3 Outputs from Qualitative Risk Analysis.1 Overall risk ranking for the project. Risk ranking may indicate the overall risk posi-
tion of a project relative to other projects by comparing the risk scores. It can beused to assign personnel or other resources to projects with different risk rankings,to make a benefit-cost analysis decision about the project, or to support a recom-mendation for project initiation, continuation, or cancellation.
.2 List of prioritized risks. Risks and conditions can be prioritized by a number of cri-teria. These include rank (high, moderate, and low) or WBS level. Risks may alsobe grouped by those that require an immediate response and those that can behandled at a later date. Risks that affect cost, schedule, functionality, and qualitymay be assessed separately with different ratings. Significant risks should have adescription of the basis for the assessed probability and impact.
.3 List of risks for additional analysis and management. Risks classified as high ormoderate would be prime candidates for more analysis, including quantitativerisk analysis, and for risk management action.
A Guide to the Project Management Body of Knowledge (PMBOK® Guide) 2000 Edition©2000 Project Management Institute, Four Campus Boulevard, Newtown Square, PA 19073-3299 USA
use limited to: Old Dominion University. Downloaded on September 15,2010 at 18:15:01 UTC from IEEE Xplore. Restrictions apply.

Chapter 11—Project Risk Management
A Guide to the Project Man©2000 Project Manageme
Figure 11–3. Probability-Impact Matrix
Risk Score for a Specific Risk
Probability Risk Score = P × I
Impact on an Objective (e.g., cost, time, or scope)(Ratio Scale)
0.9
0.7
0.5
0.3
0.1
0.05
0.04
0.03
0.02
0.01
0.05
0.09
0.07
0.05
0.03
0.01
0.10
0.12
0.04
0.40
0.08
0.80
0.14
0.10
0.06
0.02
0.20
0.18 0.36
0.28
0.20
0.72
0.56
0.40
0.24
Each risk is rated on its probability of occurring and impact if it does occur. The organization’s thresholds forlow (dark gray), moderate (light gray) or high (black) risk as shown in the matrix determines the risk’s score.
Authorized licensed u
.4 Trends in qualitative risk analysis results. As the analysis is repeated, a trend ofresults may become apparent, and can make risk response or further analysismore or less urgent and important.
11.4 QUANTITATIVE RISK ANALYSISThe quantitative risk analysis process aims to analyze numerically the probabilityof each risk and its consequence on project objectives, as well as the extent ofoverall project risk. This process uses techniques such as Monte Carlo simulationand decision analysis to:■ Determine the probability of achieving a specific project objective.■ Quantify the risk exposure for the project, and determine the size of cost and
schedule contingency reserves that may be needed.■ Identify risks requiring the most attention by quantifying their relative con-
tribution to project risk.■ Identify realistic and achievable cost, schedule, or scope targets.
Quantitative risk analysis generally follows qualitative risk analysis. It requiresrisk identification. The qualitative and quantitative risk analysis processes can beused separately or together. Considerations of time and budget availability and theneed for qualitative or quantitative statements about risk and impacts will deter-mine which method(s) to use. Trends in the results when quantitative analysis isrepeated can indicate the need for more or less risk management action.
agement Body of Knowledge (PMBOK® Guide) 2000 Editionnt Institute, Four Campus Boulevard, Newtown Square, PA 19073-3299 USA 137
se limited to: Old Dominion University. Downloaded on September 15,2010 at 18:15:01 UTC from IEEE Xplore. Restrictions apply.

Chapter 11—Project Risk Management
138
11.4
.1|
11.4
.3.4
Authorized licensed
11.4.1 Inputs to Quantitative Risk Analysis.1 Risk management plan. This plan is described in Section 11.1.3..2 Identified risks. These are described in Section 11.2.3.1..3 List of prioritized risks. This is described in Section 11.3.3.2..4 List of risks for additional analysis and management. This is described in Section
11.3.3.3..5 Historical information. Information on prior, similar completed projects, studies
of similar projects by risk specialists, and risk databases that may be availablefrom industry or proprietary sources (see Section 11.2.1.4).
.6 Expert judgment. Input may come from the project team, other subject matterexperts in the organization, and from others outside the organization. Other sourcesof information include engineering or statistical experts (see Section 5.1.2.2).
.7 Other planning outputs. Most helpful planning outputs are the project logic andduration estimates used in determining schedules, the WBS listing of all cost ele-ments with cost estimates, and models of project technical objectives.
11.4.2 Tools and Techniques for Quantitative Risk Analysis.1 Interviewing. Interviewing techniques are used to quantify the probability and con-
sequences of risks on project objectives. A risk interview with project stakeholdersand subject-matter experts may be the first step in quantifying risks. The infor-mation needed depends upon the type of probability distributions that will beused. For instance, information would be gathered on the optimistic (low), pes-simistic (high), and the most likely scenarios if triangular distributions are used,or on mean and standard deviation for the normal and log normal distributions.Examples of three-point estimates for a cost estimate are shown in Figure 11-4.
Continuous probability distributions are usually used in quantitative riskanalysis. Distributions represent both probability and consequences of the projectcomponent. Common distribution types include the uniform, normal, triangular,beta, and log normal. Two examples of these distributions are shown in Figure11-5 (where the vertical axis refers to probability and the horizontal axis to impact).
Documenting the rationale of the risk ranges is an important component ofthe risk interview, because it can lead to effective strategies for risk response inthe risk response planning process, described in Section 11.5.
.1
.2
.3
.4
.5
.6
.7
Risk management planIdentified risksList of prioritized risksList of risks for additionalanalysis and managementHistorical informationExpert judgmentOther planning outputs
.1
.2
.3
.4
InterviewingSensitivity analysisDecision tree analysisSimulation
.1
.2
.3
.4
Prioritized list of quantifiedrisksProbabilistic analysis ofthe projectProbability of achieving thecost and time objectivesTrends in quantitative riskanalysis results
Inputs Tools & Techniques Outputs
A Guide to the Project Management Body of Knowledge (PMBOK® Guide) 2000 Edition©2000 Project Management Institute, Four Campus Boulevard, Newtown Square, PA 19073-3299 USA
use limited to: Old Dominion University. Downloaded on September 15,2010 at 18:15:01 UTC from IEEE Xplore. Restrictions apply.

Chapter 11—Project Risk Management
A Guide to the Project Ma©2000 Project Managem
Figure 11–4. Cost Estimates and Ranges from the Risk Interview
WBS Element Low Most Likely HighDesign 4 6 10Build 16 20 35Test 11 15 23
Total Project 41
Project Cost Estimates and Ranges
The risk interview determines the three-point estimates for each WBS element. The traditional estimate of $41,found by summing the most likely costs, is relatively unlikely, as shown in Figure 11–7.
Authorized licensed
.2 Sensitivity analysis. Sensitivity analysis helps to determine which risks have themost potential impact on the project. It examines the extent to which the uncer-tainty of each project element affects the objective being examined when allother uncertain elements are held at their baseline values.
.3 Decision tree analysis. A decision analysis is usually structured as a decision tree.The decision tree is a diagram that describes a decision under consideration andthe implications of choosing one or another of the available alternatives. It incor-porates probabilities of risks and the costs or rewards of each logical path ofevents and future decisions. Solving the decision tree indicates which decisionyields the greatest expected value to the decision-maker when all the uncertainimplications, costs, rewards, and subsequent decisions are quantified. A decisiontree is shown in Figure 11-6.
.4 Simulation. A project simulation uses a model that translates the uncertaintiesspecified at a detailed level into their potential impact on objectives that areexpressed at the level of the total project. Project simulations are typically per-formed using the Monte Carlo technique.
For a cost risk analysis, a simulation may use the traditional project WBS as itsmodel. For a schedule risk analysis, the Precedence Diagramming Method (PDM)schedule is used (see Section 6.2.2.1).
A cost risk simulation result is shown in Figure 11-7.
11.4.3 Outputs from Quantitative Risk Analysis.1 Prioritized list of quantified risks. This list of risks includes those that pose the
greatest threat or present the greatest opportunity to the project together witha measure of their impact.
.2 Probabilistic analysis of the project. Forecasts of potential project schedule andcost results listing the possible completion dates or project duration and costswith their associated confidence levels.
.3 Probability of achieving the cost and time objectives. The probability of achievingthe project objectives under the current plan and with the current knowledge ofthe risks facing the project can be estimated using quantitative risk.
.4 Trends in quantitative risk analysis results. As the analysis is repeated, a trend ofresults may become apparent.
nagement Body of Knowledge (PMBOK® Guide) 2000 Editionent Institute, Four Campus Boulevard, Newtown Square, PA 19073-3299 USA 139
use limited to: Old Dominion University. Downloaded on September 15,2010 at 18:15:01 UTC from IEEE Xplore. Restrictions apply.

Chapter 11—Project Risk Management
140
Figu
re 1
1–5
|11
.5.2
Figure 11–5. Examples of Commonly Used Probability Distributions
Beta Distribution Triangular Distribution
0.1
0.0
0.1
0.0
Beta and triangular distributions are frequently used in quantitative risk analysis. The Beta shown here is one exampleof a family of such distributions. Other distributions that are common include the uniform, normal, and log-normal.
Authorized licensed
11.5 RISK RESPONSE PLANNINGRisk response planning is the process of developing options and determining actionsto enhance opportunities and reduce threats to the project’s objectives. It includesthe identification and assignment of individuals or parties to take responsibility foreach agreed risk response. This process ensures that identified risks are properlyaddressed. The effectiveness of response planning will directly determine whetherrisk increases or decreases for the project.
Risk response planning must be appropriate to the severity of the risk, costeffective in meeting the challenge, timely to be successful, realistic within theproject context, agreed upon by all parties involved, and owned by a responsibleperson. Selecting the best risk response from several options is often required.
11.5.1 Inputs to Risk Response Planning.1 Risk management plan. This plan is described in Section 11.1.3..2 List of prioritized risks. This list from qualitative risk analysis is described in Section
11.3.3.2..3 Risk ranking of the project. This is described in Section 11.3.3.1.
.1
.2
.3
.4
.5
.6
.7
.8
.9.10.11
Risk management planList of prioritized risksRisk ranking of the projectPrioritized list of quantifiedrisksProbabilistic analysis ofthe projectProbability of achieving thecost and time objectivesList of potential responsesRisk thresholdsRisk ownersCommon risk causesTrends in qualitative andquantitative risk analysisresults
.1
.2
.3
.4
AvoidanceTransferenceMitigationAcceptance
.1
.2
.3
.4
.5
.6
.7
Risk response planResidual risksSecondary risksContractual agreementsContingency reserveamounts neededInputs to other processesInputs to a revisedproject plan
Inputs Tools & Techniques Outputs
A Guide to the Project Management Body of Knowledge (PMBOK® Guide) 2000 Edition©2000 Project Management Institute, Four Campus Boulevard, Newtown Square, PA 19073-3299 USA
use limited to: Old Dominion University. Downloaded on September 15,2010 at 18:15:01 UTC from IEEE Xplore. Restrictions apply.

Chapter 11—Project Risk Management
A Guide to the Project Mana©2000 Project Manageme
Figure 11–6. Decision Tree Analysis
Decision Definition Decision Node Chance Node Net Path Value
(Decision Name) (Cost of the Decision) (Probability and Payoff) (Probability andPayoff – Cost)
65% 0
200 80FALSE Product Demand
–120 41.535% 0
90 –30Decision
49 65% 0.65
120
60
70
10
TRUE Product Demand–50 49
35% 0.35
Build or Upgrade?
Build New Plant
Upgrade Existing Plant
Strong
Weak
Strong
Weak
This decision tree shows the plant decision with construction costs and probabilities and rewards of differentproduct demand scenarios. Solving the tree indicates that the organization should choose to upgrade theexisting plant since the value of that decision is $49 (vs. $41.50 for the new plant decision).
Authorized licensed us
.4 Prioritized list of quantified risks. This list from quantitative risk analysis is describedin Section 11.4.3.1.
.5 Probabilistic analysis of the project. This is described in Section 11.4.3.2.
.6 Probability of achieving the cost and time objectives. This is described in Section11.4.3.3.
.7 List of potential responses. In the risk identification process, actions may be iden-tified that respond to individual risks or categories of risks.
.8 Risk thresholds. The level of risk that is acceptable to the organization will influ-ence risk response planning (see Section 11.1.3).
.9 Risk owners. A list of project stakeholders able to act as owners of risk responses.Risk owners should be involved in developing the risk responses.
.10 Common risk causes. Several risks may be driven by a common cause. This situ-ation may reveal opportunities to mitigate two or more project risks with onegeneric response.
.11 Trends in qualitative and quantitative risk analysis results. These are described inSections 11.3.3.4 and 11.4.3.4. Trends in results can make risk response or fur-ther analysis more or less urgent and important.
11.5.2 Tools and Techniques for Risk Response PlanningSeveral risk response strategies are available. The strategy that is most likely tobe effective should be selected for each risk. Then, specific actions should bedeveloped to implement that strategy. Primary and backup strategies may beselected.
gement Body of Knowledge (PMBOK® Guide) 2000 Editionnt Institute, Four Campus Boulevard, Newtown Square, PA 19073-3299 USA 141
e limited to: Old Dominion University. Downloaded on September 15,2010 at 18:15:01 UTC from IEEE Xplore. Restrictions apply.

Chapter 11—Project Risk Management
142
Figu
re 1
1–7
|11
.5.3
.3
Figure 11–7. Cost Risk Simulation
Total Project Cost
.000
.250
.500
.750
1.000
0
5000
30.00 38.75 47.50 56.25 65.00
Pro
babi
lity
Freq
uenc
y
Cost $
Cumulative Chart
12%
$41 $50
Mean = 46.67
This cumulative likelihood distribution reflects the risk of overrunning the cost estimate assuming triangular distributions with the range data contained in Figure 11–4. It shows that the project is only 12 percent likely to meet the $41 estimate. If a conservative organization wants a 75 likelihood of success, a budget of $50 (a contingency of nearly 22 ) is required.
percentpercent
Authorized licensed use lim
.1 Avoidance. Risk avoidance is changing the project plan to eliminate the risk orcondition or to protect the project objectives from its impact. Although the projectteam can never eliminate all risk events, some specific risks may be avoided.
Some risk events that arise early in the project can be dealt with by clarifyingrequirements, obtaining information, improving communication, or acquiringexpertise. Reducing scope to avoid high-risk activities, adding resources or time,adopting a familiar approach instead of an innovative one, or avoiding an unfa-miliar subcontractor may be examples of avoidance.
.2 Transference. Risk transfer is seeking to shift the consequence of a risk to a thirdparty together with ownership of the response. Transferring the risk simply givesanother party responsibility for its management; it does not eliminate it.
Transferring liability for risk is most effective in dealing with financial risk expo-sure. Risk transfer nearly always involves payment of a risk premium to the partytaking on the risk. It includes the use of insurance, performance bonds, war-ranties, and guarantees. Contracts may be used to transfer liability for specifiedrisks to another party. Use of a fixed-price contract may transfer risk to the sellerif the project’s design is stable. Although a cost-reimbursable contract leaves moreof the risk with the customer or sponsor, it may help reduce cost if there are mid-project changes.
.3 Mitigation. Mitigation seeks to reduce the probability and/or consequences of anadverse risk event to an acceptable threshold. Taking early action to reduce theprobability of a risk’s occurring or its impact on the project is more effective thantrying to repair the consequences after it has occurred. Mitigation costs shouldbe appropriate, given the likely probability of the risk and its consequences.
A Guide to the Project Management Body of Knowledge (PMBOK® Guide) 2000 Edition©2000 Project Management Institute, Four Campus Boulevard, Newtown Square, PA 19073-3299 USA
ited to: Old Dominion University. Downloaded on September 15,2010 at 18:15:01 UTC from IEEE Xplore. Restrictions apply.

Chapter 11—Project Risk Management
A Guide to the Project Man©2000 Project Managem
Authorized licensed u
Risk mitigation may take the form of implementing a new course of actionthat will reduce the problem—e.g., adopting less complex processes, conductingmore seismic or engineering tests, or choosing a more stable seller. It may involvechanging conditions so that the probability of the risk occurring is reduced—e.g.,adding resources or time to the schedule. It may require prototype developmentto reduce the risk of scaling up from a bench-scale model.
Where it is not possible to reduce probability, a mitigation response might address the risk impact by targeting linkages that determine the severity. For example, designing redundancy into a subsystem may reduce the impact that results from a failure of the original component.
.4 Acceptance. This technique indicates that the project team has decided not tochange the project plan to deal with a risk or is unable to identify any other suit-able response strategy. Active acceptance may include developing a contingencyplan to execute, should a risk occur. Passive acceptance requires no action,leaving the project team to deal with the risks as they occur.
A contingency plan is applied to identified risks that arise during the project.Developing a contingency plan in advance can greatly reduce the cost of anaction should the risk occur. Risk triggers, such as missing intermediate mile-stones, should be defined and tracked. A fallback plan is developed if the risk hasa high impact, or if the selected strategy may not be fully effective. This mightinclude allocation of a contingency amount, development of alternative options,or changing project scope.
The most usual risk acceptance response is to establish a contingency allowance,or reserve, including amounts of time, money, or resources to account for knownrisks. The allowance should be determined by the impacts, computed at an accept-able level of risk exposure, for the risks that have been accepted.
11.5.3 Outputs from Risk Response Planning.1 Risk response plan. The risk response plan (sometimes called the risk register)
should be written to the level of detail at which the actions will be taken. Itshould include some or all of the following:■ Identified risks, their descriptions, the area(s) of the project (e.g., WBS element)
affected, their causes, and how they may affect project objectives.■ Risk owners and assigned responsibilities.■ Results from the qualitative and quantitative risk analysis processes.■ Agreed responses including avoidance, transference, mitigation, or acceptance
for each risk in the risk response plan.■ The level of residual risk expected to be remaining after the strategy is imple-
mented.■ Specific actions to implement the chosen response strategy.■ Budget and times for responses.■ Contingency plans and fallback plans.
.2 Residual risks. Residual risks are those that remain after avoidance, transfer, ormitigation responses have been taken. They also include minor risks that havebeen accepted and addressed, e.g., by adding contingency amounts to the cost ortime allowable.
.3 Secondary risks. Risks that arise as a direct result of implementing a riskresponse are termed secondary risks. These should be identified and responsesplanned.
agement Body of Knowledge (PMBOK® Guide) 2000 Editionent Institute, Four Campus Boulevard, Newtown Square, PA 19073-3299 USA 143
se limited to: Old Dominion University. Downloaded on September 15,2010 at 18:15:01 UTC from IEEE Xplore. Restrictions apply.

Chapter 11—Project Risk Management
144
11.5
.3.4
|11
.6.2
.5
Authorized licensed use
.4 Contractual agreements. Contractual agreements may be entered into to specifyeach party’s responsibility for specific risks, should they occur, and for insurance,services, and other items as appropriate to avoid or mitigate threats.
.5 Contingency reserve amounts needed. The probabilistic analysis of the project(11.4.3.2) and the risk thresholds (11.1.3.1) help the project manager determinethe amount of buffer or contingency needed to reduce the risk of overruns ofproject objectives to a level acceptable to the organization.
.6 Inputs to other processes. Most responses to risk involve expenditure of addi-tional time, cost, or resources and require changes to the project plan. Organi-zations require assurance that spending is justified for the level of risk reduction.Alternative strategies must be fed back into the appropriate processes in otherknowledge areas.
.7 Inputs to a revised project plan. The results of the response planning process mustbe incorporated into the project plan, to ensure that agreed actions are imple-mented and monitored as part of the ongoing project.
11.6 RISK MONITORING AND CONTROLRisk monitoring and control is the process of keeping track of the identified risks,monitoring residual risks and identifying new risks, ensuring the execution of riskplans, and evaluating their effectiveness in reducing risk. Risk monitoring andcontrol records risk metrics that are associated with implementing contingencyplans. Risk monitoring and control is an ongoing process for the life of theproject. The risks change as the project matures, new risks develop, or antici-pated risks disappear.
Good risk monitoring and control processes provide information that assistswith making effective decisions in advance of the risk’s occurring. Communica-tion to all project stakeholders is needed to assess periodically the acceptabilityof the level of risk on the project.
The purpose of risk monitoring is to determine if:■ Risk responses have been implemented as planned.■ Risk response actions are as effective as expected, or if new responses should
be developed.■ Project assumptions are still valid.■ Risk exposure has changed from its prior state, with analysis of trends.■ A risk trigger has occurred.■ Proper policies and procedures are followed.■ Risks have occurred or arisen that were not previously identified.
Risk control may involve choosing alternative strategies, implementing a con-tingency plan, taking corrective action, or replanning the project. The riskresponse owner should report periodically to the project manager and the riskteam leader on the effectiveness of the plan, any unanticipated effects, and anymid-course correction needed to mitigate the risk.
A Guide to the Project Management Body of Knowledge (PMBOK® Guide) 2000 Edition©2000 Project Management Institute, Four Campus Boulevard, Newtown Square, PA 19073-3299 USA
limited to: Old Dominion University. Downloaded on September 15,2010 at 18:15:01 UTC from IEEE Xplore. Restrictions apply.

Chapter 11—Project Risk Management
A Guide to the Project Ma©2000 Project Managem
Authorized licensed
11.6.1 Inputs to Risk Monitoring and Control.1 Risk management plan. The risk management plan is described in Section 11.1.3..2 Risk response plan. The risk response plan is described in Section 11.5.3.1..3 Project communication. Work results and other project records described in Sec-
tion 10.3.1 provide information about project performance and risks. Reportscommonly used to monitor and control risks include Issues Logs, Action-Item Lists,Jeopardy Warnings, or Escalation Notices.
.4 Additional risk identification and analysis. As project performance is measured andreported, potential risks not previously identified may surface. The cycle of the sixrisk processes should be implemented for these risks.
.5 Scope changes. Scope changes often require new risk analysis and responseplans. Scope changes are described in Section 5.5.3.1.
11.6.2 Tools and Techniques for Risk Monitoring and Control.1 Project risk response audits. Risk auditors examine and document the effective-
ness of the risk response in avoiding, transferring, or mitigating risk occurrenceas well as the effectiveness of the risk owner. Risk audits are performed duringthe project life cycle to control risk.
.2 Periodic project risk reviews. Project risk reviews should be regularly scheduled.Project risk should be an agenda item at all team meetings. Risk ratings and pri-oritization may change during the life of the project. Any changes may requireadditional qualitative or quantitative analysis.
.3 Earned value analysis. Earned value is used for monitoring overall project per-formance against a baseline plan. Results from an earned value analysis mayindicate potential deviation of the project at completion from cost and scheduletargets. When a project deviates significantly from the baseline, updated riskidentification and analysis should be performed. Earned value analysis isdescribed in Section 10.3.2.4.
.4 Technical performance measurement. Technical performance measurement com-pares technical accomplishments during project execution to the project plan’sschedule of technical achievement. Deviation, such as not demonstrating func-tionality as planned at a milestone, can imply a risk to achieving the project’s scope.
.5 Additional risk response planning. If a risk emerges that was not anticipated in therisk response plan, or its impact on objectives is greater than expected, theplanned response may not be adequate. It will be necessary to perform additionalresponse planning to control the risk.
.1
.2
.3
.4
.5
Risk management planRisk response planProject communicationAdditional riskidentification and analysisScope changes
.1
.2
.3
.4
.5
Project risk responseauditsPeriodic project riskreviewsEarned value analysisTechnical performancemeasurementAdditional risk responseplanning
.1
.2
.3
.4
.5
.6
Workaround plansCorrective actionProject change requestsUpdates to the riskresponse planRisk databaseUpdates to riskidentification checklists
Inputs Tools & Techniques Outputs
nagement Body of Knowledge (PMBOK® Guide) 2000 Editionent Institute, Four Campus Boulevard, Newtown Square, PA 19073-3299 USA 145
use limited to: Old Dominion University. Downloaded on September 15,2010 at 18:15:01 UTC from IEEE Xplore. Restrictions apply.

Chapter 11—Project Risk Management
146
11.6
.3|
Chap
ter
12
Authorized licensed
11.6.3 Outputs from Risk Monitoring and Control.1 Workaround plans. Workarounds are unplanned responses to emerging risks that
were previously unidentified or accepted. Workarounds must be properly docu-mented and incorporated into the project plan and risk response plan.
.2 Corrective action. Corrective action consists of performing the contingency planor workaround.
.3 Project change requests. Implementing contingency plans or workarounds fre-quently results in a requirement to change the project plan to respond to risks.The result is issuance of a change request that is managed by integrated changecontrol, as described in Section 4.3.
.4 Updates to the risk response plan. Risks may occur or not. Risks that do occurshould be documented and evaluated. Implementation of risk controls mayreduce the impact or probability of identified risks. Risk rankings must bereassessed so that new, important risks may be properly controlled. Risks that donot occur should be documented and closed in the risk response plan.
.5 Risk database. A repository that provides for collection, maintenance, andanalysis of data gathered and used in the risk management processes. Use of thisdatabase will assist risk management throughout the organization and, overtime, form the basis of a risk lessons learned program.
.6 Updates to risk identification checklists. Checklists updated from experience willhelp risk management of future projects.
A Guide to the Project Management Body of Knowledge (PMBOK® Guide) 2000 Edition©2000 Project Management Institute, Four Campus Boulevard, Newtown Square, PA 19073-3299 USA
use limited to: Old Dominion University. Downloaded on September 15,2010 at 18:15:01 UTC from IEEE Xplore. Restrictions apply.

Chapter 12
Project Procurement Management
A Guide to the Project Manageme©2000 Project Management Insti
Authorized licensed use limite
Project Procurement Management includes the processes required to acquiregoods and services, to attain project scope, from outside the performing organi-zation. For simplicity, goods and services, whether one or many, will generally bereferred to as a product. Figure 12-1 provides an overview of the following majorprocesses:
nttu
12.1 Procurement Planning—determining what to procure and when.12.2 Solicitation Planning—documenting product requirements and identifying
potential sources.12.3 Solicitation—obtaining quotations, bids, offers, or proposals, as appropriate.12.4 Source Selection—choosing from among potential sellers.12.5 Contract Administration—managing the relationship with the seller.12.6 Contract Closeout—completion and settlement of the contract, including res-
olution of any open items.
d
These processes interact with each other and with the processes in the otherknowledge areas as well. Each process may involve effort from one or more indi-viduals or groups of individuals, based on the needs of the project. Although theprocesses are presented here as discrete elements with well-defined interfaces, inpractice they may overlap and interact in ways not detailed here. Process inter-actions are discussed in detail in Chapter 3.
Project Procurement Management is discussed from the perspective of the buyerin the buyer-seller relationship. The buyer-seller relationship can exist at manylevels on one project. Depending on the application area, the seller may be calleda subcontractor, a vendor, or a supplier.
The seller will typically manage its work as a project. In such cases:■ The buyer becomes the customer, and is thus a key stakeholder for the seller.■ The seller’s project management team must be concerned with all the processes
of project management, not just with those of this knowledge area.■ The terms and conditions of the contract become a key input to many of the
seller’s processes. The contract may actually contain the input (e.g., major deliv-erables, key milestones, cost objectives), or it may limit the project team’s options(e.g., buyer approval of staffing decisions is often required on design projects).
Body of Knowledge (PMBOK® Guide) 2000 Editionte, Four Campus Boulevard, Newtown Square, PA 19073-3299 USA 147
to: Old Dominion University. Downloaded on September 15,2010 at 18:15:01 UTC from IEEE Xplore. Restrictions apply.

A Guide to the Project Management Body of Knowledge (PMBOK® Guide) 2000 Edition©2000 Project Management Institute, Four Campus Boulevard, Newtown Square, PA 19073-3299 USA
Chapter 12—Project Procurement Management
148
Figure 12–1. Project Procurement Management Overview
PROJECT PROCUREMENTMANAGEMENT
12.2 Solicitation Planning 12.3 Solicitation12.1
.1 Inputs.1 Scope statement.2 Product description.3 Procurement resources.4 Market conditions.5 Other planning outputs.6 Constraints.7 Assumptions
.1 Make-or-buy analysis
.2 Expert judgment
.3 Contract type selection
.1 Procurementmanagement plan
.2 Statement(s) of work
.2 Tools and Techniques
.3 Outputs
.1 Inputs
.2 Tools and Techniques
.3 Outputs
.1 Procurementmanagement plan
.2 Statement(s) of work
.3 Other planning outputs
.1 Standard forms
.2 Expert judgment
.1 Procurement documents
.2 Evaluation criteria
.3 Statement of workupdates
.1 Inputs
.2 Tools and Techniques
.3 Outputs
.1 Procurement documents
.2 Qualified seller lists
.1 Bidder conferences
.2 Advertising
.1 Proposals
Procurement Planning
12.5 Contract Administration 12.6 Contract Closeout12.4
.1 Inputs
.2 Tools and Techniques
.3 Outputs
.1 Proposals
.2 Evaluation criteria
.3 Organizational policies
.1 Contract negotiation
.2 Weighting system
.3 Screening system
.4 Independent estimates
.1 Contract
.1 Inputs
.2 Tools and Techniques
.3 Outputs
.1 Contract
.2 Work results
.3 Change requests
.4 Seller invoices
.1 Contract change controlsystem
.2 Performance reporting
.3 Payment system
.1 Correspondence
.2 Contract changes
.3 Payment requests
.1 Inputs
.2 Tools and Techniques
.3 Outputs
.1 Contract documentation
.1 Procurement audits
.1 Contract file
.2 Formal acceptance andclosure
Source Selection
Figu
re 1
2–1
|12
.1.1
.2
Authorized licensed use limited to: Old Dominion University. Downloaded on September 15,2010 at 18:15:01 UTC from IEEE Xplore. Restrictions apply.

Chapter 12—Project Procurement Management
A Guide to the Project Ma©2000 Project Managem
Authorized licensed u
This chapter assumes that the seller is external to the performing organization.Most of the discussion, however, is equally applicable to formal agreementsentered into with other units of the performing organization. When informalagreements are involved, the processes described in Project Human ResourceManagement, Chapter 9, and Project Communications Management, Chapter 10,are more likely to apply.
12.1 PROCUREMENT PLANNINGProcurement planning is the process of identifying which project needs can bebest met by procuring products or services outside the project organization andshould be accomplished during the scope definition effort. It involves consider-ation of whether to procure, how to procure, what to procure, how much to pro-cure, and when to procure.
When the project obtains products and services (project scope) from outsidethe performing organization, the processes from solicitation planning (Section12.2) through contract closeout (Section 12.6) would be performed once foreach product or service item. The project management team may want to seeksupport from specialists in the disciplines of contracting and procurement whenneeded, and involve them early in the process as a member of the project team.
When the project does not obtain products and services from outside the per-forming organization, the processes from solicitation planning (Section 12.2)through contract closeout (Section 12.6) would not be performed.
Procurement planning should also include consideration of potential sellers,particularly if the buyer wishes to exercise some degree of influence or controlover contracting decisions.
12.1.1 Inputs to Procurement Planning.1 Scope statement. The scope statement (see Section 5.2.3.1) describes the cur-
rent project boundaries. It provides important information about project needsand strategies that must be considered during procurement planning.
.2 Product description. The description of the product of the project (described inSection 5.1.1.1) provides important information about any technical issues orconcerns that would need to be considered during procurement planning.
.1
.2
.3
.4
.5
.6
.7
Scope statementProduct descriptionProcurement resourcesMarket conditionsOther planning outputsConstraintsAssumptions
.1
.2
.3
Make-or-buy analysisExpert judgmentContract type selection
.1
.2
Procurementmanagement planStatement(s) of work
Inputs Tools & Techniques Outputs
nagement Body of Knowledge (PMBOK® Guide) 2000 Editionent Institute, Four Campus Boulevard, Newtown Square, PA 19073-3299 USA 149
se limited to: Old Dominion University. Downloaded on September 15,2010 at 18:15:01 UTC from IEEE Xplore. Restrictions apply.

Chapter 12—Project Procurement Management
150
12.1
.1.3
|12
.1.3
.2
Authorized licensed u
The product description is generally broader than a statement of work. Aproduct description describes the ultimate end product of the project; a state-ment of work (discussed in Section 12.1.3.2) describes the portion of thatproduct to be provided by a seller to the project. However, if the performing orga-nization chooses to procure the entire product, then the distinction between thetwo terms disappears.
.3 Procurement resources. If the performing organization does not have a formalcontracting group, then the project team will have to supply both the resourcesand the expertise to support project procurement activities.
.4 Market conditions. The procurement planning process must consider what prod-ucts and services are available in the marketplace, from whom, and under whatterms and conditions.
.5 Other planning outputs. To the extent that other planning outputs are available,they must be considered during procurement planning. Other planning outputsthat must often be considered include preliminary cost and schedule estimates,quality management plans, cash-flow projections, the work breakdown structure,identified risks, and planned staffing.
.6 Constraints. Constraints are factors that limit the buyer’s options. One of themost common constraints for many projects is funds availability.
.7 Assumptions. Assumptions are factors that, for planning purposes, will be con-sidered to be true, real, or certain.
12.1.2 Tools and Techniques for Procurement Planning.1 Make-or-buy analysis. This is a general management technique and a part of the
initial scope definition process that can be used to determine whether a partic-ular product can be produced cost effectively by the performing organization.Analysis should include both indirect as well as direct costs. For example, the“buy” side of the analysis should include both the actual out-of-pocket cost topurchase the product as well as the indirect costs of managing the purchasingprocess.
A make-or-buy analysis must also reflect the perspective of the performingorganization, as well as the immediate needs of the project. For example, pur-chasing a capital item (anything from a construction crane to a personal com-puter) rather than renting or leasing it may or may not be cost effective.However, if the performing organization has an ongoing need for the item, theportion of the purchase cost allocated to the project may be less than the cost ofthe rental.
.2 Expert judgment. Expert technical judgment will often be required to assess theinputs to this process. Such expertise may be provided by any group or individualwith specialized knowledge or training and is available from many sources,including:■ Other units within the performing organization.■ Consultants.■ Professional and technical associations.■ Industry groups.
.3 Contract type selection. Different types of contracts are more or less appropriatefor different types of purchases. Contracts generally fall into one of three broadcategories:
A Guide to the Project Management Body of Knowledge (PMBOK® Guide) 2000 Edition©2000 Project Management Institute, Four Campus Boulevard, Newtown Square, PA 19073-3299 USA
se limited to: Old Dominion University. Downloaded on September 15,2010 at 18:15:01 UTC from IEEE Xplore. Restrictions apply.

Chapter 12—Project Procurement Management
A Guide to the Project Ma©2000 Project Managem
Authorized licensed u
■ Fixed-price or lump-sum contracts—this category of contract involves a fixedtotal price for a well-defined product. To the extent that the product is notwell defined, both the buyer and seller are at risk—the buyer may not receivethe desired product or the seller may need to incur additional costs to provideit. Fixed-price contracts may also include incentives for meeting or exceedingselected project objectives, such as schedule targets.
■ Cost-reimbursable contracts—this category of contract involves payment(reimbursement) to the seller for its actual costs, plus typically a fee repre-senting seller profit. Costs are usually classified as direct costs or indirect costs.Direct costs are costs incurred for the exclusive benefit of the project (e.g.,salaries of full-time project staff). Indirect costs, also called overhead costs, arecosts allocated to the project by the performing organization as a cost of doingbusiness (e.g., salaries of corporate executives). Indirect costs are usually cal-culated as a percentage of direct costs. Cost-reimbursable contracts ofteninclude incentives for meeting or exceeding selected project objectives, suchas schedule targets or total cost.
■ Time and Material (T&M) contracts—T&M contracts are a hybrid type of con-tractual arrangement that contains aspects of both cost-reimbursable andfixed-price-type arrangements. T&M contracts resemble cost-type arrange-ments in that they are open ended, because the full value of the arrangementis not defined at the time of the award. Thus, T&M contracts can grow in con-tract value as if they were cost-reimbursable-type arrangements. Conversely,T&M arrangements can also resemble fixed-unit arrangements when, forexample, the unit rates are preset by the buyer and seller, as when both par-ties agree on the rates for the category of “senior engineers.”
12.1.3 Outputs from Procurement Planning.1 Procurement management plan. The procurement management plan should
describe how the remaining procurement processes (from solicitation planningthrough contract closeout) will be managed. For example:■ What types of contracts will be used?■ If independent estimates will be needed as evaluation criteria, who will prepare
them and when?■ If the performing organization has a procurement department, what actions
can the project management team take on its own?■ If standardized procurement documents are needed, where can they be found?■ How will multiple providers be managed?■ How will procurement be coordinated with other project aspects, such as
scheduling and performance reporting?A procurement management plan may be formal or informal, highly detailed
or broadly framed, based on the needs of the project. It is a subsidiary elementof the project plan described in Section 4.1, Project Plan Development.
.2 Statement(s) of work. The statement of work (SOW) describes the procurementitem in sufficient detail to allow prospective sellers to determine if they arecapable of providing the item. “Sufficient detail” may vary, based on the natureof the item, the needs of the buyer, or the expected contract form.
nagement Body of Knowledge (PMBOK® Guide) 2000 Editionent Institute, Four Campus Boulevard, Newtown Square, PA 19073-3299 USA 151
se limited to: Old Dominion University. Downloaded on September 15,2010 at 18:15:01 UTC from IEEE Xplore. Restrictions apply.

Chapter 12—Project Procurement Management
152
12.2
|12
.3
Authorized licensed
Some application areas recognize different types of SOW. For example, insome government jurisdictions, the term SOW is reserved for a procurement itemthat is a clearly specified product or service, and the term Statement of Objectives(SOO) is used for a procurement item that is presented as a problem to be solved.
The statement of work may be revised and refined as it moves through the pro-curement process. For example, a prospective seller may suggest a more efficientapproach or a less costly product than that originally specified. Each individualprocurement item requires a separate statement of work. However, multiple prod-ucts or services may be grouped as one procurement item with a single SOW.
The statement of work should be as clear, as complete, and as concise as pos-sible. It should include a description of any collateral services required, such asperformance reporting or postproject operational support for the procured item.In some application areas, there are specific content and format requirements fora SOW.
12.2 SOLICITATION PLANNINGSolicitation planning involves preparing the documents needed to support solic-itation (the solicitation process is described in Section 12.3).
12.2.1 Inputs to Solicitation Planning.1 Procurement management plan. The procurement management plan is described
in Section 12.1.3.1..2 Statement(s) of work. The statement of work is described in Section 12.1.3.2..3 Other planning outputs. Other planning outputs (see Section 12.1.1.5), which
may have been modified from when they were considered as part of procurementplanning, should be reviewed again as part of solicitation. In particular, solicita-tion planning should be closely aligned with the project schedule.
12.2.2 Tools and Techniques for Solicitation Planning.1 Standard forms. Standard forms may include standard contracts, standard
descriptions of procurement items, or standardized versions of all or part of theneeded bid documents (see Section 12.2.3.1). Organizations that do substantialamounts of procurement should have many of these documents standardized.
.2 Expert judgment. Expert judgment is described in Section 12.1.2.2.
.1
.2
.3
Procurementmanagement planStatement(s) of workOther planning outputs
.12
Standard formsExpert judgment
.1
.2
.3
Procurement documentsEvaluation criteriaStatement of work updates
Inputs Tools & Techniques Outputs
A Guide to the Project Management Body of Knowledge (PMBOK® Guide) 2000 Edition©2000 Project Management Institute, Four Campus Boulevard, Newtown Square, PA 19073-3299 USA
use limited to: Old Dominion University. Downloaded on September 15,2010 at 18:15:01 UTC from IEEE Xplore. Restrictions apply.

Chapter 12—Project Procurement Management
A Guide to the Project M©2000 Project Manag
Authorized license
12.2.3 Outputs from Solicitation Planning.1 Procurement documents. Procurement documents are used to solicit proposals
from prospective sellers. The terms bid and quotation are generally used whenthe source selection decision will be based on price (as when buying commercialor standard items), while the term proposal is generally used when other con-siderations, such as technical skills or technical approach, are paramount. How-ever, the terms are often used interchangeably, and care should be taken not tomake unwarranted assumptions about the implications of the term used.Common names for different types of procurement documents include: Invitationfor Bid (IFB), Request for Proposal (RFP), Request for Quotation (RFQ), Invita-tion for Negotiation, and Contractor Initial Response.
Procurement documents should be structured to facilitate accurate and com-plete responses from prospective sellers. They should always include the relevantSOW, a description of the desired form of the response, and any required con-tractual provisions (e.g., a copy of a model contract, nondisclosure provisions).With government contracting, some or all of the content and structure of pro-curement documents may be defined by regulation.
Procurement documents should be rigorous enough to ensure consistent, com-parable responses, but flexible enough to allow consideration of seller sugges-tions for better ways to satisfy the requirements.
.2 Evaluation criteria. Evaluation criteria are used to rate or score proposals. Theymay be objective (e.g., “The proposed project manager must be a certified ProjectManagement Professional, PMP®.”) or subjective (e.g., “The proposed projectmanager must have documented, previous experience with similar projects.”).Evaluation criteria are often included as part of the procurement documents.
Evaluation criteria may be limited to purchase price if the procurement item isreadily available from a number of acceptable sources (purchase price in this con-text includes both the cost of the item and ancillary expenses such as delivery).When this is not the case, other selection criteria must be identified and docu-mented to support an assessment. For example:■ Understanding of need—as demonstrated by the seller’s proposal.■ Overall or life-cycle cost—will the selected seller produce the lowest total cost
(purchase cost plus operating cost)?■ Technical capability—does the seller have, or can the seller be reasonably
expected to acquire, the technical skills and knowledge needed?■ Management approach—does the seller have, or can the seller be reasonably
expected to develop, management processes and procedures to ensure a suc-cessful project?
■ Financial capacity—does the seller have, or can the seller reasonably be expectedto obtain, the necessary financial resources?
.3 Statement of work updates. The statement of work is described in Section 12.1.3.2.Modifications to one or more statements of work may be identified during solicita-tion planning.
12.3 SOLICITATIONSolicitation involves obtaining responses (bids and proposals) from prospectivesellers on how project needs can be met. Most of the actual effort in this processis expended by the prospective sellers, normally at no cost to the project.
anagement Body of Knowledge (PMBOK® Guide) 2000 Editionement Institute, Four Campus Boulevard, Newtown Square, PA 19073-3299 USA 153
d use limited to: Old Dominion University. Downloaded on September 15,2010 at 18:15:01 UTC from IEEE Xplore. Restrictions apply.

Chapter 12—Project Procurement Management
154
12.3
.1|
12.4
.2.1
Authorized licensed u
12.3.1 Inputs to Solicitation.1 Procurement documents. Procurement documents are described in Section 12.2.3.1..2 Qualified seller lists. Some organizations maintain lists or files with information
on prospective sellers. These lists will generally have information on relevant pastexperience and other characteristics of the prospective sellers.
If such lists are not readily available, then the project team will have todevelop its own sources. General information is widely available through theInternet, library directories, relevant local associations, trade catalogs, and sim-ilar sources. Detailed information on specific sources may require more extensiveeffort, such as site visits or contact with previous customers.
Procurement documents may be sent to some or all of the prospective sellers.
12.3.2 Tools and Techniques for Solicitation.1 Bidder conferences. Bidder conferences (also called contractor conferences, vendor
conferences, and pre-bid conferences) are meetings with prospective sellers prior topreparation of a proposal. They are used to ensure that all prospective sellers havea clear, common understanding of the procurement (technical requirements, con-tract requirements, etc.). Responses to questions may be incorporated into theprocurement documents as amendments. All potential sellers must remain onequal standing during this process.
.2 Advertising. Existing lists of potential sellers can often be expanded by placingadvertisements in general circulation publications such as newspapers or in spe-cialty publications such as professional journals. Some government jurisdictionsrequire public advertising of certain types of procurement items; most govern-ment jurisdictions require public advertising of subcontracts on a governmentcontract.
12.3.3 Outputs from Solicitation.1 Proposals. Proposals (see also discussion of bids, quotations, and proposals in
Section 12.2.3.1) are seller-prepared documents that describe the seller’s abilityand willingness to provide the requested product. They are prepared in accor-dance with the requirements of the relevant procurement documents. Proposalsmay be supplemented with an oral presentation.
.1
.2Procurement documentsQualified seller lists
.1
.2Bidder conferencesAdvertising
.1 Proposals
Inputs Tools & Techniques Outputs
A Guide to the Project Management Body of Knowledge (PMBOK® Guide) 2000 Edition©2000 Project Management Institute, Four Campus Boulevard, Newtown Square, PA 19073-3299 USA
se limited to: Old Dominion University. Downloaded on September 15,2010 at 18:15:01 UTC from IEEE Xplore. Restrictions apply.

Chapter 12—Project Procurement Management
A Guide to the Project M©2000 Project Manag
Authorized license
12.4 SOURCE SELECTIONSource selection involves the receipt of bids or proposals and the application ofthe evaluation criteria to select a provider. Many factors aside from cost or pricemay need to be evaluated in the source selection decision process.■ Price may be the primary determinant for an off-the-shelf item, but the lowest
proposed price may not be the lowest cost if the seller proves unable to deliverthe product in a timely manner.
■ Proposals are often separated into technical (approach) and commercial(price) sections with each evaluated separately.
■ Multiple sources may be required for critical products.The tools and techniques described here may be used singly or in combina-
tion. For example, a weighting system may be used to:■ Select a single source who will be asked to sign a standard contract.■ Rank order all proposals to establish a negotiating sequence.
On major procurement items, this process may be repeated. A short list ofqualified sellers may be selected based on a preliminary proposal, and then amore detailed evaluation will be conducted based on a more detailed and com-prehensive proposal.
12.4.1 Inputs to Source Selection.1 Proposals. Proposals are described in Section 12.3.3.1..2 Evaluation criteria. Evaluation criteria may include samples of the suppliers pre-
viously produced products/services for the purpose of providing a way to eval-uate their capabilities and quality of products. They also may include a review ofthe supplier’s history with the contracting organization. Evaluation criteria aredescribed in Section 12.2.3.2.
.3 Organizational policies. Organizations involved in project procurement typicallyhave formal policies that affect the evaluation of proposals.
12.4.2 Tools and Techniques for Source Selection.1 Contract negotiation. Contract negotiation involves clarification and mutual agree-
ment on the structure and requirements of the contract prior to the signing ofthe contract. To the extent possible, final contract language should reflect allagreements reached. Subjects covered generally include, but are not limited to,responsibilities and authorities, applicable terms and law, technical and businessmanagement approaches, contract financing, and price.
.1
.2
.3
ProposalsEvaluation criteriaOrganizational policies
.1
.2
.3
.4
Contract negotiationWeighting systemScreening systemIndependent estimates
.1 Contract
Inputs Tools & Techniques Outputs
anagement Body of Knowledge (PMBOK® Guide) 2000 Editionement Institute, Four Campus Boulevard, Newtown Square, PA 19073-3299 USA 155
d use limited to: Old Dominion University. Downloaded on September 15,2010 at 18:15:01 UTC from IEEE Xplore. Restrictions apply.

Chapter 12—Project Procurement Management
156
12.4
.2.2
|12
.5.1
.4
Authorized licensed u
For complex procurement items, contract negotiation may be an independentprocess with inputs (e.g., an issues or open items list) and outputs (e.g., memo-randum of understanding) of its own.
.2 Weighting system. A weighting system is a method for quantifying qualitativedata to minimize the effect of personal prejudice on source selection. Most suchsystems involve 1) assigning a numerical weight to each of the evaluation cri-teria, 2) rating the prospective sellers on each criterion, 3) multiplying the weightby the rating, and 4) totaling the resultant products to compute an overall score.
.3 Screening system. A screening system involves establishing minimum require-ments of performance for one or more of the evaluation criteria. For example, aprospective seller might be required to propose a project manager who has specificqualifications—for example, a PMP®—before the remainder of the proposal wouldbe considered.
.4 Independent estimates. For many procurement items, the procuring organizationmay prepare its own independent estimates as a check on proposed pricing. Sig-nificant differences from these estimates may be an indication that the SOW wasnot adequate, or that the prospective seller either misunderstood or failed torespond fully to the SOW. Independent estimates are often referred to as shouldcost estimates.
12.4.3 Outputs from Source Selection.1 Contract. A contract is a mutually binding agreement that obligates the seller to
provide the specified product and obligates the buyer to pay for it. A contract is alegal relationship subject to remedy in the courts. The agreement may be simple orcomplex, usually (but not always) reflecting the simplicity or complexity of theproduct. Contracts may be called, among other names, a contract, an agreement,a subcontract, a purchase order, or a memorandum of understanding. Most orga-nizations have documented policies and procedures specifically defining who cansign such agreements on behalf of the organization, typically called a delegationof procurement authority.
Although all project documents are subject to some form of review andapproval, the legally binding nature of a contract usually means that it will besubjected to a more extensive approval process. In all cases, a primary focus ofthe review and approval process should be to ensure that the contract languagedescribes a product or service that will satisfy the identified need. In the case ofmajor projects undertaken by public agencies, the review process may eveninclude public review of the agreement.
12.5 CONTRACT ADMINISTRATIONContract administration is the process of ensuring that the seller’s performancemeets contractual requirements. On larger projects with multiple product andservice providers, a key aspect of contract administration is managing the inter-faces among the various providers. The legal nature of the contractual relationshipmakes it imperative that the project team be acutely aware of the legal implicationsof actions taken when administering the contract.
A Guide to the Project Management Body of Knowledge (PMBOK® Guide) 2000 Edition©2000 Project Management Institute, Four Campus Boulevard, Newtown Square, PA 19073-3299 USA
se limited to: Old Dominion University. Downloaded on September 15,2010 at 18:15:01 UTC from IEEE Xplore. Restrictions apply.

Chapter 12—Project Procurement Management
A Guide to the Project M©2000 Project Manage
Authorized licensed
Contract administration includes application of the appropriate project man-agement processes to the contractual relationship(s) and integration of the out-puts from these processes into the overall management of the project. Thisintegration and coordination will often occur at multiple levels when there aremultiple sellers and multiple products involved. The project managementprocesses that must be applied include:■ Project plan execution, described in Section 4.2, to authorize the contractor’s
work at the appropriate time.■ Performance reporting, described in Section 10.3, to monitor contractor cost,
schedule, and technical performance.■ Quality control, described in Section 8.3, to inspect and verify the adequacy
of the contractor’s product.■ Change control, described in Section 4.3, to ensure that changes are properly
approved and that all those with a need to know are aware of such changes.Contract administration also has a financial management component. Pay-
ment terms should be defined within the contract and must involve a specificlinkage between seller progress made and seller compensation paid.
12.5.1 Inputs to Contract Administration.1 Contract. Contracts are described in Section 12.4.3.1..2 Work results. The seller’s work results—which deliverables have been completed
and which have not, to what extent are quality standards being met, what costshave been incurred or committed, etc.—are collected as part of project plan exe-cution. (Section 4.2 provides more detail on project plan execution.)
.3 Change requests. Change requests may include modifications to the terms of thecontract or to the description of the product or service to be provided. If theseller’s work is unsatisfactory, then a decision to terminate the contract wouldalso be handled as a change request. Contested changes, those where the sellerand the project management team cannot agree on compensation for the change,are variously called claims, disputes, or appeals.
.4 Seller invoices. The seller must submit invoices from time to time to request pay-ment for work performed. Invoicing requirements, including necessary sup-porting documentation, are defined within the contract.
.1
.2
.3
.4
ContractWork resultsChange requestsSeller invoices
.1
.2
.3
Contract change controlsystemPerformance reportingPayment system
.1
.2
.3
CorrespondenceContract changesPayment requests
Inputs Tools & Techniques Outputs
anagement Body of Knowledge (PMBOK® Guide) 2000 Editionment Institute, Four Campus Boulevard, Newtown Square, PA 19073-3299 USA 157
use limited to: Old Dominion University. Downloaded on September 15,2010 at 18:15:01 UTC from IEEE Xplore. Restrictions apply.

Chapter 12—Project Procurement Management
158
12.5
.2|
12.6
.3.2
Authorized licensed
12.5.2 Tools and Techniques for Contract Administration.1 Contract change control system. A contract change control system defines the
process by which the contract may be modified. It includes the paperwork,tracking systems, dispute resolution procedures, and approval levels necessaryfor authorizing changes. The contract change control system should be integratedwith the integrated change control system. (Section 4.3 describes the integratedchange control system.)
.2 Performance reporting. Performance reporting provides management with infor-mation about how effectively the seller is achieving the contractual objectives.Contract performance reporting should be integrated with the integrated projectperformance reporting, described in Section 10.3.
.3 Payment system. Payments to the seller are usually handled by the accountspayable system of the performing organization. On larger projects with many orcomplex procurement requirements, the project may develop its own system. Ineither case, the payment system must include appropriate reviews and approvalsby the project management team.
12.5.3 Outputs from Contract Administration.1 Correspondence. Contract terms and conditions often require written documen-
tation of certain aspects of buyer/seller communications, such as warnings ofunsatisfactory performance and contract changes or clarifications.
.2 Contract changes. Changes (approved and unapproved) are fed back through theappropriate project planning and project procurement processes, and the projectplan or other relevant documentation is updated as appropriate.
.3 Payment requests. This assumes that the project is using an external paymentsystem. If the project has its own internal system, the output here would simplybe “payments.”
12.6 CONTRACT CLOSEOUTContract closeout is similar to administrative closure (described in Section 10.4)in that it involves both product verification (Was all work completed correctlyand satisfactorily?) and administrative closeout (updating of records to reflectfinal results and archiving of such information for future use). The contract termsand conditions may prescribe specific procedures for contract closeout. Early ter-mination of a contract is a special case of contract closeout.
.1 Contract documentation .1 Procurement audits .1.2
Contract fileFormal acceptance andclosure
Inputs Tools & Techniques Outputs
A Guide to the Project Management Body of Knowledge (PMBOK® Guide) 2000 Edition©2000 Project Management Institute, Four Campus Boulevard, Newtown Square, PA 19073-3299 USA
use limited to: Old Dominion University. Downloaded on September 15,2010 at 18:15:01 UTC from IEEE Xplore. Restrictions apply.

Chapter 12—Project Procurement Management
A Guide to the Project M©2000 Project Manage
Authorized licensed
12.6.1 Inputs to Contract Closeout.1 Contract documentation. Contract documentation includes, but is not limited to,
the contract itself along with all supporting schedules, requested and approvedcontract changes, any seller-developed technical documentation, seller perfor-mance reports, financial documents such as invoices and payment records, andthe results of any contract-related inspections.
12.6.2 Tools and Techniques for Contract Closeout.1 Procurement audits. A procurement audit is a structured review of the procure-
ment process from procurement planning through contract administration. Theobjective of a procurement audit is to identify successes and failures that warranttransfer to other procurement items on this project or to other projects within theperforming organization.
12.6.3 Outputs from Contract Closeout.1 Contract file. A complete set of indexed records should be prepared for inclusion
with the final project records (see Section 10.4 for a more detailed discussion ofadministrative closure and project archives).
.2 Formal acceptance and closure. The person or organization responsible for con-tract administration should provide the seller with formal written notice that thecontract has been completed. Requirements for formal acceptance and closureare usually defined in the contract.
anagement Body of Knowledge (PMBOK® Guide) 2000 Editionment Institute, Four Campus Boulevard, Newtown Square, PA 19073-3299 USA 159
use limited to: Old Dominion University. Downloaded on September 15,2010 at 18:15:01 UTC from IEEE Xplore. Restrictions apply.

SECTION III
APPENDICES
A. The Project Management Institute Standards-Setting Process
B. Evolution of PMI’s A Guide to the Project Management Body of Knowledge
C. Contributors and Reviewers of PMBOK® Guide 2000 Edition
D. Notes
E. Application Area Extensions
F. Additional Sources of Information on Project Management
G. Summary of Project Management Knowledge Areas
Authorized licensed use limited to: Old Dominion University. Downloaded on September 15,2010 at 18:15:01 UTC from IEEE Xplore. Restrictions apply.

Appendix A
The Project Management InstituteStandards-Setting Process
A Guide to the Project Man©2000 Project Manageme
Authorized licensed u
The Project Management Institute (PMI) Standards-Setting Process was estab-lished initially as Institute policy by a vote of the PMI Board of Directors at itsOctober 1993 meeting. In March 1998, the PMI Board of Directors approvedmodifications to the process. Then in March 1999, it was modified again to makeit consistent with the concurrent change in PMI governance procedures.
A.1 PMI STANDARDS DOCUMENTSPMI Standards Documents are those developed or published by PMI that describegenerally accepted practices of project management, specifically:■ A Guide to the Project Management Body of Knowledge (PMBOK® Guide).■ Project Management Body of Knowledge Handbooks.
Additional documents may be added to this list by the PMI Standards Man-ager, subject to the advice and consent of the PMI Project Management StandardsProgram Member Advisory Group and the PMI Executive Director. StandardsDocuments may be original works published by PMI, or they may be publicationsby other organizations or individuals.
Standards Documents will be developed in accordance with the Code of GoodPractice for Standardization developed by the International Organization forStandardization (ISO) and the standards development guidelines established bythe American National Standards Institute (ANSI).
A.2 DEVELOPMENT OF ORIGINAL WORKSStandards Documents that are original works developed by PMI, or revisions ofsuch documents, will be handled as follows:■ Prospective developer(s) will submit a proposal to the PMI Standards Man-
ager. The Manager may also request such proposals. The Manager will submitall received proposals to the PMI Standards Program Member Advisory Groupwho, with the Manager, will decide whether to accept or reject each proposal.
agement Body of Knowledge (PMBOK® Guide) 2000 Editionnt Institute, Four Campus Boulevard, Newtown Square, PA 19073-3299 USA 163
se limited to: Old Dominion University. Downloaded on September 15,2010 at 18:15:01 UTC from IEEE Xplore. Restrictions apply.

Appendix A—The Project Management Institute Standards-Setting Process
164
Appe
ndix
A
Authorized licensed use limited
■ The Manager will inform the prospective developer(s) as to the decision andthe rationale for the decision. If an approved proposal requires funding inexcess of that budgeted for standards development, the Manager will submitthe proposal to the PMI Executive Director for funding.
■ For all approved and funded proposals, the Manager will support the devel-oper’s efforts so as to maximize the probability that the end product will beaccepted. Developer(s) will be required to sign the PMI Volunteer Assignmentof Copyright.
■ When the proposed material has been completed to the satisfaction of thedeveloper(s), the developer(s) will submit the material to the PMI StandardsManager. The PMI Standards Program Member Advisory Group, with theManager, will review the proposed material and decide whether to initiate fur-ther review by knowledgeable individuals or request additional work by thedeveloper(s).
■ The Manager will appoint, subject to review and approval by the PMI Stan-dards Program Member Advisory Group, at least three knowledgeable indi-viduals to review and comment on the material. Based on comments received,the Member Advisory Group will decide whether to accept the material as anExposure Draft.
■ The PMI Standards Manager will develop a plan for obtaining appropriatepublic review for each Exposure Draft. The plan will include a) a review periodof not less than one month and not more than six months, b) announcement ofthe availability of the Exposure Draft for review in PM Network® (and/or anyother similarly appropriate publication media), and c) cost of review copies.The PMI Standards Program Member Advisory Group must approve the Man-ager’s plan for public review. Each Exposure Draft will include a notice askingfor comments to be sent to the PMI Standards Manager at the PMI Headquar-ters and noting the length of and expiration date for the review period.
■ Exposure Drafts will be published under the aegis of the PMI Publishing Divisionand must meet the standards of that group regarding typography and style.
■ During the review period, the Manager will solicit the formal input of theManagers of other PMI Programs (e.g., Certification, Education, Components,and Publishing) that may be affected by the future publication of the materialas a PMI Standard.
■ At the conclusion of the review period, the PMI Standards Manager will reviewcomments received with the PMI Standards Program Member Advisory Groupand will work with the developer(s) and others as needed to incorporateappropriate comments. If the comments are major, the PMI Standards ProgramMember Advisory Group may elect to repeat the Exposure Draft review process.
■ When the PMI Standards Manager and the PMI Standards Program MemberAdvisory Group have approved a proposed PMI Standards Document, theManager will promptly submit the document to the PMI Executive Director forfinal review and approval. The PMI Executive Director will verify compliancewith procedures and ensure that member input was sufficient. PMI ExecutiveDirector will a) approve the document as submitted; b) reject the document;or c) request additional review, and will provide explanatory comments insupport of the chosen option.
A Guide to the Project Management Body of Knowledge (PMBOK® Guide) 2000 Edition©2000 Project Management Institute, Four Campus Boulevard, Newtown Square, PA 19073-3299 USA
to: Old Dominion University. Downloaded on September 15,2010 at 18:15:01 UTC from IEEE Xplore. Restrictions apply.

Appendix A—The Project Management Institute Standards-Setting Process
A Guide to the Project Ma©2000 Project Managem
Authorized licensed u
A.3 ADOPTION OF NONORIGINAL WORKS AS STANDARDSStandards Documents that are the work of other organizations or individuals willbe handled as follows:■ Any person or organization may submit a request to the PMI Standards Man-
ager to consider a non-PMI publication as a PMI Standard. The Manager willsubmit all proposals received to the PMI Standards Program Member AdvisoryGroup who, with the Manager, will decide whether to accept or reject each pro-posal. If accepted, the Manager will appoint, subject to review and approval bythe PMI Standards Program Member Advisory Group, at least three knowl-edgeable individuals to review and comment on the material.
■ During the review period, the Manager will solicit the formal input of theManagers of other PMI Programs (e.g., Certification, Education, Components,and Publishing) that may be affected by the future publication of the materialas a PMI Standard.
■ Based on comments received, the Member Advisory Group, with the Manager,will decide whether to a) accept the proposal as written as a PMI Standard, b)accept the proposal with modifications and/or an addendum as a PMI Stan-dard, c) seek further review and comment on the proposal (that is, additionalreviewers and/or issuance as an Exposure Draft), or d) reject the proposal. TheManager will inform the submitter as to the decision and the rationale for thedecision.
■ When the PMI Standards Manager and the PMI Standards Program MemberAdvisory Group have approved a proposed PMI Standards Document, theManager will promptly submit the document to the PMI Executive Director forfinal review and approval. The Manager will prepare a proposal for the PMIExecutive Director for consideration of a prospective relationship with theowner(s) of the material.
■ The PMI Executive Director will verify compliance with procedures and willensure that member input was sufficient. The PMI Executive Director will a)approve the document as submitted; b) reject the document; or c) requestadditional review, and will provide explanatory comments in support of thechosen option.
nagement Body of Knowledge (PMBOK® Guide) 2000 Editionent Institute, Four Campus Boulevard, Newtown Square, PA 19073-3299 USA 165
se limited to: Old Dominion University. Downloaded on September 15,2010 at 18:15:01 UTC from IEEE Xplore. Restrictions apply.

Appendix B
Evolution of PMI’s A Guide to theProject Management Body ofKnowledge
A Guide to the Project Mana©2000 Project Manageme
Authorized licensed us
B.1 INITIAL DEVELOPMENTThe Project Management Institute (PMI) was founded in 1969 on the premisethat there were many management practices that were common to projects inapplication areas as diverse as construction and pharmaceuticals. By the time ofthe PMI Montreal Seminars/Symposium in 1976, the idea that such commonpractices might be documented as standards began to be widely discussed. Thisled in turn to consideration of project management as a distinct profession.
It was not until 1981, however, that the PMI Board of Directors approved aproject to develop the procedures and concepts necessary to support the profes-sion of project management. The project proposal suggested three areas of focus:■ The distinguishing characteristics of a practicing professional (ethics).■ The content and structure of the profession’s body of knowledge (standards).■ Recognition of professional attainment (accreditation).
The project team thus came to be known as the Ethics, Standards, and Accred-itation (ESA) Management Group. The ESA Management Group consisted of thefollowing individuals:Matthew H. Parry, Chair David C. AirdFrederick R. Fisher David HaeneyHarvey Kolodney Charles E. OliverWilliam H. Robinson Douglas J. RonsonPaul Sims Eric W. Smythe
More than twenty-five volunteers in several local chapters assisted this group.The Ethics statement was developed and submitted by a committee in Wash-ington, D.C., chaired by Lew Ireland. The Time Management statement wasdeveloped through extensive meetings of a group in Southern Ontario, including
gement Body of Knowledge (PMBOK® Guide) 2000 Editionnt Institute, Four Campus Boulevard, Newtown Square, PA 19073-3299 USA 167
e limited to: Old Dominion University. Downloaded on September 15,2010 at 18:15:01 UTC from IEEE Xplore. Restrictions apply.

Appendix B—Evolution of PMI’s A Guide to the Project Management Body of Knowledge
168
Appe
ndix
B
Authorized licensed u
Dave MacDonald, Dave Norman, Bob Spence, Bob Hall, and Matt Parry. The CostManagement statement was developed through extensive meetings within thecost department of Stelco under the direction of Dave Haeney and Larry Har-rison. Other statements were developed by the ESA Management Group. Accred-itation was taken up by John Adams and his group at Western CarolinaUniversity, which resulted in the development of accreditation guidelines and aprogram for the certification of Project Management Professionals (PMPs) underthe guidance of Dean Martin.
The results of the ESA Project were published in a Special Report in the ProjectManagement Journal in August 1983. The report included:■ A Code of Ethics, plus a procedure for code enforcement.■ A standards baseline consisting of six major knowledge areas: Scope Manage-
ment, Cost Management, Time Management, Quality Management, HumanResources Management, and Communications Management.
■ Guidelines for both accreditation (recognition of the quality of programs pro-vided by educational institutions) and certification (recognition of the profes-sional qualifications of individuals).This report subsequently served as the basis for PMI’s initial Accreditation and
Certification programs. Western Carolina University’s Master’s Degree in ProjectManagement was accredited in 1983, and the first PMPs were certified in 1984.
B.2 1986–87 UPDATEPublication of the ESA Baseline Report gave rise to much discussion within PMIabout the adequacy of the standards. In 1984, the PMI Board of Directorsapproved a second standards-related project “to capture the knowledge applied toproject management … within the existing ESA framework.” Six committees werethen recruited to address each of the six identified knowledge areas. In addition,a workshop was scheduled as part of the PMI 1985 Annual Seminars/Symposium.
As a result of these efforts, a revised document was approved in principle bythe PMI Board of Directors and published for comment in the Project ManagementJournal in August 1986. The primary contributors to this version of the documentwere:R. Max Wideman, Chair John R. Adams, Chair
(during development) (when issued)Joseph R. Beck Peter BibbesJim Blethen Richard CockfieldPeggy Day William DixonPeter C. Georgas Shirl HolingsworthWilliam Kane Colin MorrisJoe Muhlberger Philip NunnPat Patrick David PymLinn C. Stuckenbruck George VallanceLarry C. Woolslager Shakir Zuberi
In addition to expanding and restructuring the original material, the reviseddocument included three new sections:■ Project Management Framework was added to cover the relationships
between the project and its external environment, and between project man-agement and general management.
A Guide to the Project Management Body of Knowledge (PMBOK® Guide) 2000 Edition©2000 Project Management Institute, Four Campus Boulevard, Newtown Square, PA 19073-3299 USA
se limited to: Old Dominion University. Downloaded on September 15,2010 at 18:15:01 UTC from IEEE Xplore. Restrictions apply.

Appendix B—Evolution of PMI’s A Guide to the Project Management Body of Knowledge
A Guide to the Project Man©2000 Project Manageme
Authorized licensed us
■ Risk Management was added as a separate knowledge area in order to providebetter coverage of this subject.
■ Contract/Procurement Management was added as a separate knowledge areain order to provide better coverage of this subject.Subsequently, a variety of editorial changes and corrections were incorporated
into the material, and the PMI Board of Directors approved it in March 1987. Thefinal manuscript was published in August 1987 as a stand-alone document titled,The Project Management Body of Knowledge.
B.3 1996 UPDATEDiscussion about the proper form, content, and structure of PMI’s key standardsdocument continued after publication of the 1987 version. In August 1991, PMI’sDirector of Standards Alan Stretton initiated a project to update the documentbased on comments received from the membership. The revised document wasdeveloped over several years through a series of widely circulated working draftsand through workshops at the PMI Seminars/Symposia in Dallas, Pittsburgh, andSan Diego.
In August 1994, the PMI Standards Committee issued an Exposure Draft of thedocument that was distributed for comment to all 10,000 PMI members and tomore than twenty other professional and technical associations.
The publication of A Guide to the Project Management Body of Knowledge(PMBOK® Guide) in 1996 represented the completion of the project initiated in1991. Contributors and reviewers are listed later in this section. A summary ofthe differences between the 1987 document and the 1996 document, which wasincluded in the Preface of the 1996 edition, also is listed later in this section.
The document superseded PMI’s Project Management Body of Knowledge(PMBOK®) document that was published in 1987. To assist users of the 1996 doc-ument, who may have been familiar with its predecessor, we have summarizedthe major differences here.
1. We changed the title to emphasize that this document is not the project man-agement body of knowledge. The 1987 document defined the project managementbody of knowledge as “all those topics, subject areas and intellectual processeswhich are involved in the application of sound management principles to … proj-ects.” Clearly, one document will never contain the entire project managementbody of knowledge.
2. We completely rewrote the Framework section. The new section consists ofthree chapters:■ Introduction, which sets out the purpose of the document and defines at
length the terms project and project management.■ The Project Management Context, which covers the context in which projects
operate—the project life cycle, stakeholder perspectives, external influences,and key general management skills.
■ Project Management Processes, which describes how the various elements ofproject management interrelate.
agement Body of Knowledge (PMBOK® Guide) 2000 Editionnt Institute, Four Campus Boulevard, Newtown Square, PA 19073-3299 USA 169
e limited to: Old Dominion University. Downloaded on September 15,2010 at 18:15:01 UTC from IEEE Xplore. Restrictions apply.

Appendix B—Evolution of PMI’s A Guide to the Project Management Body of Knowledge
170
Appe
ndix
B
Authorized licensed use limited t
3. We developed a revised definition of project. We wanted a definition that wasboth inclusive (It should not be possible to identify any undertaking generallythought of as a project that does not fit the definition.) and exclusive (It shouldnot be possible to describe any undertaking that satisfies the definition and is notgenerally thought of as a project.). We reviewed many of the definitions ofproject in the existing literature and found all of them unsatisfactory in someway. The new definition is driven by the unique characteristics of a project: aproject is a temporary endeavor undertaken to create a unique product or service.
4. We developed a revised view of the project life cycle. The 1987 documentdefined project phases as subdivisions of the project life cycle. We have reorderedthis relationship and defined project life cycle as a collection of phases whosenumber and names are determined by the control needs of the performing orga-nization.
5. We changed the name of the major sections from function to knowledge area.The term function had been frequently misunderstood to mean an element of afunctional organization. The name change should eliminate this misunder-standing.
6. We formally recognized the existence of a ninth knowledge area. There hasbeen widespread consensus for some time that project management is an inte-grative process. Chapter 4, Project Integration Management, recognizes theimportance of this subject.
7. We added the word project to the title of each knowledge area. Although thismay seem redundant, it helps to clarify the scope of the document. For example,Project Human Resource Management covers only those aspects of managinghuman resources that are unique or nearly unique to the project context.
8. We chose to describe the knowledge areas in terms of their componentprocesses. The search for a consistent method of presentation led us to completelyrestructure the 1987 document into thirty-seven project management processes.Each process is described in terms of its inputs, outputs, and tools and tech-niques. Inputs and outputs are documents (e.g., a scope statement) or docu-mentable items (e.g., activity dependencies). Tools and techniques are themechanisms applied to the inputs to create the outputs. In addition to its funda-mental simplicity, this approach offers several other benefits:■ It emphasizes the interactions among the knowledge areas. Outputs from one
process become inputs to another.■ The structure is flexible and robust. Changes in knowledge and practice can
be accommodated by adding a new process, by resequencing processes, bysubdividing processes, or by adding descriptive material within a process.
■ Processes are at the core of other standards. For example, the InternationalOrganization for Standardization’s quality standards (the ISO 9000 series) arebased on identification of business processes.9. We added some illustrations. When it comes to work breakdown structures,
network diagrams, and S-curves, a picture is worth a thousand words.10. We significantly reorganized the document. The following table provides a
comparison of the major headings of the 1987 document and the 1996 one:
A Guide to the Project Management Body of Knowledge (PMBOK® Guide) 2000 Edition©2000 Project Management Institute, Four Campus Boulevard, Newtown Square, PA 19073-3299 USA
o: Old Dominion University. Downloaded on September 15,2010 at 18:15:01 UTC from IEEE Xplore. Restrictions apply.

Appendix B—Evolution of PMI’s A Guide to the Project Management Body of Knowledge
A Guide to the Project Management ©2000 Project Management Institut
Authorized licensed use limited
1987 Number and Name 1996 Number and Name0. PMBOK® Standards B. Evolution of PMI’s A Guide to the
Project Management Body of Knowledge1. Framework: The Rationale 1. Introduction (basic definitions)
2. The Project Context (life cycles)2. Framework: An Overview 1. Various portions
2. Various portions3. Various portions
3. Framework: An Integrative Model 3. Project Management Processes4. Project Integration Management
4. Glossary of General Terms IV. GlossaryA. Scope Management 5. Project Scope ManagementB. Quality Management 8. Project Quality ManagementC. Time Management 6. Project Time ManagementD. Cost Management 7. Project Cost ManagementE. Risk Management 11. Project Risk ManagementF. Human Resource Management 9. Project Human Resource ManagementG. Contract/Procurement Management 12. Project Procurement ManagementH. Communications Management 10. Project Communications Management
11. We removed “to classify” from the list of purposes. Both the 1996 documentand the 1987 version provide a structure for organizing project managementknowledge, but neither is particularly effective as a classification tool. First, thetopics included are not comprehensive—they do not include innovative orunusual practices. Second, many elements have relevance in more than oneknowledge area or process, such that the categories are not unique.
The following individuals, as listed in Appendix C of the 1996 document, con-tributed in many different ways to various drafts of the 1996 document. PMI isindebted to them for their support.
Standards CommitteeThe following individuals served as members of the PMI Standards Committeeduring development of the 1996 update of the PMBOK® document:■ William R. Duncan, Duncan•Nevison, PMI Director of Standards■ Frederick Ayer, Defense Systems Management College■ Cynthia Berg, Medtronic Micro-Rel■ Mark Burgess, KnowledgeWorks■ Helen Cooke, Cooke & Cooke■ Judy Doll, Searle■ Drew Fetters, PECO Energy Company■ Brian Fletcher, ABRINN Project Management Services■ Earl Glenwright, A.S.S.I.S.T.■ Eric Jenett, Consultant■ Deborah O’Bray, Manitoba Telephone System■ Diane Quinn, Eastman Kodak Co.■ Anthony Rizzotto, Miles Diagnostics■ Alan Stretton, University of Technology, Sydney■ Douglas E. Tryloff, TASC
Body of Knowledge (PMBOK® Guide) 2000 Editione, Four Campus Boulevard, Newtown Square, PA 19073-3299 USA 171
to: Old Dominion University. Downloaded on September 15,2010 at 18:15:01 UTC from IEEE Xplore. Restrictions apply.

Appendix B—Evolution of PMI’s A Guide to the Project Management Body of Knowledge
172
Appe
ndix
B
Authorized licensed use limited
ContributorsIn addition to the members of the Standards Committee, the following individ-uals provided original text or key concepts for one or more sections in the chap-ters indicated:■ John Adams, Western Carolina University (Chapter 3, Project Management
Processes)■ Keely Brunner, Ball Aerospace (Chapter 7, Project Cost Management)■ Louis J. Cabano, Pathfinder, Inc. (Chapter 5, Project Scope Management)■ David Curling, Loday Systems (Chapter 12, Project Procurement
Management)■ Douglas Gordon, Special Projects Coordinations (Chapter 7, Project Cost
Management)■ David T. Hulett, D. T. Hulett & Associates (Chapter 11, Project Risk Management)■ Edward Ionata, Bechtel/Parsons Brinckerhoff (Chapter 10, Project
Communications Management)■ John M. Nevison, Duncan•Nevison (Chapter 9, Project Human Resource
Management)■ Hadley Reynolds, Reynolds Associates (Chapter 2, The Project Management
Context)■ Agnes Salvo, CUNA Mutual Insurance (Chapter 11, Project Risk Management)■ W. Stephen Sawle, Consultants to Management, Inc. (Chapter 5, Project
Scope Management)■ Leonard Stolba, Parsons, Brinckerhoff, Douglas & Quade (Chapter 8, Project
Quality Management)■ Ahmet Taspinar, MBP Network (Chapter 6, Project Time Management)■ Francis M. Webster Jr. (Chapter 1, definition of project)
ReviewersIn addition to the Standards Committee and the contributors, the following indi-viduals provided comments on various drafts of the 1996 document:■ Edward L. Averill, Edward Averill & Associates■ A. C. “Fred” Baker, Baker, Barnes Associates, Inc.■ F. J. “Bud” Baker, Wright State University■ Tom Belanger, The Sterling Planning Group■ John A. Bing, Coastline Community College■ Brian Bock, Ziff Desktop Information■ Paul Bosakowski, Fluor Daniel■ Dorothy J. Burton, Management Systems Associates, Ltd.■ Cohort ’93, University of Technology, Sydney■ Cohort ’94, University of Technology, Sydney■ Kim Colenso, Applied Business Technologies■ Samuel K. Collier, Mead Corporation■ Karen Condos-Alfonsi, PMI Executive Office■ E. J. Coyle, VDO Yazaki■ Darlene Crane, Crane Consulting■ Russ Darnall, Fluor Daniel■ Maureen Dougherty, GPS Technologies■ John J. Downing, Digital Equipment Corporation■ Daniel D. Dudek, Optimum Technologies, Inc.■ Lawrence East, Westinghouse
A Guide to the Project Management Body of Knowledge (PMBOK® Guide) 2000 Edition©2000 Project Management Institute, Four Campus Boulevard, Newtown Square, PA 19073-3299 USA
to: Old Dominion University. Downloaded on September 15,2010 at 18:15:01 UTC from IEEE Xplore. Restrictions apply.

Appendix B—Evolution of PMI’s A Guide to the Project Management Body of Knowledge
A Guide to the Project Managemen©2000 Project Management Instit
Authorized licensed use limite
■ Quentin W. Fleming, Primavera Systems, Inc.■ Rick Fletcher, Acres■ Greg Githens, Maxicomm Project Services, Inc.■ Leo Giulianeti, Keane Inc.■ Martha D. Hammonds, AMEX TSG Systems■ Abdulrazak Hajibrahim, Bombardier■ G. Alan Hellawell, Eastman Kodak■ Paul Hinkley, Meta Consultants■ Wayne L. Hinthorn, PMI Orange Co.■ Mark E. Hodson, Eli Lilly & Company■ Lew Ireland, L. R. Ireland Associates■ Elvin Isgrig, North Dakota State University■ Murray Janzen, Procter & Gamble■ Frank Jenes■ Walter Karpowski, Management Assoc.■ William F. Kerrigan, Bechtel International, Inc.■ Harold Kerzner, Baldwin-Wallace College■ Robert L. Kimmons, Kimmons-Asaro Group Ltd., Inc.■ Richard King, AT&T■ J. D. “Kaay” Koch, Koch Associates■ Lauri Koskela, VTT Building Technology■ Richard E. Little, Project Performance Management■ Lyle W. Lockwood, Universal Technology Inc.■ Lawrence Mack, PMI Pittsburgh■ Christopher Madigan, Sandia National Laboratories■ Michael L. McCauley, Integrated Project Systems■ Hugh McLaughlin, Broadstar Inc.■ Frank McNeely, National Contract Management Association■ Pierre Menard, University of Quebec at Montreal■ Rick Michaels■ Raymond Miller, AT&T■ Alan Minson, A&R Minson■ Colin Morris, Delcan Hatch■ R. Bruce Morris■ David J. Mueller, Westinghouse■ Gary Nelson, Athena Consulting Inc.■ John P. Nolan, AACE International■ Louise C. Novakowski, Cominco Engineering Services, Ltd.■ James O’Brien, O’Brien-Kreitzberg■ JoAnn C. Osmer, Arbella Mutual Insurance Co.■ Jon V. Palmquist, Allstate Insurance■ Matthew Parry, Target Consultants■ John G. Phippen, JGP Quality Services■ Hans E. Picard, P&A Consultants Corporation■ Serge Y. Piotte, Cartier Group■ PMI, Houston Chapter■ PMI, Manitoba Chapter■ PMI, New Zealand Chapter■ Charles J. Pospisil, Procon, Inc.■ Janice Y. Preston, Pacifica Companies■ Mark T. Price, GE Nuclear Energy
t Body of Knowledge (PMBOK® Guide) 2000 Editionute, Four Campus Boulevard, Newtown Square, PA 19073-3299 USA 173
d to: Old Dominion University. Downloaded on September 15,2010 at 18:15:01 UTC from IEEE Xplore. Restrictions apply.

Appendix B—Evolution of PMI’s A Guide to the Project Management Body of Knowledge
174
Appe
ndix
B|
Appe
ndix
C
Authorized licensed use limited
■ Christopher Quaife, Symmetric Resources■ Peter E. Quinn, Canadian Air Force■ Steven F. Ritter, Mead Corporation■ William S. Ruggles, Ruggles & Associates■ Ralph B. Sackman, Levi Strauss & Co.■ Alice Sapienza, Simmons College■ Darryl M. Selleck■ Melvin Silverman, Atrium Associates, Inc.■ Roy Smith, Decision Planning Corp.■ Craig T. Stone, Management Counseling Corp.■ Hiroshi Tanaka, JGC Corporation■ Robert Templeton, MW Kellogg■ Dick Thiel, King County (WA) DPW■ Saul Thomashow, Andersen Consulting■ J. Tidhar, Oranatech Management Systems, Ltd.■ Vijay K. Verma, TRIUMF■ Janet Toepfer, Business Office Systems■ Alex Walton, Harris Corporation■ Jack Way, Simetra, Inc.■ R. Max Wideman, AEW Services■ Rebecca Winston, EG&G Idaho Inc.■ Hugh M. Woodward, Proctor & Gamble■ Robert Youker, Management Planning & Control Systems■ Shakir H. Zuberi, ICF Kaiser Engineers Hanford■ Dirk Zwart, Computer Sciences Corp.
Production StaffSpecial mention is due to the following employees of PMI Communications:■ Jeannette M. Cabanis, Editor, Book Division■ Misty N. Dillard, Administrative Assistant■ Linda V. Gillman, Office Administrator■ Bobby R. Hensley, Publications Coordinator■ Jonathan Hicks, Systems Administrator■ Sandy Jenkins, Associate Editor■ Mark S. Parker, Production Coordinator■ Dewey L. Messer, Managing Editor■ Danell Moses, Marketing Promotion Coordinator■ Shirley B. Parker, Business/Marketing Manager■ Melissa Pendergast, Information Services Coordinator■ James S. Pennypacker, Publisher/Editor-In-Chief■ Michelle Triggs, Graphic Designer■ Lisa Woodring, Administrative Assistant
A Guide to the Project Management Body of Knowledge (PMBOK® Guide) 2000 Edition©2000 Project Management Institute, Four Campus Boulevard, Newtown Square, PA 19073-3299 USA
to: Old Dominion University. Downloaded on September 15,2010 at 18:15:01 UTC from IEEE Xplore. Restrictions apply.
Appendix C
Contributors and Reviewers of PMBOK® Guide 2000 Edition
A Guide to the Project Ma©2000 Project Managem
Authorized licensed u
The following individuals contributed in many different ways to various drafts ofthis document. The Project Management Institute (PMI) is indebted to them fortheir support and acknowledges their contributions.
C.1 PMI PROJECT MANAGEMENT STANDARDS PROGRAMMEMBER ADVISORY GROUPThe following individuals served as members of the PMI Standards ProgramMember Advisory Group during development of this edition of A Guide to the ProjectManagement Body of Knowledge (PMBOK® Guide) document:■ George Belev, KAPL, Inc. - A Lockheed Martin Company■ Cynthia A. Berg, PMP, Medtronic Microelectronics Center■ Sergio Coronado Arrechedera, MicroStrategy■ Judith A. Doll, PMP, Monsanto■ J. Brian Hobbs, PMP, University of Quebec at Montreal■ David Hotchkiss, PMP, Nexgenix
C.2 PMBOK® GUIDE UPDATE PROJECT TEAMThe following individuals served as members of the project team for this 2000 Edi-tion of the PMBOK® Guide, under the leadership of Cynthia A. Berg, PMP, as ProjectManager:■ Cynthia A. Berg, PMP, Medtronic Microelectronics Center■ Judith A. Doll, PMP, Monsanto■ Daniel Dudek, PMP, PlanView, Inc.■ Quentin Fleming, Primavera Systems, Inc.■ Earl Glenwright, ASSIST■ David T. Hulett, Ph.D., International Institute for Learning Inc.■ Gregory J. Skulmoski, University of Calgary■ Greg Githens, PMP, Catalyst Management Consulting
nagement Body of Knowledge (PMBOK® Guide) 2000 Editionent Institute, Four Campus Boulevard, Newtown Square, PA 19073-3299 USA 175
se limited to: Old Dominion University. Downloaded on September 15,2010 at 18:15:01 UTC from IEEE Xplore. Restrictions apply.

Appendix C—Contributors and Reviewers of PMBOK® Guide 2000 Edition
176
Appe
ndix
C
Authorized licensed u
C.3 CONTRIBUTORSIn addition to the members of the PMI Standards Program Member Advisory Groupand the PMBOK® Guide Project Team, the following individuals provided originaltext or key concepts for one or more sections in the chapters indicated. Also, thePMI Risk Management Specific Interest Group provided leadership for the rewriteof Chapter 11, Project Risk Management.■ Quentin Fleming (Chapter 4, Project Integration Management, and Chapter 12,
Project Procurement Management)■ David Shuster (Chapter 8, Project Quality Management)■ David Hulett (Chapter 11, Project Risk Management)■ Sam Lane (Chapter 11, Project Risk Management)■ Ed Smith (Chapter 11, Project Risk Management)■ Alfredo del Caño (Chapter 11, Project Risk Management)■ Roger Graves (Chapter 11, Project Risk Management)■ David Hillson(Chapter 11, Project Risk Management)■ Stephen Reed (Chapter 11, Project Risk Management)■ Janice Preston (Chapter 11, Project Risk Management - editing)■ Mike Wakshull (Chapter 11, Project Risk Management - editing)■ Robert Youker (several sections throughout document)
C.4 REVIEWERS In addition to the PMI Standards Program Member Advisory Group, the PMBOK®
Guide Project Team, and the Contributors, the following individuals provided com-ments on the Exposure Draft of this document:Muhamed Abdomerovic, PMP, D. Eng. Yassir AfanehFabrizio Agnesi, PMP Jon D. Allen, PMPMaryGrace Allenchey, PMP Robert A. Andrejko, PMPIchizo Aoki Paul C. AspinwallRonald Auffrédou, PMP Edward Averill, PMPFrederick L. Ayer, PMP William W. Bahnmaier, PMPA. C. “Fred” Baker, PMP Carole J. Bass, PMPBerndt Bellman Sally Bernstein, PMPNigel Blampied, PE, PMP John BlattaPatrick Brown, PMP Chris Cartwright, PMPBruce C. Chadbourne, PMP Raymond C. Clark, PEMichael T. Clark, PMP Elizabeth ClarkeDavid Coates, PMP Kim Colenso, PMPEdmund H. Conrow, PMP Kenneth G. CooperJohn Cornman, PMP Richard F. Cowan, PMPKevin Daly, PMP Mario Damiani, PMPThomas Diethelm, PMP David M. Drevinsky, PMPFrank D. Einhorn, PMP Edward Fern, PMPChristian Frankenberg, PMP Scott D. Freauf, PMPJean-Luc Frere, PMP Ichiro Fujita, PMPChikako Futamura, PMP Serge Garon, PEng, PMPBrian L. Garrison, PMP Eric GloverPeter Bryan Goldsbury Michael Goodman, PMPJean Gouix, PMP Alexander Grassi Sr., PMPFranz X. Hake Peter Heffron
A Guide to the Project Management Body of Knowledge (PMBOK® Guide) 2000 Edition©2000 Project Management Institute, Four Campus Boulevard, Newtown Square, PA 19073-3299 USA
se limited to: Old Dominion University. Downloaded on September 15,2010 at 18:15:01 UTC from IEEE Xplore. Restrictions apply.

Appendix C—Contributors and Reviewers of PMBOK® Guide 2000 Edition
A Guide to the Project Managem©2000 Project Management Ins
Authorized licensed use lim
Chris Herbert, PMP Dr. David Hillson, PMP, FAPMJ. Brian Hobbs, PMP Marion Diane HolbrookRobin Hornby Bill HubbardCharles L. Hunt Thomas P. Hurley, PMPGeorge Jackelen Angyan P. JagathnarayananElden F. Jones II, PMP, CMII Sada Joshi, PMPLewis Kana, PMP Subramaniam Kandaswamy, Ph.D., PMPRonald L. Kempf, PMP Robert Dohn Kissinger, Ph.D, PMPKurt V. Kloecker Jan KristromBlase Kwok, PMP Lawrence P. LeachPhilip A. Lindeman Gábor LipiLyle W. Lockwood, PMP J. W. Lowthian, PMPArif Mahmood, PMP James Martin (on behalf of INCOSE)Stephen S. Mattingly Glen MaxfieldPeter McCarthy Rob McCormack, PMPKrik D. McManus David MichaudMary F. Miekoski, PMP Oscar A. MignoneGordon R. Miller, PMP Roy E. Morgan, PMPJim Morris, PMP Bert Mosterd, PMPWilliam A. Moylan, PMP John D. Nelson, PMPWolfgang Obermeier Cathy Oest, PMPMasato Ohori, PMP Kazuhiko Okubo, PE, PMPEdward Oliver Jerry Partridge, PMPFernando Romero Peñailillo Francisco Perez-Polo, PMPJames M. Phillips, PMP Crispin (Kik) Piney, PMPGeorge Pitagorsky, PMP David L. Prater, PMPBradford S. Price, PMP Samuel L. Raisch, PMPNaga Rajan G. Ramachandran, PMPBill Righter, PMP William Simon Vaughan RobinsonBernice L. Rocque, PMP Wolfgang Theodore RoeschJon Rude Linda Rust, PMPFabian Sagristani, PMP James N. Salapatas, PMPSeymour Samuels Bradford N. ScalesH. Peter Schiller John R. Schuyler, PMPMaria Scott, PMP Shoukat Sheikh, MBA, PMPKazuo Shimizu, PMP Larry Sieck
(on behalf of the PMI Tokyo, Japan, Chapter)
Melvin Silverman, Ph.D., P.E. Loren J. Simer Jr.Keith Skilling, P.E., PMP Greg SkulmoskiKenneth F. Smith, PMP Barry Smythe, PMPPaul J. Solomon Joe Soto Sr., PMPChristopher Wessley Sours, PMP Charlene Spoede, PMPJoyce Statz, PMP Emmett Stine, PMPThangavel Subbu Jim SzpakowskiAhmet N. Taspinar, PMP John A. Thoren Jr., PMPAlan D. Uren, PMP Juan Luis Valero, PMPS. Rao Vallabhaneni Ricardo Viana Vargas, PMPAna Isabel Vazquez Urbina Stephen E. Wall, PMPWilliam W. Wassel, PMP Tammo T. Wilkens, PE, PMPRebecca A. Winston Jean A. Yager
ent Body of Knowledge (PMBOK® Guide) 2000 Editiontitute, Four Campus Boulevard, Newtown Square, PA 19073-3299 USA 177
ited to: Old Dominion University. Downloaded on September 15,2010 at 18:15:01 UTC from IEEE Xplore. Restrictions apply.
Appendix C—Contributors and Reviewers of PMBOK® Guide 2000 Edition
178
Appe
ndix
C|
Appe
ndix
D
Authorized licensed
C.5 CONTRIBUTIONS TO PREDECESSOR DOCUMENTSPortions of the 1996 edition and other predecessor documents are included inthis edition. PMI wishes to acknowledge the following volunteers as substantialcontributors to this document:■ John R. Adams■ William R. Duncan■ Matthew H. Parry■ Alan Stretton■ R. Max Wideman
PMI also wishes to acknowledge the contributions of the other volunteers listedin Appendix B.
C.6 PRODUCTION STAFFSpecial mention is due to the following employees of PMI:■ Steven L. Fahrenkrog, Standards Manager■ Lisa Fisher, Assistant Editor■ Lewis M. Gedansky, Research Manager■ Linda V. Gillman, Advertising Coordinator/PMBOK® Guide Copyright
Permissions Coordinator■ Eva T. Goldman, Technical Research & Standards Associate■ Paul Grace, Certification Manager■ Sandy Jenkins, Managing Editor■ Toni D. Knott, Book Editor■ Mark S. Parker, Production Coordinator■ Dewey L. Messer, Design and Production Manager■ John McHugh, Interim Publisher■ Michelle Triggs Owen, Graphic Designer■ Shirley B. Parker, Business/Book Publishing Manager■ Iesha D. Turner-Brown, Standards Administrator
A Guide to the Project Management Body of Knowledge (PMBOK® Guide) 2000 Edition©2000 Project Management Institute, Four Campus Boulevard, Newtown Square, PA 19073-3299 USA
use limited to: Old Dominion University. Downloaded on September 15,2010 at 18:15:01 UTC from IEEE Xplore. Restrictions apply.

Appendix D
Notes
A Guide ©2000
Auth
CHAPTER 1. INTRODUCTION1. The American Heritage Dictionary of the English Language, 3d ed. 1992. Boston,
Mass.: Houghton Mifflin Company.2. Turner, J. Rodney. 1992. The Handbook of Project-Based Management. New York:
McGraw-Hill.
CHAPTER 2. THE PROJECT MANAGEMENT CONTEXT1. Morris, Peter W. G. 1988. Managing Project Interfaces: Key Points for Project
Success. In Cleland and King, Project Management Handbook, 2d ed. Englewood Cliffs,N.J.: Prentice-Hall.
2. Murphy, Patrice L. 1989. Pharmaceutical Project Management: Is It Different?Project Management Journal (September).
3. Muench, Dean, et al. 1994. The Sybase Development Framework. Oakland, Calif.:Sybase Inc.
4. Kotter, John P. 1990. A Force for Change: How Leadership Differs from Management.New York: The Free Press.
5. Pfeffer, Jeffrey. 1992. Managing with Power: Politics and Influence in Organizations.HBS Press. Quoted in Eccles et al., Beyond the Hype.
6. Eccles, Robert, et al. 1992. Beyond the Hype. Cambridge, Mass.: Harvard UniversityPress.
7. International Organization for Standardization. 1994. Code of Good Practice forStandardization (Draft International Standard). Geneva, Switzerland: ISO Press.
8. The American Heritage Dictionary of the English Language, 3d ed.
CHAPTER 3. PROJECT MANAGEMENT PROCESSES1. The American Heritage Dictionary of the English Language, 3d ed.
CHAPTER 4. PROJECT INTEGRATION MANAGEMENTNo notes for this chapter.
to the Project Management Body of Knowledge (PMBOK® Guide) 2000 EditionProject Management Institute, Four Campus Boulevard, Newtown Square, PA 19073-3299 USA 179
orized licensed use limited to: Old Dominion University. Downloaded on September 15,2010 at 18:15:01 UTC from IEEE Xplore. Restrictions apply.

Appendix D—Notes
180
Appe
ndix
D|
Appe
ndix
E
Auth
CHAPTER 5. PROJECT SCOPE MANAGEMENT1. Turner, J. Rodney. 1992. The Handbook of Project-Based Management.2. Ïyigün, M. Güven. 1993. A Decision Support System for R&D Project Selection and
Resource Allocation Under Uncertainty. Project Management Journal 3 (December).3. Scope Definition and Control, Publication 6-2. 1986 (July). Austin, Tex.:
Construction Industry Institute, p. 45.
CHAPTER 6. PROJECT TIME MANAGEMENTNo notes for this chapter.
CHAPTER 7. PROJECT COST MANAGEMENTNo notes for this chapter.
CHAPTER 8. PROJECT QUALITY MANAGEMENT1. International Organization for Standardization. ISO 8402. 1994. Quality
Management and Quality Assurance. Geneva, Switzerland: ISO Press.2. Ibid.3. Ibid.4. Ibid.5. Ibid.6. Ibid.
CHAPTER 9. PROJECT HUMAN RESOURCE MANAGEMENTNo notes for this chapter.
CHAPTER 10. PROJECT COMMUNICATIONS MANAGEMENTNo notes for this chapter.
CHAPTER 11. PROJECT RISK MANAGEMENTNo notes for this chapter.
CHAPTER 12. PROJECT PROCUREMENT MANAGEMENTNo notes for this chapter.
A Guide to the Project Management Body of Knowledge (PMBOK® Guide) 2000 Edition©2000 Project Management Institute, Four Campus Boulevard, Newtown Square, PA 19073-3299 USA
orized licensed use limited to: Old Dominion University. Downloaded on September 15,2010 at 18:15:01 UTC from IEEE Xplore. Restrictions apply.

Appendix E
Application Area Extensions
A Guide to the Project Mana©2000 Project Manageme
Authorized licensed us
E.1 NEED FOR APPLICATION AREA EXTENSIONSApplication area extensions are necessary when there are generally acceptedknowledge and practices for a category of projects in one application area thatare not generally accepted across the full range of project types in most applica-tion areas. Application area extensions reflect:■ Unique or unusual aspects of the project environment of which the project man-
agement team must be aware in order to manage the project efficiently andeffectively.
■ Common knowledge and practices that, if followed, will improve the efficiencyand effectiveness of the project (e.g., standard work breakdown structures).Application area-specific knowledge and practices can arise as a result of
many factors, including, but not limited to, differences in cultural norms, tech-nical terminology, societal impact, or project life cycles. For example:■ In construction, where virtually all work is accomplished under contract, there
are common knowledge and practices related to procurement that do notapply to all categories of projects.
■ In bioscience, there are common knowledge and practices driven by the reg-ulatory environment that do not apply to all categories of projects.
■ In government contracting, there are common knowledge and practices drivenby government acquisition regulations that do not apply to all categories ofprojects.
■ In consulting, there are common knowledge and practices created by theproject manager’s sales and marketing responsibilities that do not apply to allcategories of projects.Application area extensions are:
■ Additions to the core material of Chapters 1 through 12, not substitutes for it.■ Organized in a fashion similar to this document—that is, by identifying and
describing the project management processes unique to that application area.
gement Body of Knowledge (PMBOK® Guide) 2000 Editionnt Institute, Four Campus Boulevard, Newtown Square, PA 19073-3299 USA 181
e limited to: Old Dominion University. Downloaded on September 15,2010 at 18:15:01 UTC from IEEE Xplore. Restrictions apply.

Appendix E—Application Area Extensions
182
Appe
ndix
E
Authorized licensed us
■ Unique additions to the core material such as:◆ Identifying new or modified processes.◆ Subdividing existing processes.◆ Describing different sequences or interactions of processes.◆ Increasing elements or modifying the common process definitions.◆ Defining special inputs, tools and techniques, and/or outputs for the existing
processes.Application area extensions are not:
■ “How-to” documents or “practice guidelines”—such documents may be issuedas PMI Standards, but they are not what are intended as extensions.
■ A lower level of detail than is addressed in this document—such details maybe addressed in handbooks or guidebooks that may be issued as PMI Stan-dards, but they are not what is intended as extensions.
E.2 CRITERIA FOR DEVELOPMENT OF APPLICATION AREAEXTENSIONSExtensions will be developed under the following criteria:■ There is a substantial body of knowledge that is both project oriented and
unique or nearly unique to that application area.■ There is an identifiable PMI component (e.g., a PMI Specific Interest Group,
College, or Chapter) or an identifiable external organization willing and ableto commit the necessary resources to subscribe to and support the PMI Stan-dards Program with the development and maintenance of a specific PMI Stan-dard. Or, the extension may be developed by PMI itself.
■ The proposed extension is able to pass the same level of rigorous PMI ProjectManagement Standard-Setting Process as any other PMI Standard.
E.3 PUBLISHING AND FORMAT OF APPLICATION AREAEXTENSIONSApplication area extensions are developed and/or published by PMI, or they aredeveloped and/or published by either a PMI component or an external organi-zation under a formal agreement with PMI.■ Extensions match this document in style and content. They use the paragraph
and subparagraph numbers of this document for the material that has beenextended.
■ Sections and paragraphs of this document that are not extended are not repeatedin extensions.
■ Extensions contain a rationale/justification about the need for an extensionand its material.
■ Extensions are delimited in terms of what they are not intended to do.
E.4 PROCESS FOR DEVELOPMENT AND MAINTENANCE OFAPPLICATION AREA EXTENSIONSWhen approved in accord with the PMI Standards-Setting Process, applicationarea extensions become PMI Standards. They will be developed and maintainedin accordance with the process described below.
A Guide to the Project Management Body of Knowledge (PMBOK® Guide) 2000 Edition©2000 Project Management Institute, Four Campus Boulevard, Newtown Square, PA 19073-3299 USA
e limited to: Old Dominion University. Downloaded on September 15,2010 at 18:15:01 UTC from IEEE Xplore. Restrictions apply.
Appendix E—Application Area Extensions
A Guide to the Project Management ©2000 Project Management Institut
Authorized licensed use limited
■ An extension must be sponsored by PMI, a formally chartered PMI component(e.g., a Specific Interest Group, College, or Chapter), or another organizationexternal to PMI, which has been approved by the PMI Standards ProgramMember Advisory Group and the PMI Standards Program Manager. Cospon-sorship with PMI is the preferred arrangement. All approvals will be by formalwritten agreement between PMI and the sponsoring entity, which agreementwill include, among other things, the parties’ agreement as to intellectualproperty ownership rights and publications rights to the extension.
■ A project to develop, publish, and/or maintain an extension must be approvedby the PMI Standards Program. Permission to initiate, develop, and maintainan extension must be received from PMI and will be the subject of an agree-ment between or among the organizations. If there is no other sponsoringorganization, the PMI Standards Program may elect to proceed alone.
■ The sponsoring group will notify and solicit advice and support from the PMIStandards Program Member Advisory Group and PMI Standards Program Man-ager throughout the development and maintenance process. They will concurwith the appropriateness of the sponsoring organization for the extension pro-posed and will review the extension during its development to identify anyconflicts or overlaps with other similar projects that may be under way.
■ The sponsoring group will prepare a proposal to develop the extension. Theproposal will include a justification for the project with a matrix of applica-tion-area-specific processes and the affected sections of this document. It willalso contain the commitment of sufficient qualified drafters and reviewers;identification of funding requirements, including reproduction, postage, tele-phone costs, desktop publishing, etc.; commitment to the PMI procedures forPMI Standards extension development and maintenance; and a plan andschedule for extension development and maintenance.
■ Following acceptance of the proposal, the project team will prepare a projectcharter for approval by the sponsoring group and the PMI Standards ProgramTeam. The charter will include sources of funding and any funding proposedto be provided by PMI. It will include a requirement for periodic review of theextension with reports to the PMI Standards Program Team and a “SunsetClause” that specifies when, and under what conditions, the extension will beremoved from active status as a PMI Standard.
■ The proposal will be submitted to the PMI Standards Manager in accordancewith the PMI Standards-Setting Process. The PMI Standards Manager willdetermine if the proposal can be expected to result in a document that willmeet the requirements for a PMI Standard and if adequate resources andsources of support have been identified. To help with this determination, thePMI Standards Manager will seek review and comment by the PMI StandardsProgram Member Advisory Group and, if appropriate, a panel of knowledge-able persons not involved with the extension.
■ The PMI Standards Manager, with the support of the PMI Standards ProgramMember Advisory Group, will monitor and support the development of theapproved project.
■ The sponsoring organization will develop the extension according to theapproved project charter, including coordinating with the PMI Standards Pro-gram Team for support, review, and comment.
Body of Knowledge (PMBOK® Guide) 2000 Editione, Four Campus Boulevard, Newtown Square, PA 19073-3299 USA 183
to: Old Dominion University. Downloaded on September 15,2010 at 18:15:01 UTC from IEEE Xplore. Restrictions apply.

Appendix E—Application Area Extensions
184
Appe
ndix
E|
Appe
ndix
F
Authorized licensed use limited
■ When the extension has been completed to the satisfaction of the sponsoringorganization, it will be submitted to the PMI Standards Manager, who willmanage the final approval and publication processes in accordance with thePMI Standards-Setting Process. This final submittal will include listing of andcommitment by the sponsoring organization to the PMI extension mainte-nance processes and efforts.
■ Following approval of the extension as a PMI Standard, the sponsoring orga-nization will implement the extension maintenance process in accordancewith the approved plan.
A Guide to the Project Management Body of Knowledge (PMBOK® Guide) 2000 Edition©2000 Project Management Institute, Four Campus Boulevard, Newtown Square, PA 19073-3299 USA
to: Old Dominion University. Downloaded on September 15,2010 at 18:15:01 UTC from IEEE Xplore. Restrictions apply.

Appendix F
Additional Sources of Informationon Project Management
A Guide to the Project Manage©2000 Project Management I
Authorized licensed use li
Project management is a growing, dynamic field; books and articles on the sub-ject are published regularly. The entities listed below provide a variety of prod-ucts and services that may be of use to those interested in project management.
F.1 PROFESSIONAL AND TECHNICAL ORGANIZATIONSThis document was developed and published by the Project Management Insti-tute (PMI). PMI can be contacted at:
Project Management InstituteFour Campus BoulevardNewtown Square, PA 19073-3299 USAPhone: +610/356-4600Fax: +610/356-4647 Email: [email protected]: http://www.pmi.org
PMI currently has cooperative agreements with the following organizations:■ Association for the Advancement of Cost Engineering (AACE International)
Phone: +304/296-8444 Fax: +304/291-5728
■ Asociacion Espanola de Ingenieria de Proyectos (AEIPRO)Phone: +3476-976-761-910 Fax: +349-1447-3187
■ Australian Institute of Project Management (AIPM)Phone: +61-2-9960-0058 Fax: +61-2-9960-0052
■ Construction & Economy Research Institute of Korea (CERIK)Phone: +822-3441-0801 Fax: +822-544-6234
■ Defense Systems Management College Alumni Association (DSMCAA)Phone: +703/960-6802 Fax: +703/960-6807
■ Engineering Advancement Association of Japan (ENAA)Phone: +81-3-3502-4441 Fax: +81-3-3502-5500
ment Body of Knowledge (PMBOK® Guide) 2000 Editionnstitute, Four Campus Boulevard, Newtown Square, PA 19073-3299 USA 185
mited to: Old Dominion University. Downloaded on September 15,2010 at 18:15:01 UTC from IEEE Xplore. Restrictions apply.

Appendix F—Additional Sources of Information on Project Management
186
Appe
ndix
F
Authorized licensed use limited
■ Institute of Project Management (IPM-Ireland)Phone: +353-1-661-4677 Fax: +353-1-661-3588
■ International Project Management Association (IPMA)Phone: +44-1594-531-007 Fax: +44-1594-531-008
■ Korean Institute of Project Management & Technology (PROMAT)Phone: +822-522-0360 Fax: +822-523-1680
■ National Contract Management Association (NCMA)Phone: 703/448-9231 Fax: +703/448-0939
■ The NORDNET National Associations (Denmark, Finland, Iceland, Norway, and Sweden)
Fax: +468-719-9316
■ Project Management Associates (PMA-India)Phone: +91-11-852-6673 Fax: +91-11-646-4481
■ Project Management Institute South AfricaPhone/Fax: +2711-706-6813
■ Projekt Management AustriaPhone: +43-1-1313-52-215 Fax: +43-1-319-78-55
■ Russian Project Management Association (SOVNET)Phone: +7-095-133-26-11 Fax: +7-095-133-24-41
■ Ukrainian Project Management AssociationPhone: +38-044-272-9400 or +38-044-245-4857
■ Project Management Association of Slovakia (SPPR)Phone: +421-805-599-1806 Fax: +421-805-599-1-818
■ Slovenian Project Management Association (ZPM)Phone: +386-6117-667-134 Fax: +386-61217-431
In addition, there are numerous other organizations in related fields, whichmay be able to provide additional information about project management. Forexample:■ Academy of Management■ American Management Association International■ American Society for Quality Control■ Construction Industry Institute■ Construction Management Association of America (CMAA)■ Institute of Electrical and Electronics Engineers (IEEE)■ Institute of Industrial Engineers (IIE)■ International Council on Systems Engineering (INCOSE)■ National Association for Purchasing Management■ National Contract Management Association■ Society for Human Resource Management■ American Society of Civil Engineers
Current contact information for these and other professional and technicalorganizations worldwide can generally be found on the Internet.
A Guide to the Project Management Body of Knowledge (PMBOK® Guide) 2000 Edition©2000 Project Management Institute, Four Campus Boulevard, Newtown Square, PA 19073-3299 USA
to: Old Dominion University. Downloaded on September 15,2010 at 18:15:01 UTC from IEEE Xplore. Restrictions apply.

Appendix F—Additional Sources of Information on Project Management
A Guide to the Project Mana©2000 Project Managemen
Authorized licensed us
F.2 COMMERCIAL PUBLISHERSPMI is the largest publisher of books on project management. Many commercialpublishers produce books on project management and related fields. Commercialpublishers that regularly produce such materials include:■ Addison-Wesley■ AMACOM■ Gower Press■ John Wiley & Sons■ Marcel Dekker■ McGraw-Hill■ Prentice-Hall■ Probus■ Van Nostrand Reinhold
Most project management books from these publishers are available fromPMI. Many of the books available from these sources include extensive bibli-ographies or lists of suggested readings.
F.3 PRODUCT AND SERVICE VENDORSCompanies that provide software, training, consulting, and other products andservices to the project management profession often provide monographs orreprints.
The PMI Registered Education Provider (R.E.P.) Program facilitates the ongoingprofessional development of PMI Members, Project Management Professionals(PMPs), and other project management stakeholders by linking stakeholdersand training coordinators with qualified educational providers and products.A listing of R.E.P.s and their associated educational offerings is found athttp://www.pmi.org/education/rep.
F.4 EDUCATIONAL INSTITUTIONSMany universities, colleges, and junior colleges offer continuing education pro-grams in project management and related disciplines. Many of these institutionsalso offer graduate or undergraduate degree programs.
gement Body of Knowledge (PMBOK® Guide) 2000 Editiont Institute, Four Campus Boulevard, Newtown Square, PA 19073-3299 USA 187
e limited to: Old Dominion University. Downloaded on September 15,2010 at 18:15:01 UTC from IEEE Xplore. Restrictions apply.

Appendix G
Summary of Project Management Knowledge Areas
A Guide to the Project Managemen©2000 Project Management Institu
Authorized licensed use limite
PROJECT INTEGRATION MANAGEMENTA subset of project management that includes the processes required to ensurethat the various elements of the project are properly coordinated. It consists of:■ Project plan development—integrating and coordinating all project plans to
create a consistent, coherent document.■ Project plan execution—carrying out the project plan by performing the activ-
ities included therein.■ Integrated change control—coordinating changes across the entire project.
PROJECT SCOPE MANAGEMENTA subset of project management that includes the processes required to ensurethat the project includes all the work required, and only the work required, tocomplete the project successfully. It consists of:■ Initiation—authorizing the project or phase.■ Scope planning—developing a written scope statement as the basis for future
project decisions.■ Scope definition—subdividing the major project deliverables into smaller,
more manageable components.■ Scope verification—formalizing acceptance of the project scope.■ Scope change control—controlling changes to project scope.
t Body of Knowledge (PMBOK® Guide) 2000 Editionte, Four Campus Boulevard, Newtown Square, PA 19073-3299 USA 189
d to: Old Dominion University. Downloaded on September 15,2010 at 18:15:01 UTC from IEEE Xplore. Restrictions apply.

Appendix G—Summary of Project Management Knowledge Areas
190
Appe
ndix
G
Authorized licensed use limited t
PROJECT TIME MANAGEMENTA subset of project management that includes the processes required to ensuretimely completion of the project. It consists of:■ Activity definition—identifying the specific activities that must be performed
to produce the various project deliverables.■ Activity sequencing—identifying and documenting interactivity dependencies.■ Activity duration estimating—estimating the number of work periods that will
be needed to complete individual activities.■ Schedule development—analyzing activity sequences, activity durations, and
resource requirements to create the project schedule.■ Schedule control—controlling changes to the project schedule.
PROJECT COST MANAGEMENTA subset of project management that includes the processes required to ensurethat the project is completed within the approved budget. It consists of:■ Resource planning—determining what resources (people, equipment, mate-
rials) and what quantities of each should be used to perform project activities.■ Cost estimating—developing an approximation (estimate) of the costs of the
resources needed to complete project activities.■ Cost budgeting—allocating the overall cost estimate to individual work activities.■ Cost control—controlling changes to the project budget.
PROJECT QUALITY MANAGEMENTA subset of project management that includes the processes required to ensurethat the project will satisfy the needs for which it was undertaken. It consists of:■ Quality planning—identifying which quality standards are relevant to the
project and determining how to satisfy them.■ Quality assurance—evaluating overall project performance on a regular basis to
provide confidence that the project will satisfy the relevant quality standards.■ Quality control—monitoring specific project results to determine if they comply
with relevant quality standards and identifying ways to eliminate causes ofunsatisfactory performance.
PROJECT HUMAN RESOURCE MANAGEMENTA subset of project management that includes the processes required to make themost effective use of the people involved with the project. It consists of:■ Organizational planning—identifying, documenting, and assigning project
roles, responsibilities, and reporting relationships.■ Staff acquisition—getting the needed human resources assigned to and working
on the project.■ Team development—developing individual and group skills to enhance project
performance.
A Guide to the Project Management Body of Knowledge (PMBOK® Guide) 2000 Edition©2000 Project Management Institute, Four Campus Boulevard, Newtown Square, PA 19073-3299 USA
o: Old Dominion University. Downloaded on September 15,2010 at 18:15:01 UTC from IEEE Xplore. Restrictions apply.

Appendix G—Summary of Project Management Knowledge Areas
A Guide to the Project Managemen©2000 Project Management Instit
Authorized licensed use limite
PROJECT COMMUNICATIONS MANAGEMENTA subset of project management that includes the processes required to ensuretimely and appropriate generation, collection, dissemination, storage, and ulti-mate disposition of project information. It consists of:■ Communications planning—determining the information and communica-
tions needs of the stakeholders: who needs what information, when they willneed it, and how it will be given to them.
■ Information distribution—making needed information available to projectstakeholders in a timely manner.
■ Performance reporting—collecting and disseminating performance informa-tion. This includes status reporting, progress measurement, and forecasting.
■ Administrative closure—generating, gathering, and disseminating informationto formalize phase or project completion.
PROJECT RISK MANAGEMENTRisk management is the systematic process of identifying, analyzing, andresponding to project risk. It includes maximizing the probability and conse-quences of positive events and minimizing the probability and consequences ofadverse events to project objectives. It includes:■ Risk management planning—deciding how to approach and plan the risk
management activities for a project.■ Risk identification—determining which risks might affect the project and doc-
umenting their characteristics.■ Qualitative risk analysis—performing a qualitative analysis of risks and con-
ditions to prioritize their effects on project objectives.■ Quantitative risk analysis—measuring the probability and consequences of
risks and estimating their implications for project objectives.■ Risk response planning—developing procedures and techniques to enhance
opportunities and reduce threats from risk to the project’s objectives.■ Risk monitoring and control—monitoring residual risks, identifying new risks,
executing risk reduction plans, and evaluating their effectiveness throughoutthe project life cycle.
PROJECT PROCUREMENT MANAGEMENTA subset of project management that includes the processes required to acquiregoods and services to attain project scope from outside the performing organi-zation. It consists of:■ Procurement planning—determining what to procure and when.■ Solicitation planning—documenting product requirements and identifying
potential sources.■ Solicitation—obtaining quotations, bids, offers, or proposals, as appropriate.■ Source selection—choosing from among potential sellers.■ Contract administration—managing the relationship with the seller.■ Contract closeout—completion and settlement of the contract, including res-
olution of any open items.
t Body of Knowledge (PMBOK® Guide) 2000 Editionute, Four Campus Boulevard, Newtown Square, PA 19073-3299 USA 191
d to: Old Dominion University. Downloaded on September 15,2010 at 18:15:01 UTC from IEEE Xplore. Restrictions apply.

SECTION IV
GLOSSARY AND INDEX
Glossary
Index
Authorized licensed use limited to: Old Dominion University. Downloaded on September 15,2010 at 18:15:01 UTC from IEEE Xplore. Restrictions apply.

Glossary
A Guide to the Project Man©2000 Project Manageme
Authorized licensed u
1. INCLUSIONS AND EXCLUSIONSThis glossary includes terms that are:■ Unique or nearly unique to project management (e.g., scope statement, work
package, work breakdown structure, critical path method).■ Not unique to project management, but used differently or with a narrower
meaning in project management than in general everyday usage (e.g., earlystart date, activity, task).
This glossary generally does not include:■ Application area-specific terms (e.g., project prospectus as a legal document—
unique to real estate development).■ Terms whose use in project management do not differ in any material way
from everyday use (e.g., calendar).■ Compound terms whose meaning are clear from the combined meanings of
the component parts.■ Variants when the meaning of the variant is clear from the base term (e.g.,
exception report is included, exception reporting is not).
As a result of the above inclusions and exclusions, this glossary includes:■ A preponderance of terms related to Project Scope Management, Project Time
Management, and Project Risk Management, since many of the terms used inthese knowledge areas are unique or nearly unique to project management.
■ Many terms from Project Quality Management, since these terms are usedmore narrowly than in their everyday usage.
■ Relatively few terms related to Project Human Resource Management andProject Communications Management, since most of the terms used in theseknowledge areas do not differ significantly from everyday usage.
■ Relatively few terms related to Project Cost Management and Project Pro-curement Management, since many of the terms used in these knowledgeareas have narrow meanings that are unique to a particular application area.
agement Body of Knowledge (PMBOK® Guide) 2000 Editionnt Institute, Four Campus Boulevard, Newtown Square, PA 19073-3299 USA 195
se limited to: Old Dominion University. Downloaded on September 15,2010 at 18:15:01 UTC from IEEE Xplore. Restrictions apply.

Glossary
196
Com
mon
Acr
onym
s|
Adm
inst
rativ
e Cl
osur
e
Authorized licensed use
2. COMMON ACRONYMSAC Actual Cost
ACWP Actual Cost of Work PerformedAD Activity Description
ADM Arrow Diagramming MethodAF Actual Finish date
AOA Activity-on-ArrowAON Activity-on-Node
AS Actual Start dateBAC Budget at Completion
BCWP Budgeted Cost of Work PerformedBCWS Budgeted Cost of Work Scheduled
CAP Control Account Plan (previously called Cost Account Plan)CCB Change Control Board
CPFF Cost-Plus-Fixed-FeeCPI Cost Performance Index
CPIF Cost-Plus-Incentive-FeeCPM Critical Path Method
CV Cost VarianceDD Data DateDU Duration
EAC Estimate at CompletionEF Early Finish dateES Early Start date
ETC Estimate to CompleteEV Earned Value
EVM Earned Value ManagementFF Free Float or Finish-to-Finish
FFP Firm Fixed-PriceFPIF Fixed-Price-Incentive-Fee
FS Finish-to-StartGERT Graphical Evaluation and Review Technique
IFB Invitation for BidLF Late Finish date
LOE Level of EffortLS Late Start date
OBS Organization(al) Breakdown StructurePC Percent Complete
PDM Precedence Diagramming MethodPERT Program Evaluation and Review Technique
PF Planned Finish datePM Project Management or Project Manager
PMBOK® Project Management Body of KnowledgePMP® Project Management Professional
PS Planned Start datePV Planned ValueQA Quality AssuranceQC Quality Control
RAM Responsibility Assignment MatrixRDU Remaining Duration
A Guide to the Project Management Body of Knowledge (PMBOK® Guide) 2000 Edition©2000 Project Management Institute, Four Campus Boulevard, Newtown Square, PA 19073-3299 USA
limited to: Old Dominion University. Downloaded on September 15,2010 at 18:15:01 UTC from IEEE Xplore. Restrictions apply.

Glossary
A Guide to the Project Managem©2000 Project Management In
Authorized licensed use lim
RFP Request for ProposalRFQ Request for Quotation
SF Scheduled Finish date or Start-to-FinishSOW Statement of Work
SPI Schedule Performance IndexSS Scheduled Start date or Start-to-StartSV Schedule VarianceTC Target Completion dateTF Total Float or Target Finish date
TQM Total Quality ManagementTS Target Start dateVE Value Engineering
WBS Work Breakdown Structure
3. DEFINITIONSMany of the words defined here have broader, and in some cases different, dic-tionary definitions.
The definitions use the following conventions:■ Terms used as part of the definitions and that are defined in the glossary are
shown in italics.■ When synonyms are included, no definition is given and the reader is directed
to the preferred term (i.e., see preferred term).■ Related terms that are not synonyms are cross-referenced at the end of the
definition (i.e., see also related term).
Accountability Matrix. See responsibility assignment matrix.Activity. An element of work performed during the course of a project. An activity normally
has an expected duration, an expected cost, and expected resource requirements.Activities can be subdivided into tasks.
Activity Definition. Identifying the specific activities that must be performed to produce thevarious project deliverables.
Activity Description (AD). A short phrase or label used in a project network diagram. Theactivity description normally describes the scope of work of the activity.
Activity Duration Estimating. Estimating the number of work periods that will be neededto complete individual activities.
Activity-on-Arrow (AOA). See arrow diagramming method.Activity-on-Node (AON). See precedence diagramming method.Activity Sequencing. Identifying and documenting interactivity logical relationships.Actual Cost (AC). Total costs incurred that must relate to whatever cost was budgeted
within the planned value and earned value (which can sometimes be direct laborhours alone, direct costs alone, or all costs including indirect costs) in accomplishingwork during a given time period. See also earned value.
Actual Cost of Work Performed (ACWP). This term has been replaced with the termactual cost.
Actual Finish Date (AF). The point in time that work actually ended on an activity. (Note:In some application areas, the activity is considered “finished” when work is “sub-stantially complete.”)
Actual Start Date (AS). The point in time that work actually started on an activity.Administrative Closure. Generating, gathering, and disseminating information to formalize
phase or project completion.
ent Body of Knowledge (PMBOK® Guide) 2000 Editionstitute, Four Campus Boulevard, Newtown Square, PA 19073-3299 USA 197
ited to: Old Dominion University. Downloaded on September 15,2010 at 18:15:01 UTC from IEEE Xplore. Restrictions apply.

Glossary
198
Appl
icat
ion
Area
|Co
st E
stim
atin
g
Authorized licensed use limite
Application Area. A category of projects that have common elements not present in all proj-ects. Application areas are usually defined in terms of either the product of the project(i.e., by similar technologies or industry sectors) or the type of customer (e.g., internalversus external, government versus commercial). Application areas often overlap.
Arrow. The graphic presentation of an activity. See also arrow diagramming method.Arrow Diagramming Method (ADM). A network diagramming technique in which activities
are represented by arrows. The tail of the arrow represents the start, and the headrepresents the finish of the activity (the length of the arrow does not represent theexpected duration of the activity). Activities are connected at points called nodes(usually drawn as small circles) to illustrate the sequence in which the activities areexpected to be performed. See also precedence diagramming method.
As-of Date. See data date.Assumptions. Assumptions are factors that, for planning purposes, are considered to be
true, real, or certain. Assumptions affect all aspects of project planning, and are partof the progressive elaboration of the project. Project teams frequently identify, doc-ument, and validate assumptions as part of their planning process. Assumptions gen-erally involve a degree of risk.
Assumptions analysis. A technique that explores the assumptions’ accuracy and identifiesrisks to the project from inaccuracy, inconsistency, or incompleteness of assumptions.
Backward Pass. The calculation of late finish dates and late start dates for the uncom-pleted portions of all network activities. Determined by working backwards through thenetwork logic from the project’s end date. The end date may be calculated in a for-ward pass or set by the customer or sponsor. See also network analysis.
Bar Chart. A graphic display of schedule-related information. In the typical bar chart, activ-ities or other project elements are listed down the left side of the chart, dates areshown across the top, and activity durations are shown as date-placed horizontalbars. Also called a Gantt chart.
Baseline. The original approved plan (for a project, a work package, or an activity), plus orminus approved scope changes. Usually used with a modifier (e.g., cost baseline,schedule baseline, performance measurement baseline).
Baseline Finish Date. See scheduled finish date.Baseline Start Date. See scheduled start date.Brainstorming. A general creativity technique that can be used to identify risks using a
group of team members or subject-matter experts. Typically, a brainstorming sessionis structured so that each participant’s ideas are recorded for later analysis. A toolof the risk identification process.
Budget at Completion (BAC). The sum of the total budgets for a project.Budget Estimate. See estimate.Budgeted Cost of Work Performed (BCWP).This term has been replaced with the term
earned value.Budgeted Cost of Work Scheduled (BCWS). This term has been replaced with the term
planned value.Buffer. See reserve.Calendar Unit. The smallest unit of time used in scheduling the project. Calendar units are
generally in hours, days, or weeks, but can also be in shifts or even in minutes. Usedprimarily in relation to project management software.
Change Control Board (CCB). A formally constituted group of stakeholders responsible forapproving or rejecting changes to the project baselines.
Chart of Accounts. Any numbering system used to monitor project costs by category (e.g.,labor, supplies, materials, and equipment ). The project chart of accounts is usuallybased upon the corporate chart of accounts of the primary performing organization.See also code of accounts.
Charter. See project charter.Checklist. A listing of many possible risks that might occur on a project. It is used as a tool
in the risk identification process. Checklists are comprehensive, listing several typesof risk that have been encountered on prior projects.
A Guide to the Project Management Body of Knowledge (PMBOK® Guide) 2000 Edition©2000 Project Management Institute, Four Campus Boulevard, Newtown Square, PA 19073-3299 USA
d to: Old Dominion University. Downloaded on September 15,2010 at 18:15:01 UTC from IEEE Xplore. Restrictions apply.

Glossary
A Guide to the Project Managemen©2000 Project Management Insti
Authorized licensed use limite
Code of Accounts. Any numbering system used to uniquely identify each element of thework breakdown structure. See also chart of accounts.
Communications Planning. Determining the information and communications needs of theproject stakeholders: who needs what information, when they will need it, and how itwill be given to them.
Component. A constituent part, an element.Constraint. Applicable restriction that will affect the performance of the project. Any factor
that affects when an activity can be scheduled.Contingencies. See reserve and contingency planning.Contingency Allowance. See reserve.Contingency Planning. The development of a management plan that identifies alternative
strategies to be used to ensure project success if specified risk events occur.Contingency Reserve. The amount of money or time needed above the estimate to reduce
the risk of overruns of project objectives to a level acceptable to the organization.Contract. A contract is a mutually binding agreement that obligates the seller to provide the
specified product and obligates the buyer to pay for it. Contracts generally fall into oneof three broad categories:■ Fixed-price or lump-sum contracts—this category of contract involves a fixed total
price for a well-defined product. Fixed-price contracts may also include incentivesfor meeting or exceeding selected project objectives, such as schedule targets.
■ Cost-reimbursable contracts—this category of contract involves payment (reim-bursement) to the contractor for its actual costs. Costs are usually classified asdirect costs (costs incurred directly by the project, such as wages for membersof the project team) and indirect costs (costs allocated to the project by the per-forming organization as a cost of doing business, such as salaries for corporateexecutives). Indirect costs are usually calculated as a percentage of direct costs.Cost-reimbursable contracts often include incentives for meeting or exceedingselected project objectives, such as schedule targets or total cost.
■ Time and material contracts—time and material contracts are a hybrid type ofcontractual arrangement that contain aspects of both cost-reimbursable and fixed-price-type arrangements. Time and material contracts resemble cost-type arrange-ments in that they are open ended, because the full value of the arrangement isnot defined at the time of the award. Thus, time and material contracts can growin contract value as if they were cost-reimbursable-type arrangements. Conversely,time and material arrangements can also resemble fixed-unit arrangements when,for example, the unit rates are preset by the buyer and seller, as when both par-ties agree on the rates for the category of “senior engineers.”
Contract Administration. Managing the relationship with the seller.Contract Closeout. Completion and settlement of the contract, including resolution of any
open items.Control. The process of comparing actual performance with planned performance, analyzing
variances, evaluating possible alternatives, and taking appropriate corrective actionas needed.
Control Account Plan (CAP). Previously called a Cost Account Plan. The CAP is a man-agement control point where the integration of scope and budget and schedule takesplace, and where the measurement of performance will happen. CAPs are placed atselected management points of the work breakdown structure.
Control Charts. Control charts are a graphic display of the results, over time and againstestablished control limits, of a process. They are used to determine if the process is“in control” or in need of adjustment.
Corrective Action. Changes made to bring expected future performance of the project inline with the plan.
Cost Budgeting. Allocating the cost estimates to individual work activities.Cost Control. Controlling changes to the project budget.Cost Estimating. Developing an approximation (estimate) of the cost of the resources
needed to complete project activities.
t Body of Knowledge (PMBOK® Guide) 2000 Editiontute, Four Campus Boulevard, Newtown Square, PA 19073-3299 USA 199
d to: Old Dominion University. Downloaded on September 15,2010 at 18:15:01 UTC from IEEE Xplore. Restrictions apply.

Glossary
200
Cost
of Q
ualit
y|
Fixe
d-Pr
ice-
Ince
ntiv
e-Fe
e Co
ntra
ct
Authorized licensed use limite
Cost of Quality. The costs incurred to ensure quality. The cost of quality includes qualityplanning, quality control, quality assurance, and rework.
Cost Performance Index (CPI). The cost efficiency ratio of earned value to actual costs.CPI is often used to predict the magnitude of a possible cost overrun using the fol-lowing formula: BAC/CPI = projected cost at completion. CPI = EV divided by AC.
Cost-Plus-Fixed-Fee (CPFF) Contract. A type of contract where the buyer reimburses theseller for the seller’s allowable costs (allowable costs are defined by the contract) plusa fixed amount of profit (fee).
Cost-Plus-Incentive-Fee (CPIF) Contract. A type of contract where the buyer reimbursesthe seller for the seller’s allowable costs (allowable costs are defined by the contract),and the seller earns its profit if it meets defined performance criteria.
Cost Variance (CV). 1) Any difference between the budgeted cost of an activity and theactual cost of that activity. 2) In earned value, EV less ACWP = CV.
Crashing. Taking action to decrease the total project duration after analyzing a number ofalternatives to determine how to get the maximum duration compression for the leastcost.
Critical Activity. Any activity on a critical path. Most commonly determined by using the crit-ical path method. Although some activities are “critical,” in the dictionary sense,without being on the critical path, this meaning is seldom used in the project context.
Critical Path. The series of activities that determines the duration of the project. In a deter-ministic model, the critical path is usually defined as those activities with float lessthan or equal to a specified value, often zero. It is the longest path through theproject. See critical path method.
Critical Path Method (CPM). A network analysis technique used to predict project durationby analyzing which sequence of activities (which path) has the least amount of sched-uling flexibility (the least amount of float). Early dates are calculated by means of aforward pass, using a specified start date. Late dates are calculated by means of abackward pass, starting from a specified completion date (usually the forward pass’calculated project early finish date).
Current Finish Date. The current estimate of the point in time when an activity will be com-pleted.
Current Start Date. The current estimate of the point in time when an activity will begin.Data Date (DD). The date at which, or up to which, the project’s reporting system has pro-
vided actual status and accomplishments. Also called as-of date.Decision Tree Analysis. The decision tree is a diagram that describes a decision under
consideration and the implications of choosing one or another of the available alter-natives. It incorporates probabilities or risks and the costs or rewards of each logicalpath of events and future decisions.
Definitive Estimate. See estimate.Deliverable. Any measurable, tangible, verifiable outcome, result, or item that must be pro-
duced to complete a project or part of a project. Often used more narrowly in refer-ence to an external deliverable, which is a deliverable that is subject to approval bythe project sponsor or customer.
Dependency. See logical relationship.Dummy Activity. An activity of zero duration used to show a logical relationship in the arrow
diagramming method. Dummy activities are used when logical relationships cannotbe completely or correctly described with regular activity arrows. Dummies are showngraphically as a dashed line headed by an arrow.
Duration (DU). The number of work periods (not including holidays or other nonworkingperiods) required to complete an activity or other project element. Usually expressedas workdays or workweeks. Sometimes incorrectly equated with elapsed time. Seealso effort.
Duration Compression. Shortening the project schedule without reducing the projectscope. Duration compression is not always possible and often requires an increase inproject cost.
A Guide to the Project Management Body of Knowledge (PMBOK® Guide) 2000 Edition©2000 Project Management Institute, Four Campus Boulevard, Newtown Square, PA 19073-3299 USA
d to: Old Dominion University. Downloaded on September 15,2010 at 18:15:01 UTC from IEEE Xplore. Restrictions apply.

Glossary
A Guide to the Project Management©2000 Project Management Institu
Authorized licensed use limited
Early Finish Date (EF). In the critical path method, the earliest possible point in time onwhich the uncompleted portions of an activity (or the project) can finish, based on thenetwork logic and any schedule constraints. Early finish dates can change as theproject progresses and changes are made to the project plan.
Early Start Date (ES). In the critical path method, the earliest possible point in time onwhich the uncompleted portions of an activity (or the project) can start, based on thenetwork logic and any schedule constraints. Early start dates can change as theproject progresses and changes are made to the project plan.
Earned Value (EV). The physical work accomplished plus the authorized budget for thiswork. The sum of the approved cost estimates (may include overhead allocation) foractivities (or portions of activities) completed during a given period (usually project-to-date). Previously called the budgeted cost of work performed (BCWP) for an activityor group of activities.
Earned Value Management (EVM). A method for integrating scope, schedule, andresources, and for measuring project performance. It compares the amount of workthat was planned with what was actually earned with what was actually spent todetermine if cost and schedule performance are as planned.
Effort. The number of labor units required to complete an activity or other project element.Usually expressed as staff hours, staff days, or staff weeks. Should not be confusedwith duration.
Element. One of the parts, substances, or principles that make up a compound or complexwhole.
Estimate. An assessment of the likely quantitative result. Usually applied to project costsand durations and should always include some indication of accuracy (e.g., ±x per-cent). Usually used with a modifier (e.g., preliminary, conceptual, feasibility). Someapplication areas have specific modifiers that imply particular accuracy ranges (e.g.,order-of-magnitude estimate, budget estimate, and definitive estimate in engineeringand construction projects).
Estimate at Completion (EAC). The expected total cost of an activity, a group of activities,or the project when the defined scope of work has been completed. Most techniquesfor forecasting EAC include some adjustment of the original cost estimate, based onactual project performance to date.
Estimate to Complete (ETC). The expected additional cost needed to complete an activity,a group of activities, or the project. Most techniques for forecasting ETC include someadjustment to the original estimate, based on project performance to date. Alsocalled “estimated to complete.” See also earned value and estimate at completion.
Event-on-Node. A network diagramming technique in which events are represented byboxes (or nodes) connected by arrows to show the sequence in which the events areto occur. Used in the original program evaluation and review technique.
Exception Report. Document that includes only major variations from plan (rather than allvariations).
Fast Tracking. Compressing the project schedule by overlapping activities that would nor-mally be done in sequence, such as design and construction.
Finish Date. A point in time associated with an activity’s completion. Usually qualified byone of the following: actual, planned, estimated, scheduled, early, late, baseline,target, or current.
Finish-to-Finish (FF). See logical relationship.Finish-to-Start (FS). See logical relationship.Firm Fixed-Price (FFP) Contract. A type of contract where the buyer pays the seller a set
amount (as defined by the contract), regardless of the seller’s costs.Fixed-Price Contract. See firm fixed-price contract.Fixed-Price-Incentive-Fee (FPIF) Contract. A type of contract where the buyer pays the
seller a set amount (as defined by the contract), and the seller can earn an additionalamount if it meets defined performance criteria.
Body of Knowledge (PMBOK® Guide) 2000 Editionte, Four Campus Boulevard, Newtown Square, PA 19073-3299 USA 201
to: Old Dominion University. Downloaded on September 15,2010 at 18:15:01 UTC from IEEE Xplore. Restrictions apply.

Glossary
202
Floa
t|
Ove
rlap
Authorized licensed use limited t
Float. The amount of time that an activity may be delayed from its early start withoutdelaying the project finish date. Float is a mathematical calculation, and can changeas the project progresses and changes are made to the project plan. Also calledslack, total float, and path float. See also free float.
Forecast Final Cost. See estimate at completion.Forward Pass. The calculation of the early start and early finish dates for the uncompleted
portions of all network activities. See also network analysis and backward pass.Fragnet. See subnet.Free Float (FF). The amount of time that an activity can be delayed without delaying the
early start of any immediately following activities. See also float.Functional Manager. A manager responsible for activities in a specialized department or
function (e.g., engineering, manufacturing, marketing).Functional Organization. An organization structure in which staff are grouped hierarchically
by specialty (e.g., production, marketing, engineering, and accounting at the top level;with engineering, further divided into mechanical, electrical, and others).
Gantt Chart. See bar chart.Grade. A category or rank used to distinguish items that have the same functional use (e.g.,
“hammer”), but do not share the same requirements for quality (e.g., different ham-mers may need to withstand different amounts of force).
Graphical Evaluation and Review Technique (GERT). A network analysis technique thatallows for conditional and probabilistic treatment of logical relationships (i.e., someactivities may not be performed).
Hammock. An aggregate or summary activity (a group of related activities is shown as oneand reported at a summary level). A hammock may or may not have an internalsequence. See also subproject and subnet.
Hanger. An unintended break in a network path. Hangers are usually caused by missingactivities or missing logical relationships.
Information Distribution. Making needed information available to project stakeholders ina timely manner.
Initiation. Authorizing the project or phase.Integrated Change Control. Coordinating changes across the entire project.Integrated Cost/Schedule Reporting. See earned value.Invitation for Bid (IFB). Generally, this term is equivalent to request for proposal. However,
in some application areas, it may have a narrower or more specific meaning.Key Event Schedule. See master schedule.Lag. A modification of a logical relationship that directs a delay in the successor task. For
example, in a finish-to-start dependency with a ten-day lag, the successor activitycannot start until ten days after the predecessor has finished. See also lead.
Late Finish Date (LF). In the critical path method, the latest possible point in time thatan activity may be completed without delaying a specified milestone (usually theproject finish date).
Late Start Date (LS). In the critical path method, the latest possible point in time that anactivity may begin without delaying a specified milestone (usually the project finishdate).
Lead. A modification of a logical relationship that allows an acceleration of the successortask. For example, in a finish-to-start dependency with a ten-day lead, the successoractivity can start ten days before the predecessor has finished. See also lag.
Lessons Learned. The learning gained from the process of performing the project. Lessonslearned may be identified at any point. Also considered a project record.
Level of Effort (LOE). Support-type activity (e.g., vendor or customer liaison) that does notreadily lend itself to measurement of discrete accomplishment. It is generally char-acterized by a uniform rate of activity over a period of time determined by the activi-ties it supports.
Leveling. See resource leveling.
A Guide to the Project Management Body of Knowledge (PMBOK® Guide) 2000 Edition©2000 Project Management Institute, Four Campus Boulevard, Newtown Square, PA 19073-3299 USA
o: Old Dominion University. Downloaded on September 15,2010 at 18:15:01 UTC from IEEE Xplore. Restrictions apply.

Glossary
A Guide to the Project Management B©2000 Project Management Institute
Authorized licensed use limited t
Life-Cycle Costing. The concept of including acquisition, operating, and disposal costswhen evaluating various alternatives.
Line Manager. 1) The manager of any group that actually makes a product or performs aservice. 2) A functional manager.
Link. See logical relationship.Logic. See network logic.Logic Diagram. See project network diagram.Logical Relationship. A dependency between two project activities, or between a project
activity and a milestone. See also precedence relationship. The four possible types oflogical relationships are:■ Finish-to-start—the initiation of work of the successor depends upon the comple-
tion of work of the predecessor.■ Finish-to-finish—the completion of the work of the successor cannot finish until
the completion of work of the predecessor.■ Start-to-start—the initiation of work of the successor depends upon the initiation
of the work of the predecessor.■ Start-to-finish—the completion of the successor is dependent upon the initiation
of the predecessor.Loop. A network path that passes the same node twice. Loops cannot be analyzed using
traditional network analysis techniques such as critical path method and programevaluation and review technique. Loops are allowed in graphical evaluation and reviewtechnique.
Master Schedule. A summary-level schedule that identifies the major activities and keymilestones. See also milestone schedule.
Mathematical Analysis. See network analysis.Matrix Organization. Any organizational structure in which the project manager shares
responsibility with the functional managers for assigning priorities and for directing thework of individuals assigned to the project.
Milestone. A significant event in the project, usually completion of a major deliverable.Milestone Schedule. A summary-level schedule that identifies the major milestones. See
also master schedule.Mitigation. See risk mitigation.Monitoring. The capture, analysis, and reporting of project performance, usually as com-
pared to plan.Monte Carlo Analysis. A technique that performs a project simulation many times to cal-
culate a distribution of likely results. See simulation.Near-Critical Activity. An activity that has low total float.Network. See project network diagram.Network Analysis. The process of identifying early and late start and finish dates for the
uncompleted portions of project activities. See also critical path method, programevaluation and review technique, and graphical evaluation and review technique.
Network Logic. The collection of activity dependencies that makes up a project networkdiagram.
Network Path. Any continuous series of connected activities in a project network diagram.Node. One of the defining points of a network; a junction point joined to some or all of the
other dependency lines. See also arrow diagramming method and precedence dia-gramming method.
Order-of-Magnitude Estimate. See estimate.Organizational Breakdown Structure (OBS). A depiction of the project organization
arranged so as to relate work packages to organizational units.Organizational Planning. Identifying, documenting, and assigning project roles, responsi-
bilities, and reporting relationships.Overlap. See lead.
ody of Knowledge (PMBOK® Guide) 2000 Edition, Four Campus Boulevard, Newtown Square, PA 19073-3299 USA 203
o: Old Dominion University. Downloaded on September 15,2010 at 18:15:01 UTC from IEEE Xplore. Restrictions apply.

Glossary
204
Para
met
ric E
stim
atin
g|
Proj
ect
Qua
lity
Man
agem
ent
Authorized licensed use limited to
Parametric Estimating. An estimating technique that uses a statistical relationshipbetween historical data and other variables (e.g., square footage in construction, linesof code in software development) to calculate an estimate.
Pareto Diagram. A histogram, ordered by frequency of occurrence, that shows how manyresults were generated by each identified cause.
Path. A set of sequentially connected activities in a project network diagram.Path Convergence. The node in the schedule where parallel paths merge or join. At that
node, delays or elongation or any converging path can delay the project. In quanti-tative risk analysis of a schedule, significant risk may occur at this point.
Path Float. See float.Percent Complete (PC). An estimate, expressed as a percent, of the amount of work that
has been completed on an activity or a group of activities.Performance Measurement Baseline. An approved plan against which deviations are
compared for management control.Performance Reporting. Collecting and disseminating performance information. This
includes status reporting, progress measurement, and forecasting.Performing Organization. The enterprise whose employees are most directly involved in
doing the work of the project.PERT Chart. The term is commonly used to refer to a project network diagram. See program
evaluation and review technique for the traditional definition of PERT.Phase. See project phase.Planned Finish Date (PF). See scheduled finish date.Planned Start Date (PS). See scheduled start date.Planned Value (PV). The physical work scheduled, plus the authorized budget to accom-
plish the scheduled work. Previously, this was called the budgeted costs for workscheduled (BCWS).
Precedence Diagramming Method (PDM). A network diagramming technique in whichactivities are represented by boxes (or nodes). Activities are linked by precedencerelationships to show the sequence in which the activities are to be performed.
Precedence Relationship. The term used in the precedence diagramming method for alogical relationship. In current usage, however, precedence relationship, logical rela-tionship, and dependency are widely used interchangeably, regardless of the dia-gramming method in use.
Predecessor Activity. 1) In the arrow diagramming method, the activity that enters a node.2) In the precedence diagramming method, the “from” activity.
Probability and Impact Matrix. A common way to determine whether a risk is consideredlow, moderate, or high by combining the two dimensions of a risk, its probability ofoccurrence, and its impact on objectives if it occurs.
Procurement Planning. Determining what to procure and when.Product Scope. The features and functions that characterize a product or service.Program. A group of related projects managed in a coordinated way. Programs usually
include an element of ongoing work.Program Evaluation and Review Technique (PERT). An event-oriented network analysis
technique used to estimate program duration when there is uncertainty in the indi-vidual activity duration estimates. PERT applies the critical path method using dura-tions that are computed by a weighted average of optimistic, pessimistic, and mostlikely duration estimates. PERT computes the standard deviation of the completiondate from those of the path’s activity durations. Also known as the Method ofMoments Analysis.
Project. A temporary endeavor undertaken to create a unique product, service, or result.Project Charter. A document issued by senior management that formally authorizes the
existence of a project. And it provides the project manager with the authority to applyorganizational resources to project activities.
A Guide to the Project Management Body of Knowledge (PMBOK® Guide) 2000 Edition©2000 Project Management Institute, Four Campus Boulevard, Newtown Square, PA 19073-3299 USA
: Old Dominion University. Downloaded on September 15,2010 at 18:15:01 UTC from IEEE Xplore. Restrictions apply.

Glossary
A Guide to the Project Management©2000 Project Management Institu
Authorized licensed use limited
Project Communications Management. A subset of project management that includesthe processes required to ensure timely and appropriate generation, collection anddissemination, storage and ultimate disposition of project information. It consists ofcommunications planning, information distribution, performance reporting, and admin-istrative closure.
Project Cost Management. A subset of project management that includes the processesrequired to ensure that the project is completed within the approved budget. It con-sists of resource planning, cost estimating, cost budgeting, and cost control.
Project Human Resource Management. A subset of project management that includes theprocesses required to make the most effective use of the people involved with theproject. It consists of organizational planning, staff acquisition, and team development.
Project Integration Management. A subset of project management that includes theprocesses required to ensure that the various elements of the project are properlycoordinated. It consists of project plan development, project plan execution, and inte-grated change control.
Project Life Cycle. A collection of generally sequential project phases whose name andnumber are determined by the control needs of the organization or organizationsinvolved in the project.
Project Management (PM). The application of knowledge, skills, tools, and techniques toproject activities to meet the project requirements.
Project Management Body of Knowledge (PMBOK®). An inclusive term that describesthe sum of knowledge within the profession of project management. As with otherprofessions—such as law, medicine, and accounting—the body of knowledge restswith the practitioners and academics that apply and advance it. The PMBOK®
includes proven, traditional practices that are widely applied, as well as innovative andadvanced ones that have seen more limited use.
Project Management Professional (PMP®). An individual certified as such by the ProjectManagement Institute (PMI®).
Project Management Software. A class of computer applications specifically designed toaid with planning and controlling project costs and schedules.
Project Management Team. The members of the project team who are directly involved inproject management activities. On some smaller projects, the project managementteam may include virtually all of the project team members.
Project Manager (PM). The individual responsible for managing a project.Project Network Diagram. Any schematic display of the logical relationships of project
activities. Always drawn from left to right to reflect project chronology. Often referredto as a PERT chart.
Project Phase. A collection of logically related project activities, usually culminating in thecompletion of a major deliverable.
Project Plan. A formal, approved document used to guide both project execution andproject control. The primary uses of the project plan are to document planningassumptions and decisions, facilitate communication among stakeholders, and doc-ument approved scope, cost, and schedule baselines. A project plan may be sum-mary or detailed.
Project Plan Development. Integrating and coordinating all project plans to create a con-sistent, coherent document.
Project Plan Execution. Carrying out the project plan by performing the activities includedtherein.
Project Planning. The development and maintenance of the project plan.Project Procurement Management. A subset of project management that includes the
processes required to acquire goods and services to attain project scope from outsidethe performing organization. It consists of procurement planning, solicitation planning,solicitation, source selection, contract administration, and contract closeout.
Project Quality Management. A subset of project management that includes the processesrequired to ensure that the project will satisfy the needs for which it was undertaken.It consists of quality planning, quality assurance, and quality control.
Body of Knowledge (PMBOK® Guide) 2000 Editionte, Four Campus Boulevard, Newtown Square, PA 19073-3299 USA 205
to: Old Dominion University. Downloaded on September 15,2010 at 18:15:01 UTC from IEEE Xplore. Restrictions apply.

Glossary
206
Proj
ect
Ris
k M
anag
emen
t|
Sche
dule
Com
pres
sion
Authorized licensed use limited t
Project Risk Management. Risk management is the systematic process of identifying, ana-lyzing, and responding to project risk. It includes maximizing the probability and con-sequences of positive events and minimizing the probability and consequences ofevents adverse to project objectives. It includes the processes of risk managementplanning, risk identification, qualitative risk analysis, quantitative risk analysis, riskresponse planning, and risk monitoring and control.
Project Schedule. The planned dates for performing activities and the planned dates formeeting milestones.
Project Scope. The work that must be done to deliver a product with the specified featuresand functions.
Project Scope Management. A subset of project management that includes the processesrequired to ensure that the project includes all of the work required, and only the workrequired, to complete the project successfully. It consists of initiation, scope planning,scope definition, scope verification, and scope change control.
Project Team Members. The people who report either directly or indirectly to the projectmanager.
Project Time Management. A subset of project management that includes the processesrequired to ensure timely completion of the project. It consists of activity definition,activity sequencing, activity duration estimating, schedule development, and schedulecontrol.
Projectized Organization. Any organizational structure in which the project manager hasfull authority to assign priorities and to direct the work of individuals assigned to theproject.
Qualitative Risk Analysis. Performing a qualitative analysis of risks and conditions to pri-oritize their effects on project objectives. It involves assessing the probability andimpact of project risk(s) and using methods such as the probability and impact matrixto classify risks into categories of high, moderate, and low for prioritized risk responseplanning.
Quantitative Risk Analysis. Measuring the probability and consequences of risks and esti-mating their implications for project objectives. Risks are characterized by probabilitydistributions of possible outcomes. This process uses quantitative techniques such assimulation and decision tree analysis.
Quality Assurance (QA). 1) The process of evaluating overall project performance on a reg-ular basis to provide confidence that the project will satisfy the relevant quality stan-dards. 2) The organizational unit that is assigned responsibility for quality assurance.
Quality Control (QC). 1) The process of monitoring specific project results to determine ifthey comply with relevant quality standards and identifying ways to eliminate causesof unsatisfactory performance. 2) The organizational unit that is assigned responsi-bility for quality control.
Quality Planning. Identifying which quality standards are relevant to the project, and deter-mining how to satisfy them.
Remaining Duration (RDU). The time needed to complete an activity.Request for Proposal (RFP). A type of bid document used to solicit proposals from
prospective sellers of products or services. In some application areas, it may have anarrower or more specific meaning.
Request for Quotation (RFQ). Generally, this term is equivalent to request for proposal.However, in some application areas, it may have a narrower or more specific meaning.
Reserve. A provision in the project plan to mitigate cost and/or schedule risk. Often usedwith a modifier (e.g., management reserve, contingency reserve) to provide furtherdetail on what types of risk are meant to be mitigated. The specific meaning of themodified term varies by application area.
Residual Risk. A risk that remains after risk responses have been implemented.Resource Leveling. Any form of network analysis in which scheduling decisions (start and
finish dates) are driven by resource management concerns (e.g., limited resourceavailability or difficult-to-manage changes in resource levels).
A Guide to the Project Management Body of Knowledge (PMBOK® Guide) 2000 Edition©2000 Project Management Institute, Four Campus Boulevard, Newtown Square, PA 19073-3299 USA
o: Old Dominion University. Downloaded on September 15,2010 at 18:15:01 UTC from IEEE Xplore. Restrictions apply.

Glossary
A Guide to the Project Managemen©2000 Project Management Institu
Authorized licensed use limite
Resource-Limited Schedule. A project schedule whose start and finish dates reflectexpected resource availability. The final project schedule should always be resourcelimited.
Resource Planning. Determining what resources (people, equipment, materials) areneeded in what quantities to perform project activities.
Responsibility Assignment Matrix (RAM). A structure that relates the project organizationstructure to the work breakdown structure to help ensure that each element of theproject’s scope of work is assigned to a responsible individual.
Responsibility Chart. See responsibility assignment matrix.Responsibility Matrix. See responsibility assignment matrix.Retainage. A portion of a contract payment that is held until contract completion to ensure
full performance of the contract terms.Rework. Action taken to bring a defective or nonconforming item into compliance with
requirements or specifications.Risk. An uncertain event or condition that, if it occurs, has a positive or negative effect on
a project’s objectives.Risk Acceptance. This technique of the risk response planning process indicates that the
project team has decided not to change the project plan to deal with a risk, or isunable to identify any other suitable response strategy.
Risk Avoidance. Risk avoidance is changing the project plan to eliminate the risk or to pro-tect the project objectives from its impact. It is a tool of the risk response planningprocess.
Risk Category. A source of potential risk reflecting technical, project management, orga-nizational, or external sources.
Risk Database. A repository that provides for collection, maintenance, and analysis of datagathered and used in the risk management processes. A lessons-learned programuses a risk database. This is an output of the risk monitoring and control process.
Risk Event. A discrete occurrence that may affect the project for better or worse.Risk Identification. Determining which risks might affect the project and documenting their
characteristics. Tools used include brainstorming and checklists.Risk Management Plan. Documents how the risk processes will be carried out during the
project. This is the output of risk management planning.Risk Management Planning. Deciding how to approach and plan risk management activ-
ities for a project.Risk Mitigation. Risk mitigation seeks to reduce the probability and/or impact of a risk to
below an acceptable threshold.Risk Monitoring and Control. Monitoring residual risks, identifying new risks, executing risk
reduction plans, and evaluating their effectiveness throughout the project life cycle.Risk Register. See risk response plan.Risk Response Plan. A document detailing all identified risks, including description, cause,
probability of occurring, impact(s) on objectives, proposed responses, owners, andcurrent status. Also known as risk register.
Risk Response Planning. Developing procedures and techniques to enhance opportunitiesand reduce threats to the project’s objectives. The tools include avoidance, mitiga-tion, transference, and acceptance.
Risk Transference. Risk transference is seeking to shift the impact of a risk to a third partytogether with ownership of the response.
S-Curve. Graphic display of cumulative costs, labor hours, percentage of work, or otherquantities, plotted against time. The name derives from the S-like shape of the curve(flatter at the beginning and end, steeper in the middle) produced on a project thatstarts slowly, accelerates, and then tails off. Also a term for the cumulative likelihooddistribution that is a result of a simulation, a tool of quantitative risk analysis.
Schedule. See project schedule.Schedule Analysis. See network analysis.Schedule Compression. See duration compression.
t Body of Knowledge (PMBOK® Guide) 2000 Editionte, Four Campus Boulevard, Newtown Square, PA 19073-3299 USA 207
d to: Old Dominion University. Downloaded on September 15,2010 at 18:15:01 UTC from IEEE Xplore. Restrictions apply.

Glossary
208
Sche
dule
Con
trol
|W
ork
Pack
age
Authorized licensed use limited t
Schedule Control. Controlling changes to the project schedule.Schedule Development. Analyzing activity sequences, activity durations, and resource
requirements to create the project schedule.Schedule Performance Index (SPI). The schedule efficiency ratio of earned value accom-
plished against the planned value. The SPI describes what portion of the plannedschedule was actually accomplished. The SPI = EV divided by PV.
Schedule Variance (SV). 1) Any difference between the scheduled completion of an activityand the actual completion of that activity. 2) In earned value, EV less BCWS = SV.
Scheduled Finish Date (SF). The point in time that work was scheduled to finish on anactivity. The scheduled finish date is normally within the range of dates delimited bythe early finish date and the late finish date. It may reflect leveling or scarceresources.
Scheduled Start Date (SS). The point in time that work was scheduled to start on anactivity. The scheduled start date is normally within the range of dates delimited bythe early start date and the late start date. It may reflect leveling of scarce resources.
Scope. The sum of the products and services to be provided as a project. See project scopeand product scope.
Scope Baseline. See baseline.Scope Change. Any change to the project scope. A scope change almost always requires
an adjustment to the project cost or schedule.Scope Change Control. Controlling changes to project scope.Scope Definition. Subdividing the major deliverables into smaller, more manageable com-
ponents to provide better control.Scope Planning. The process of progressively elaborating the work of the project, which
includes developing a written scope statement that includes the project justification,the major deliverables, and the project objectives.
Scope Statement. The scope statement provides a documented basis for making futureproject decisions and for confirming or developing common understanding of projectscope among the stakeholders. As the project progresses, the scope statement mayneed to be revised or refined to reflect approved changes to the scope of the project.
Scope Verification. Formalizing acceptance of the project scope.Secondary Risk. A risk that arises as a direct result of implementing a risk response.Seller. The provider of goods or services to an organization.Should-Cost Estimate. An estimate of the cost of a product or service used to provide an
assessment of the reasonableness of a prospective contractor’s proposed cost.Simulation. A simulation uses a project model that translates the uncertainties specified at
a detailed level into their potential impact on objectives that are expressed at the levelof the total project. Project simulations use computer models and estimates of risk ata detailed level, and are typically performed using the Monte Carlo technique.
Slack. Term used in arrow diagramming method for float.Solicitation. Obtaining quotations, bids, offers, or proposals as appropriate.Solicitation Planning. Documenting product requirements and identifying potential
sources.Source Selection. Choosing from among potential sellers.Staff Acquisition. Getting needed human resources assigned to and working on the project.Stakeholder. Individuals and organizations that are actively involved in the project, or whose
interests may be positively or negatively affected as a result of project execution orproject completion. They may also exert influence over the project and its results.
Start Date. A point in time associated with an activity’s start, usually qualified by one of the fol-lowing: actual, planned, estimated, scheduled, early, late, target, baseline, or current.
Start-to-Finish (SF). See logical relationship.Start-to-Start (SS). See logical relationship.Statement of Work (SOW). A narrative description of products or services to be supplied
under contract.
A Guide to the Project Management Body of Knowledge (PMBOK® Guide) 2000 Edition©2000 Project Management Institute, Four Campus Boulevard, Newtown Square, PA 19073-3299 USA
o: Old Dominion University. Downloaded on September 15,2010 at 18:15:01 UTC from IEEE Xplore. Restrictions apply.

Glossary
A Guide to the Project Management B©2000 Project Management Institute
Authorized licensed use limited t
Subnet. A subdivision of a project network diagram, usually representing some form of sub-project.
Subnetwork. See subnet.Subproject. A smaller portion of the overall project.Successor Activity. 1) In the arrow diagramming method, the activity that departs a node.
2) In the precedence diagramming method, the “to” activity.Target Completion Date (TC). An imposed date that constrains or otherwise modifies the
network analysis.Target Finish Date (TF). The date that work is planned (targeted) to finish on an activity.Target Schedule. See baseline.Target Start Date (TS). The date that work is planned (targeted) to start on an activity.Task. A generic term for work that is not included in the work breakdown structure, but
potentially could be a further decomposition of work by the individuals responsible forthat work. Also, lowest level of effort on a project.
Team Development. Developing individual and group competencies to enhance project per-formance.
Team Members. See project team members.Technical Performance Measurement. Technical performance measurement compares
technical accomplishments during project execution to the project plan’s schedule oftechnical achievement.
Time-Scaled Network Diagram. Any project network diagram drawn in such a way that thepositioning and length of the activity represent its duration. Essentially, it is a bar chartthat includes network logic.
Total Float (TF). See float.Total Quality Management (TQM). A common approach to implementing a quality
improvement program within an organization.Transferrence. See risk transferrence.Triggers. Triggers, sometimes called risk symptoms or warning signs, are indications that
a risk has occurred or is about to occur. Triggers may be discovered in the risk iden-tification process and watched in the risk monitoring and control process.
Value Engineering (VE). Value engineering is a creative approach used to optimize life-cyclecosts, save time, increase profits, improve quality, expand market share, solve prob-lems, and/or use resources more effectively.
Workaround. A response to a negative risk event. Distinguished from contingency plan inthat a workaround is not planned in advance of the occurrence of the risk event.
Work Breakdown Structure (WBS). A deliverable-oriented grouping of project elementsthat organizes and defines the total work scope of the project. Each descending levelrepresents an increasingly detailed definition of the project work.
Work Item. Term no longer in common usage. Synonymous with activity—see activity.Work Package. A deliverable at the lowest level of the work breakdown structure, when that
deliverable may be assigned to another project manager to plan and execute. Thismay be accomplished through the use of a subproject where the work package maybe further decomposed into activities.
ody of Knowledge (PMBOK® Guide) 2000 Edition, Four Campus Boulevard, Newtown Square, PA 19073-3299 USA 209
o: Old Dominion University. Downloaded on September 15,2010 at 18:15:01 UTC from IEEE Xplore. Restrictions apply.

A Guide to the Project Management Body of Knowledge (PMBOK® Guide) 2000 Edition©2000 Project Management Institute, Four Campus Boulevard, Newtown Square, PA 19073-3299 USA 211
AAC See actual cost (AC)AD See activity description (AD)ACWP See actual cost of work performed (ACWP)ADM See arrow diagramming method (ADM)AF See actual finish date (AF)AOA See activity-on-arrow (AOA)AON See activity-on-node (AON)AS See actual start date (AS)activity 14, 36, 47, 68–69, 71–75, 77–78, 80–81,
87–88, 100–01, 103, 123, 170, 197–204, 206,208–09critical 76, 80, 200definition 7, 34, 65, 67, 71, 190, 197, 206description (AD) 196–97dummy 200duration(s) 34, 65, 67, 72–73, 75, 190, 198,
204, 208predecessor 204successor 74, 202, 209
estimate(s) 73–75, 80, 86–87, 204See also estimate(s)estimating 7, 34, 65, 71–73, 190, 197, 206See also estimate(s)
list 60, 67–68, 71, 73sequencing 7, 34, 49, 65, 68–70, 190, 197,
206, 208activity-on-arrow (AOA) 70, 196–97activity-on-node (AON) 69, 196–97actual cost (AC) 88, 92, 123, 196–97, 200
of work performed (ACWP) 123, 196–97, 200actual finish date (AF) 196–97actual start date (AS) 196–97administrative closure 8, 37, 117, 125, 158–59,
191, 197, 205application area(s) 4, 13, 30, 43, 46, 51, 56,
62, 68–69, 78, 89, 98, 110–11, 125, 131,147, 161, 181–82, 195, 198, 206
arrow 198, 200diagramming method (ADM) 70, 196–98, 200,
203–04, 208–09as-of date 198, 200
BBAC See budget at completion (BAC)BCWP See budgeted cost of work performed
(BCWP)BCWS See budgeted cost of work scheduled
(BCWS)backward pass 198, 200, 202bar chart 78, 124, 198, 202, 209baseline 43, 45–49, 57, 63–64, 72, 122, 139,
145, 168, 198, 201, 208–09.See also finish date, scope baseline, start date,
and target schedulecost 45, 89–92, 198performance measurement 44–47, 198, 204schedule 45, 79, 198, 205
budget at completion (BAC) 92, 196, 198, 200budget estimate 198, 201budgeted cost of work performed (BCWP) 92,
123, 196, 198, 201budgeted cost of work scheduled (BCWS) 92,
123, 196, 198, 204, 208
CCAP See control account plan (CAP)CCB See change control board (CCB)CPFF See contract, cost-plus-fixed-fee (CPFF)CPI See cost performance index (CPI)CPIF See contract, cost-plus-incentive-fee (CPIF)CPM See critical path method (CPM)CV See cost variance (CV)calendar unit 198change control board (CCB) 49, 196, 198change control system 48–49, 80, 91, 158
See also integrated change control and scopechange control
chart of accounts 87, 198–99charter See project chartercode of accounts 198–99communications planning 8, 34, 109, 117, 119,
120, 191, 199, 205contingencies 45, 199
Index
Authorized licensed use limited to: Old Dominion University. Downloaded on September 15,2010 at 18:15:01 UTC from IEEE Xplore. Restrictions apply.

contingency 73, 75, 88, 90, 129, 143–44allowance 143, 199planning 199plans 41, 63, 88, 143–44, 146, 209reserve 78, 137, 144, 199, 206
contract(s) 6, 14, 25, 43–44, 47, 54–55, 57, 63,74, 86, 120, 125, 150–51, 153–59, 169, 171,173, 181, 199–201, 207–08administration 8, 35, 147, 156–59, 191, 199,
205changes 158–59cost-plus-fixed-fee (CPFF) 196, 200, 212cost-plus-incentive-fee (CPIF) 196, 200, 212cost-reimbursable 151, 199closeout 8, 37, 147, 149, 151, 158–59, 191,
199, 205documentation 159firm fixed-price (FFP) 196, 201fixed-price or lump-sum 142, 151, 199, 201fixed-price-incentive-fee (FPIF) 196, 201, 212negotiation 155–56time and material 199
control 11–12, 36, 42–43, 45–47, 49, 57, 59,62–63, 67, 79–80, 85, 88–89, 91, 102–03,115, 124, 130, 144–45, 149, 157, 170,204–05, 208See also change control board (CCB), change con-
trol system, cost control, integrated changecontrol, quality control(QC), risk monitoring andcontrol,schedule control, and scope control
account plan (CAP) 42, 92, 196, 199charts 103, 199
corrective action 30, 46, 49, 63–64, 80–81,91–93, 102–03, 144, 146, 199
cost baseline See baseline, costcost budgeting 7, 34, 83, 85, 89–90, 190, 199,
205cost control 7, 36, 62, 83, 90–93, 190, 199,
205cost estimating 7, 34, 73, 83, 85–88, 190, 199,
205cost of quality 99, 200cost performance index (CPI) 92, 123, 196, 200cost variance (CV) 89, 91–92, 123, 196, 200cost-plus-fixed-fee (CPFF) contract See,
contract, cost-plus-fixed-fee (CPFF)cost-plus-incentive-free (CPIF) contract See,
contract, cost-plus-incentive-fee (CPIF)cost-reimbursable contract See contract, cost-
reimbursablecrashing 75, 200critical activity See activity, criticalcritical path 9, 76–77, 80, 200
method (CPM) 26, 75, 195–96, 200–04current finish date 200current start date 200
DDD See data date (DD)DU See duration (DU)data date (DD) 196, 198, 200decision tree analysis 139, 200, 206definitive estimate 200–01deliverable(s) 11–13, 34, 44–45, 47, 51,
55–58–63, 65, 67–68, 74, 78, 85, 98, 100,102, 123, 126, 147, 157, 189–90, 197, 200,203, 205, 208–09
dependency 74, 127, 200, 202–04dummy activity See activity, dummyduration (DU) 4–5, 44, 57–58, 71–73, 75–76,
78, 81, 86, 99, 138–39, 196–98, 200–01,204, 209compression 75, 200, 207
EEAC See estimate at completion (EAC)EF See early finish date (EF)ES See early start date (ES)ETC See estimate to complete (ETC)EV See earned value (EV)EVM See earned value management (EVM)early finish date (EF) 196, 200–02, 208early start date (ES) 195–96, 201, 208earned value (EV) 41, 49, 92, 123–24, 145,
196–98, 200–02, 208analysis 123, 145management (EVM) 41–42, 44, 60, 91–92,
196, 201effort 10, 13, 32, 37, 41, 44–45, 49, 51, 65, 67,
73, 83, 95, 104, 107, 117, 147, 149, 153–54,200–01
estimate(s) 34, 71–73, 75, 83, 86, 88–90, 92,123, 138, 190, 198–201, 203–04, 208See also activity estimate(s), activity estimating,
order-of-magnitude estimate, and parametricestimating
at completion (EAC) 92–93, 196, 201–02to complete (ETC) 92, 196, 201
event-on-node 201exception report 195, 201expected value 75, 139
FFF See finish-to-finish (FF)FFP See contract, firm fixed-price (FFP)FPIF See contract, fixed-price-incentive-fee (FPIF)FS See finish-to-start (FS)fast tracking 12, 75, 201
A Guide to the Project Management Body of Knowledge (PMBOK® Guide) 2000 Edition©2000 Project Management Institute, Four Campus Boulevard, Newtown Square, PA 19073-3299 USA
Index
212
Cont
inge
ncy
|O
verla
p
Authorized licensed use limited to: Old Dominion University. Downloaded on September 15,2010 at 18:15:01 UTC from IEEE Xplore. Restrictions apply.

finish date 36, 45, 73, 75, 77, 80, 90, 198,201–03, 206–07See also actual finish date (AF), current finish date,
early finish date (EF), late finish date (LF),planned finish date (PF), scheduled finish date(SF), target completion date (TC), and targetfinish date (TC)
finish-to-finish (FF) 69, 196, 201, 202–03finish-to-start (FS) 69–70, 74, 196, 201–03firm fixed-price (FFP) contract See contract, firm-
fixed-price (FFP)fixed-price contract See contract, fixed-pricefixed-price-incentive-fee (FPIF) contract See
contract, fixed-price-incentive-fee (FPIF)float 75, 80, 200, 202, 204, 208–09
See also free float and total floatforward pass 198, 200, 202fragnet 70, 202free float 196, 202functional manager 4, 18, 25, 113–14, 202–03functional organization 19–20, 170, 202
GGERT See graphical evaluation and review
technique (GERT)Gantt chart 78, 124, 198, 202grade 96, 202graphical evaluation and review technique (GERT)
70, 75, 196, 202–03Guide to the Project Management Body of Knowledge,
A (PMBOK® Guide) See PMBOK® Guide
Hhammock 70, 202hanger 202
IIFB See invitation for bid (IFB)information distribution 8, 35, 98, 117, 121–23,
191, 202, 205initiation 7, 30, 32, 41, 44, 51, 53–54, 69, 136,
189, 202–03, 206integrated change control 7, 36, 41, 47–49, 63,
79–80, 91, 102, 104, 146, 158, 189, 202, 205invitation for bid (IFB) 153, 196, 202
Kknowledge area(s) 7, 36, 41, 43, 45, 47, 51,
57, 65, 76, 83, 95, 98, 107, 117, 127, 144,147, 168–71, 195
LLF See late finish date (LF)LOE See level of effort (LOE)LS See late start date (LS)lag 26, 74, 202late finish date (LF) 196, 198, 202, 208late start date (LS) 196, 202, 208lead 74, 119, 130, 134, 136, 138, 202–03level of effort (LOE) 196, 202, 209leveling 202, 208life-cycle costing 83, 203line manager 203link 12, 115, 203logic 11, 15, 68–69, 75, 77, 138, 203
See also network logiclogic diagram 203logical relationship 69, 200–04, 208loop 46, 203lump-sum contract See contract, lump-sum
Mmaster schedule 77, 202–03mathematical analysis 75–77, 203milestone 13, 69, 78, 145, 202–03mitigation 142–43, 203, 207monitoring 30, 36, 80, 91, 95, 102, 127, 130,
144–45, 190–91, 203, 206–07Monte Carlo analysis 44, 75, 203
Nnear-critical activity 80, 203network 70, 75, 170, 198, 201–04
analysis 198, 200, 202–04, 206–07, 209logic 69–70, 75, 198, 201, 203, 209path 202–03
node 69–70, 198, 201, 203–04, 209See also activity-on-node (AON)
OOBS See organizational breakdown structure (OBS)order-of-magnitude estimate 201, 203organizational breakdown structure (OBS) 61,
111, 196, 203organizational planning 7, 19, 34, 107–11, 119,
190, 203, 205overlap 4, 9, 16, 30, 41, 51, 65, 83, 95, 107,
117, 127, 147, 198, 203
Index
A Guide to the Project Management Body of Knowledge (PMBOK® Guide) 2000 Edition©2000 Project Management Institute, Four Campus Boulevard, Newtown Square, PA 19073-3299 USA 213
Authorized licensed use limited to: Old Dominion University. Downloaded on September 15,2010 at 18:15:01 UTC from IEEE Xplore. Restrictions apply.
PPC See percent complete (PC)PDM See precedence diagramming method (PDM)PERT See program evaluation and review technique
(PERT)PERT chart 70, 204–05
See also program evaluation and review technique(PERT)
PF See planned finish date (PF)PM See project management (PM) and project
manager (PM)PMBOK® See project management body of
knowledge (PMBOK®)PMBOK® Guide 9–10, 173, 179, 185PMP® See project management professional(s)
(PMP®)PS See planned start date (PS)PV See planned value (PV)parametric estimating 204Pareto diagram 103, 204path 139, 200, 204
convergence 204float 202, 204
percent complete (PC) 122, 196, 204performance measurement baseline See
baseline, performance measurementperformance reporting 8, 36, 47, 117, 122–25,
151–52, 157–58, 191, 204–05performing organization 4, 8, 10–12, 16, 19,
25–26, 41, 44, 49, 53–54, 64, 81, 86–87, 93,97–98, 101, 110, 113–16, 147, 149–51,158–59, 170, 191, 198–99, 204–05
phase 10–14, 20, 30, 32–33, 37, 51, 53–54,57, 62, 70, 87, 108, 117, 125, 189, 191, 197,202, 204
planned finish date (PF) 196, 204planned start date (PS) 196, 204planned value (PV) 92, 123, 196–98, 204, 208precedence diagramming method (PDM) 69–70,
139, 196–98, 203–04, 209precedence relationship 69, 203–04predecessor activity See activity, predecessorprobability and impact matrix 204, 206procurement planning 8, 35, 98, 147, 149–52,
159, 191, 204–05product scope 6, 41, 47, 51, 63, 204, 208program 10, 70, 74, 146, 168, 204, 207, 209program evaluation and review technique (PERT)
70, 75, 196, 201, 203–04See also PERT chart
project charter 45, 54–55, 114, 129, 131, 183,198, 204
project communications management 7, 24–25,117, 149, 171–72, 191, 195, 205
project cost management 7, 83, 171–72, 190,195, 205
project human resource management 7, 107,149, 170–72, 190, 195, 205
project integration management 7, 41, 170–71,189, 205
project life cycle 6, 11–14, 30, 51, 57–58, 127,130, 145, 169–70, 181, 191, 205, 207
project management (PM) 3–4, 6–7, 9–12, 18,21, 29, 32, 45–46, 55, 58, 96, 99, 102, 127,132, 135, 147, 163, 167–71, 189–91,195–96, 205body of knowledge (PMBOK®) 3, 13, 19, 163,
169, 179, 181, 196, 215processes 7, 30, 32, 38, 41–42, 44, 56, 68,
97, 103, 157, 169–70, 172, 181professional(s) (PMP®) 4, 153, 156, 168, 175,
196, 205software 42, 44, 68–69, 74, 76, 80, 86, 88,
92, 121, 198, 205team 3, 7, 11, 16, 18, 26–27, 37, 44, 46–47,
49, 67, 69, 74, 88, 92–93, 96–103, 107–10,112–13, 115, 120, 123, 147, 149, 151,157–58, 181, 205See also project team, project team member(s),
team development, and team member(s)project manager (PM) 4, 16, 19–21, 24, 46,
54–55, 60–61, 96, 107, 110, 114–15, 130,136, 144, 153, 156, 181, 196, 203–06, 209
project network diagram 69–71, 74, 77, 197,203–05, 209
project objectives 5, 29–30, 34, 36, 55–56, 63,65, 67, 86, 98, 122, 127, 133–35, 137–39,142–44, 151, 191, 199, 206–08
project phase 11–12, 32, 41, 51, 53–54, 62,65, 77, 83, 95, 109, 117, 119, 170, 204–05
project plan 26, 30, 32–33, 35, 41–46, 48–49,51, 57, 61–62, 64, 78–81, 89, 92, 99, 103,111, 115, 121–23, 132, 134, 142–46, 151,158, 189, 201–02, 205–07, 209development 7, 34, 41–44, 77, 99, 111, 151,
189, 205execution 7, 35, 41, 45–47, 55, 62, 123, 157,
189, 205project planning 33, 34, 36, 43–45, 53, 55, 97,
131, 158, 198, 205project procurement management 8, 114, 147,
171–72, 191, 195, 205project quality management 7, 95–96, 98,
171–72, 190, 195, 205project risk management 8, 26, 72–73, 171–72,
191, 195, 206project schedule 34, 36, 44–45, 65, 73–75,
77–81, 90, 96, 103, 139, 152, 190, 200–01,206–08
A Guide to the Project Management Body of Knowledge (PMBOK® Guide) 2000 Edition©2000 Project Management Institute, Four Campus Boulevard, Newtown Square, PA 19073-3299 USA
Index
214
PC|
Scop
e
Authorized licensed use limited to: Old Dominion University. Downloaded on September 15,2010 at 18:15:01 UTC from IEEE Xplore. Restrictions apply.

project scope 6, 32, 36, 41–42, 47, 51, 55–56,60–61, 63, 71, 75, 91, 96, 143, 147, 149,189, 191, 200, 205, 208
project scope management 7, 32, 51, 171–72,189, 195, 206plan 45–46, 55–57, 63
project stakeholder(s) 4, 11, 16, 35, 83, 89, 95,98, 102, 107–08, 110, 117, 119–22, 132,138, 141, 144, 191, 199, 202See also stakeholder(s)
project team 5–6, 20, 29, 42, 44, 46, 48, 63,68, 71–72, 80, 85, 87, 91, 96–97, 99,103–04, 110–11, 114–16, 122, 129–32, 138,142–43, 147, 149–50, 154, 156, 167, 183See also project management team and team
developmentmember(s) 4, 16, 68, 111, 114–16, 122,
205–06, 209See also team member(s)
project time management 7, 65, 171–72, 190,195, 206
projectized organization 20–21, 206
QQA See quality assurance (QA)QC See quality control (QC)qualitative risk analysis 8, 34, 127, 133–37,
140, 191, 206quality assurance (QA) 7, 35, 95, 97, 99,
101–02, 190, 196, 200, 205–06quality control (QC) 7, 36, 61–62, 91, 95,
99–104, 157, 190, 196, 200, 205–06quality planning 7, 34, 95, 97–99, 101, 190,
200, 205–06quantitative risk analysis 8, 34, 127, 130, 132,
134, 136–39, 141, 143, 191, 204, 206–07
RRAM See responsibility assignment matrix (RAM)RDU See remaining duration (RDU)RFP See request for proposal (RFP)RFQ See request for quotation (RFQ)remaining duration (RDU) 196, 206request for proposal (RFP) 153, 197, 202, 206request for quotation (RFQ) 153, 197, 206reserve 73, 78, 88, 137, 143–44, 198–99, 206resource leveling 76, 77, 78, 202, 206resource planning 7, 34, 46, 83, 85, 86, 109,
190, 205, 207responsibility assignment matrix (RAM) 110,
196–97, 207risk event(s) 46, 127, 134, 142, 199, 207, 209
risk identification 8, 34, 37, 127, 130, 131,132, 133, 137, 145, 146, 191, 206, 207
risk identification process 134, 141, 198, 209risk management plan(ning) 8, 34, 45, 46, 74,
90, 127, 129–131, 134, 138, 140, 145, 191,206–07
risk mitigation 143, 203, 207risk monitoring and control 8, 36, 127, 144,
145, 146, 191, 206, 207, 209risk quantification 92risk response plan(ning) 8, 34, 45, 88, 127,
130, 134, 140–41, 143, 145–46, 191, 206–07risk transferrence 209
SSF See scheduled finish date (SF) and
start-to-finish (SF)SOW See statement of work (SOW)SPI See schedule performance index (SPI)SS See scheduled start date (SS) and start-to-start
(SS)SV See schedule variance (SV)S-curve 90, 124, 170, 207schedule 14, 25, 36–37, 43–47, 55–56, 61, 68,
73–81, 91, 97, 99–100, 115, 120, 122–23,127, 129, 131, 133, 136–37, 143, 145,150–51, 157, 183, 198–99, 202–09See also baseline schedule, project schedule, and
target schedulecontrol 7, 36, 62, 65, 79–81, 91, 124, 190,
206, 208development 7, 34, 65, 71, 73–77, 190, 206,
208management plan 45, 78, 80performance 79– 81, 102, 104, 123, 201
index (SPI) 123, 197, 208variance (SV) 92, 103, 123, 197, 208
scheduled finish date (SF) 197–98, 204, 208scheduled start date (SS) 197–98, 204, 208scope 19, 25, 27, 30, 32–33, 43–45, 59–63,
68, 89, 123, 131–32, 137, 142, 170–71, 197,199, 201, 205, 207–09See also product scope, project scope, project
scope management, and project scope man-agement plan
baseline 63, 208change 29, 56, 62–63, 80, 92, 103, 124, 145,
198, 208control 7, 36, 51, 62–64, 91, 189, 206, 208
definition 6–7, 34, 37, 51, 57, 59, 67, 85, 110,149–50, 189, 206, 208
planning 7, 34, 51, 55–56, 189, 206, 208statement 34, 45, 51, 55–57, 60–62, 67, 86,
98, 149, 170, 189, 195, 208verification 7, 36, 51, 61–62, 189, 206, 208
Index
A Guide to the Project Management Body of Knowledge (PMBOK® Guide) 2000 Edition©2000 Project Management Institute, Four Campus Boulevard, Newtown Square, PA 19073-3299 USA 215
Authorized licensed use limited to: Old Dominion University. Downloaded on September 15,2010 at 18:15:01 UTC from IEEE Xplore. Restrictions apply.

slack 202, 208solicitation planning 8, 35, 147, 149, 151–54,
191, 205, 208source selection 8, 35, 147, 153, 155–56, 191,
205, 208staff acquisition 7, 34, 46, 86, 107, 112–14,
190, 205, 208stakeholder(s) 6, 11–12, 16–18, 24, 32, 34–35,
41, 43–44, 49, 54, 56, 61, 63, 74, 80, 91–92,107–08, 114–15, 119–22, 124, 129–32, 147,169, 198–99, 205, 208See also project stakeholder(s)
start date 44, 200, 206–08See also actual start date (AS), current start date,
early start date (ES), late start date (LS),planned start date (PS), scheduled start date(SS), and target start date (TS)
start-to-finish (SF) 69, 197, 203, 208start-to-start (SS) 69, 197, 203, 208statement of work (SOW) 150–53, 156, 197,
208subnet 70, 202, 209successor activity See activity, successor
TTC See target completion date (TC)TF See target finish date (TF) and total float (TF)TQM See total quality management (TQM)TS See target start date (TS)target completion date (TC) 37, 197, 209target finish date (TF) 197, 209target schedule 81, 209target start date (TS) 197, 209task 101, 127, 195, 197, 202, 209team development 7, 35, 44, 107, 114–16,
190, 205, 209team member(s) 4, 16, 20, 24, 68, 72, 74, 87,
111, 114–16, 121–22, 130, 198, 205–06, 209See also project team member(s)
technical performance measurement 145, 209time-scaled network diagram 209total float (TF) 197, 202–03, 209total quality management (TQM) 95, 97, 197,
209
VVE See value engineering (VE)value engineering (VE) 56, 83, 197, 209
WWBS See work breakdown structure(s) (WBS)work breakdown structure(s) (WBS) 9, 42–43,
45, 57–63, 65, 67–68, 71, 75, 85–87, 89,111, 129, 131, 133, 136, 138–39, 143, 150,170, 181, 195, 197, 199, 207, 209
work package 34, 47, 60–61, 67, 88–90, 111,195, 198, 203, 209
workaround(s) 63, 146, 209
A Guide to the Project Management Body of Knowledge (PMBOK® Guide) 2000 Edition©2000 Project Management Institute, Four Campus Boulevard, Newtown Square, PA 19073-3299 USA
Index
216
Slac
k|
Wor
karo
und(
s)
Authorized licensed use limited to: Old Dominion University. Downloaded on September 15,2010 at 18:15:01 UTC from IEEE Xplore. Restrictions apply.