ieee std 3006.7 - 2013 presentation.ppt events/ieeestd 30067... · • ieee g ld b k std 493ieee...
TRANSCRIPT

Overview of IEEE Std 3006.7 – 2013 R d d P ti f D t i i th Recommended Practice for Determining the Reliability of “7 x 24” Continuous Power Systems in Industrial and Commercial Systems in Industrial and Commercial Facilities
Presented ByRobert Schuerger, P.E.
HP Critical Facility Services delivered by EYP MCF

Origins of Std 3006.7-2013Origins of Std 3006.7 2013
• All of the IEEE Color Books are being revised and repackaged as “3000 Series” Standards
• IEEE G ld B k Std 493 2007 • IEEE Gold Book, Std. 493-2007 has Chapter 8 “7 x 24” Continuous Power Facilities
• Chapter 8 has become Std 3006.7• Std 3006.7 includes both electrical
di ib i d h i l li distribution and mechanical cooling systems used in critical facilities
2

Std 3006.7 – 2013 Developed by:S d 3006.7 0 3 eve oped by:Power System Reliability Working Group:
3006.7 Working GroupChair: Robert SchuergerWorking Group:
Chair: Robert ArnoMembers:
Chair: Robert SchuergerMembers:
• Robert Arno• Jose Cay II
• William Braun• Timothy J. Coyle• Neal Dowling
Jose Cay II• Raymond Chiu• Edwin Cothran• Ann’claude Coutu
• Peyton Hale• Masoud Pourali• Robert Schuerger
• Neal Dowling• Addam Friedl• Joaquin Fusterg
• Michael Simon• Christopher C Thompson, Jr• Joseph Weber
• Gardson Githu• Peter Gross• Ian Levine
M h l SJoseph Weber
• Michael Simon• Sonny K. Siu
3

Reliabilityy• Today the term “reliability” is used as an umbrella definition
covering a variety of subjects including availability, g y j g y,durability, quality and sometimes the function of the product
• Currently for critical facilities, when the subject is reliability, it i t t t t b t “fi 9’ ”is very common to see statements about “five 9’s”
4

Five 9’s refers to Availabilityy
Total Time - DowntimeAvailability =
Total TimeAvailability =
• Availability (A): Availability is the long-term average fraction of time that a component or system is in service and satisfactorily performing its intended functionand satisfactorily performing its intended function
• Five 9’s means an availability of 99.999%.
5

AvailabilityyTotal Time - Downtime
Total TimeAvailability =
Total Time
In terms used for statistics, for a constant failure rate:In terms used for statistics, for a constant failure rate:•Downtime = Time it takes to repair the failure
•Average downtime = Mean time to Repair (MTTR)
•Average uptime = Mean Time Between Failures (MTBF)
•Total time = (MTBF) + (MTTR)
Availability =MTBF
(MTBF + MTTR)
6
(MTBF + MTTR)
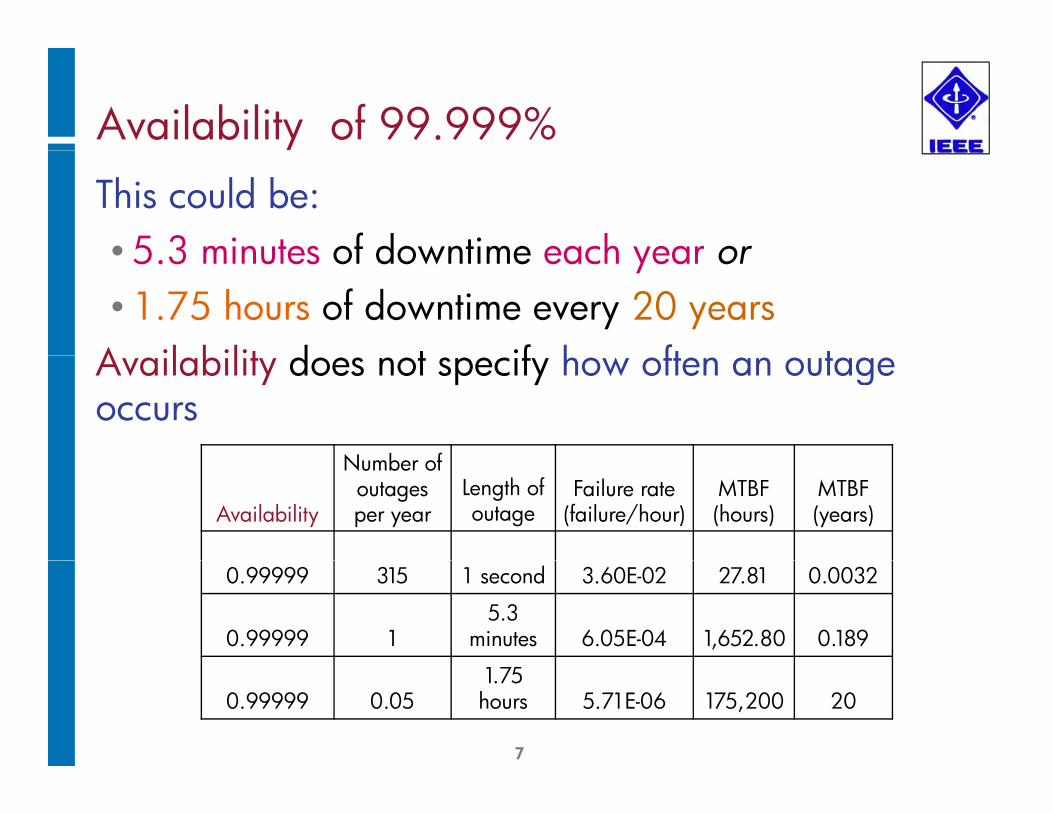
Availability of 99.999%This could be:•5 3 minutes of downtime each year or•5.3 minutes of downtime each year or•1.75 hours of downtime every 20 years
A il bilit d t if h ft t Availability does not specify how often an outage occurs
N b f
Availability
Number of outages per year
Length of outage
Failure rate (failure/hour)
MTBF (hours)
MTBF (years)
0.99999 315 1 second 3.60E-02 27.81 0.0032
0.99999 15.3
minutes 6.05E-04 1,652.80 0.189
7
0.99999 0.051.75 hours 5.71E-06 175,200 20

Reliability has a specific definition
• Reliability (R) is the probabilityh d i ill that a product or service will operate properly for a specified period of time under design p goperating conditions without failure.R li bilit P b bilit f • Reliability = Probability of Successful Operation (for a specific time period)(for a specific time period)
• Probability of Failure = (1 – Reliability)
8
( y)
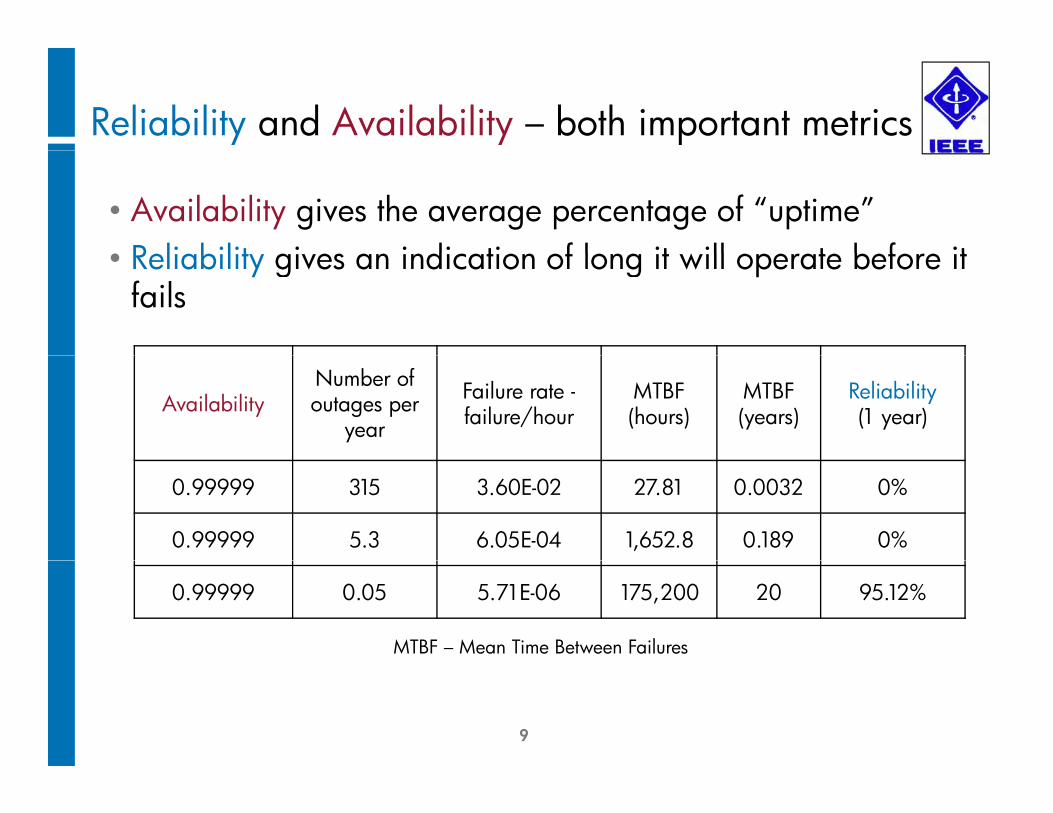
Reliability and Availability – both important metrics
• Availability gives the average percentage of “uptime”R li bilit i i di ti f l it ill t b f it • Reliability gives an indication of long it will operate before it fails
AvailabilityNumber of outages per
year
Failure rate -failure/hour
MTBF (hours)
MTBF (years)
Reliability (1 year)
0.99999 315 3.60E-02 27.81 0.0032 0%
0.99999 5.3 6.05E-04 1,652.8 0.189 0%
0.99999 0.05 5.71E-06 175,200 20 95.12%
MTBF – Mean Time Between Failures
9

Performing Reliability Analysisg y y• There are several ways to perform calculate reliability and
availability• P3006.7 presents several methods
– Reliability Block Diagrams (RBD)Fault Tree Analysis (FTA)– Fault Tree Analysis (FTA)
– Failure Mode Effects and Criticality Analysis (FMECA)• Each method has a different approach to the analysis
– RBD is a model of the system flow; the one-line diagram or piping diagram
– FTA starts at the top with the failure to be analyzed and works FTA starts at the top with the failure to be analyzed and works down the “tree” with all of the potential causes of the top event
– FMECA is a deep dive into how all of the components or systems can fail (failure modes), what the effect of that failure
10
systems can fail (failure modes), what the effect of that failure would be and how critical it would be to the overall mission

Performing Reliability Analysis – RBD g y y• Many of the comparisons between electrical and mechanical
systems in P3006.7 have been done using Reliability Block y g yDiagrams
• The individual components are represented by blocks.
Figure 8 — RBD of Utility power to two fused disconnects, two t f d t i it b k ith f hi h
11
transformers, and two circuit breakers, either one of which can power the Main Switchgear

Performing Reliability Analysis – FTAg y y• Some of the comparisons in P3006.7 have been done using
Fault Tree Analysis y• Boolean Algebra with “OR,” “AND,” etc. are used to analyze the
fault tree
=
=
OR
AND==
AND
Basic Event
= Repeated Event
U d l d
12
Figure 10 – Example Fault Tree
Undeveloped Event=

Performing Reliability Analysis – FTAg y y• Fault Tree for a top event of “loss of power to the Main
Switchgear” fed by Utility power from two fused g y y pdisconnects, two transformers, and two circuit breakers
13
Figure 11 – FTA for power to Main Switchgear

Availability for multiple components
Series System – Each block is a Single Point of Failure (SPOF)This is also “AND” for Block 1 System Block 1
0 81 = 0 9 x 0 9Each
AND for FTA= Block 1
A = 0.9System
AvailabilityBlock 1 A = 0.9
0.81 = 0.9 x 0.9
Parallel System (having redundancy)
Each componenthas availabilityof 90% or 0.9 ( “9”)
Block 1 A = 0.9
(one “9”)
This is also “OR” for =System
A l b l Block 1 A = 0.9
OR for FTA
=Availability
14
0.99 = 1 – [ (1- 0.9) x (1- 0.9)]
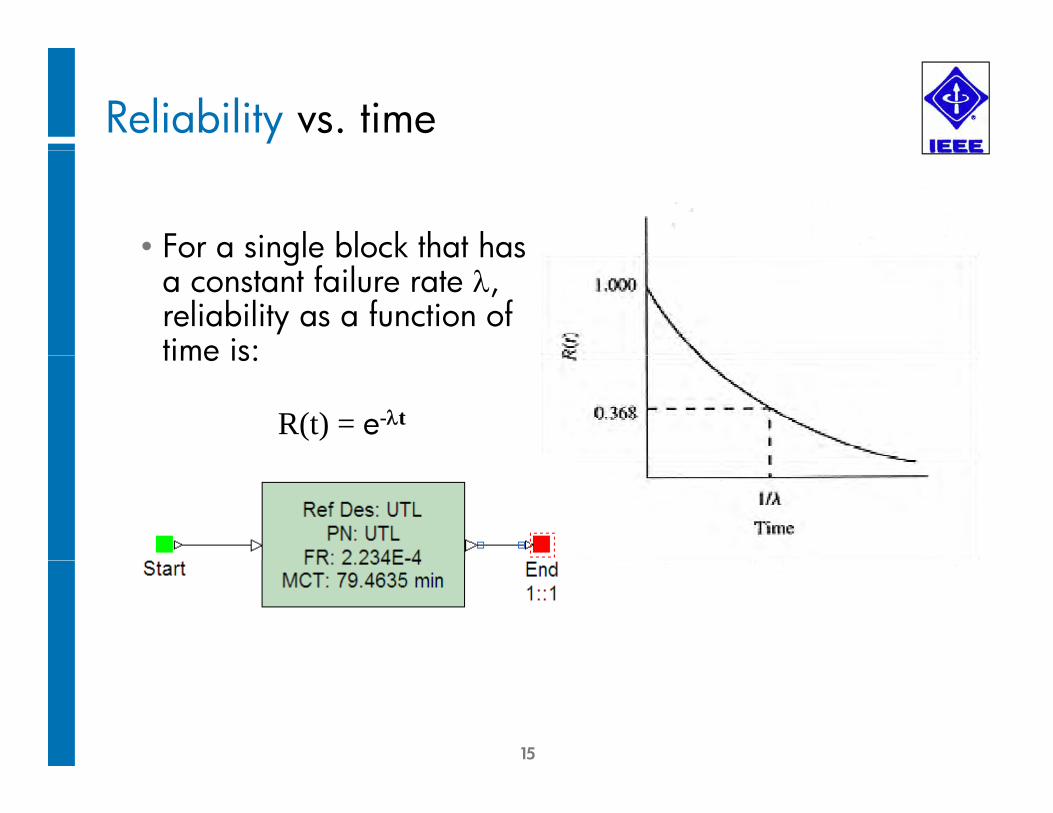
Reliability vs. time
• For a single block that has For a single block that has a constant failure rate , reliability as a function of time is:time is:
R(t) = e-t
15

Reliability for multiple componentsy p p
• For two blocks in series with failure rates of 1 and 2, the li bilit f ti f ti R(t) ireliability as a function of time R(t) is:
R(t) R(1) X R(2) e- (1 + 2) t This is also “AND” for FTAR(t) = R(1) X R(2) = e- (1 + 2) t This is also AND for FTA
Assy: Block 1FR: 6 53E 4
Assy: Block 2FR: 4 15E 4FR: 6.53E-4 FR: 4.15E-4
Start End1::1
16
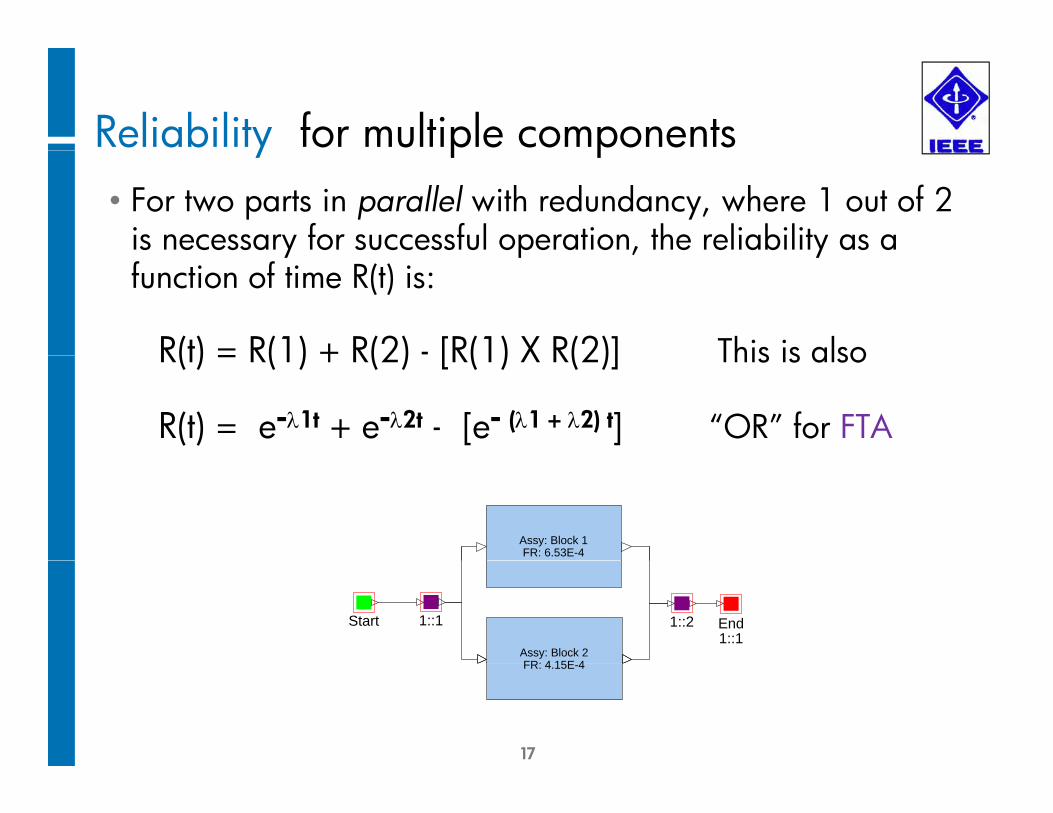
Reliability for multiple componentsy p p• For two parts in parallel with redundancy, where 1 out of 2
is necessary for successful operation, the reliability as a y p , yfunction of time R(t) is:
R(t) = R(1) + R(2) - [R(1) X R(2)] This is alsoR(t) = R(1) + R(2) [R(1) X R(2)] This is also
R(t) = e-1t + e-2t - [e- (1 + 2) t] “OR” for FTA
Assy: Block 1FR: 6.53E-4
Assy: Block 2FR: 4 15E 4
Start End1::1
1::21::1
17
FR: 4.15E-4

Component failure data is required to f l b l lperform Reliability analysis
• The primary source of failure and repair rates used for the p y pmodeling of critical electrical (and mechanical) distribution systems is IEEE Gold Book, Standard 493-2007 Recommended Practice of the Design of Reliable Industrial Recommended Practice of the Design of Reliable Industrial and Commercial Power Systems
• A large part of the of the data in the IEEE Gold Book was d d b h f h h ll dprovided by the Army Corp of Engineers which was collected
as part of the Power Reliability Enhancement Program (PREP)• Another source is the Reliability Analysis Center (RAC) Non• Another source is the Reliability Analysis Center (RAC) Non-
electronic Parts Reliability Data
18
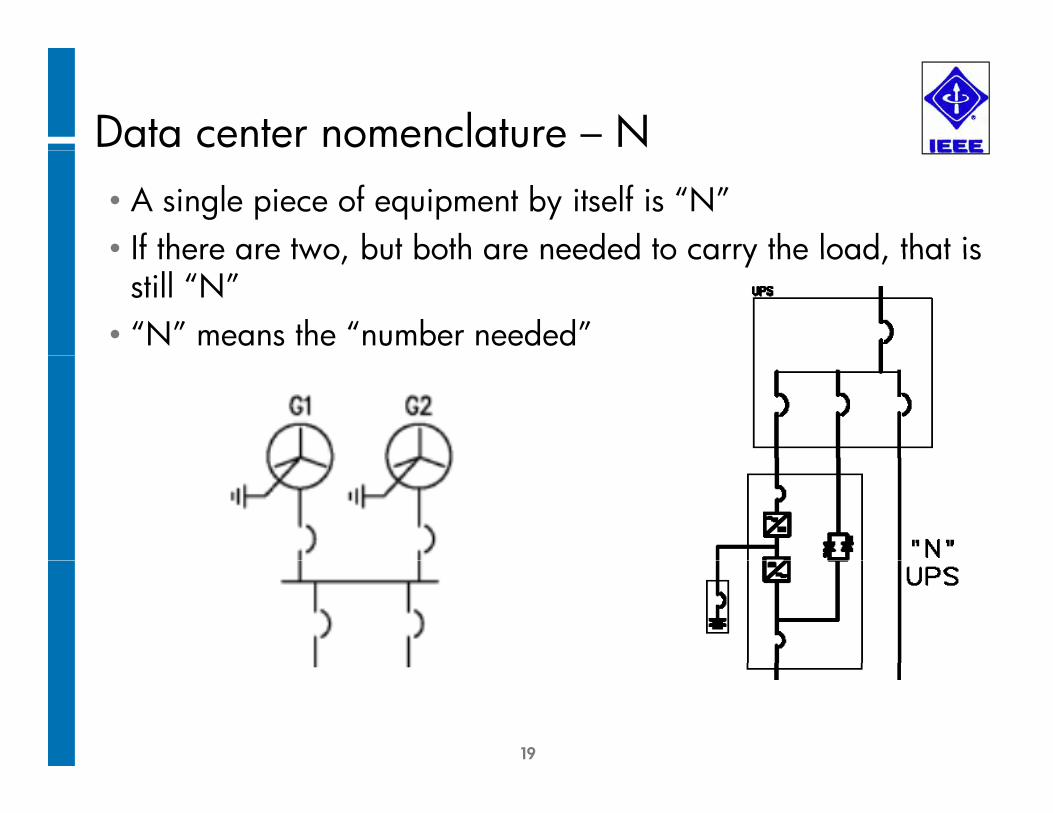
Data center nomenclature – N• A single piece of equipment by itself is “N” • If there are two but both are needed to carry the load that is If there are two, but both are needed to carry the load, that is
still “N”• “N” means the “number needed”
19

Data center nomenclature – N+1• “N + 1” means that there is a
spare unit; one is needed to carry the load and the second carry the load and the second one is redundant
• This is “component redundancy,” since only the UPS (or generator) since only the UPS (or generator) is redundant
20

Data center nomenclature – 2N• “2N” means that there are two
systems; one system is needed to carry the load and the to carry the load and the second one is redundant
• This is “system redundancy,” since there two separate since there two separate systems
21

When in doubt – be specificpThe design below is “2N” for the UPS system, but “N+1” for the standby generatorsfor the standby generators
22

Special equipment - STS p q p
S i T f S i h • Static Transfer Switches (STS) were developed to improve the reliability of p ypower to the IT equipment
• STS is designed to transfer b t i ¼ f between sources in ¼ of a cycle and therefore the IT equipment is unaffected
23

Single and Dual cord IT equipmentAnother very important consideration is the
fi ti f th configuration of the power supplies in the IT equipment itself• “Single cord” IT equipment
means there is only one d l i ipower cord supplying it
• “Dual cord” IT equipment has two power cords each has two power cords, each one individually capable of carrying the load
24

Dual cord IT equipmentq p
• We will see later in this presentation that it is very important to properly connect the Dual cord IT equipment so the Dual cord IT equipment so each cord is powered by a different source
25

Special Mechanical equipment - CRAC p q p
• Computer Room Air Conditioning (CRAC) units have been d d l h l f used to provide cooling since the early main frame
computers were developed
26

Figure 15 – N + 1 generators and UPSg g
The design below is f h db“N+1” for the standby
generators and UPS system to single cord loadsto single cord loads
27

Figure 16 – 2N electrical distributiongThe design below is “2N” for the UPS system and standby generatorsgenerators
28

Figure 17 – N+1 gens, 2(N+1) UPS systemg g , ( ) yThe design below is N+1 standby generators and 2(N+1) UPS system 2(N+1) UPS system
29

Figure 18 – Distributed Redundant UPSgThe design below is N+1 standby generators and Distributed Redundant 2 of 3 UPS system Distributed Redundant 2 of 3 UPS system
30

Reliability and availability – single cord
Name Description of Critical Distribution System
MTBF (years)
MTTR (Hours)
Inherent Availability
Probability of Failure(y ) ( ) y
Figure 15: N + 1 (GEN
+ UPS)
Gen (2-3), UPS (4-5) 12 single cord loads 7.4 11.29 0.9998253 49.11%
UPS)
Figure 16: 2N (GEN +
UPS)
2X [Gen (2-2), UPS (4-4)] 12 STS/PDU
single cord loads8.9 10.96 0.9998592 39.82%
N+1 GEN2(N + 1)
UPS
Gen (2-3), 2X [UPS (4-5)] 12 STS/PDU
single cord loads8.9 11.06 0.9998576 39.47%
N+1 Gen: DR (2-3)
UPS
Gen (2-3), DR (2-3) X [UPS (2-3)], 12 STS/PDU
single cord loads8.7 11.08 0.9998549 40.71%
31
MTBF – Mean Time Between Failures
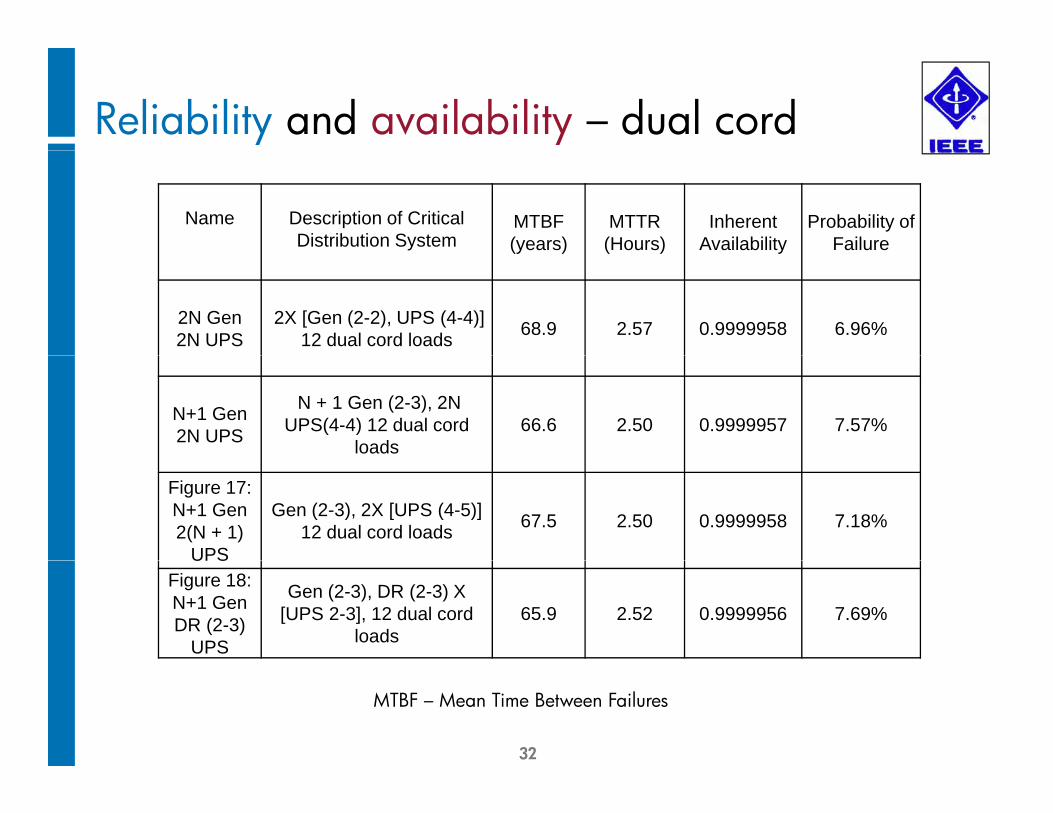
Reliability and availability – dual cord
Name Description of Critical Distribution System
MTBF (years)
MTTR (Hours)
Inherent Availability
Probability of Failure(y ) ( ) y
2N Gen 2N UPS
2X [Gen (2-2), UPS (4-4)] 12 dual cord loads 68.9 2.57 0.9999958 6.96%
N+1 Gen 2N UPS
N + 1 Gen (2-3), 2N UPS(4-4) 12 dual cord
loads66.6 2.50 0.9999957 7.57%
Figure 17: N+1 Gen 2(N + 1)
UPS
Gen (2-3), 2X [UPS (4-5)] 12 dual cord loads 67.5 2.50 0.9999958 7.18%
UPSFigure 18:N+1 Gen DR (2-3)
UPS
Gen (2-3), DR (2-3) X [UPS 2-3], 12 dual cord
loads65.9 2.52 0.9999956 7.69%
32
MTBF – Mean Time Between Failures

Figure 27 – Chilled Water Central PlantgThe design below is N+1for the cooling towers, chillers and pumps and N+4 for the CRAH unitsand pumps and N+4 for the CRAH units
33

Figure 29 – Air Cooled Chilled Water PlantgThe design below is N+1for the chillers and pumps and N+4 for the CRAH unitsN+4 for the CRAH units
34

Figure 30 – Air & Water Cooled CWPgThe design below is N+N for the air cooled and water cooled chillers, pumps, etc. and N+4 for the CRAH unitscooled chillers, pumps, etc. and N+4 for the CRAH units
35

Reliability and availability – Mechanical
Name Description of Critical Distribution System
MTBF (years)
MTTR (Hours)
Inherent Availability
Probability of Failure(y ) ( ) y
Figure 27
2 of 3 [CT, Dedicated (CWP, WC CH, PWP),
SWP] + (14 of 18) CRAH it
77.9 6.65 0.9999903 1.72%
units
Figure 282 of 3 [CT, CWP, WC CH, PWP, SWP] + (14 of 18)
CRAH units78.1 6.60 0.9999904 1.62%
Figure 292 of 3 [ AC CH, PWP,
SWP] + (14 of 18) CRAH units
495 13.46 0.9999969 0.95%
Figure 30
1 [CT, CWP, WC CH, PWP] + 2 [AC CH, 2
PWP] + (2 of 3 SWP) + (14 of 18) CRAH units
226 8.96 0.9999955 2.17%
36
MTBF – Mean Time Between Failures

Figure 32 – 2N Electrical System feeding N+1 Water Cooled CWPThe design below powers the 2 out of 3 water cooled chillers, pumps, etc. from a 2N electrical systemchillers, pumps, etc. from a 2N electrical system
37

Figure 33 – 2N Electrical System feeding N+1 Water Cooled CWPThe design below uses 3 switchboards with circuit breaker transfer pairs from a 2N electrical systemtransfer pairs from a 2N electrical system
38
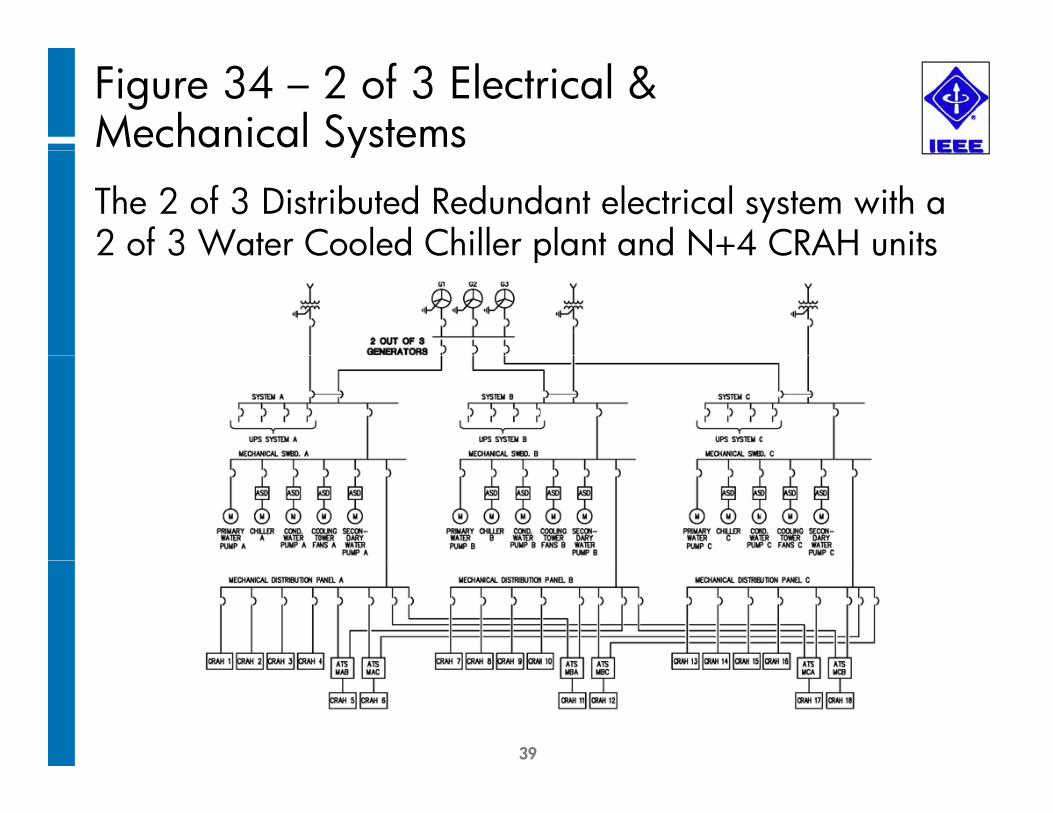
Figure 34 – 2 of 3 Electrical & Mechanical SystemsyThe 2 of 3 Distributed Redundant electrical system with a 2 of 3 Water Cooled Chiller plant and N+4 CRAH units2 of 3 Water Cooled Chiller plant and N+4 CRAH units
39

Reliability and availability – MechanicalName Description of Critical
Distribution SystemMTBF (years)
MTTR (Hours)
Inherent Availability
Probability of Failure
Figure 34 without 2 of 3 Mech Swbds 5 2 2 78 0 9999389 61 62%without ATSs feeding (14 of 18) CRAH 5.2 2.78 0.9999389 61.62%
Figure 342 of 3 Mech Swbds
feeding (14 of 18) CRAH with 6 ATS for 6 CRAH
70.2 2.00 0.9999968 6.86%
Figure 34 with
contactors
2 of 3 Mech Swbds feeding (14 of 18) CRAH
with two contactors in each
147.4 1.20 0.9999991 3.52%
Figure 32
2N feeding 2 Mech Swbds with ATS feeding one set
of chillers, etc. + (14 of 18) CRAH with two contactors
in each
90.7 1.61 0.9999980 5.69%
in each
Figure 33
2N feeding 2 of 3 MechSwbds with breaker
transfer pairs + (14 of 18) CRAH with two contactors
192.3 1.15 0.9999993 2.79%
40
MTBF – Mean Time Between Failures
CRAH with two contactors in each

Cost Optimization is greatly assisted with R li bilit d A il bilit l iReliability and Availability analysis
AvailabilityAvailability
99.9999
99.99
99.999
99 0
99.9
99.0
9.0
41
Cost $

Questions?Robert Schuerger, PEPrincipal Reliability [email protected]
HP Critical Facilities Services, Inc. d li d b EYP MCFdelivered by EYP MCF
42