ieee transactions on biomedical …eprints.qut.edu.au/2820/1/2820.pdfieee transactions on biomedical...
TRANSCRIPT

IEEE TRANSACTIONS ON BIOMEDICAL ENGINEERING, VOL. 52, NO. 11, NOVEMBER 2005 1939
Evaluating Tear Film Stability in the Human EyeWith High-Speed Videokeratoscopy
D. Robert Iskander*, Senior Member, IEEE, Michael J. Collins, and Brett Davis
Abstract—High-speed videokeratoscopy (HSV) is an emergingtechnology that has the potential to acquire information on thedynamics of corneal topography and tear-film behavior. We showthat the surface regularity and asymmetry indices, which aretraditionally used for characterizing the stability of precornealtear film, have limitations in the context of HSV because they arehighly sensitive to natural ocular microfluctuations. To overcomethis problem, we propose a new microfluctuation-independentsurface indicator. It is based on the root-mean-square of the errorof the parametric model fit to the surface. Further, we developtechniques for estimating the tear film build-up and break-uptimes. The tear film build-up time estimator is based on the pro-posed RMS fit surface indicator while the tear film break-up timeestimator is derived directly from a set of consecutive HSV digitalimages, without the need for estimating the resulting cornealsurface.
Index Terms—Corneal topography, tear film build-up andbreak-up times, videokeratography.
I. INTRODUCTION
THE tear film that covers the cornea and conjunctiva is im-portant to the optics and health of the ocular surface. From
the optical point of view, the role of the tear film is to forma smooth refractive surface over the corneal epithelium. How-ever, the preocular tear film is constantly changing and under-goes a formation (build-up) phase immediately after a blink and,provided that the eye is left open for a sufficiently long periodof time, a subsequent deformation (break-up) phase [1]. Thus,evaluating the quality of the preocular tear film is one of theimportant clinical tasks in optometry and ophthalmology par-ticularly for diagnosing dry eye syndrome.
There are a number of in vivo methodologies that can be usedto establish the quality of the tear film. The traditional slit-lampbiomicroscopy technique is called the break-up time test and in-volves the installation of a fluorescent dye into the tear film [2].However, the addition of any substance to the tears will decreasetear film stability and produce biased estimates of build-up andbreak-up times [3]. Thus, noninvasive methods of tear film char-acterization are preferred. In [4], an instrument that projected agrid pattern on the corneal surface was utilized and the time from
Manuscript received August 10, 2004; revised April 10, 2005. This projectwas supported by the QUT Strategic Collaborative Program scheme. Asteriskindicates corresponding author.
*D. R. Iskander is with the Contact Lens and Visual Optics Laboratory,School of Optometry, Queensland University of Technology, Victoria Park Rd,Kelvin Grove, Brisbane Q4059, Australia (e-mail: [email protected]).
M. J. Collins and B. Davis are with the Contact Lens and Visual Optics Lab-oratory, School of Optometry, Queensland University of Technology, BrisbaneQ4059, Australia (e-mail: [email protected]).
Digital Object Identifier 10.1109/TBME.2005.856253
a complete blink to the first observance of grid disturbance wasused as an estimate of tear film break-up time. Other methodsfor assessing the tear film involve meniscometry and interfer-ometry [5]–[8]. There is a also the potential of utilizing a Hart-mann-Shack wavefront sensor for this task [9], [10]. However,these noninvasive clinical techniques cover only a small portionof the corneal surface. In meniscometry, the quality of the tearfilm can be evaluated over a small rectangular area of around 1mm 1.5 mm. Interferometric methods usually cover a circulararea of around 2–3 mm in diameter, while in wavefront sensingthe analysis area is limited by the pupil size.
Recently, several research groups have utilized videoker-atoscopy as means of noninvasive tear film characterization[11]–[14]. They referred to their techniques as high-speedvideokeratoscopy (HSV), since traditional videokeratoscopyrelies on the acquisition of single corneal topography mapswhereas the new method allows continuous acquisition. Thetopographical information derived from videokeratoscopy isreferred to as corneal topography, based on the assumption thatthe tear film is static, comparatively thin and has a constantthickness. However, HSV shows that the tear film topographyundergoes dynamic changes in the period between blinks.
The importance of HSV was first advocated in [11], wherea commercially available videokeratoscope was adapted to ac-quire corneal elevation data at a sampling rate of 4 Hz for aperiod of 15 s. The data (videokeratoscopic images) were firststored in a computer memory and later processed. This systemwas used to examine dynamic changes in surface regularity andsurface asymmetry indexes [15], derived from the estimatedcorneal power maps, that were subsequently used to estimate thetear film build-up time after the blink. A similar approach wasused in [12]–[14] to examine the tear film stability at a samplingrate of 1 Hz for a period of 10 s. However, sampling rates of onlyfew Hertz are too low to study the period of tear film behaviorimmediately before and after a blink. Also, such low samplingrates limit the estimation of the tear film build-up and break-uptimes. Systems with much higher sampling rates would providethe means to estimate tear film dynamics more accurately.
Recent observations of the tear film behavior with HSV havefocused on characterizing surface regularity and asymmetry in-dices. Such indexes may be well suited for surface description ininterblink intervals, provided that the quality of acquired imagesis sufficiently high so that the topography elevation estimationalgorithm could correctly perform its task. However, there areseveral shortcomings in such characterization of surface topog-raphy in a dynamic setting of HSV. Firstly, in the periods pre-ceding and following a blink there is often not enough properlyresolved ring data to allow estimation of surface elevation. This
0018-9294/$20.00 © 2005 IEEE
1940 IEEE TRANSACTIONS ON BIOMEDICAL ENGINEERING, VOL. 52, NO. 11, NOVEMBER 2005
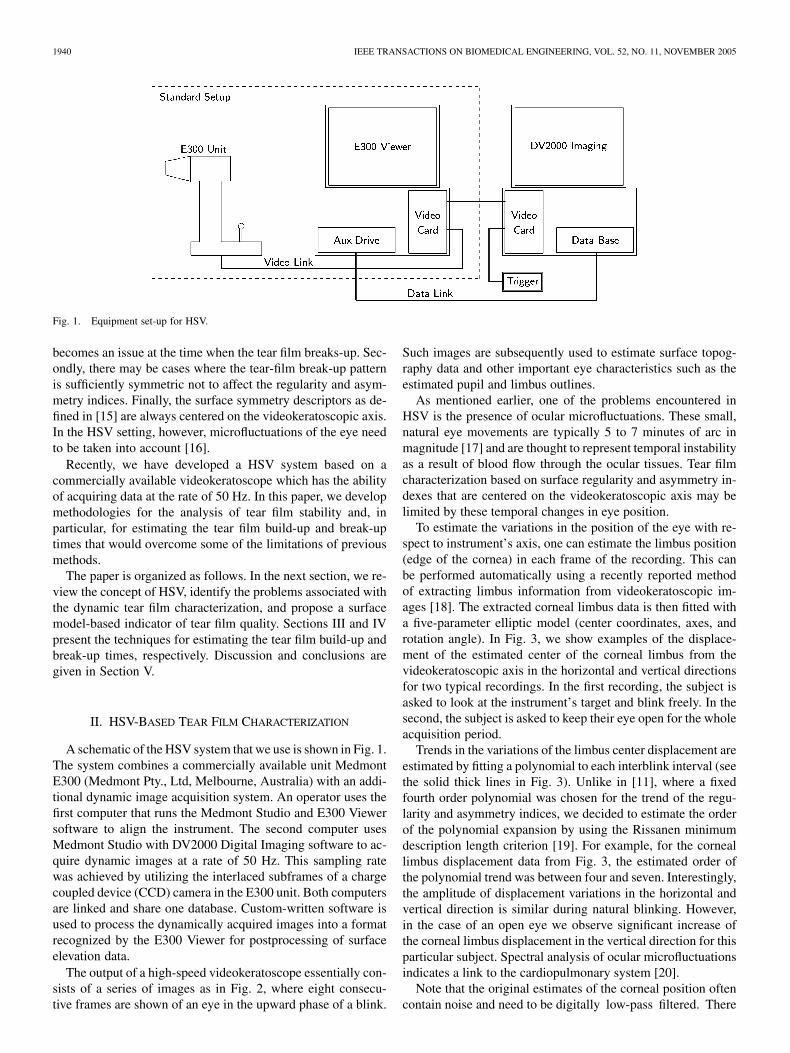
Fig. 1. Equipment set-up for HSV.
becomes an issue at the time when the tear film breaks-up. Sec-ondly, there may be cases where the tear-film break-up patternis sufficiently symmetric not to affect the regularity and asym-metry indices. Finally, the surface symmetry descriptors as de-fined in [15] are always centered on the videokeratoscopic axis.In the HSV setting, however, microfluctuations of the eye needto be taken into account [16].
Recently, we have developed a HSV system based on acommercially available videokeratoscope which has the abilityof acquiring data at the rate of 50 Hz. In this paper, we developmethodologies for the analysis of tear film stability and, inparticular, for estimating the tear film build-up and break-uptimes that would overcome some of the limitations of previousmethods.
The paper is organized as follows. In the next section, we re-view the concept of HSV, identify the problems associated withthe dynamic tear film characterization, and propose a surfacemodel-based indicator of tear film quality. Sections III and IVpresent the techniques for estimating the tear film build-up andbreak-up times, respectively. Discussion and conclusions aregiven in Section V.
II. HSV-BASED TEAR FILM CHARACTERIZATION
A schematic of the HSV system that we use is shown in Fig. 1.The system combines a commercially available unit MedmontE300 (Medmont Pty., Ltd, Melbourne, Australia) with an addi-tional dynamic image acquisition system. An operator uses thefirst computer that runs the Medmont Studio and E300 Viewersoftware to align the instrument. The second computer usesMedmont Studio with DV2000 Digital Imaging software to ac-quire dynamic images at a rate of 50 Hz. This sampling ratewas achieved by utilizing the interlaced subframes of a chargecoupled device (CCD) camera in the E300 unit. Both computersare linked and share one database. Custom-written software isused to process the dynamically acquired images into a formatrecognized by the E300 Viewer for postprocessing of surfaceelevation data.
The output of a high-speed videokeratoscope essentially con-sists of a series of images as in Fig. 2, where eight consecu-tive frames are shown of an eye in the upward phase of a blink.
Such images are subsequently used to estimate surface topog-raphy data and other important eye characteristics such as theestimated pupil and limbus outlines.
As mentioned earlier, one of the problems encountered inHSV is the presence of ocular microfluctuations. These small,natural eye movements are typically 5 to 7 minutes of arc inmagnitude [17] and are thought to represent temporal instabilityas a result of blood flow through the ocular tissues. Tear filmcharacterization based on surface regularity and asymmetry in-dexes that are centered on the videokeratoscopic axis may belimited by these temporal changes in eye position.
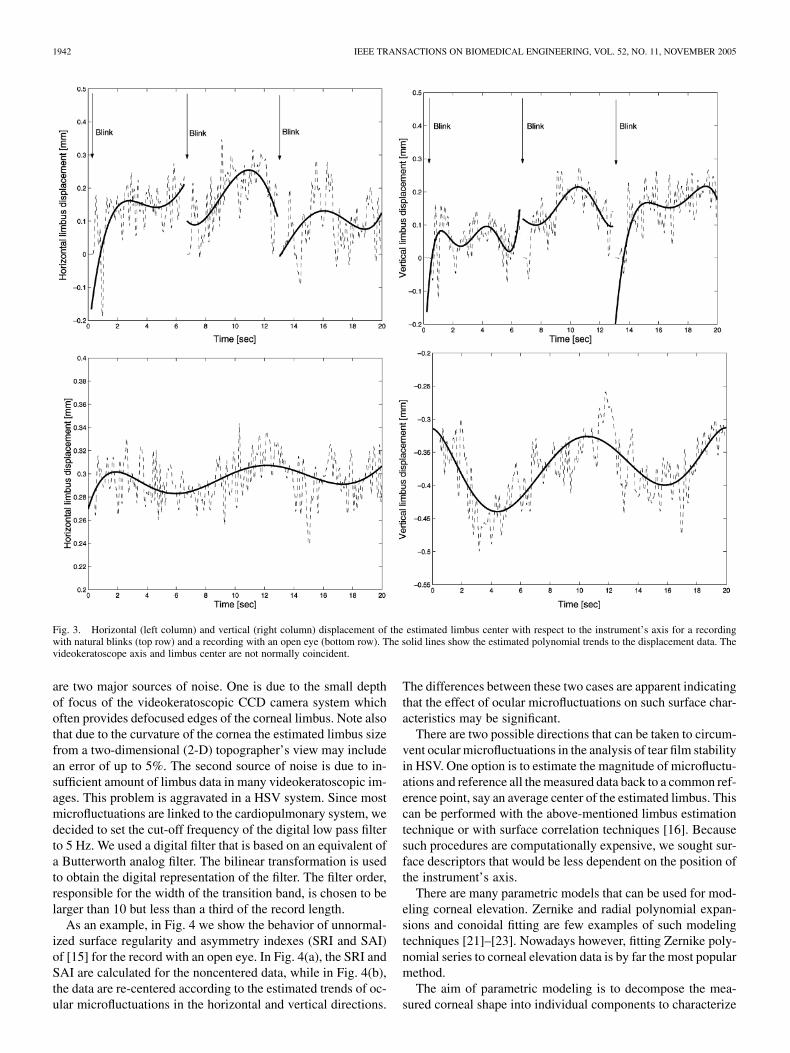
To estimate the variations in the position of the eye with re-spect to instrument’s axis, one can estimate the limbus position(edge of the cornea) in each frame of the recording. This canbe performed automatically using a recently reported methodof extracting limbus information from videokeratoscopic im-ages [18]. The extracted corneal limbus data is then fitted witha five-parameter elliptic model (center coordinates, axes, androtation angle). In Fig. 3, we show examples of the displace-ment of the estimated center of the corneal limbus from thevideokeratoscopic axis in the horizontal and vertical directionsfor two typical recordings. In the first recording, the subject isasked to look at the instrument’s target and blink freely. In thesecond, the subject is asked to keep their eye open for the wholeacquisition period.
Trends in the variations of the limbus center displacement areestimated by fitting a polynomial to each interblink interval (seethe solid thick lines in Fig. 3). Unlike in [11], where a fixedfourth order polynomial was chosen for the trend of the regu-larity and asymmetry indices, we decided to estimate the orderof the polynomial expansion by using the Rissanen minimumdescription length criterion [19]. For example, for the corneallimbus displacement data from Fig. 3, the estimated order ofthe polynomial trend was between four and seven. Interestingly,the amplitude of displacement variations in the horizontal andvertical direction is similar during natural blinking. However,in the case of an open eye we observe significant increase ofthe corneal limbus displacement in the vertical direction for thisparticular subject. Spectral analysis of ocular microfluctuationsindicates a link to the cardiopulmonary system [20].
Note that the original estimates of the corneal position oftencontain noise and need to be digitally low-pass filtered. There

ISKANDER et al.: EVALUATING TEAR FILM STABILITY IN THE HUMAN EYE WITH HSV 1941
Fig. 2. An example of 8 consecutive frames taken by the high-speed videokeratoscope during the upward phase of the eye blink. The sampling rate is set to 50 FPS.
1942 IEEE TRANSACTIONS ON BIOMEDICAL ENGINEERING, VOL. 52, NO. 11, NOVEMBER 2005
Fig. 3. Horizontal (left column) and vertical (right column) displacement of the estimated limbus center with respect to the instrument’s axis for a recordingwith natural blinks (top row) and a recording with an open eye (bottom row). The solid lines show the estimated polynomial trends to the displacement data. Thevideokeratoscope axis and limbus center are not normally coincident.
are two major sources of noise. One is due to the small depthof focus of the videokeratoscopic CCD camera system whichoften provides defocused edges of the corneal limbus. Note alsothat due to the curvature of the cornea the estimated limbus sizefrom a two-dimensional (2-D) topographer’s view may includean error of up to 5%. The second source of noise is due to in-sufficient amount of limbus data in many videokeratoscopic im-ages. This problem is aggravated in a HSV system. Since mostmicrofluctuations are linked to the cardiopulmonary system, wedecided to set the cut-off frequency of the digital low pass filterto 5 Hz. We used a digital filter that is based on an equivalent ofa Butterworth analog filter. The bilinear transformation is usedto obtain the digital representation of the filter. The filter order,responsible for the width of the transition band, is chosen to belarger than 10 but less than a third of the record length.
As an example, in Fig. 4 we show the behavior of unnormal-ized surface regularity and asymmetry indexes (SRI and SAI)of [15] for the record with an open eye. In Fig. 4(a), the SRI andSAI are calculated for the noncentered data, while in Fig. 4(b),the data are re-centered according to the estimated trends of oc-ular microfluctuations in the horizontal and vertical directions.
The differences between these two cases are apparent indicatingthat the effect of ocular microfluctuations on such surface char-acteristics may be significant.
There are two possible directions that can be taken to circum-vent ocular microfluctuations in the analysis of tear film stabilityin HSV. One option is to estimate the magnitude of microfluctu-ations and reference all the measured data back to a common ref-erence point, say an average center of the estimated limbus. Thiscan be performed with the above-mentioned limbus estimationtechnique or with surface correlation techniques [16]. Becausesuch procedures are computationally expensive, we sought sur-face descriptors that would be less dependent on the position ofthe instrument’s axis.
There are many parametric models that can be used for mod-eling corneal elevation. Zernike and radial polynomial expan-sions and conoidal fitting are few examples of such modelingtechniques [21]–[23]. Nowadays however, fitting Zernike poly-nomial series to corneal elevation data is by far the most popularmethod.
The aim of parametric modeling is to decompose the mea-sured corneal shape into individual components to characterize

ISKANDER et al.: EVALUATING TEAR FILM STABILITY IN THE HUMAN EYE WITH HSV 1943
Fig. 4. Unnormalized surface regularity (left) and asymmetry (right) indexes for a recording with an open eye for original (a) and re-centered (b) data for a 6-mmcorneal diameter.
parameters that are clinically significant. The question ariseswhether such descriptors can be used to characterize the tearfilm characteristics. We note that each of these modeling rep-resentations is a 2-D function that has to be centered at somefixed point (origin), and in essence, they are not different to thereported earlier surface regularity and asymmetry indexes whenit comes to the problem of ocular microfluctuations. To relax thedependence on the axis, we propose to use the root mean square(RMS) of the residual surface error of the extracted elevationdata and its estimated parametric model. The fit error RMS isa quantitative descriptor of the quality of the chosen parametricrepresentation and, as it will be shown later, is almost indepen-dent on the location of the origin.
To formalize the problem, let the raw elevation data,, sampled at polar coordinate points ,
, and at time , , be decom-posed into a finite set of orthogonal basis functions
where is a set of single-in-dexed orthogonalized Zernike polynomials with time-varyingcoefficients, , , , and
represents modeling error. The time-varying co-efficients can be estimated individually at the discretetime instants by utilizing the traditional methodof least squares [24], [25]. After finding the estimates of thetime-varying coefficients we can evaluate the surface model as
where , , are the estimators of the timevarying coefficients .
The fit RMS is a function of time defined as
(1)
1944 IEEE TRANSACTIONS ON BIOMEDICAL ENGINEERING, VOL. 52, NO. 11, NOVEMBER 2005
An increase in the surface fit RMS would indicate a worse fit tothe surface topography data for a given model order.
We have examined the behavior of the surface indicator in(1). Several factors were considered in the evaluation such asthe corneal size (diameter), order of the Zernike polynomial ex-pansion, , and the effect of adjusting the estimated microfluc-tuations. The following observations were made:
1) For a given order of the Zernike polynomial expansion,the amplitude of increases with corneal diam-eter and becomes much noisier (having larger variance)when the diameter exceeds 6 mm.
2) For a given corneal diameter, the amplitude of the indi-cator decreases with the order of the Zernike polynomialexpansion.
3) Centering surface elevation data to a common referencepoint to remove the effect of microfluctuations does notsignificantly affect the magnitude of the surface indicatorwhile, at the same time, it has been observed that the indi-vidualZernikecomponentsvarywithcentrationof thedata.
4) In general, the surface fit RMS-based indicator has a pe-riod of decay immediately after a blink followed by a pe-riod of stability. It then increases after a certain period oftime and may become significantly larger than its initialvalue after an extended period of time.
In Fig. 5, we show the behavior of the proposed tear film indi-cator (thin dashed lines) for a recording with natural blinks (thesame as in the top row of Fig. 3) for a 6-mm corneal diameterand for the 5th, 8th, and 10th radial order Zernike polynomialexpansion (corresponding to , , and ,respectively). The left column of Fig. 5 shows results from anunaltered videokeratoscopic data. The right column shows theresults for the re-centered data where the estimated trends of themicrofluctuations were used for repositioning the analysis axis.We note that the difference in variations of the surface indicatorbetween the left and right columns of Fig. 5 is negligible, indi-cating that the proposed indicator is robust to microfluctuationsthat are present in HSV data acquisition.
III. TEAR FILM BUILD-UP TIME ESTIMATION
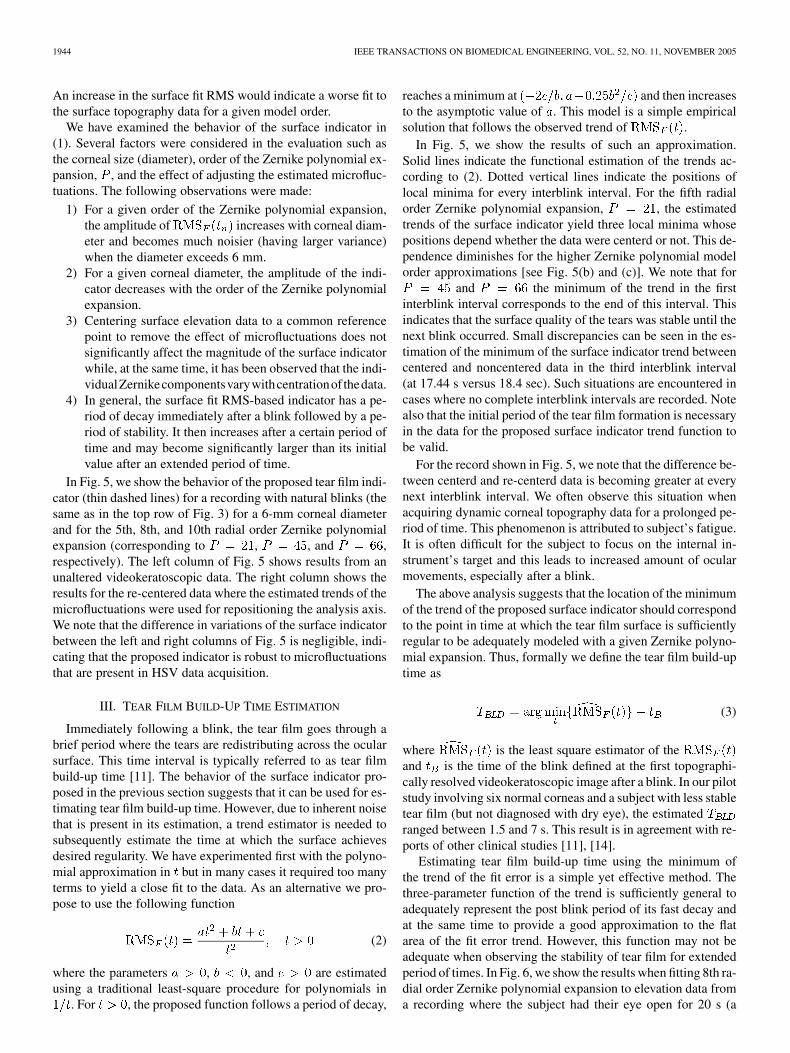
Immediately following a blink, the tear film goes through abrief period where the tears are redistributing across the ocularsurface. This time interval is typically referred to as tear filmbuild-up time [11]. The behavior of the surface indicator pro-posed in the previous section suggests that it can be used for es-timating tear film build-up time. However, due to inherent noisethat is present in its estimation, a trend estimator is needed tosubsequently estimate the time at which the surface achievesdesired regularity. We have experimented first with the polyno-mial approximation in but in many cases it required too manyterms to yield a close fit to the data. As an alternative we pro-pose to use the following function
(2)
where the parameters , , and are estimatedusing a traditional least-square procedure for polynomials in
. For , the proposed function follows a period of decay,
reaches a minimum at and then increasesto the asymptotic value of . This model is a simple empiricalsolution that follows the observed trend of .
In Fig. 5, we show the results of such an approximation.Solid lines indicate the functional estimation of the trends ac-cording to (2). Dotted vertical lines indicate the positions oflocal minima for every interblink interval. For the fifth radialorder Zernike polynomial expansion, , the estimatedtrends of the surface indicator yield three local minima whosepositions depend whether the data were centerd or not. This de-pendence diminishes for the higher Zernike polynomial modelorder approximations [see Fig. 5(b) and (c)]. We note that for
and the minimum of the trend in the firstinterblink interval corresponds to the end of this interval. Thisindicates that the surface quality of the tears was stable until thenext blink occurred. Small discrepancies can be seen in the es-timation of the minimum of the surface indicator trend betweencentered and noncentered data in the third interblink interval(at 17.44 s versus 18.4 sec). Such situations are encountered incases where no complete interblink intervals are recorded. Notealso that the initial period of the tear film formation is necessaryin the data for the proposed surface indicator trend function tobe valid.
For the record shown in Fig. 5, we note that the difference be-tween centerd and re-centerd data is becoming greater at everynext interblink interval. We often observe this situation whenacquiring dynamic corneal topography data for a prolonged pe-riod of time. This phenomenon is attributed to subject’s fatigue.It is often difficult for the subject to focus on the internal in-strument’s target and this leads to increased amount of ocularmovements, especially after a blink.
The above analysis suggests that the location of the minimumof the trend of the proposed surface indicator should correspondto the point in time at which the tear film surface is sufficientlyregular to be adequately modeled with a given Zernike polyno-mial expansion. Thus, formally we define the tear film build-uptime as
(3)
where is the least square estimator of theand is the time of the blink defined at the first topographi-cally resolved videokeratoscopic image after a blink. In our pilotstudy involving six normal corneas and a subject with less stabletear film (but not diagnosed with dry eye), the estimatedranged between 1.5 and 7 s. This result is in agreement with re-ports of other clinical studies [11], [14].
Estimating tear film build-up time using the minimum ofthe trend of the fit error is a simple yet effective method. Thethree-parameter function of the trend is sufficiently general toadequately represent the post blink period of its fast decay andat the same time to provide a good approximation to the flatarea of the fit error trend. However, this function may not beadequate when observing the stability of tear film for extendedperiod of times. In Fig. 6, we show the results when fitting 8th ra-dial order Zernike polynomial expansion to elevation data froma recording where the subject had their eye open for 20 s (a

ISKANDER et al.: EVALUATING TEAR FILM STABILITY IN THE HUMAN EYE WITH HSV 1945
Fig. 5. The RMS of the Zernike polynomial fit error for a recording with natural blinks for P = 21 (a), P = 45 (b), and P = 66 (c) for raw videokeratoscopicdata (left column) and re-centered data (right column). Solid lines indicate the functional estimation of the surface indicator trends. Dotted vertical lines indicatethe positions of local minima for every interblink interval. The corneal diameter was set to 6 mm.
1946 IEEE TRANSACTIONS ON BIOMEDICAL ENGINEERING, VOL. 52, NO. 11, NOVEMBER 2005
Fig. 6. The RMS of the Zernike polynomial fit error for a recording with an open eye for P = 45 for raw videokeratoscopic data (left) and re-centerd data (right).The corneal diameter was set to 6 mm.
person normally blinks once every 5 s). Several observationsare made. There is no initial tear film formation recorded so theproposed trend function cannot be used. We note that the surfaceindicator increases suggesting degradation of the quality of tearfilm in time. The tear film becomes unstable at about the 14ths of recording where the variations in the surface indicator be-come impulsive. Again, no significant differences where foundbetween the use of the raw data and the re-centerd microfluctu-ation-free data. Note however that the variations in the surfaceindicator become slightly smaller after centration in the openeye record. This is mainly because a larger number of sampleswere used for this recording to estimate the polynomial trendsof the deviation of the videokeratoscopic axis from the limbuscenter (see bottom row of Fig. 3). Thus, the proposed surfaceestimator overcomes the problems associated with the currentlypopular surface regularity and asymmetry indices.
IV. TEAR FILM BREAK-UP TIME ESTIMATION
After a blink and the tear build-up phase, the preocular tearfilm undergoes subsequent deformation and may eventuallybreak-up if the eye is left open for a sufficiently long periodof time [1]. The tear film breakup time is loosely defined asa period from the last blink to the first observance of someinstabilities in tear characteristics, such as a disturbance of theprojected grid pattern [4].
The surface indicator proposed above can be used to charac-terize the stability of tear film but it is not suitable for preciseestimation of the tear film break-up time. This is because it isdifficult to place an arbitrary threshold on the amplitude of thesurface indicator at which the tear film is supposedly breakingup. Taking into account the definition of Mengher et al. [4] andthe discussion made earlier on the HSV measurements, it be-comes clear that no robust estimators can be constructed for thetear film break-up time from the estimated videokeratoscopicsurface elevation data. This makes it is essential to use the orig-inal ring pattern images for this task.
The tear film break-up time can be estimated as the time atwhich the quality of the ring patterns in the acquired HSV im-
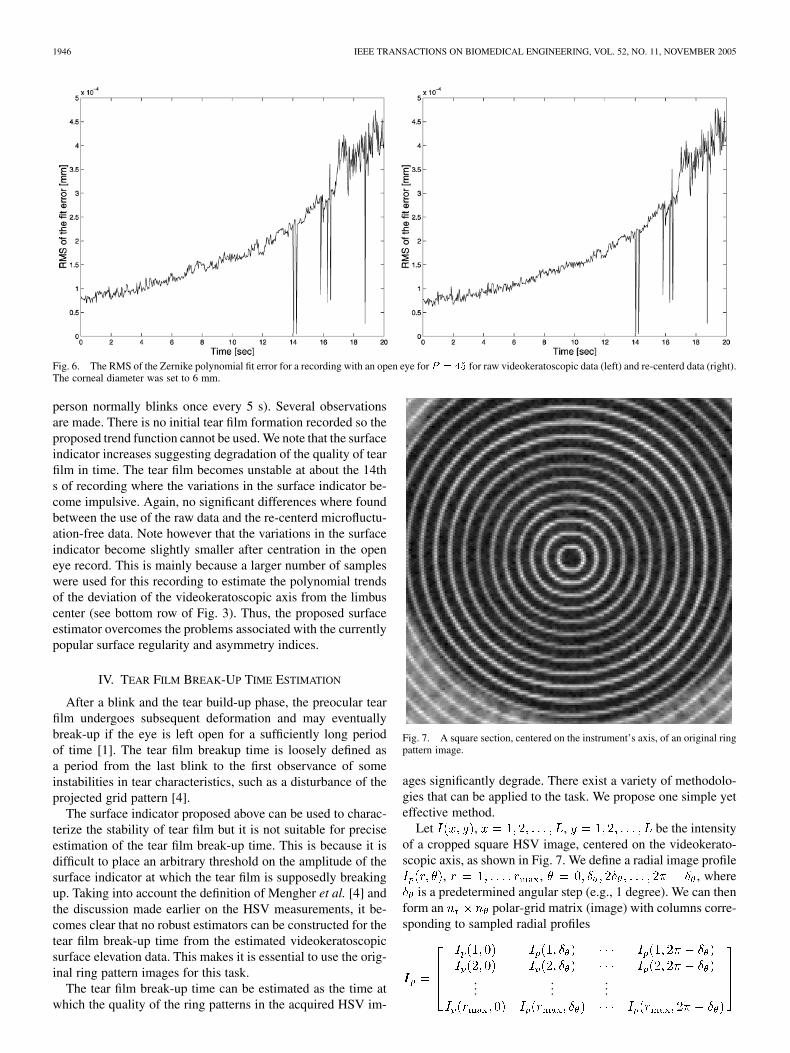
Fig. 7. A square section, centered on the instrument’s axis, of an original ringpattern image.
ages significantly degrade. There exist a variety of methodolo-gies that can be applied to the task. We propose one simple yeteffective method.
Let , , be the intensityof a cropped square HSV image, centered on the videokerato-scopic axis, as shown in Fig. 7. We define a radial image profile
, , , whereis a predetermined angular step (e.g., 1 degree). We can then
form an polar-grid matrix (image) with columns corre-sponding to sampled radial profiles
......
...

ISKANDER et al.: EVALUATING TEAR FILM STABILITY IN THE HUMAN EYE WITH HSV 1947
Fig. 8. A polar coordinate representation of the ring pattern image from Fig. 7.
Fig. 9. The result of Marr-Hildreth edge detection on the polar coordinate ring pattern image from Fig. 8.
where and [26]. An example of a ringimage transformed from Cartesian to polar coordinates where
and is shown in Fig. 8.In the next step, the number of rings needs to be counted in
each of the columns of the polar image to search for disconti-nuities in the ring pattern that often indicate tear film instability.This task is more easily accomplished with binary rather thanwith gray scale images. Thus, we use the Marr-Hildreth edgedetector, which, although having poor localization properties, isvery efficient in finding continuous edges [27]. An example ofthe resulting binary image, , where de-notes the edge detection operator, is shown in Fig. 9. We notethat each ring normally results in two edges so the number ofrings is proportional to the following estimator:
Finally, we propose to use the variance of the abovedefined estimator across the polar ring pattern image,
, as an indicator of the surfaceregularity at the time instant , .
The number of estimated edges may be different for any givenradial sample of the polar image. However, for given it shouldremain relatively constant in time provided that the quality of theacquired images (equivalent to the quality of tear film) is main-tained. The break-up of tear film results in images with local dis-continuities in ring pattern. The location of discontinuities is notknown a priori and that is why we decided to use a global mea-sure of variations in the estimated ring number such as variance.
Examples of the estimated variance of the ring pattern for thetwo previously considered recordings are shown in Fig. 10. Wenote that when the eye is left open for a sufficiently long periodof time, the behavior of proposed regularity indicator has twodistinct regions. The first region is relatively constant while the

1948 IEEE TRANSACTIONS ON BIOMEDICAL ENGINEERING, VOL. 52, NO. 11, NOVEMBER 2005
Fig. 10. The estimated variance of the ring number estimator for recording with an open eye (a) and a recording with natural blinks (b). The thick solid line (a)shows functional estimation of the variance while the thin dotted line indicates the estimate of the tear-film break-up time at 13.15 s.
second region, after certain period of time, can be estimated bya quadratic function.
Thus, for the purpose of estimating the tear-film break-uptime, we will use the following function:
forfor
(4)where , , , and are real parameters thatare to be estimated using an iterative (in ) least squares proce-dure. An example of such an estimated function is shown with athick solid line in Fig. 10. The estimator of the time of transitionfrom the constant region to the quadratic region of , ,can be considered as the estimator of the tear-film break-up time.
Note that in normal blinking as shown in Fig. 10(b),the proposed estimator does not provide valid results, i.e.,
, which suggests that there is no significant tearfilm break-up in the considered interblinks intervals.
V. CONCLUSION
We have developed two new indicators for the evaluation oftear film stability in the context of HSV. We used these indicatorsto construct estimators for tear film build-up and break-up times.
The first indicator is based on the statistics of the error be-tween the measured surface and its parametric model. In par-ticular, a model based on orthogonal Zernike polynomials wasused. The choice of this model was dictated by the popularityof this surface representation amongst vision researchers. How-ever, other models such as the Taylor series expansion, for ex-ample, would be equally effective provided that the model orderis sufficiently high to accurately capture the irregularities of theprecorneal tear film surface. For the Zernike polynomial expan-sion, we have established that the 8th radial order expansion,
, is adequate.The second indicator is based on the variance of the ring
counter. Again, the implementation of such an estimator is not
unique. Many edge detection techniques can be employed inplace of the Marr-Hildreth routine.
The two proposed surface indicators share one commonfactor in that they are based on statistics. This allows the newsurface indicators to overcome the limitation of their prede-cessors [15], [11]–[14] which, in contrast, are not suitable inHSV unless the effect of ocular microfluctuations is accountedfor. However, accurate evaluation of ocular microfluctuationsis computationally expensive making the proposed surfaceindicators particularly attractive.
ACKNOWLEDGMENT
The authors would like to thank G. Frisken of Medmont Pty.,Ltd., for assistance in developing the high-speed videokerato-scope and for writing the routine for image format conversion.They would also like to thank S. Voetz for assistance in clinicaldata collection.
REFERENCES
[1] K. Tsubota, “Tear dynamics and dry eye,” Progress in Retinal and EyeResearch, vol. 17, pp. 556–596, 1998.
[2] M. S. Norn, “Desiccation of the precorneal film. I. Corneal wettingtime,” Acta Ophthalmologica, vol. 47, pp. 865–880, 1999.
[3] L. S. Mengher, K. S. Pandher, and A. J. Bron, “Non-invasive tear filmbreak-up time: Sensitivity and specificity,” Acta Ophthalmologica, vol.64, pp. 441–444, 1986.
[4] L. S. Mengher, A. J. Bron, S. R. Tonge, and D. J. Gilbert, “A noninva-sive instrument for the clinical assessment of the pre-corneal tear filmstability,” Curr. Eye Res., vol. 4, pp. 1–7, 1985.
[5] H. Oguz, N. Yokoi, and S. Kinoshita, “The height and radius of the tearmeniscus and methods for examining these parameters,” Cornea, vol.19, pp. 497–500, 2000.
[6] T. J. Licznerski, J. Marek, J. Jakubaszko, and H. T. Kasprzak, “Evalua-tion of tear film stability by means of laser interferometry” (in Polish),Klinika Oczna, vol. 103, pp. 125–128, 2001.
[7] A. Khamene, S. Negahdaripour, and S. C. Tseng, “A spectral-discrimi-nation method for tear-film lipid-layer thickness estimation from fringepattern images,” IEEE Trans. Biomed. Eng., vol. 47, no. 2, pp. 249–258,Feb. 2000.
[8] N. Yokoi and A. Komuro, “Non-invasive methods of assessing the tearfilm,” Exp. Eye Res., vol. 78, pp. 399–407, 2004.

ISKANDER et al.: EVALUATING TEAR FILM STABILITY IN THE HUMAN EYE WITH HSV 1949
[9] L. N. Thibos and X. Hong, “Clinical applications of the Shack-Hartmannaberrometer,” Opt. Vis. Sci., vol. 76, no. 12, pp. 817–825, 1999.
[10] N. L. Himebaugh, L. N. Thibos, A. Bradley, G. Wilson, and C. G. Be-gley, “Predicting optical effects of tear film break up on retinal imagequality using the Shack-Hartmann aberrometer and computational op-tical modeling,” Adv. Exp. Med. Biol., vol. 506, pp. 1141–1147, 2002.
[11] J. Nemeth, B. Erdelyi, B. Csakany, P. Gaspar, A. Soumelidis, F. Kahlesh,and Z. Lang, “High-speed videokeratoscopy measurement of tear filmbuild-up time,” Invest. Ophthalmol. Visual Sci., vol. 43, pp. 1783–1790,2002.
[12] T. Goto, X. Zheng, S. D. Klyce, H. Kataoka, T. Uno, M. Karon, Y. Tatem-atsu, T. Bessyo, K. Tsubota, and Y. Ohashi, “A new method for tear filmstability analysis using videokeratoscopy,” Am. J. Ophthalmol., vol. 135,pp. 608–612, 2003.
[13] T. Goto, X. Zheng, S. D. Klyce, H. Kataoka, T. Uno, M. Yamaguchi, M.Karon, S. Hirano, S. Okamoto, and Y. Ohashi, ““Evaluation of the tearfilm stability after laser in situ Keratomileusis using tear film stabilitysystem,”Surface asymmetry index, SAI,” Am. J. Ophthalmol., vol. 137,pp. 116–120, 2004.
[14] T. Kojima, R. Ishida, M. Dogru, E. Goto, Y. Takano, Y. Matsumoto, M.Kaido, Y. Ohashi, and K. Tsubota, “A new noninvasive tear stabilityanalysis system for assessment of dry eyes,” Invest. Ophthalmol. VisualSci., vol. 45, pp. 1369–1374, 2004.
[15] S. A. Dingeldein, S. D. Klyce, and S. E. Wilson, “Quantitative descrip-tors of corneal shape derived from computer-assisted analysis of pho-tokeratographs,” J. Refractive Corneal Surg., vol. 5, pp. 372–378, 1989.
[16] T. Buehren, B. J. Lee, M. J. Collins, and D. R. Iskander, “Ocularmicrofluctuations in videokeratoscopy,” Cornea, vol. 21, pp. 346–351,2002.
[17] R. M. Steinman, G. M. Haddad, A. A. Skavenski, and D. Wyman,“Miniature eye movements,” Science, vol. 181, pp. 810–819, 1973.
[18] M. R. Morelande, D. R. Iskander, M. J. Collins, and R. Franklin, “Au-tomatic estimation of the corneal limbus in videokeratoscopy,” IEEETrans. Biomed. Eng., pt. 2, vol. 49, no. 12, pp. 1617–1625, Dec. 2002.
[19] J. Rissanen, “Modeling by shortest data description,” Automatics, vol.14, pp. 465–471, 1978.
[20] M. J. Collins, B. Davis, and J. Wood, “Microfluctuations of steady stateaccommodation and the cardiopulmonary system,” Vis. Res., vol. 35, pp.2491–2502, 1995.
[21] J. Schwiegerling, J. E. Greivenkamp, and J. M. Miller, “Representationof videokeratoscopic height data with Zernike polynomials,” J. Opt. Soc.Am., vol. 12, pp. 2105–2113, 1995.
[22] D. R. Iskander, M. R. Morelande, M. J. Collins, and B. Davis, “Modelingof corneal surfaces with radial polynomials,” IEEE Trans. Biomed. Eng.,vol. 49, no. 4, pp. 320–328, Apr. 2002.
[23] A. Langenbucher, A. Viestenz, and B. Seitz, “Conoidal fitting of cornealtopography height data after excimer laser penetrating keratoplasty,”Journal of Refractive Surgery, vol. 18, pp. 63–70, 2002.
[24] D. R. Iskander, M. J. Collins, and B. Davis, “Optimal modeling ofcorneal surfaces with Zernike polynomials,” IEEE Trans. Biomed. Eng.,vol. 48, no. 1, pp. 87–95, Jan. 2001.
[25] D. R. Iskander, M. J. Collins, M. R. Morelande, and M. Zhu, “Analyzingthe dynamic wavefront aberrations in the human eye,” IEEE Trans.Biomed. Eng., vol. 51, no. 11, pp. 1969–1980, Nov. 2004.
[26] D. R. Iskander, M. J. Collins, S. Mioschek, and M. Trunk, “Automaticpupillometry from digital images,” IEEE Trans. Biomed. Eng., vol. 51,no. 9, pp. 1619–1627, Sep. 2004.
[27] D. Marr and E. C. Hildreth, “Theory of edge detection,” in Proc. Roy.Soc. Lond. B, vol. 207, 1980, pp. 187–217.
D. Robert Iskander (M’98–SM’04) received theMagister Inzynier degree in electronic engineeringfrom the Technical University of Lodz, Lodz, Poland,in 1991, and the Ph.D. degree in signal processingfrom Queensland University of Technology (QUT),Kelvin Grove, Australia, in 1997.
From 1996 to 2000, he was a Research Fellow atthe Signal Processing Research Centre, the Cooper-ative Research Centre for Satellite Systems, and theCentre for Eye Research, QUT. In 2001, he joined theSchool of Engineering, Griffith University as a Senior
Lecturer. In July 2003, he returned to the Centre for Health Research (Optom-etry) as a Principal Research Fellow. Since April 2004, he is with the Institute ofHealth and Biomedical Innovation, Brisbane, Australia, as a Senior Researcher.He is also an Honorary Fellow at Griffith University. His current research inter-ests include statistical signal processing, visual optics, and optometry.
Dr. Iskander is a member of the Association for Research in Vision and Oph-thalmology.
Michael Collins received the Dip.App.Sc. (Optom),M.App.Sc., and Ph.D. degrees from Queensland Uni-versity of Technology, Brisbane, Australia, in 1977,1988, and 1996, respectively.
He is an Associate Professor in the School of Op-tometry at the Queensland University of Technology,Brisbane, Australia. His research laboratory, the Con-tact Lens and Visual Optics Laboratory, specializesin the visual and optical characteristics of the corneaand contact lenses.
Dr. Collins is a member of the Optometrists As-sociation of Australia, Fellow of the American Academy of Optometry and aFellow of the Contact Lens Society of Australia.
Brett Davis graduated with a Bachelor of AppliedScience (physics) from Queensland University ofTechnology (QUT), Brisbane, Australia in 1990.
He is a Senior Research Assistant in the Centre forEye Research at the QUT. He has been involved invarious research projects within the Contact Lens andVisual Optics Laboratory, Centre For Eye Research,QUT. His interests include visual optics and opticaldesign.