ieee transactions on computers, vol., no. …student.ulb.ac.be/~llerman/papers/ieeetc.pdfliran...
TRANSCRIPT

IEEE TRANSACTIONS ON COMPUTERS, VOL. ?, NO. ?, ? ? 1
Start Simple and then Refine:Bias-Variance Decomposition as a Diagnosis
Tool for Leakage ProfilingLiran Lerman, Nikita Veshchikov, Olivier Markowitch, Francois-Xavier Standaert
Abstract—Evaluating the resistance of cryptosystems to side-channel attacks is an important research challenge. Profiled attacksreveal the degree of resilience of a cryptographic device when an adversary examines its physical characteristics. So far, evaluationlaboratories launch several physical attacks (based on engineering intuitions) in order to find one strategy that eventually extractssecret information (such as a secret cryptographic key). The certification step represents a complex task because in practice theevaluators have tight memory and time constraints. In this paper, we propose a principled way of guiding the design of the mostsuccessful evaluation strategies thanks to the (bias-variance) decomposition of a security metric of profiled attacks. Our results showthat we can successfully apply our framework on unprotected and protected algorithms implemented in software and hardware.
Index Terms—Side-channel attacks, profiled attacks, bias-variance decomposition, diagnosis tool, evaluation tool.
F
1 INTRODUCTION
In 1996, Kocher introduced side-channel cryptanalysesthat analyze physical characteristics (called leakages or traces)of cryptographic devices in order to extract secret infor-mation [21]. The rationale is that the leakages of (hard-ware and software) implementations depend on the ma-nipulated data and the executed operations. As a result,cryptographic algorithms secured from a point of view ofclassical cryptanalysis can be insecured when implementedin devices. Kocher exploited the execution time in order torecover the secret key from several crypto systems. In 1999,Kocher extended the previous proposition with (differential)power analysis that compare the outputs of a leakage model(parameterized by secret key hypotheses) with the actualpower leakages [22]. Nowadays, cryptanalytic side channelattacks also employ other sources of emanations such asthe electromagnetic radiation [14] and the sound [15]. Inthis paper, we focus on side-channel attacks based on thepower consumption and the electromagnetic radiation asboth leakages can be addressed using the same techniques.
The evaluators of the robustness of cryptographic de-vices usually analyze several (evaluation) settings by vary-ing, for example, the leakage dimension, the number ofleakages as well as the distinguishers (that compare actualleakages with the modeled leakages). The large number ofpossible evaluation settings requires to consider a significantnumber of attack strategies that also depend on the a prioriinformation on the target device. Non-profiled attacks (intro-duced by Kocher [22]) work under the assumption that theadversary has a priori knowledge on the physical behavior
• L. Lerman, N. Veshchikov and O. Markowitch are affiliated with theQualSec group from the Universite libre de Bruxelles in Belgium.
• F.-X. Standaert is affiliated to the ICTEAM/ELEN/Crypto Group of theUniversite catholique de Louvain in Belgium.
• Corresponding author e-mail: [email protected]
of the cryptographic device (e.g., the power consumptionof a device linearly correlates to the manipulated data). Bycontrast, profiled attacks exploit an offline learning step (alsoknown as profiling step) executed on a device (similar tothe target device) in order to automatically extract knowl-edge about the leakage function [12]. We focus on profiledattacks introduced as the strongest leakage analysis in aninformation theoretic sense [4].
In practice, profiled attack strategies still require (1)to minimize the number of estimated parameters of theleakage model due to a limited number of measurementsavailable during the learning phase (that can lead to es-timation error), and (2) to assume some knowledge on theleakage distribution (that can lead to assumption error) whenthe adversary considers parametric profiled attacks. Theseconstraints lead the cryptographic community to propose aplethora of profiled attacks, e.g., [4], [23], [25], [31].
1.1 Our contributionsIn Eurocrypt 2014, Durvaux et al. proposed a certification toolto determine whether the estimated profiled attacks sufferfrom an assumption error or from an estimation error [11](it was then simplified/specialized in 2016 [10]). Here wecomplement the certification tool by providing a diagnosistool (based on the bias-variance decomposition [8], [9], [24])that guides the design of the best profiled attack optimizingone or several constraints decided by the evaluation labo-ratory (e.g., maximizing the success probability of profiledattacks with 5 attack traces measured on the target deviceor minimizing the number of leakages required to reach thesuccess probability of 0.7) or assumed by the implementedscheme (e.g., maximizing the success probability of profiledattacks from a single leakage measured on a fresh re-keyingscheme [28]).
As far as we know, the certification process of cryp-tographic devices consists of testing several popular pro-

IEEE TRANSACTIONS ON COMPUTERS, VOL. ?, NO. ?, ? ? 2
filed attacks with several settings in order to find the beststrategy. Nevertheless, this approach requires a significantcomputational power. Here, we promote a technique thatstarts with a specific evaluation setting (e.g., a low numberof leakages with a simple attack) and then refines theattack according to our diagnosis tool. The rationale toconsider simple settings at the beginning of the evaluationlies to a variance issue: the success probability of profiledattacks with excessive complexity could be lower than thesuccess probability of simpler approaches (due to varianceissues). Note also that complex approaches suffer from hightime/memory complexity: the time/memory complexity in-creases as a function of (1) the number of points per leakage,(2) the number of leakages exploited during the learningand the attack steps, and (3) (especially against protecteddevices) the complexity of the attack.
Our diagnosis tool works in a systematic way (1) byextracting each term impacting the error rate, and (2) byreducing the contribution of those terms in order to reacha lower error rate, optionally with respect to constraintsfixed by the evaluator (such as the number of leakages usedduring the learning step). As the last step, an evaluator canapply the certification tool of Durvaux et al. in order togauge the quality of the best attack found with the diag-nosis tool whether the framework advises a profiled attackproviding probabilities for each target value (also known asa probability-based profiled attack)1. It is worth to note thatour diagnosis tool works on probability-based and score-based profiled attacks. We apply our framework to test eightpopular profiled attacks on actual datasets as well as onsimulated leakages. We demonstrate the usefulness of ourdiagnosis tool by applying our framework on unprotectedand protected (software and hardware) implementations.
1.2 Related works
Our framework represents a counterpart in the profiled at-tack approach of the recently proposed non-profiled stepwiselinear regression attacks [36]. More precisely, the stepwiselinear regression techniques tune the parameters of specificprobability-based non-profiled attacks while our approachapplies to all types of profiled attacks. Similarly, our di-agnosis tool extends the papers of Choudary et al. thatreport several guidelines in the context of template attacksand stochastic attacks (representing well known probability-based profiled attacks) [5], [6]. All the hints proposed byChoudary et al. can be used in our diagnosis tool to avoidseveral numerical and estimation issues as well as to reducethe running time of the attacks (e.g., by exploiting dimen-sionality reduction techniques and efficient profiled attacks).
The main advantages of our approach are: (1) the frame-work can be applied to any profiled attack (includingprobability-based and score-based profiled attacks) thanksto the decomposition of a security metric (for example thesuccess rate or success probability, put forward by Standaertet al. [33]), (2) the framework operates without any knowl-edge of the true leakage distribution, and (3) the frameworkworks on unprotected and protected implementations.
1. The certification tool of Durvaux et al. operates only on probability-based profiled attacks.
We base our approach on the bias-variance decompo-sition [8], [9], which was recently introduced to the field ofside-channel analysis by Lerman et al. [24]. Our paper differsfrom the paper of Lerman et al. in three main points:
1) We use the bias-variance decomposition for differ-ent goals. We do not only use this tool in order tofind out what impacts the error rate of template at-tacks and stochastic attacks but we also exploit thistool in order to extract the best profiled attack (i.e.,fine-tune the meta-parameters). Thus, we providea framework that can be efficiently applied duringthe evaluation of cryptographic systems taking intoaccount real-world constraints.
2) We study additional profiled attacks in order tocover all types of profiled attacks. We do not onlyanalyze probability-based profiled attacks (i.e., tem-plate attacks and stochastic attacks) but we ad-ditionally study score-based profiled attacks anddemonstrate that our diagnosis tool can be used onany profiled attacks.
3) We conducted the experiments in different settings.We do not only test attacks on simulated leakages(that highlight the usefulness of this approach froma theoretical point of view) but we also considerexperiments on real power traces collected on anunprotected and a protected implementations (inhardware and in software), which allows to evaluateour diagnosis tool in practice.
1.3 Organization of this paperThe rest of the paper is organized as follows. Section 2contains preliminary notions on physical attacks. Section 3provides introduction to the bias-variance decomposition.Section 4 details our diagnosis tool, and the results of itsapplication on profiled attacks against unprotected softwareas well as hardware implementations. Section 5 extends theresults of Section 4 to a protected environment. Section 6analyses the impact of an assumption made during theexperiments. Finally, Section 7 concludes the paper.
2 BACKGROUND ON SIDE-CHANNEL ATTACKS
2.1 Physical attacksWe assume that the adversary wants to retrieve the secretkey used when the cryptographic device (that executes aknown encryption algorithm) encrypts known plaintexts.In order to find the secret key, the adversary targets aset of key-related information (called the target intermediatevalues) with a divide-and-conquer approach. The divide-and-conquer strategy extracts information on separate parts ofthe secret key (e.g., the adversary extracts each byte of thekey independently) and then combines the results in orderto get the full secret key. In the following, we systematicallyuse the term key to denote the target of our attacks, though,in fact, we address one byte at a time.
During the execution of the encryption algorithm, thecryptographic device processes a function f (e.g., the SBoxof the block-cipher AES)
f : P ×K → Y (1)y = fk(p),

IEEE TRANSACTIONS ON COMPUTERS, VOL. ?, NO. ?, ? ? 3
that outputs the target intermediate value y and wherek ∈ K is a key-related information (e.g., one byte of thesecret key), and p ∈ P represents information known by theadversary (e.g., one byte of the plaintext). For the sake ofsimplicity, we assume that (1) the function f is bijective, (2)the output of the function f is encoded using 8 bits, and (3)the adversary targets one byte of the key.
2.1.1 Side-channel attacksLet jT y be the j-th leakage measured when the devicemanipulates the value y. In the following, we represent eachleakage with a vector of real values measured at differentinstants on the analyzed device. The number of samples(i.e., the length of the vector jT y) equals to n in unprotectedcontexts. We denote j
tT y the j-th leakage (associated to thetarget value y) measured at time t such that:
jtT y = tL (y) + j
tεy, (2)
= tL (fk (p)) + jtεy, (3)
where jtεy ∈ R is the noise of the trace j
tT y (i.e., a standardadditive noise assumption defined by Mangard et al. [26])following for example a Gaussian distribution, and tL isthe (deterministic) leakage function at time t. Let assumethat the adversary targets the output of the function fk (p).The function tL can be linear or nonlinear of the outputbits of fk (p) [1]. More precisely, we say that the leakagefunctions are linear if they provide leakages j
tT y dependingon the weighted sum of each bit of the output of fk (p)while nonlinear leakage functions provide leakages j
tT y
depending on the weighted sum of products of bits of theoutput of fk (p). Formally, we consider polynomial (leakage)functions tL (y), i.e.:
tL (y) = tc+∑u
tαu gu (y), (4)
where tc and tαu are real numbers while gu(y) is a mono-mial of the form
∏b∈B Bitb (y) in which Bitb (y) returns
the b-th bit of y and B ⊂ 1, 2, ..., 8. This representsa usual assumption in side-channel attacks [31]. Linearleakage functions consider that the cardinality of B in eachmonomial equals to 1 while nonlinear leakage functionscontain monomials (with a non-zero coefficient) of the form∏
b∈B Bitb (y) in which the cardinality of B is strictly biggerthan 1. Evaluators often model leakage functions as (1)the Hamming weight of the manipulated value y (denotedHW(y)) for software implementations (representing a linearleakage function), and (2) the Hamming distance (HD)between two manipulated values for hardware implemen-tations (representing a nonlinear leakage function since if aand b are in 0, 1, then the Hamming distance between aand b equals to a+ b− 2ab)2.
A side-channel attack is a process during which an attackeranalyses leakages measured on a target device in order toextract information on the secret value. In order to protectthe implementations against physical attacks, the designersemploy (among others) d-order masking techniques thatsplit each sensitive information y (that depends on thesecret key) in d + 1 uniformly distributed variables (called
2. Note that the HD is linear if viewed as a function of the bit flips.
shares), denoted x0, x1, ..., xd, such that y =∑d
i=0 xi(where
∑represents the method combining shares) [3], [16].
Typically, the shares x1, ..., xd represent d uniformly dis-tributed random values (called the masks) while x0 equalsto y +
∑di=1 xi. The masking schemes (of order d) leak
no information on the sensitive variable y whenever theadversary combines strictly less than d+ 1 different instantsin order to recover the sensitive information (when eachsample depends on a different share). In the following, weassume that the masking techniques of order d use d + 1shares, leading to (d + 1, d + 1) secret sharing schemes.Furthermore, in protected contexts, we denote n the numberof samples in the vector jT y associated to one share (i.e., jT y
contains n× (d+ 1) samples in total).Profiled attacks (belonging to side-channel attacks) rep-
resent efficient attacks thanks to a learning step (also knownas a profiling step). More precisely, these approaches builda distinguisher A(TPS, TAS) that:
1) during the profiling step, it estimates a parameterθ with a set of leakages (called profiling set anddenoted TPS) containing Np (profiling) traces pertarget value, and
2) during the attack step, it returns the extracted secretkey k from a set of attack leakages TAS (calledattacking set) measured on the target device usinga constant secret key.
The quality of the distinguisher can be analyzed by estimat-ing the success rate, i.e. the probability that the distinguisherreturns the right key based on a set of attack traces. The errorrate equals to the probability that the distinguisher does notreturn the right key based on the attacking set.
The Bayes classifier (also known as the Bayes) denotes thebest possible theoretical attack which practical attacks canreach when there is no assumption error and no estimationerror. More formally, let Ab(·) be the Bayes classifier thattakes as input a set of attack traces TAS, the function Ab(·)represents a classifier that minimizes the error rate, i.e.:
Ab(TAS) ∈ argmaxk∈K
Pr [k | TAS] (5)
= argmaxk∈K
Pr [TAS | k]× Pr [k] . (6)
Note that several values k could maximize the valuePr [TAS | k]×Pr [k], leading to a set of possible keys (whichexplains the symbol ∈ in Equation 5). Note also that, inthe side-channel attacks literature, the Bayes classifier repre-sents the model estimating Equation 6 while, in this paper,the Bayes classifier refers to the optimal classification withknown probability density functions used in Equation 6.
2.2 Concrete distinguishers
In practice, an adversary estimates the Bayes classifier (i.e.,the Equation 6) with concrete distinguishers detailed in thissection. In the following, we define the complexity of an attackby the number of parameters to estimate (i.e., for a givendistinguisher, an increase of the number of parameters toestimate leads to an increase of the complexity of the attack).

IEEE TRANSACTIONS ON COMPUTERS, VOL. ?, NO. ?, ? ? 4
2.2.1 Template attacks
(Gaussian) Template attacks (TA) [4] estimates the Equation 6by assuming that Pr
[jT y | y
]follows a Gaussian distri-
bution N (µy, Σy) for each value y where µy and Σy arerespectively the sample mean and the sample covariancematrix of the traces associated to y. In what follows weassume that the noise is independent of y in unprotectedcontexts [6]. This property allows to estimate the samephysical noise (represented by Σ) for all the target values. Bycontrast, in protected settings exploiting first-order maskingschemes, we assume that the adversary has no informationon the shares (except the instants depending on the shares)during the profiling step leading to a dependency betweenthe second-order moment Σy and the sensitive informationy. Note that the adversary can know the mask values duringthe profiling step and still not use them in order to speedup the attack phase by exploiting less templates. In thefollowing we will relax this assumption, which leads to an-other attack (that we call stochastic-based mixture attacks).Note also that template attacks using no information on themask values (during the profiling step) allow us to highlightthe effect on the outputs given by the diagnosis tool whenthe evaluators exploit bias models. Indeed, in protectedcontexts, template attacks (unlike template-based mixtureattacks that take into account the mixture structure of theprobability density function) represent biased models sincethese attacks assume that the leakages associated to a sensi-tive information y (split in several shares x0, ..., xd) followa Gaussian distribution (i.e., by estimating Pr
[jT y | y
]with
one Gaussian distribution) while the leakages follow a mul-timodal distribution, i.e.:
Pr[jT y | y
]=
∑x1,...,xd
Pr
[jT y | x1, ..., xd, x0 = y +
d∑i=1
xi
]× Pr [x0, ..., xd] , (7)
where Pr[jT y | x1, ..., xd, x0 = y +
∑di=1 xi
](in which the
symbols∑
and + represent the methods combining shares)follows a Gaussian distribution if we consider Gaussiannoise. In other words, although the unbiased/optimal pro-filed attacks represent the Gaussian mixture templates at-tacks (in which the adversary estimates the multimodalGaussian distribution with a mixture of Gaussian distribu-tions), we exploit (unimodal) template attacks that work ifthe first or the second order moments contain informationon the target value (e.g., unimodal template attacks ap-plied on first-order masking schemes). Note that unimodaltemplate attacks extract the same quantity of informationfrom the leakages as template-based mixture attacks if theleakages contain a high physical Gaussian noise and ifthe target implementation executes a first-order maskingscheme (as reported by Grosso et al. [17]).
During the attack step, the adversary classifies TAS =1T , ...,NaT
(where jT denotes the j-th measurement on
the target device, and Na is the number of attack traces) by
using the equation:
k ∈ arg maxk∈K
Na∏j=1
Pr[jT | y = fk(pj)
]× Pr [y = fk(pj)], (8)
≈ arg maxk∈K
Na∏j=1
Pr[jT | y = fk(pj); θy
]× Pr [y = fk(pj)] , (9)
where θy = µy, Σy, and pj is the j-th plaintext used by thedevice when the adversary measured the j-th attack trace.
2.2.2 Stochastic attacks and stochastic-based mixture at-tacksStochastic attacks (SA) [31] model the leakage information attime t as a function of the target value y with a regressionmodel h spanned by U functions gu (where u ∈ [1;U ]), i.e.:
jtT y = h (y, tθ) + j
tεy, (10)
= tc+U∑
u=1
tαu gu (y) + jtεy, (11)
where tθ = tc, tα1, ..., tαU ∈ RU+1 represents the param-eter of the regression model h at time t. Stochastic attacksassume that gu is a monomial of the form
∏b∈B Bitb (y)
where Bitb (y) returns the b-th bit of y and B ⊂ 1, 2, ..., 8.We define the degree of a stochastic attack as the maximum
number of variables in each monomial of h with a non-zero coefficient. More formally, stochastic attacks of degreei contain all the monomials of the form
∏b∈B Bitb (y) in
which the cardinality of B is in 1, 2, ..., i. We denote SAistochastic attacks of degree i (e.g., SA1 denotes stochasticattacks of degree 1). Note that, in unprotected contexts, tem-plate attacks are equivalent to stochastic attacks of degree 8when the adversary estimates only one Σ for all the targetvalues (see Section 2.2 “Profiled attacks” in [24]). As a result,in unprotected contexts, stochastic attacks of degree strictlyless than 8 represent distinguishers with lower complexitythan template attacks.
In protected environments, each function h takes asinput the value of one share. For example, if the devicemanipulates the share xi at time t, then stochastic attacksmodelize the deterministic part of the leakage at time tby h (xi, tθ). As a result, unlike with template attacks, weassume that the stochastic attacks (that we call stochastic-based mixture attacks in protected contexts) know the valueof the manipulated masks during the profiling step.
Regarding the attack step against an unprotectedimplementation, the adversary uses Equation 8 by as-suming that Pr
[jT y | y
]follows the Gaussian distribu-
tion N (h (y, θ),Σ) where h(y, θ) represents the vector[h(y, 1θ), h(y, 2θ), ..., h(y, nθ)], n represents the number ofsamples (i.e., the length of jT y), and Σ is the covariancematrix of the residual term3. In a protected environment,due to the fact that the adversary has no a priori knowledgeon the value of the manipulated masks during the attack
3. The residual term represents the deviation of the actual leakages(associated to known keys and known plaintexts) from the outputprovided by the estimated leakage model (parametrized with the samekeys and plaintexts).

IEEE TRANSACTIONS ON COMPUTERS, VOL. ?, NO. ?, ? ? 5
step, we consider stochastic-based mixture attacks iteratingon all the possible mask values, leading to the selection of kmaximizing the following equation:
Na∏j=1
∑x1,...,xd
Pr
[jT | x1, ..., xd, y = fk(pj), x0 = y +
d∑i=1
xi
]× Pr [x0, ..., xd] . (12)
In other words, in protected contexts, we define thestochastic-based mixture attacks as a (finite) sum (alsoknown as a mixture) of Gaussian distributions given thatPr[jT | x1, ..., xd, y = fk(pj), x0 = y +
∑di=1 xi
]follows a
Gaussian distribution if we consider Gaussian noise. Asa result, unlike profiled attacks which ignore the mixturestructure, attacks (whether classical template or stochastic-based) which model the mixture structure represent unbi-ased models (if the leakages contain Gaussian noise andif the stochastic-based model contains the right degree)since such adversaries take into account the multimodalstructure of the probability density function associated toeach sensitive value y split in several shares.
2.2.3 Profiled correlation power analysisIn 2000, Coron et al. [7] and Mayer-Sommer [27] proposedthe Correlation Power Analysis (CPA) that recover the keyfrom the target device by selecting the key that maximizesthe absolute value of the (Pearson) correlation betweenthe actual leakages and the estimated leakages based onthe assumed secret key. Profiled Correlation Power Anal-ysis (PCPA) model the leakage function of each instant froma profiling set with a model. More precisely, PCPA basedon template attacks (denoted PCPA-TA) consider that theleakage model associated to the target value y equals to µy
while PCPA based on stochastic attacks of degree i (denotedPCPA-SAi) assume that the leakage model equals to h(y, θ).As a result, PCPA skip the estimation of the Σ parameter.In the following, we will show that the diagnosis tool alsoworks on score-based profiled attacks by exploiting PCPA.
3 BIAS-VARIANCE DECOMPOSITION OF THE ER-ROR RATE
In this section, we detail the bias-variance decomposition (ofthe error rate) used in our decision tool and recently intro-duced in the side-channel literature by Lerman et al. [24].
3.1 Preliminary notions
Domingos showed that the error rate of a classifier can bedecomposed into three components [8], [9]: the error rate ofthe Bayes classifier Rb(·), the bias B(·) and the variance V(·),generally leading to the equality:
Error rate =ETAS[c1 × Rb(TAS)] (13)
+ ETAS[B(TAS)] Bias
+ ETAS[c2 × V(TAS)] , Variance
where E denotes the mean operator, the two values c1 andc2 are in R, and Rb(TAS), B(TAS) and V(TAS) are threefunctions providing values in R.
The loss function (denoted LOSS(k, k′)) represents thecost of predicting k′ when the true target value is k. In thispaper we consider the zero-one loss function: the cost is zerowhen k equals to k′ and one in the other case.
The main prediction (denoted Am(TAS)) represents themost frequent prediction on the set of attack traces TAS
given by the estimated classifier when varying the profilingsets4. The bias term represents the difference (accordingto the loss function) between the main prediction and theprediction provided by the Bayes classifier, i.e.:
B(TAS) = LOSS(Am(TAS),Ab(TAS)). (14)
The variance measures the variation of a prediction on a setof attack traces as a function of different profiling sets, i.e.:
V(TAS) = ETPS [LOSS(Am(TAS),A(TAS, TPS))] , (15)
where A(TAS, TPS) represents a profiled attack using theprofiling set TPS and the attacking set TAS.
Based on these notations, Domingos demonstrated thatthe multiplicative factors c1 and c2 equal:
c1 = Pr [A = Ab]− Pr [A 6= Ab]× Pr [A = k | Ab 6= k] , (16)
c2 =
−Pr [A = Ab | A 6= Am] Am 6= Ab
1 Am = Ab, (17)
where A = A(TAS, TPS), Ab = Ab(TAS) and Am = Am(TAS).Figure 1 illustrates the bias-variance decomposition for
two profiled attacks. In this figure, attack 1 contains a highbias (since the most frequent prediction given by attack 1differs from the output of the Bayes classifier) but a smallervariance compared to attack 2.
In the following, we use the terms bias and vari-ance to denote respectively the average of the bias (i.e.,ETAS [B(TAS)]) and the weighted average of the variance(i.e., ETAS [c2 × V(TAS)]). As a result, this weighted varianceterm can be negative according to the value of c2.
3.2 Estimation of the bias and of the variance termsIn practice, the evaluator has one data source which he ran-domly splits into two disjoint subsets: a profiling source andan attack source. The first source provides leakages usedto build the classifiers while the second source generatesleakages to estimate the error rate, the bias and the variance.
Following the proposition of Valentini et al. [34], in ourexperiments, in order to decompose the error rate of anattack A(·, ·) we build a set of distinguishers (of the samecomplexity5 and evaluation settings) created with differentprofiling sets generated by sampling (with replacement) theprofiling source. This resampling approach provides severaldistinguishers with different estimated parameters θ. We es-timate the bias and the variance terms by sampling (withoutreplacement) the attack source. More precisely, we averagethe estimated bias and the estimated variance obtained oneach attacking set sampled from the attack source.
4. The generated profiling sets have the same cardinality (e.g., inunprotected contexts, each set contains Np leakages per target valueand n samples per leakage) and they are sampled from the space ofsets of leakages.
5. The complexity of an attack is defined by the number of parametersto estimate (as presented in Section 2.2).

IEEE TRANSACTIONS ON COMPUTERS, VOL. ?, NO. ?, ? ? 6
Bias−variance decomposition
Key hypotheses
Pro
babi
lity
0 20 40 60 80 100 120
0.0
0.1
0.2
0.3
0.4
Target
Attack 1Attack 2
Fig. 1: Illustration of the bias-variance decomposition fortwo profiled attacks by reporting the probability to output akey value with a fixed attacking set when the actual (target)key value equals to 42. The probability to output a key valuedepends on the profiling set. For the sake of simplicity, weassume that the error rate of the Bayes classifier equals tozero.
It is worth to note that, in practice, the evaluator doesnot know which profiling set neither which attacking setwill be used by the adversary. As a result, independentlyof the use of our diagnosis tool, an evaluator requires tobuild several profiled attacks (with the same complexityand evaluation settings but with different profiling sets)using several attacking sets in order to estimate the errorrate. In this paper, we demonstrate that the evaluator canexploit all the constructed profiled attacks in order to obtaina diagnosis tool with a small overhead. Note also that bybuilding more attacks and by increasing the number ofattacking sets, we increase the accuracy of estimations ofthe bias, of the variance and of the error rate.
3.3 Oracle model
In a realistic evaluation scenario, an evaluator has no accessto the Bayes classifier (representing the best physical attackminimizing the error rate) during the estimation of the biasand the variance terms. More precisely, the evaluators ofcrypto systems lack knowledge (1) on the structure of theleakage distributions (leading to assumption errors), and (2)on the best values (i.e., maximizing the success probability)of the estimated parameters used by the classifier (leadingto estimation errors). In practice, we counteract this issueby replacing the Bayes classifier by the Oracle model thatrepresents an idealization of the Bayes classifier. The Oraclemodel (also known as the Oracle) denotes an adversary thatextracts and outputs the correct key from a set of attacktraces regardless of the quantity of information present in
the attacking set. In other words, the error rate of the Oraclemodel equals to zero.
We demonstrate in Section 4 and Section 5 that the Oraclemodel provides useful information on the bias and varianceterms in practice. Furthermore, we rationalize the substitu-tion of the Bayes classifier by the Oracle model in Section 6.Informally, the accuracy of this approach increases with thedecrease of the overlap between the true probability densityfunctions of the leakages (related to different keys).
3.4 Diagnosis tool and guidelinesThe bias-variance decomposition of the error rate allows tofigure out how to tune and to improve an attack. Severalways exist in order to reduce the bias or the variance. Inthe following, we consider three parameters that can beoptimized: (1) the error rate and/or the number of attackleakages, or (2) the number of profiling leakages. For exam-ple, an evaluator may vary the number of profiling leakagesin order to reach an error rate of 0.2 with 5 attack leakages.
Based on the considered constraints, the evaluator canreduce the variance by increasing the size of the profilingset [2]. Note however that the machine learning theory saysthat the increase of the profiling set does not impact thebias term (see for example the paper of Domingos [9]). Theclassifiers having small complexity/variance should be used(e.g., SA1 in unprotected contexts) if the evaluator requiresto fix the profiling set to a small size [24]. Furthermore,the bias contribution in the error rate can be reduced byincreasing the complexity of the model (potentially at thecost of increasing the variance contribution in the errorrate) or by increasing the size of the attacking set [19].Finally, if the number of points related to the target valueincreases, the bias term reduces but the variance term canincrease (because we have more parameters to estimate) orcan reduce (because we increase the quantity of informationrelated to the target value in each leakage) [35]. Table 1resumes the impact of each parameter on the bias and onthe variance terms. Note that, in this paper, we considerDPA scenario (where we target an operation that involvesknown plaintexts and a fixed key) while other outcomescould be obtained in other settings.
It is worth to note that we reduce the variance of theestimation of metrics (1) by increasing the number of at-tacking sets provided by the attack source, (2) by increasingthe number of estimated distinguishers, and (3) by reducingthe noise in the leakage (in order to reduce the error of theassumption that the Bayes classifier equals to the Oraclemodel).
4 EXPERIMENTS ON UNPROTECTED DEVICE
In this section, we show how a simple approach (i.e., thebias-variance decomposition) guides the evaluators to findthe best profiled attack against an unprotected device. Moreprecisely, the evaluators reduce the error rate of a strategyby reducing the term dominating the error rate.
4.1 Acquisition setupA set of 80 000 power traces was collected on an 8-bit Atmel(ATMega 328) microcontroller at a 16 MHz clock frequency.

IEEE TRANSACTIONS ON COMPUTERS, VOL. ?, NO. ?, ? ? 7
Bias Variance
size of profiling set −
complexity of the model
size of the attacking set ?
number of points of interest ?
TABLE 1: Impact of each parameter on the bias and on thevariance terms. The symbol and represent respectivelyan increase and a decrease of the term/parameter. Thesymbol − is used when the term does not change whilethe symbol ? represents an unknown effect on the term.
The power consumption of the device was measured usingan Agillent Infiniium 9000 Series oscilloscope that was setup to acquire 200 MSamples/s. In order to measure thedevice’s power consumption we inserted a 10 Ω resistorplaced between the ground pin of the microcontroller andthe ground of the power supply. In order to reduce noise inpower traces we used averaging (done be the oscilloscope),thus each power trace represents an average of 64 singleacquisitions. We separate the dataset of 80 000 power tracesinto two parts: the profiling source (containing 56 000 traces)and the attack source (containing 24 000 traces).
Our target device executes AES using a constant 128-bitkey and random plaintexts. We target the first round of thecipher (manipulating the AES SBox) and focus on the firstbyte of the key.
4.2 Case studiesWe vary five parameters in our experiments: (1) the numberof points per trace, (2) the number of profiling traces pertarget value, (3) the number of attack traces, (4) the typeof attack and (5) the leakage degree/complexity. The mainpurpose is to provide a large quantity of information allow-ing to play with a large quantity of stories (representing asequence of steps allowing to reach a final setting startingfrom one setting) although we exhibit three stories thatevaluators may meet against unprotected devices, leavingthe other stories to be discovered by the interested readers.
Our experiments test eight popular families of profiledattacks: template attacks, three stochastic attacks (of degrees1, 2 and 3), as well as profiled correlation power attacksbased on template attacks and based on three differentstochastic attacks (of degrees 1, 2 and 3).
We consider several scenarios by using three differentsizes of the attacking set (Na ∈ 5, 10, 20), two differentsizes of the profiling set (Np ∈ 3, 10), five differentleakage dimensions (n ∈ 1, 2, 5, 10, 20) and two differentleakage functions.
We consider a linear feature selection6 in order to reducethe dimensionality of the problem by selecting points thatcorrelate (linearly) with the Hamming weight of the outputof the SBox7. This approach allows to simulate two leakage
6. We estimate the Pearson correlation with 1 000 leakages from theprofiling source.
7. Note that, during our experiments, the dimensionality reductionalgorithm selected points correlated (linearly) the most with the outputof the SBox. Nevertheless, this provide points highly correlated tothe Hamming weight of the output of the SBox thanks to the highcorrelation between 0, ..., 2m−1 and HW(0, ..., 2m−1) for small m.
functions: a linear leakage function (when the adversarytargets the output of the SBox), and a nonlinear leakagefunction (when the adversary targets the input of the SBox).It is also worth to note that linear feature selections speedup the execution of the diagnosis tool. However, we adviseto use a nonlinear feature selection algorithm (such as theminimum redundancy maximum relevance proposed byPeng et al. [29]) in an evaluation case in order to extractall the information available in the leakages.
For each case study, we estimate the parameters of eachprofiled attack 100 times (with different profiling sets).This number of estimated distinguishers already providesinteresting insights on the quantity of bias and variance. Aninteresting future work can be to find strategies extractingthe best number of profiled attacks to build.
Section 2.2.2 reports that, in unprotected contexts,stochastic attacks of degree strictly less than 8 representdistinguishers with lower complexity than template attacks.As a result, template attacks contain a lower bias (but ahigher variance) than stochastic attacks of degree strictlyless than 8. This is why we assume in the following that thebest profiled attack (that we can mount against unprotecteddevices) represents a template attack having a large profilingset (that leads to a small variance term). Figure 2 plots theerror rate of template attacks as a function of the numberof attack traces, the number of points per trace, as well asthe number of profiling traces. This figure highlights (1)the lower bound of the error rate of considered attacks,and (2) the difficulty of estimating the actual bias andthe actual variance terms due to the assumption that theBayes classifier equals to the Oracle model. More precisely,Section 6 demonstrates that the accuracy of the bias-variancedecomposition increases with the decrease of the error rateof the Bayes classifier. In the case study using 5 attack tracesand 1 point per leakage, the best attack that we can mountconverges to an estimated error rate of at least 0.89 (whichrepresents the estimated error rate of the Bayes classifier). Asa result, the bias-variance decomposition based on the Bayesclassifier could significantly differ from the bias-variancedecomposition based on the Oracle model (leading to ahigh estimation error of the decomposition of the errorrate). Although small attacking sets can provide inaccurateestimation of the bias and variance terms, the rationale toconsider such small sets by evaluators relies on severalfactors such as the running time of the evaluation (i.e., thesmaller the attacking set, the lower the running time) andconstraints decided by the executed cryptographic device(e.g., fresh re-keying scheme constraints the size of theattacking set to small values for evaluators). Nevertheless,we demonstrate in the following that an evaluator can stillextract information on the contribution of the bias and thevariance terms.
4.3 Bias-variance decomposition of probability-basedprofiled attacks
Tables 2 and 3 provide the bias-variance error rate decompo-sition of respectively stochastic attacks and template attackswhen the adversary targets the output of the SBox (that sim-ulates a linear leakage function). Due to space constraints,we describe only a couple of scenarios. Let assume that the

IEEE TRANSACTIONS ON COMPUTERS, VOL. ?, NO. ?, ? ? 8
0 20 50 80 110 140 170 200
0.0
0.1
0.2
0.3
0.4
0.5
0.6
0.7
0.8
0.9
1.0
Err
or r
ate
Traces per target value (profiling)
(a) Na = 5
0 20 50 80 110 140 170 200
0.0
0.1
0.2
0.3
0.4
0.5
0.6
0.7
0.8
0.9
1.0
Err
or r
ate
Traces per target value (profiling)
(b) Na = 10
0 20 50 80 110 140 170 200
0.0
0.1
0.2
0.3
0.4
0.5
0.6
0.7
0.8
0.9
1.0
Err
or r
ate
Traces per target value (profiling)
(c) Na = 20
Points per trace
1 2 51020
(d) Legend
Fig. 2: Error rate of template attacks as a function of thenumber of profiling traces per target value, the number ofpoints per trace and the number of attack traces (Na) forunprotected software implementation.
adversary applies template attacks with 10 attacking traces,3 profiling traces per target value and 1 point per leak-age. The bias reaches a high value (0.66) compared to thevariance (0.16) leading to a high error rate (0.82). In orderto reduce the bias, the adversary can use template attacksusing more points per leakage. The adversary reaches theerror rate of 0.25 by using 5 points per trace leading to alower bias (0.04) but a higher variance (0.21) due to theincrease of the number of estimated parameters. In orderto reach a lower error rate of 0.10, the attacker can selectstochastic attacks of degree 1 leading to a lower variance(0.01) at the cost of a small increase of the bias (0.09) due tothe decrease of the complexity of the distinguisher.
Tables 4 shows the bias-variance error rate decomposi-tion of template attacks and stochastic attacks when theadversary targets the input of the SBox while the leakagedepends on the output of the SBox (i.e., a simulation of anonlinear leakage function). Let assume that the adversaryfirst applies stochastic attacks of degree 1 using 5 attacktraces, 3 profiling traces and 1 point per leakage. The ex-periment leads to a high bias of 0.99, a very low varianceof 0.00 and an error rate of 0.99. In this case, the adversarycan reduce the bias term by using template attacks, whichprovide a bias of 0.89, a variance of 0.05, and an error rateof 0.94. The high bias of stochastic attacks and templateattacks highlights that we should increase the number ofpoints per leakage to, for example, 5 in order to reach alower bias term of 0.39 leading to a decrease of the errorrate to 0.69 (although the variance term increases to 0.29due to the increase of the complexity of the distinguisher).
Na Np nError rate composition
Bias Variance Total
SA1
5
3
1 0.93 0.00 0.942 0.66 0.01 0.675 0.51 0.03 0.5410 0.15 0.02 0.1720 0.02 0.01 0.02
10
1 0.93 0.00 0.932 0.66 0.00 0.675 0.52 0.01 0.5210 0.15 0.01 0.1620 0.02 0.00 0.02
10
3
1 0.66 0.01 0.672 0.21 0.00 0.215 0.09 0.01 0.1010 0.00 0.00 0.0020 0.00 0.00 0.00
10
1 0.66 0.00 0.672 0.21 0.00 0.215 0.09 0.00 0.0910 0.00 0.00 0.0020 0.00 0.00 0.00
SA2
5
3
1 0.93 0.01 0.942 0.64 0.04 0.685 0.50 0.09 0.5810 0.12 0.06 0.1820 0.01 0.01 0.02
10
1 0.93 0.00 0.932 0.65 0.01 0.665 0.50 0.03 0.5310 0.12 0.02 0.1420 0.01 0.00 0.01
10
3
1 0.78 0.03 0.812 0.19 0.04 0.235 0.08 0.05 0.1210 0.00 0.00 0.0020 0.00 0.00 0.00
10
1 0.78 0.02 0.802 0.19 0.01 0.205 0.07 0.01 0.0910 0.00 0.00 0.0020 0.00 0.00 0.00
TABLE 2: Error rate decomposition of stochastic attacksof degree 1 and 2 (denoted respectively SA1 and SA2)targeting the output of the SBox of an unprotected softwareimplementation. Each distinguisher uses Na attack traces,Np profiling traces per target value, and n points per trace.
4.4 Bias-variance decomposition of score-based pro-filed attacks
Table 5 shows the bias-variance decomposition of the errorrate of score-based profiled attacks based on profiled cor-relation power analysis exploiting one point per leakageand targeting the output of the SBox. Let assume thatthe attacker first tests a PCPA-SA1 (i.e., profiled correla-tion power analysis using stochastic attacks of degree 1)with 10 attacking traces and 3 profiling traces per targetvalue. The strategy exhibits a high bias of 0.82 and a lowvariance of 0.01 leading to an error rate of 0.83. In orderto reduce the error rate, the attacker can change PCPA-SA1 to more complex distinguishers such as PCPA-TA (i.e.,profiled correlation power analysis using template attacks).This change decreases the bias term to 0.67 at the cost of anincrease of the variance term to 0.17 leading to an increaseof the error rate of 0.84. Note that although we increasethe error rate, we know that this change can be helpfulwhether we increase eventually the size of the profiling

IEEE TRANSACTIONS ON COMPUTERS, VOL. ?, NO. ?, ? ? 9
Na Np nError rate composition
Bias Variance Total
TA
5
3
1 0.89 0.05 0.942 0.54 0.19 0.735 0.40 0.29 0.6910 0.06 0.24 0.3020 0.00 0.01 0.01
10
1 0.89 0.02 0.912 0.55 0.07 0.625 0.39 0.14 0.5310 0.06 0.07 0.1320 0.00 0.00 0.00
10
3
1 0.66 0.16 0.822 0.11 0.22 0.325 0.04 0.21 0.2510 0.00 0.02 0.0220 0.00 0.00 0.00
10
1 0.67 0.07 0.742 0.11 0.07 0.185 0.04 0.05 0.1010 0.00 0.00 0.0020 0.00 0.00 0.00
TABLE 3: Error rate decomposition of template attacks (de-noted TA) targeting the output of the SBox of an unprotectedsoftware implementation. Each distinguisher uses Na attacktraces, Np profiling traces per target value, and n points pertrace.
Na nError rate composition
Bias Variance Total
SA1
51 0.99 0.00 0.992 0.99 0.00 0.995 0.99 0.00 0.99
101 0.99 0.00 0.992 0.99 0.00 0.995 0.99 0.00 0.99
SA2
51 0.99 0.00 0.992 0.97 0.01 0.985 0.97 0.01 0.98
101 0.97 0.01 0.982 0.95 0.01 0.965 0.94 0.03 0.97
SA3
51 0.96 0.01 0.972 0.92 0.02 0.945 0.90 0.05 0.95
101 0.92 0.02 0.942 0.80 0.06 0.865 0.74 0.15 0.89
TA
51 0.89 0.05 0.942 0.54 0.19 0.735 0.39 0.29 0.69
101 0.65 0.17 0.822 0.11 0.21 0.325 0.04 0.21 0.25
TABLE 4: Error rate decomposition of template attacks(denoted TA) and stochastic attacks of degrees 1, 2 and 3(denoted respectively SA1, SA2 and SA3) targeting the inputof the SBox of an unprotected software implementation.Each distinguisher uses Na attack traces, 3 profiling tracesper target value, and n points per trace.
set to 10 profiling traces per target value. Indeed, this lastchange decreases the variance to 0.08 (whereas the biasterm remains constant) leading to a decrease of the errorrate to 0.74. This example highlights that the security metricwithout its decomposition does not provide enough infor-
Na NpError rate composition
Bias Variance Total
PCPA-SA110 3 0.82 0.01 0.83
10 0.82 0.00 0.82
20 3 0.41 0.01 0.4210 0.41 0.01 0.42
PCPA-SA210 3 0.80 0.03 0.83
10 0.81 0.01 0.82
20 3 0.37 0.07 0.4410 0.38 0.02 0.40
PCPA-SA310 3 0.77 0.07 0.84
10 0.78 0.03 0.81
20 3 0.33 0.13 0.4610 0.32 0.05 0.37
PCPA-TA10 3 0.67 0.17 0.84
10 0.66 0.08 0.74
20 3 0.17 0.26 0.4310 0.17 0.08 0.25
TABLE 5: Error rate decomposition of profiled correlationpower analysis using template attacks (denoted PCPA-TA)and stochastic attacks of degrees 1, 2 and 3 (denoted PCPA-SA1, PCPA-SA2 and PCPA-SA3) targeting the output ofthe SBox of an unprotected software implementation. Eachdistinguisher uses Na attack traces, Np profiling traces pertarget value, and 1 points per trace.
mation on how to improve the efficiency of attacks. Notethat an adversary could reduce the bias term by increasingthe number of points per leakage, which allows to reducethe error rate of the profiled attacks.
Noisy hardware contextsThe previous sections show that an evaluator can exploit ourdiagnosis tool on unprotected software implementations.This section attests that an adversary can also apply thesame diagnosis tool on a more challenging hardware noisycontext. More precisely, we employ the public dataset of thesecond version of the DPAContest8. The public dataset con-tains 1 640 000 traces collected on an FPGA implementingthe unprotected AES-128. We consider 70% of the dataset forthe profiling source and the reminder for the attack source.We target the Hamming distance between the first byte ofthe ciphertext and the first byte of the input of the SBoxexecuted during the last round. For the sake of place, Table 6reports the results only for template attacks and profiledcorrelation power analysis based on template attacks. Letassume that the evaluator starts with template attacks using1 000 attack traces, 200 profiling traces per target value and2 points per leakage. The bias term equals to 0.89 whilethe variance term reaches 0.02 leading to an error rate of0.91. In order to reduce the error rate, we can reduce thebias term by increasing the number of instants per trace to50, which provides a smaller bias term of 0.58 but a highervariance term of 0.19 (with a smaller error rate of 0.77). Wecan reduce the error rate by reducing the variance with alarger profiling set of 2 000 profiling traces per target value.This last setting provides an error rate of 0.59 (with a bias of0.55 and a small variance of 0.03). It is worth to note that theevaluator can reduce the bias term (as well as the error rate)by increasing the attacking set (as shown in the Table 6).
8. http://www.dpacontest.org/v2/

IEEE TRANSACTIONS ON COMPUTERS, VOL. ?, NO. ?, ? ? 10
Furthermore, other techniques could be exploited to reducethe error rate such as targeting other (or several) sensitivevalues and adopting a key enumeration strategy (which wasprobably applied by best attacks in the DPAContest v2).
Na Np nError rate composition
Bias Variance Total
TA
1 000
200
2 0.89 0.02 0.9125 0.69 0.12 0.8050 0.58 0.19 0.7775 0.56 0.23 0.79
2 000
2 0.90 0.00 0.9025 0.68 0.02 0.7050 0.55 0.03 0.5975 0.53 0.04 0.58
4 000
200
2 0.72 0.03 0.7525 0.41 0.16 0.5750 0.34 0.16 0.5175 0.31 0.22 0.53
2 000
2 0.72 0.01 0.7325 0.39 0.03 0.4150 0.32 0.00 0.3275 0.29 0.02 0.31
PCPA-TA
1 000
10
1
0.83 0.09 0.9250 0.82 0.04 0.86200 0.82 0.01 0.83
2 000 0.82 0.00 0.82
4 000
10
1
0.29 0.33 0.6250 0.30 0.08 0.38200 0.30 0.01 0.32
2 000 0.29 0.00 0.30
TABLE 6: Error rate decomposition of template attacks(denoted TA) and profiled correlation power analysis usingtemplate attacks (denoted PCPA-TA) targeting the Ham-ming distance between the ciphertext and the input of thelast round of an unprotected hardware implementation ofAES. Each distinguisher uses Na attack traces, Np profilingtraces per target value, and n points per trace.
5 EXPERIMENTS ON PROTECTED DEVICE
This section extends the previous results when consideringa more challenging protected (software) implementation.More precisely, we analyze a masking countermeasure rep-resenting a well-known technique (due to its theoreticalsoundness) in order to increase the degree of resilience ofan implementation against side-channel attacks. Our diag-nosis tool naturally extends to protected devices becauseour framework decomposes a security metric that can beestimated on any device.
5.1 Acquisition setup
The dataset (of 80 000 power traces) measured on the pro-tected device was collected with the same acquisition boardused for the unprotected software case studies. The profilingsource and the attack source contain respectively 56 000and 24 000 leakages. We also applied the same filteringtechnique (i.e., an average of 64 single acquisitions). Themain difference with the previous (unprotected) setting liesin the target implementation. More precisely, this sectionanalyses the implementation of a first-order masked AESSBox (with 2 shares) based on table lookups [30], [32]. Thisstrategy pre-computes a new masked AES SBox in memory
(denoted SBox∗) for each execution of the cryptographicalgorithm such that:
SBox∗k (x⊕min) = SBox (x)⊕mout ∀x ∈ 0, 18 (18)
for a given pair of input and output mask bytes (denotedrespectively min and mout) that are independent and identi-cally distributed from a uniformly random source. Our im-plementation avoids a first order leakage by providing themasked input byte (i.e., p⊕k⊕min where p and k representthe plaintext and the key) to the executed implementation.
As previously, our target device uses a random fixed 128-bit key and random plaintexts. We target the first byte of thekey used during the first round of the masked AES.
5.2 Case studiesWe vary four parameters in our experiments: (1) the numberof points per trace, (2) the number of profiling traces, (3) thenumber of attack traces and (4) the type of attack. Unlikethe unprotected context, we focus here only on two popularprofiled attacks in order to highlight the usefulness of ourdiagnosis tool in protected environments. More precisely,we test template attacks and stochastic-based mixture at-tacks of degree 1, leaving the other attacks as future work.
Due to the increase of the complexity of the case studies(related to the implemented protection), we increase the sizeof the attacking set to Na ∈ 25, 50, 100 and the size ofthe profiling set to Np ∈ 20, 40, 60, 80, 100. In our experi-ment, we also consider two leakage dimensions (n ∈ 2, 5per share, leading to 4, 10 points per leakage) but onlyone (linear) leakage function. Similarly to the unprotectedsetting, for each case study, we estimate the parametersof each profiled attack 100 times (with different profilingsets sampled with replacement from the profiling source) inorder to estimate the bias, the variance and the error rate.
Section 2.2.2 reports that, in protected contexts,stochastic-based mixture attacks are unbiased models (if theleakages contain Gaussian noise and if the stochastic-basedmodels contain the right degree) since stochastic-based mix-ture attacks (like any attack exploiting the mixture structureof the density function) take into account the multimodalstructure of the density function associated to each value ysplit in several shares. In order to estimate the complexity ofthe scenarios based on the collected dataset, Table 7 reportsthe (estimation) of the lower bound of the error rate ofstochastic-based mixture attacks (and of template attacks)by considering a large profiling set (of 400 leakages pertarget value). The purpose of this table is to show in thefollowing that, even with a high estimation error of thedecomposition of the error rate (due to a large differencebetween the Bayes classifier, represented by the stochastic-based mixture attacks, and the Oracle model), we can extractinformation on the bias and on the variance.
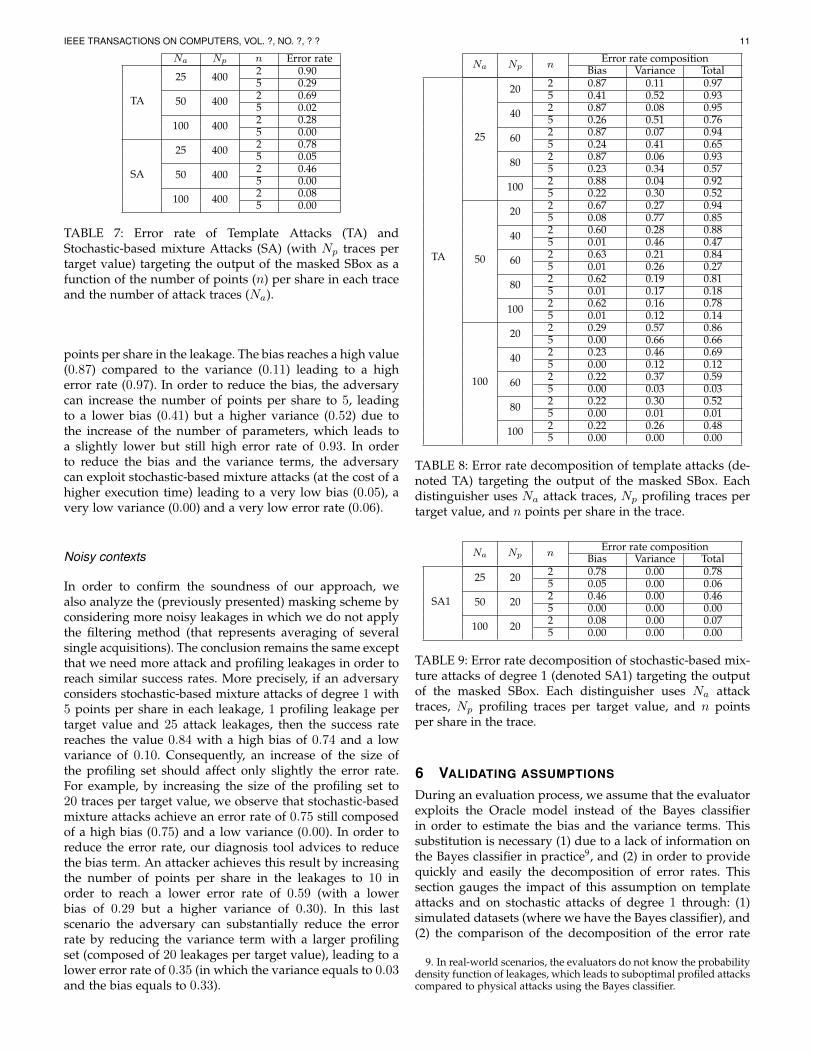
5.3 Bias-variance decomposition of profiled attacksTables 8 and 9 provide the bias-variance error rate de-composition of respectively template attacks and stochastic-based mixture attacks (of degree 1) targeting the outputof the SBox implemented with the masking scheme. Letassume that the adversary applies template attacks with 25attacking traces, 20 profiling traces per target value and 2
IEEE TRANSACTIONS ON COMPUTERS, VOL. ?, NO. ?, ? ? 11
Na Np n Error rate
TA
25 400 2 0.905 0.29
50 400 2 0.695 0.02
100 400 2 0.285 0.00
SA
25 400 2 0.785 0.05
50 400 2 0.465 0.00
100 400 2 0.085 0.00
TABLE 7: Error rate of Template Attacks (TA) andStochastic-based mixture Attacks (SA) (with Np traces pertarget value) targeting the output of the masked SBox as afunction of the number of points (n) per share in each traceand the number of attack traces (Na).
points per share in the leakage. The bias reaches a high value(0.87) compared to the variance (0.11) leading to a higherror rate (0.97). In order to reduce the bias, the adversarycan increase the number of points per share to 5, leadingto a lower bias (0.41) but a higher variance (0.52) due tothe increase of the number of parameters, which leads toa slightly lower but still high error rate of 0.93. In orderto reduce the bias and the variance terms, the adversarycan exploit stochastic-based mixture attacks (at the cost of ahigher execution time) leading to a very low bias (0.05), avery low variance (0.00) and a very low error rate (0.06).
Noisy contexts
In order to confirm the soundness of our approach, wealso analyze the (previously presented) masking scheme byconsidering more noisy leakages in which we do not applythe filtering method (that represents averaging of severalsingle acquisitions). The conclusion remains the same exceptthat we need more attack and profiling leakages in order toreach similar success rates. More precisely, if an adversaryconsiders stochastic-based mixture attacks of degree 1 with5 points per share in each leakage, 1 profiling leakage pertarget value and 25 attack leakages, then the success ratereaches the value 0.84 with a high bias of 0.74 and a lowvariance of 0.10. Consequently, an increase of the size ofthe profiling set should affect only slightly the error rate.For example, by increasing the size of the profiling set to20 traces per target value, we observe that stochastic-basedmixture attacks achieve an error rate of 0.75 still composedof a high bias (0.75) and a low variance (0.00). In order toreduce the error rate, our diagnosis tool advices to reducethe bias term. An attacker achieves this result by increasingthe number of points per share in the leakages to 10 inorder to reach a lower error rate of 0.59 (with a lowerbias of 0.29 but a higher variance of 0.30). In this lastscenario the adversary can substantially reduce the errorrate by reducing the variance term with a larger profilingset (composed of 20 leakages per target value), leading to alower error rate of 0.35 (in which the variance equals to 0.03and the bias equals to 0.33).
Na Np nError rate composition
Bias Variance Total
TA
25
20 2 0.87 0.11 0.975 0.41 0.52 0.93
40 2 0.87 0.08 0.955 0.26 0.51 0.76
60 2 0.87 0.07 0.945 0.24 0.41 0.65
80 2 0.87 0.06 0.935 0.23 0.34 0.57
100 2 0.88 0.04 0.925 0.22 0.30 0.52
50
20 2 0.67 0.27 0.945 0.08 0.77 0.85
40 2 0.60 0.28 0.885 0.01 0.46 0.47
60 2 0.63 0.21 0.845 0.01 0.26 0.27
80 2 0.62 0.19 0.815 0.01 0.17 0.18
100 2 0.62 0.16 0.785 0.01 0.12 0.14
100
20 2 0.29 0.57 0.865 0.00 0.66 0.66
40 2 0.23 0.46 0.695 0.00 0.12 0.12
60 2 0.22 0.37 0.595 0.00 0.03 0.03
80 2 0.22 0.30 0.525 0.00 0.01 0.01
100 2 0.22 0.26 0.485 0.00 0.00 0.00
TABLE 8: Error rate decomposition of template attacks (de-noted TA) targeting the output of the masked SBox. Eachdistinguisher uses Na attack traces, Np profiling traces pertarget value, and n points per share in the trace.
Na Np nError rate composition
Bias Variance Total
SA1
25 20 2 0.78 0.00 0.785 0.05 0.00 0.06
50 20 2 0.46 0.00 0.465 0.00 0.00 0.00
100 20 2 0.08 0.00 0.075 0.00 0.00 0.00
TABLE 9: Error rate decomposition of stochastic-based mix-ture attacks of degree 1 (denoted SA1) targeting the outputof the masked SBox. Each distinguisher uses Na attacktraces, Np profiling traces per target value, and n pointsper share in the trace.
6 VALIDATING ASSUMPTIONS
During an evaluation process, we assume that the evaluatorexploits the Oracle model instead of the Bayes classifierin order to estimate the bias and the variance terms. Thissubstitution is necessary (1) due to a lack of information onthe Bayes classifier in practice9, and (2) in order to providequickly and easily the decomposition of error rates. Thissection gauges the impact of this assumption on templateattacks and on stochastic attacks of degree 1 through: (1)simulated datasets (where we have the Bayes classifier), and(2) the comparison of the decomposition of the error rate
9. In real-world scenarios, the evaluators do not know the probabilitydensity function of leakages, which leads to suboptimal profiled attackscompared to physical attacks using the Bayes classifier.

IEEE TRANSACTIONS ON COMPUTERS, VOL. ?, NO. ?, ? ? 12
using Bayes using Oracle
0.0
0.2
0.4
0.6
0.8
1.0biasvarianceerror rate
(a) TA with low noise
using Bayes using Oracle
0.0
0.2
0.4
0.6
0.8
1.0biasvarianceerror rate
(b) TA with high noise
using Bayes using Oracle
0.0
0.2
0.4
0.6
0.8
1.0biasvarianceerror rate
(c) SA1 with low noise
using Bayes using Oracle
0.0
0.2
0.4
0.6
0.8
1.0biasvarianceerror rate
(d) SA1 with high noise
Fig. 3: Error rate, bias and variance estimated with the Bayesclassifier and with the Oracle model for Template Attacks(TA) and Stochastic Attacks of degree 1 (SA1) using Np = 2profiling traces per target value and Na = 15 attack traces.The standard deviation of the noise equals to 3 for highnoise and 1 for low noise. The signal-to-noise ratio equalsto 2.01 for low noise and 0.22 for high noise. The Bayesclassifier has an error rate of 0.012 and 0.301 for respectivelylow and high noise level. The leakages were generated bythe simulator presented in Section 6.1.
based on the Bayes classifier with respect to the decomposi-tion based on the Oracle model. In all our cases, the attackertargets the output of the AES SBox.
6.1 Unprotected contextsIn the unprotected contexts, we generated synthetic leak-ages having 2 points (denoted 1T and 2T ) related to theHamming weight of the SBox:
1T = HW (SBox (p⊕ k)) + ε1, (19)
2T = HW (SBox (p⊕ k)) + ε2, (20)
where ε1 and ε2 represent the (independent) Gaussian noiseof the leakage. We estimated the parameters of each clas-sifier 10 000 times with different profiling sets containingNp = 2 traces per target value. Each classifier extracts thekey based on Na = 15 attack traces in the attacking setand the attack source contains 1 000 attacking sets. Figure 3shows the results by considering low and high noise level.
Figure 3 indicates that the higher the error rate of theBayes classifier10, the higher the distance between the de-composition of the error rate based on the Bayes classifier
10. Several parameters impact the error rate of the Bayes classifiersuch as the noise level, the number of informative points per leakageand the size of the attacking set.
and the Oracle model. The rationale is that the decompo-sition based on the Oracle model overestimates the successrate of the Bayes classifier leading to an overestimation ofthe bias term that impacts the estimation of the weight c2 ofthe variance term (see Equation (13)).
6.2 Protected contextsProtected environments represent more complicated con-texts for the evaluation of the cryptographic devices. Fur-thermore, the protected contexts extend the previous sectionby comparing the bias-variance decomposition based onthe Oracle model with respect to the Bayes classifier whenone model contains a bias in the classifier. More precisely,template attacks (unlike template-based mixture attacks thattake into account the mixture structure of the probabilitydensity function) contain bias by assuming that the distribu-tion of leakages follows a (unimodal) Gaussian distributionwhile, in fact, the distribution follows a multimodal distri-bution (as shown in the following).
Lets consider simulated leakages where one point 1Trelates to the Hamming weight of the masked SBox, and onepoint 2T depends on the Hamming weight of the outputmask:
1T = HW (SBox (p⊕ k)⊕mout) + ε1, (21)
2T = HW (mout) + ε2. (22)
Based on these simulated leakages, Figure 4 shows the bias,the variance and the error rate of template attacks andstochastic-based mixture attacks (of degree 1) using 1 000profiling traces per target value,Na = 100 attack traces withlow and high noise. We compute each parameter of eachprofiled attack 5 000 times. The attack source contains 200different attacking sets. The results point out two importantremarks on masked environments when considering theBayes classifier: (1) an increase of the noise level causesa reduction of the bias term of template attacks, and (2)stochastic-based mixture attacks outperform template at-tacks thanks to a lower bias and variance terms.
The observation on the variance is expected sincestochastic-based mixture attacks have a lower number ofparameters to estimate compared to template attacks11.Regarding the results on the bias, in a low noise levelscenario, the leakages follow a multimodal distribution(i.e., a mixture of several Gaussian distributions) and canbe accurately modeled by stochastic-based mixture attacks(as well as by template-based mixture attacks). In a highnoise level setting, the leakages can be represented by aunimodal distribution (e.g., one Gaussian distribution) andcan be accurately modeled by template attacks (representingone Gaussian distribution per target value) as well as bystochastic-based mixture attacks. Figure 5 illustrates thisargument by plotting one leakage distribution (estimatedwith the same simulator described in Equations (21) and(22)) per target value and for two noise levels. In otherwords, compared to profiling attacks which ignore themixture structure, attacks (whether classical template orstochastic-based attacks) which model the mixture structure
11. Template attacks estimate one covariance matrix per target valuewhile stochastic-based mixture attacks compute only one covariancematrix for all the target values.

IEEE TRANSACTIONS ON COMPUTERS, VOL. ?, NO. ?, ? ? 13
using Bayes using Oracle
0.0
0.2
0.4
0.6
0.8
1.0
biasvarianceerror rate
(a) TA with low noise
using Bayes using Oracle
0.0
0.2
0.4
0.6
0.8
1.0
biasvarianceerror rate
(b) TA with high noise
using Bayes using Oracle
0.0
0.2
0.4
0.6
0.8
1.0
biasvarianceerror rate
(c) SA1 with low noise
using Bayes using Oracle
0.0
0.2
0.4
0.6
0.8
1.0
biasvarianceerror rate
(d) SA1 with high noise
Fig. 4: Error rate, bias and variance estimated with the Bayesclassifier and with the Oracle model for Template Attacks(TA) and Stochastic-based mixture Attacks of degree 1 (SA1)using Np = 1 000 profiling traces per target value and Na =100 attack traces. The standard deviation of the noise equalsto 3 for high noise and 0.001 for low noise. The leakageswere generated by the simulator presented in Section 6.2.
have higher abilities to fit the structure of the multimodalleakage distributions (that leads to a higher complexity anda smaller bias for stochastic-based mixture attacks than fortemplate attacks in protected contexts). However, this abilitydecreases as a function of the noise level.
An important difference between theoretical results andreal case studies is the exploitation of the Oracle insteadof the Bayes. Section 6.1 reveals that the use of the Oraclein unprotected contexts leads to an overestimation of thebias term and an underestimation of the variance term. Thesame phenomenon appears in protected contexts as plottedin Figures 4 for template attacks and for stochastic-basedmixture attacks. The error rate of stochastic-based mixtureattacks provides an estimation of the error rate of the Bayes.The higher this error rate, the stronger the degradationof the estimation of the bias and the variance terms (dueto the simplification provided by the Oracle model). Moreprecisely, the difference between the estimated componentsof the error rate based on the Oracle and based on the Bayesis small when the Bayes has a low error rate. Moreover,the difference between the two estimations increases as afunction of the increase of the error rate of the Bayes.
6.3 Can the diagnosis tool be useful in practice?
Section 6.1 and Section 6.2 indicate that an evaluator canaccurately estimate the bias and variance as long as the dis-tance between the error rates of the Bayes and the Oracle is
X1
X2
density
(a) SBox (p⊕ k) = 3; σ = 0.01
X1
X2
density
(b) SBox (p⊕ k) = 3; σ = 1
X1
X2
density
(c) SBox (p⊕ k) = 95; σ = 0.01
X1
X2
density
(d) SBox (p⊕ k) = 95; σ = 1
Fig. 5: Leakage distribution associated to a target value(denoted SBox (p⊕ k)) as well as to a noise level (witha standard deviation denoted σ) when varying the maskvalue (mout). In each simulated trace, the instants X1 andX2 relate to HW (SBox (p⊕ k)⊕mout) and to HW (mout).
small. In a low noise level setting (in which the Bayes equalsto the Oracle) the bias impacts the error rate heavily whichforces the evaluator to select the best profiled attack (thanksto an accurate estimation of the bias through the Oraclemodel). However, the higher the noise level, the higher thedifference between the error rates of the Bayes classifier andthe Oracle model, and the higher the estimation errors of thebias and the variance are. However, in protected contexts,Section 6.2 exhibits that, in high noise level settings, allprobability-based profiled attacks have a similar bias termcomputed from the Bayes classifier (i.e., the actual bias term),which leads essentially to variance problems.
We can reduce the estimation errors of the bias and thevariance by increasing (1) the number of informative points,(2) the number of attack traces, and (3) any parameterproviding key-related information to the Bayes classifier.Figures 6 and 7 illustrate this phenomenon by reporting theestimation of the bias and variance for respectively templateattacks and stochastic-based mixture attacks based on theOracle and based on the Bayes as a function of the numberof attack leakages. The traces represent measurements ona masked implementation presented in Section 6.2. We use1 000 profiling traces per target with a low and a high noise.We compute each parameter of each attack 5 000 times. Theattack source contains 200 different sets. The figure showsthat the distance between the estimated terms based on theOracle and based on the Bayes increases as a function of thenoise. However, this distance decreases as a function of thenumber of attack traces.

IEEE TRANSACTIONS ON COMPUTERS, VOL. ?, NO. ?, ? ? 14
0 500 1000 1500
0.0
0.1
0.2
0.3
0.4
0.5
0.6
0.7
0.8
0.9
1.0
Na
biasvariance
(a) Estimated with Bayes and lownoise
0 500 1000 1500
0.0
0.1
0.2
0.3
0.4
0.5
0.6
0.7
0.8
0.9
1.0
Na
biasvariance
(b) Estimated with Oracle and lownoise
0 1000 2500 4000 5500
0.0
0.1
0.2
0.3
0.4
0.5
0.6
0.7
0.8
0.9
1.0
Na
biasvariance
(c) Estimated with Bayes and highnoise
0 1000 2500 4000 5500
0.0
0.1
0.2
0.3
0.4
0.5
0.6
0.7
0.8
0.9
1.0
Na
biasvariance
(d) Estimated with Oracle andhigh noise
Fig. 6: Error rate, bias and variance estimated with the Bayesand with the Oracle for template attacks using Np = 1 000profiling traces per target as a function of the number of at-tack traces (Na). The standard deviation of the noise equalsto 3 for high noise and 0.001 for low noise. The leakageswere generated by the simulator presented in Section 6.2.
Concretely, all our experiments report that our diagnosistool can be exploited in practice when the attacking setcontains enough information on target, i.e., when the bias-variance decomposition based on our Oracle is good enough.Additionally, we showed that there are systematic waysto improve the quality of this decomposition, even if theleakage model is imperfect. In fact, the only condition westrictly need is that the leakage model from which theevaluator starts is sound (in the sense of the work presentedat Eurocrypt 2009 [33]), i.e., that it asymptotically leads tosuccessful key recoveries. There remains the problem thatevaluators cannot always know in advance how accurateis the bias-variance decomposition. We can also observethat even in case the bias-variance decomposition is poorlyapproximated by the Oracle (as in Figure 6 and in Figure 7),we can extract relevant intuitions about how to improve theevaluations by comparing the decompositions of two attackswith increasing complexities (and number of attack traces).Note also that a large number of (security) metrics (e.g., theerror rate and the guessing entropy) lack of accuracy in highnoise contexts. So overall the presented tools can be viewedas an ingredient in order to (more) rapidly refine the questfor the best physical evaluation of a given implementation.
7 CONCLUSIONS
In a theoretical point of view, the diagnosis tool (based onthe Bayes classifier) specifies the source of failure of an
0 500 1000 1500
0.0
0.1
0.2
0.3
0.4
0.5
0.6
0.7
0.8
0.9
1.0
Na
biasvariance
(a) Estimated with Bayes and lownoise
0 500 1000 1500
0.0
0.1
0.2
0.3
0.4
0.5
0.6
0.7
0.8
0.9
1.0
Na
biasvariance
(b) Estimated with Oracle and lownoise
0 1000 2500 4000 5500
0.0
0.1
0.2
0.3
0.4
0.5
0.6
0.7
0.8
0.9
1.0
Na
biasvariance
(c) Estimated with Bayes and highnoise
0 1000 2500 4000 5500
0.0
0.1
0.2
0.3
0.4
0.5
0.6
0.7
0.8
0.9
1.0
Na
biasvariance
(d) Estimated with Oracle andhigh noise
Fig. 7: Error rate, bias and variance estimated with the Bayesclassifier and with the Oracle model for stochastic-basedmixture attacks of degree 1 usingNp = 1 000 profiling tracesper target value as a function of the number of attack traces(Na). The standard deviation of the noise equals to 3 for highnoise and 0.001 for low noise. The leakages were generatedby the simulator presented in Section 6.2.
attack (e.g., a high bias or a high variance). In practice, theevaluators lack knowledge on the Bayes classifier. The maincontribution of this paper lies on a practical instantiationof the diagnosis tool with the Oracle (that always outputsthe right target value). As a result, on the one hand, basedon this diagnostic, the evaluators can decide what to applyin order to increase the success of attacks. For example, anincrease of the complexity of the attack should significantlyaffect the error rate if the diagnostic tool detects a high bias.On the other hand, based on this diagnostic, the evaluatorscan also decide what should not be applied. For example,an increase of the size of the profiling set slightly affects theerror rate if the diagnostic tool detects a low variance. As afuture work, we will focus on the best choice from a set ofpossibilities (that depends on the term impacting the mostthe error rate) after the report of the diagnostic.
The diagnosis tool generates a set of profiling and attack-ing sets to estimate the bias and the variance. However, theexploitation of the diagnosis tool leads to a small overheadcompared to an approach estimating only the error rate. Therationale is that, independently of the use of the diagnosistool, an evaluator requires to build several profiled attacks(with the same complexity and evaluation settings but withdifferent profiling sets) using several attacking sets in orderto limit problems related to overfitting (leading to biased

IEEE TRANSACTIONS ON COMPUTERS, VOL. ?, NO. ?, ? ? 15
estimations of the error rate)12. In other words, the diagnosistool exploits all the data that was already generated anyway(i.e., the profiling models and the attacking sets) in order toextract more information than only the error rate.
The main limitation of the presented tool represents theaccuracy of the diagnostic. More precisely, the greater thequantity of information in the attacking set the better theestimation of the diagnostic. In a practical point of view,all our experiments report that the presented tool can beefficiently exploited to report diagnostics about attacks onunprotected and protected implementations in hardwareand in software. The reason lies on the small differencebetween the Oracle and the Bayes. Future works will focuson the accuracy of the tool on devices executing high ordermasking schemes (in which the Oracle differs significantlyfrom the Bayes), and on a better estimation of the errorrate of the Bayes classifier. For example, the error rateof the Bayes classifier could be the minimum error rates(computed with theoretical metrics such as the successexponent [18]) found from a set of profiled attacks.
Finally, we envision to apply the tool on dimensionalityreduction algorithms in order to understand how to dis-cover the best attack during an evaluation process.
ACKNOWLEDGMENTS
This research was partly supported by the Brussels RegionINNOVIRIS project SCAUT and by the EU H2020 projectREASSURE (Grant agreement 731591).
REFERENCES
[1] Mehdi-Laurent Akkar, Regis Bevan, Paul Dischamp, and DidierMoyart. Power analysis, what is now possible... In TatsuakiOkamoto, editor, Advances in Cryptology - ASIACRYPT 2000, 6th In-ternational Conference on the Theory and Application of Cryptology andInformation Security, Kyoto, Japan, December 3-7, 2000, Proceedings,volume 1976 of Lecture Notes in Computer Science, pages 489–502.Springer, 2000.
[2] Damien Brain and Geoffrey I. Webb. On the effect of data set sizeon bias and variance in classification learning. In D. Richards,G. Beydoun, A. Hoffmann, and P. Compton, editors, Proceedings ofthe Fourth Australian Knowledge Acquisition Workshop (AKAW ’99),pages 117–128, Sydney, 1999. The University of New South Wales.
[3] Suresh Chari, Charanjit S. Jutla, Josyula R. Rao, and Pankaj Ro-hatgi. Towards sound approaches to counteract power-analysisattacks. In Wiener [37], pages 398–412.
[4] Suresh Chari, Josyula R. Rao, and Pankaj Rohatgi. Templateattacks. In Burton S. Kaliski Jr., Cetin Kaya Koc, and Christof Paar,editors, Cryptographic Hardware and Embedded Systems - CHES 2002,4th International Workshop, Redwood Shores, CA, USA, August 13-15, 2002, Revised Papers, volume 2523 of Lecture Notes in ComputerScience, pages 13–28. Springer, 2002.
[5] Marios O. Choudary and Markus G. Kuhn. Efficient stochasticmethods: Profiled attacks beyond 8 bits. In Marc Joye and AmirMoradi, editors, Smart Card Research and Advanced Applications -13th International Conference, CARDIS 2014, Paris, France, November5-7, 2014. Revised Selected Papers, volume 8968 of Lecture Notes inComputer Science, pages 85–103. Springer, 2014.
[6] Omar Choudary and Markus G. Kuhn. Efficient template attacks.In Francillon and Rohatgi [13], pages 253–270.
[7] Jean-Sebastien Coron, Paul C. Kocher, and David Naccache. Statis-tics and secret leakage. In Yair Frankel, editor, Financial Cryptog-raphy, 4th International Conference, FC 2000 Anguilla, British WestIndies, February 20-24, 2000, Proceedings, volume 1962 of LectureNotes in Computer Science, pages 157–173. Springer, 2000.
12. We refer the readers to the book of Hastie et al. that presentsmodels assessments based on the estimation of the error rate [19].
[8] Pedro Domingos. A unified bias-variance decomposition and itsapplications. In Pat Langley, editor, Proceedings of the SeventeenthInternational Conference on Machine Learning (ICML 2000), StanfordUniversity, Stanford, CA, USA, June 29 - July 2, 2000, pages 231–238.Morgan Kaufmann, 2000.
[9] Pedro Domingos. A unified bias-variance decomposition for zero-one and squared loss. In Henry A. Kautz and Bruce W. Porter,editors, Proceedings of the Seventeenth National Conference on Artifi-cial Intelligence and Twelfth Conference on on Innovative Applicationsof Artificial Intelligence, July 30 - August 3, 2000, Austin, Texas, USA.,pages 564–569. AAAI Press / The MIT Press, 2000.
[10] Francois Durvaux, Francois-Xavier Standaert, and SantosMerino Del Pozo. Towards easy leakage certification. In BenediktGierlichs and Axel Y. Poschmann, editors, Cryptographic Hardwareand Embedded Systems - CHES 2016 - 18th International Conference,Santa Barbara, CA, USA, August 17-19, 2016, Proceedings, volume9813 of Lecture Notes in Computer Science, pages 40–60. Springer,2016.
[11] Francois Durvaux, Francois-Xavier Standaert, and Nicolas Veyrat-Charvillon. How to certify the leakage of a chip? In Phong Q.Nguyen and Elisabeth Oswald, editors, Advances in Cryptology -EUROCRYPT 2014 - 33rd Annual International Conference on theTheory and Applications of Cryptographic Techniques, Copenhagen,Denmark, May 11-15, 2014. Proceedings, volume 8441 of LectureNotes in Computer Science, pages 459–476. Springer, 2014.
[12] Paul N. Fahn and Peter K. Pearson. IPA: A new class of powerattacks. In Koc and Paar [20], pages 173–186.
[13] Aurelien Francillon and Pankaj Rohatgi, editors. Smart CardResearch and Advanced Applications - 12th International Conference,CARDIS 2013, Berlin, Germany, November 27-29, 2013. Revised Se-lected Papers, volume 8419 of Lecture Notes in Computer Science.Springer, 2014.
[14] Karine Gandolfi, Christophe Mourtel, and Francis Olivier. Elec-tromagnetic analysis: Concrete results. In Cetin Kaya Koc, DavidNaccache, and Christof Paar, editors, Cryptographic Hardware andEmbedded Systems - CHES 2001, Third International Workshop, Paris,France, May 14-16, 2001, Proceedings, volume 2162 of Lecture Notesin Computer Science, pages 251–261. Springer, 2001.
[15] Daniel Genkin, Adi Shamir, and Eran Tromer. RSA key extractionvia low-bandwidth acoustic cryptanalysis. In Juan A. Garay andRosario Gennaro, editors, Advances in Cryptology - CRYPTO 2014 -34th Annual Cryptology Conference, Santa Barbara, CA, USA, August17-21, 2014, Proceedings, Part I, volume 8616 of Lecture Notes inComputer Science, pages 444–461. Springer, 2014.
[16] Louis Goubin and Jacques Patarin. DES and differential poweranalysis (the ”duplication” method). In Koc and Paar [20], pages158–172.
[17] Vincent Grosso, Francois-Xavier Standaert, and Emmanuel Prouff.Low entropy masking schemes, revisited. In Francillon andRohatgi [13], pages 33–43.
[18] Sylvain Guilley, Annelie Heuser, and Olivier Rioul. A key tosuccess - success exponents for side-channel distinguishers. InAlex Biryukov and Vipul Goyal, editors, Progress in Cryptology -INDOCRYPT 2015 - 16th International Conference on Cryptology inIndia, Bangalore, India, December 6-9, 2015, Proceedings, volume 9462of Lecture Notes in Computer Science, pages 270–290. Springer, 2015.
[19] Trevor J. Hastie, Robert Tibshirani, and Jerome Friedman. Theelements of statistical learning: data mining, inference and prediction.Springer, 2 edition, 2009.
[20] Cetin Kaya Koc and Christof Paar, editors. Cryptographic Hard-ware and Embedded Systems, First International Workshop, CHES’99,Worcester, MA, USA, August 12-13, 1999, Proceedings, volume 1717of Lecture Notes in Computer Science. Springer, 1999.
[21] Paul C. Kocher. Timing attacks on implementations of diffie-hellman, rsa, dss, and other systems. In Neal Koblitz, editor,Advances in Cryptology - CRYPTO ’96, 16th Annual InternationalCryptology Conference, Santa Barbara, California, USA, August 18-22,1996, Proceedings, volume 1109 of Lecture Notes in Computer Science,pages 104–113. Springer, 1996.
[22] Paul C. Kocher, Joshua Jaffe, and Benjamin Jun. Differential poweranalysis. In Wiener [37], pages 388–397.
[23] Liran Lerman, Gianluca Bontempi, and Olivier Markowitch. SideChannel Attack: an Approach Based on Machine Learning. InSecond International Workshop on Constructive SideChannel Analysisand Secure Design, pages 29–41. Center for Advanced SecurityResearch Darmstadt, 2011.

IEEE TRANSACTIONS ON COMPUTERS, VOL. ?, NO. ?, ? ? 16
[24] Liran Lerman, Gianluca Bontempi, and Olivier Markowitch. Thebias-variance decomposition in profiled attacks. J. CryptographicEngineering, 5(4):255–267, 2015.
[25] Houssem Maghrebi, Thibault Portigliatti, and Emmanuel Prouff.Breaking cryptographic implementations using deep learningtechniques. In Claude Carlet, M. Anwar Hasan, and VishalSaraswat, editors, Security, Privacy, and Applied Cryptography Engi-neering - 6th International Conference, SPACE 2016, Hyderabad, India,December 14-18, 2016, Proceedings, volume 10076 of Lecture Notes inComputer Science, pages 3–26. Springer, 2016.
[26] Stefan Mangard, Elisabeth Oswald, and Francois-Xavier Standaert.One for all - all for one: unifying standard differential poweranalysis attacks. IET Information Security, 5(2):100–110, 2011.
[27] Rita Mayer-Sommer. Smartly analyzing the simplicity and thepower of simple power analysis on smartcards. In Cetin Kaya Kocand Christof Paar, editors, Cryptographic Hardware and EmbeddedSystems - CHES 2000, Second International Workshop, Worcester, MA,USA, August 17-18, 2000, Proceedings, volume 1965 of Lecture Notesin Computer Science, pages 78–92. Springer, 2000.
[28] Marcel Medwed, Francois-Xavier Standaert, Johann Großschadl,and Francesco Regazzoni. Fresh re-keying: Security against side-channel and fault attacks for low-cost devices. In Daniel J.Bernstein and Tanja Lange, editors, Progress in Cryptology -AFRICACRYPT 2010, Third International Conference on Cryptology inAfrica, Stellenbosch, South Africa, May 3-6, 2010. Proceedings, volume6055 of Lecture Notes in Computer Science, pages 279–296. Springer,2010.
[29] Hanchuan Peng, Fuhui Long, and Chris H. Q. Ding. Feature selec-tion based on mutual information: Criteria of max-dependency,max-relevance, and min-redundancy. IEEE Trans. Pattern Anal.Mach. Intell., 27(8):1226–1238, 2005.
[30] Emmanuel Prouff and Matthieu Rivain. A generic method for se-cure sbox implementation. In Sehun Kim, Moti Yung, and Hyung-Woo Lee, editors, Information Security Applications, 8th InternationalWorkshop, WISA 2007, Jeju Island, Korea, August 27-29, 2007, RevisedSelected Papers, volume 4867 of Lecture Notes in Computer Science,pages 227–244. Springer, 2007.
[31] Werner Schindler, Kerstin Lemke, and Christof Paar. A stochasticmodel for differential side channel cryptanalysis. In Josyula R.Rao and Berk Sunar, editors, Cryptographic Hardware and EmbeddedSystems - CHES 2005, 7th International Workshop, Edinburgh, UK,August 29 - September 1, 2005, Proceedings, volume 3659 of LectureNotes in Computer Science, pages 30–46. Springer, 2005.
[32] Kai Schramm and Christof Paar. Higher order masking of theAES. In David Pointcheval, editor, Topics in Cryptology - CT-RSA2006, The Cryptographers’ Track at the RSA Conference 2006, San Jose,CA, USA, February 13-17, 2006, Proceedings, volume 3860 of LectureNotes in Computer Science, pages 208–225. Springer, 2006.
[33] Francois-Xavier Standaert, Tal Malkin, and Moti Yung. A unifiedframework for the analysis of side-channel key recovery attacks. InAntoine Joux, editor, Advances in Cryptology - EUROCRYPT 2009,28th Annual International Conference on the Theory and Applicationsof Cryptographic Techniques, Cologne, Germany, April 26-30, 2009.Proceedings, volume 5479 of Lecture Notes in Computer Science, pages443–461. Springer, 2009.
[34] Giorgio Valentini and Thomas G. Dietterich. Low bias baggedsupport vector machines. In Tom Fawcett and Nina Mishra,editors, Machine Learning, Proceedings of the Twentieth InternationalConference (ICML 2003), August 21-24, 2003, Washington, DC, USA,pages 752–759. AAAI Press, 2003.
[35] Peter van der Putten and Maarten van Someren. A bias-varianceanalysis of a real world learning problem: The coil challenge 2000.Machine Learning, 57(1-2):177–195, 2004.
[36] Carolyn Whitnall, Elisabeth Oswald, and Francois-Xavier Stan-daert. The myth of generic dpa...and the magic of learning. InJosh Benaloh, editor, Topics in Cryptology - CT-RSA 2014 - TheCryptographer’s Track at the RSA Conference 2014, San Francisco,CA, USA, February 25-28, 2014. Proceedings, volume 8366 of LectureNotes in Computer Science, pages 183–205. Springer, 2014.
[37] Michael J. Wiener, editor. Advances in Cryptology - CRYPTO’99, 19th Annual International Cryptology Conference, Santa Barbara,California, USA, August 15-19, 1999, Proceedings, volume 1666 ofLecture Notes in Computer Science. Springer, 1999.
Liran Lerman Liran Lerman received the PhDdegree in the department of Computer Scienceat the Universite libre de Bruxelles (in Belgium)in 2015. In 2010, he received with honors (grademagna cum laude) the master degree from thesame university. During his PhD thesis, he wasa teaching assistant and a student doing re-search as part of a Machine Learning Group(MLG) and the Cryptography and Security Ser-vice (QualSec). Currently, he is a post-doctoralresearcher of the QualSec. His research relates
to machine learning, side-channel attacks and countermeasures.
Nikita Veshchikov Nikita Veshchikov got hisBachelor in Computer Sciences in 2009 at Uni-versite Libre de Bruxelles (ULB) in Belgium. Hecontinued studies in the same field and got aMaster in Computer Sciences with advancedstudies of embedded systems in 2011 at thesame university. During his master thesis hestudied reverse engineering and anti-patchingtechniques. Since 2011 Nikita works as a teach-ing assistant and works on his thesis in the fieldof side-channel attacks. His is mostly interested
in simulators and automated tools for side-channel analysis.
Olivier Markowitch Olivier Markowitch is pro-fessor at the Universite libre de Bruxelles. He isteaching algorithmics and cryptography courses.He is leading the QualSec Research Group whois active in the fields of side channel attacks andcryptographic protocols. He is currently at thehead of the Computer Science Department.
Francois-Xavier Standaert Francois-XavierStandaert was born in Brussels, Belgium in1978. He received the Electrical Engineeringdegree and PhD degree from the Universiteecatholique de Louvain, respectively in 2001and 2004. In 2004-2005, he was a Fulbrightvisiting researcher at Columbia University,Department of Computer Science, NetworkSecurity Lab and at the MIT Medialab, Centerfor Bits and Atoms. In 2006, he was a foundingmember of IntoPix s.a. From 2005 to 2008,
he was a post-doctoral researcher of the UCL Crypto Group and aregular visitor of the two aforementioned laboratories. Since 2008, heis associate researcher of the Belgian Fund for Scientific Research(F.R.S.-FNRS) and professor at the UCL Institute of Information andCommunication Technologies, Electronics and Applied Mathematics(ICTEAM). In 2010, he was program co-chair of CHES (which isthe flagship workshop on cryptographic hardware). In 2011, he wasawarded a Starting Independent Research Grant by the EuropeanResearch Council. In 2016, he has been awarded a Consolidator Grantby the European Research Council. From 2017 to 2020, he will beboard member (director) of the International Association for CryptologicResearch (IACR). His research interests include cryptographichardware and embedded systems, low power implementations forconstrained environments (RFIDs, sensor networks, ...), the design andcryptanalysis of symmetric cryptographic primitives, physical securityissues in general and side-channel analysis in particular.