ieee transactions on intelligent transportation systems ... · ieee transactions on intelligent...
TRANSCRIPT
IEEE TRANSACTIONS ON INTELLIGENT TRANSPORTATION SYSTEMS, VOL. 7, NO. 1, MARCH 2006 38
Real-Time Dense Stereo for Intelligent VehiclesWannes van der Mark and Dariu M. Gavrila
Abstract— Stereo vision is an attractive passive sensing tech-nique for obtaining three-dimensional (3-D) measurements. Re-cent hardware advances have given rise to a new class of real-time dense disparity estimation algorithms. This paper examinestheir suitability for intelligent vehicle (IV) applications. In orderto gain a better understanding of the performance and com-putational cost trade-off, the authors created a framework ofreal-time implementations. This consists of different methodicalcomponents based on Single Instruction Multiple Data (SIMD)techniques.
Furthermore, the resulting algorithmic variations are com-pared with other publicly available algorithms. The authors arguethat existing, publicly available stereo data sets are not verysuitable for the IV domain. Therefore, the authors’ evaluation ofstereo algorithms is based on novel realistically looking simulateddata as well as real data from complex urban traffic scenes. Inorder to facilitate future benchmarks, all data used in this paperis made publicly available.
The results from this study reveal that there is a considerableinfluence of scene conditions on the performance of all testedalgorithms. Approaches that aim for (global) search optimizationare more affected by this than other approaches. The bestoverall performance is achieved by the proposed multiple windowalgorithm which uses local matching and a left-right check forrobust error rejection.
Timing results show that the simplest of the proposed SIMDvariants are more than twice as fast than the most complex one.Nevertheless, the latter still achieve real-time processing speedswhile their average accuracy is at least equal to that of publiclyavailable non-SIMD algorithms.
Index Terms— Dense disparity, real time, single instructionmultiple data (SIMD), stereo vision.
I. INTRODUCTION
AN appealing application of intelligent transport systems(ITS) is the automatization of the transport of people and
goods in inner city environments. In order to preserve safety insuch complex environments, current operational systems, suchas people movers, need areas or lanes that are separated fromother traffic. Reliable, robust and real-time obstacle detectionmethodologies are needed to enable the safe operation ofthese types of intelligent vehicles (IV) among other trafficparticipants such as cars and pedestrians.
Stereo vision has the advantage that it is able to obtain anaccurate and detailed 3D representation of the environmentaround a vehicle, by passive sensing and at a relatively low
Manuscript received April 8, 2005; revised September 9, 2005 and October13, 2005. This work was supported in part by the TNO project “AutomatisedSafety for Traffic and Transport” (AV3) and by the 5th Framework EU ProjectSAVE-U (IST-2001-34040).
W. van der Mark is with the Electro-Optics Group at TNO Defence,Security and Safety, Oude Waalsdorperweg 63, P.O. Box 96864, 2509 JGThe Hague, The Netherlands (e-mail: [email protected]).
D. M. Gavrila is with the Intelligent Systems Group at the Faculty ofScience, University of Amsterdam, Kruislaan 403, 1098 SJ Amsterdam, TheNetherlands (e-mail: [email protected]). He is also with the MachinePerception Department of DaimlerChrysler Research, Ulm, Germany.
sensor cost. The work by Labayrade et al. [18] is an exampleof a real-time stereo system that is able to detect vehicles upto 80 m away. This and other previous applications (e.g. [6])for IV have mostly used sparse, feature-based approaches tostereo vision. Here only a subset of image pixels (e.g. verticaledge pixels) are matched, in order to meet real time processingrequirements.
However, by only using sparse depth data, it is more difficultto perform a subsequent object segmentation step. For exam-ple, the vertical edges of a single object are often separated. Ifedges of different objects are near to each other it is difficultto determine which of them belong to the same objects. Thiscomplicates the application of other processing steps such asclassification and tracking because these require some formof image segmentation. For this reason, it is attractive to usedense stereo vision, that tries to estimate disparity for all imagepoints.
A large research community centres around dense stereovision because it is attractive for a number of applications suchas robot navigation, surveillance systems, 3D modelling, aug-mented reality and video conferences. Many systems for densestereo vision or disparity estimation have been presented, asdiscussed in two large surveys of the field, one by Scharsteinand Szeliski [22] and another by Brown et al. [3].
In contrast to previous surveys, this paper does not aimto review the whole field of dense stereo. Our aim is toinvestigate if certain approaches to dense stereo vision aremore suitable for IV applications than others. The criteriaof this investigation are founded on practical considerationsspecifically related to the IV domain.
The first of these considerations is that application of densestereo in IV is only possible if the disparity map can be cal-culated in real-time. Single Instruction Multiple Data (SIMD)offers an appealing and straightforward way for speeding upcomputation by carrying out one operation on multiple valuessimultaneously. Because the parallelism is only in terms ofthe data, difficult problems such as process synchronizationcan be avoided.
Over the past few years, manufacturers have extendedgeneral purpose processors with SIMD capabilities in responseto demanding multimedia applications (e.g. SSE2 instructionset for Intel processors, as used in this paper). Yet SIMD alsoforms the basis architecture for special hardware as used inthe ITS domain (e.g. DSPs), which faces particular demandswith respect to power consumption, cost and compactness.Therefore, in order to evaluate dense stereo vision algorithmsfrom IV perspective, it is important to consider their suitabilityregarding SIMD parallelism.
In this paper, we identify different methodological compo-nents and develop efficient underlying SIMD implementations.The latter are combined in a single framework enabling
IEEE TRANSACTIONS ON INTELLIGENT TRANSPORTATION SYSTEMS, VOL. 7, NO. 1, MARCH 2006 39
comparisons and analysis of the various approaches on anequal basis.
A second consideration is that the output of stereo algo-rithms on itself is not interesting for IV applications. Onlysubsequent steps, such as obstacle detection or segmentation,can provide useful information about the vehicle surroundings.Other work on dense stereo vision has often used errormeasures where only the quality of the disparity values wasevaluated. We will present error measures and evaluationtechniques which are more related to typical applications ofstereo vision in the IV domain.
The outline of this paper is as follows. Section II firstdiscusses a number of concepts for dense disparity com-putation from the literature. In Section III, we present thecorresponding real-time SIMD implementations. Section IVcompares the resulting algorithms with additional, publiclyavailable approaches [1], [22] on both simulated and real datadepicting complex urban traffic scenes. Section V contains theconclusion.
II. APPROACHES TO STEREO VISION
The goal of stereo disparity estimation is finding the correctcorrespondences between image points from the left and rightcamera. For each point, the positions of possible matches inthe other image is constrained to a single epipolar line, ifthe stereo camera geometry is known. Most approaches todisparity assume that the epipolar lines run parallel to theimage lines, so that corresponding points lie on the same imagelines. This situation can be achieved for stereo cameras byusing a rectification technique [7]. If images are rectified, thedisparity d between a corresponding left point l and a rightpoint r can be expressed as:
d = l − r (1)
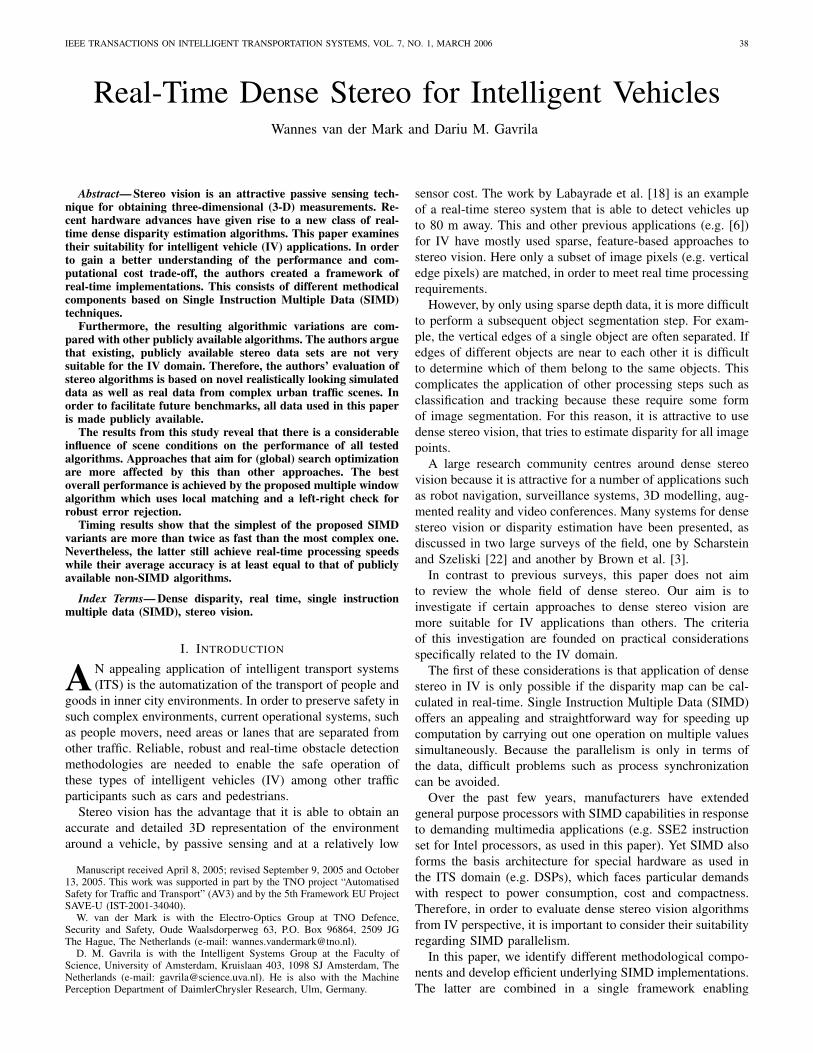
The disparity space contains all possible matches for thesame left and the right stereo image line. The possible matchesfor a point of the left line are a column in this space, thepossible matches for a point on the right line form a row.Often, a minimum dmin and maximum dmax disparity areused to bound this space. Fig. 1 shows a drawing of thedisparity space with dmin = 0.
Usually, one can distinguish two stages in a disparity estima-tor. In the first stage, cost values are calculated for comparingthe different points in the disparity search space. These costvalues are used in the second stage for searching the correctpoints (matches) in the disparity space. Some algorithms useadditional pre- and post-processing steps. In order to simplifythe matching step, pre-processing is applied to reduce theillumination differences between the stereo images. A typicalpost-processing step is the detection of occlusions, that areimage regions only visible in one of the stereo images.
In the following sections we describe methods from litera-ture that can be used for each step.
A. Pre-processing
A complicating factor for stereo matching is that the in-tensities of corresponding pixels from the stereo images can
be different. This can be caused by unequal left and rightcamera sensor characteristics such as brightness and contrast.It is also due to differences in lighting conditions at each of thecamera positions. If raw input images are used, it is necessaryto use an illumination invariant similarity measure. Becauseinvariant measures are computationally more expensive, pre-processing of input images is often applied to reduce theillumination differences beforehand. One approach subtractsmedian filtered versions from the original input images [24]. Amore popular approach is the convolution of the input imageswith a Laplacian of Gaussian (LoG) kernel [4]. This reducesillumination influences because the response of the Laplacianis zero in areas with constant intensity while it is either positiveor negative near edges with high intensity gradient.
Preprocessing can also be used to extract extra informationin order to aid the subsequent disparity search. Hong and Chen[11] use colour based segmentation to find similarly colouredpatches. They match patches instead of individual pixels be-cause the assumption is that no large disparity discontinuitiesoccur within the homogeneous coloured patches.
B. Similarity measuresThe simplest similarity measures are based on the difference
in pixel intensity, such as absolute difference (AD) or squareddifference (SD). Algorithms that only use these single intensitymeasures in order to compare points are known as “pixel-to-pixel” algorithms. Unfortunately, discrete images have a quitelimited number of different gray-level intensity values. It ispossible to use colour instead [20]. However, colour is difficultto use during nighttime conditions due to monochromaticstreet lightening.
Pixel-to-pixel measures are not very distinctive when inten-sities of different pixels are the same or corrupted by noise.Birchfield and Tomasi [1] also pointed out the sensitivityto image sampling. For example, the pixel intensities oncorresponding stereo edges can be different due to aliasing.They have therefore designed a measure that is less sensitiveto image sampling.
A more commonly used approach for improving distinction,is using a larger support region for aggregating the cost values.Typically, the sum of the pixel differences in a window arounda pixel of interest is used, such as the sum of absolutedifferences (SAD) or the sum of squared differences (SSD).
The use of larger windows will lead to more robustnessagainst noise. However, larger windows with fixed size andcentre point will lead to less accuracy in disparity estimates.This is due to the fact that areas on slated surfaces will warpprojectively between the stereo images. A square window onsuch a surface will therefore only correspond correctly to aprojectively warped version in the other image.
Occlusions near object edges can also cause problems.When a large window is centred around a background pointnear a object edge it will almost certainly encapsulate a portionof the foreground object. In the case of an occlusion, a largeamount of background pixels in the window will not be visiblein the other image. The resulting similarity measure willwrongfully be biased towards disparities that belong to theforeground pixels.
IEEE TRANSACTIONS ON INTELLIGENT TRANSPORTATION SYSTEMS, VOL. 7, NO. 1, MARCH 2006 40
l
r
max=d
0=d
l
r
max=d
0=d
Fig. 1. Disparity search space. Thelight gray area shows the left-to-rightsearch area for a point match, whilethe dark area shows the right-to-leftsearch area.
Fig. 2. Multiple cost windows. Apartfor the centre window indicated bythe solid lines, four additional win-dows centred at A,B,C and D areused.
In the literature, several ways can be found to improvewindow based matching. An adaptive size cost window wasproposed by the Kanade and Okutomi [12]. Given an initialguess of disparity, they use a statistical technique in orderto estimate the optimal size and box shape of each matchingwindow. However, estimating the optimal window size at allpoints is computationally expensive.
Other ways of improving the cost computation includemulti-scale techniques and the use of multiple windows. Insome multi-scale approaches several matching windows ofdifferent sizes are used. The larger windows provide the ro-bustness, while the smaller windows provide precision. On thedownside, matching errors at the coarse scale might propagateto the finer scales.
A somewhat similar approach is not changing the size ofthe windows, but having different options for the location ofthe centre point. Both Bobick et al. [2] and Fusiello et al. [8]use nine different window centre points in their approaches.For real-time applications, Hirschmuller et al. [10] suggestthe use of five-window configuration. Fig. 2 shows the regularmatching window centred in the middle. On the edge points(A,B,C,D) of this window four additional windows have beenindicated. Of these four windows the two with the lowest SADvalues are searched. They are added to the value of the centrewindow. This step acts as a sort of deformable window, whichmeans that the resulting window does not have to be centredon the point itself.
C. Disparity search
When similarity or cost values in the disparity search spacehave been calculated, the correct matches can be searched.A straightforward way of doing this is searching the disparityinterval per point for a optimum value. This approach is knownas the Winner-Takes-All (WTA) approach.
A drawback of the simple WTA approach is that it doesnot consider the presence of occlusions. This will result inwrong disparity estimates for those regions. Because WTAonly searches for optimum cost values it is very sensitive to theresults from the cost computation. The cost values computedfor a textureless region often do not indicate a optimum match
due to their similarity. Repetitive texture, such as bars, can leadto several ambiguous optimums. In these areas, the WTA isprone to errors.
Assumptions about the scene geometry can be exploited toimprove disparity estimates. Three often applied assumptionsare the “smoothness constraint”, “uniqueness constraint” and“ordering constraint”. The smoothness constraint is based onthe observation that changes in depth on surfaces are muchsmaller than those at the edges of objects.
The uniqueness constraint states that a 3D point onlyhas exactly one projection in each of the stereo cameras.Therefore, only one correspondence has to be found for everystereo point pair. The constraint is only violated by imagepoints on transparent material or occluded image parts. Theordering constraint states that the sequence in which points areordered on a left image line, is the same for the right imageline. If occlusions are present, points can be missing fromone of the line sequences, but the ordering will remain. Thereare scene situations possible where the ordering constraint isviolated [26]. However, it is assumed that they are not verycommon.
A cost function (CF) is one approach to enforcing smooth-ness. It can be used to locally add penalties to the values inthe disparity search interval of each next point on the scanline.Mismatches can be suppressed by penalizing large jumps indisparity between the scanline points. The difficulty of thisapproach is how to choose the penalty function. If penaltiesare too high, disparity jumps near edges are missed and if theyare too low the smoothness in not enforced.
Given a correct stereo match in the disparity space, both theuniqueness and ordering constraint limit the number of pos-sible matches for the following pixel on the reference image.Because of the limitations, finding the correct disparities isnow akin to finding a valid path that takes the shortest routethrough the cost values. Special rules for how to transverse thesearch space can be added in order to handle occlusions andjumps in disparity. Dynamic-programming (DP) techniques areoften used for this approach [2].
Another search optimization technique called Scanline Op-timization (SO) was proposed by Scharstein and Szeliski [22].Instead of enforcing special rules for occlusion and disparityjumps, they use a global variant of a smoothness cost functionto add penalties to the matching costs. Then a disparity issearched for each scanline point that minimizes the total cost.
In both the SO and DP the optimization and search tech-niques are constrained to one single scanline. Just like CF,they are very dependent on the choice of rules that governthe path propagation or the cost functions that are used forsearching the optimum solution. This can cause them to missor wrongfully suppress large jumps in disparity, for examplenear object edges. These types of errors cause “streaks” oferroneous disparity estimates along scanlines. Interline consis-tency is difficult to maintain with these techniques. Recently,some work appeared on optimizing in more than one direction.The two pass approach of Kim et al. [14], uses the results ofthe first optimization pass along the scanlines to optimize theestimates across the scanlines in the second pass.
An alternative approach is to view disparity search as

IEEE TRANSACTIONS ON INTELLIGENT TRANSPORTATION SYSTEMS, VOL. 7, NO. 1, MARCH 2006 41
a directed graph labelling problem. The graph nodes canrepresent left and right pixel pairs with disparity as label.They can also represent whole pixel patches extracted witha pre-processing step. Each transition between nodes has acost specified by a CF that partially depends on the assigneddisparity label. In several approaches [17], [11], [5] graph cutsare used to the find disparity label assignments that minimizethe transition costs. The graph optimization approach carriesa high computational cost. However, the algorithms based onit are among those that currently reside in the top positions ofthe performance ranking on the Middlebury stereo vision website [28].
D. Post-processing
This section is devoted to some of the additional stepsperformed next to the disparity estimation. These include errordetection, subpixel interpolation and occlusion removal.
It was mentioned earlier that image regions with littleor repetitive texture are problematic for stereo algorithms.Some approaches try to detect possible errors in the disparityestimates. Fusiello et al. [8] use the variance of the cost valuesin the disparity range of a point as a measure of confidence.Other approaches [10] select the optimum C1 and second bestvalue C2 from the disparity search range. The confidence inthe selected optimum is expressed as:
C =C2 − C1
C1(2)
The idea is based on the fact that the cost values of atextureless region will be very similar. Repetitive texture willlead to several optimums in the disparity interval. The measureof Eq. 2 will be low in both cases. However, Muhlmann etal. [20] argue that there are occurrences where the optimumcorrespondence is actually between two pixels. This also leadsto two very similar optimum values in the disparity searchspace. To prevent discarding good estimates on these points,they suggest using the third best optimum instead of the secondbest.
Besides using integer values for disparity correspondence,floating-point values can be also used for subpixel accuracy.Many algorithms use an additional post-processing step forimproving the disparity estimate to subpixel accuracy. If theSSD similarity measure is used, the cost values near anoptimum can be approximated by a second degree polynomial.Given the cost values of the optimum and its two nearestneighbours, the subpixel estimate can be computed by:
dsubpixel = d +Cd−1 − Cd+1
2(Cd−1 − 2Cd + Cd+1)(3)
Although this formula is intended for the SSD measure,many SAD based approaches [10], [20], [25] do also apply itfor subpixel interpolation.
As indicated earlier, an extra step is necessary to detectand remove erroneous estimates on occlusions by WTA. Theassumptions about scene geometry can also be exploited forthis purpose.
One technique often used is the left-right consistency check.This check exploits the uniqueness constraint. It is assumed
that the left to right and the right to left disparities areknown. The algorithm checks that the disparity from leftto right correspondence is the same value as when it isdone conversely, searching the match from the right imageto left image. Different value means inconsistency that couldbe caused by an occlusion and therefore, these matches areremoved.
A drawback of this approach is that the minimum disparityhas to be searched twice for every pixel. Stefano et al. [25]show that the uniqueness constraint can also be exploitedfor occlusion and error removal. During the search for leftto right disparities, the cost value of a best match is storedfor every newly matched right pixel. If a right pixel isencountered that has been matched before, the new and theold cost value of the match are compared. The old matchis removed when the new cost value is smaller. This allowsthe algorithms to ‘recover’ from previously made bad matches.
III. DENSE REAL TIME STEREO FRAMEWORK
In order to investigate the suitability of real-time densealgorithms for the IV domain on an equal basis, we haveimplemented our own framework of real-time dense stereoalgorithms. These algorithms use the latest SIMD SSE2 in-struction set available on the Intel Pentium 4 or AMD Athlon64 processors. The SSE2 instruction set uses 128-bit registers.For integer operations these can contain packed 8, 16, 32 or64-bit data buffers.
Implementation based on SIMD is not straightforward be-cause it places restrictions on what kind of operations canbe used. An algorithm can only be sped up if the necessaryoperations can be performed in parallel. Conditional constructsmust be avoided because they often lead to stalls of thecode path prediction unit on the processor [9]. Furthermore,processing can only achieve its maximum speed if the valuesreside in the (Level 1) cache of the processor. Because ofthe much lower speed of main memory, loads and stores toand from it should be kept to a minimum by doing all theoperations on the data in one go.
These considerations and the real-time requirements for ITSlimit our choice of approaches from the previous section. Forexample, the current top ranking algorithms on the Middleburystereo vision web site [28], based on the graph cuts technique,are not suitable due to their computational complexity andmemory requirements. Our implementation therefore consistsof several components, discussed in the previous section,that are more suitable for real-time operation. They can becombined to form different stereo algorithms.
The following sections explain how the components in ourframework have been optimized.
A. SAD value computation
The SAD similarity measure can be computed efficientlyby exploiting the fact that neighbouring windows overlap. Forneighbouring windows with the same disparity, the overlap-ping pixels will contain equal absolute difference (AD) values.Therefore, a new SAD can be computed out of an old one by
IEEE TRANSACTIONS ON INTELLIGENT TRANSPORTATION SYSTEMS, VOL. 7, NO. 1, MARCH 2006 42
wh
x
y
x x x
1 2 3 4
− +
− + −
+
sumteIntermedia sdifference pixel absolute of sumWindow
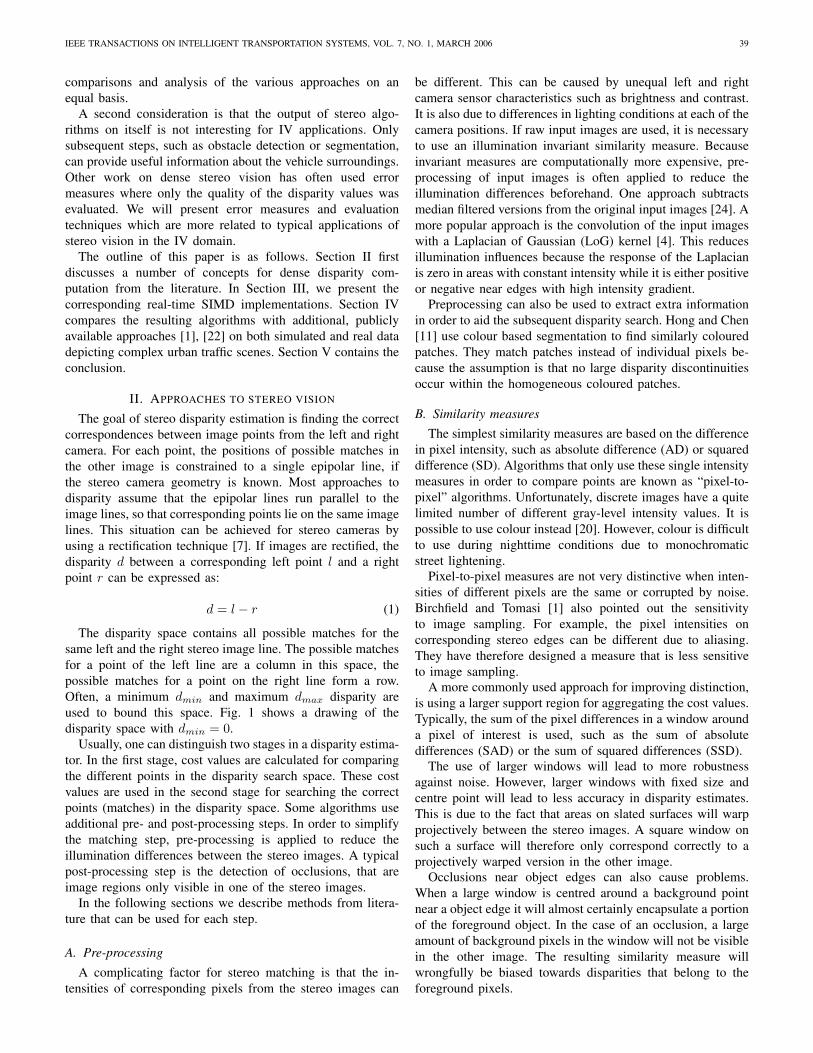
Fig. 3. Computation of a new SAD value out of the value of an old oneusing intermediate row sums.
subtracting the values, which are only parts of the old window,and adding the values, which are only parts of the new window.
Fig. 3 shows how a new SAD value of a window of sizewidth 2w + 1 and height 2h + 1 centred at (x, y + 1) can becomputed from the previous sum of a window at (x, y). Thisprocess utilizes the intermediate sums of AD values in rowsof the same width as the matching window. Once such a sumis initialized at the beginning of a line, successive sums canbe calculated recursively by first subtracting the most left ADvalue and adding the new AD value at the right-hand side.Calculated AD values for the additions are stored temporallyin order to re-use them for the subtractions.
Two intermediate sums are applied in order to calculate thenew SAD value of a window at (x, y + 1) from the old valueof the window at (x, y). The first intermediate sum is usedfor the AD values that belong to the upper row of the oldwindow. The second sum holds the AD values of the lowerrow of the window at the new position. By subtracting theupper row and adding the lower row, the new SAD value canbe calculated. By repeating this process, a cascade functionis created that only requires two pixel AD’s, four subtractionsand four additions in order to compute a new window sum.
The previously described steps can be executed for multipledisparity values simultaneously with SIMD type processing.For the computation of the AD values, SSE2 register xmm0is filled with 16 copies of the left pixel value. The registerxmm1 holds 16 pixels values from the right disparity interval.Only two saturated subtractions (xmm0−xmm1 and xmm1−xmm0) and the logical or of the results is needed to calculatethe 16 AD’s. The update of the intermediate sums and theSAD values themselves are carried out with regular SSE2subtractions and additions.
B. Multiple windows
As explained earlier, the main deficiency of window basedalgorithms is their poor performance near object edges and ontextureless regions. Multiple window approaches can improvethe results.
Our implementation of the five window method byHirschmuller et al. [10] uses a vertical and horizontal step.In the vertical compare step, newly computed SAD valuesare compared with the values of 2h processed image linesearlier. The results are temporally stored as the minimumand maximum values for the current ‘centre’ image line of himage lines earlier. In the horizontal step, the vertical valueson either side (x − w and x + w) of a point are compared.
The maximum of the left hand side is compared with theminimum of the right hand side and vice versa. The tworesulting minimum values are also the two smallest valuesof the four windows. On average, only three compares areneeded to find the smallest values with this method.
C. Left to right minimum search
An important step in a stereo algorithm is searching for thedisparities with the lowest SAD values. Fig. 1 shows the searchspace for a disparity interval of 0 ≤ d ≤ max. For a pointl on the left image line, the possible matches with points onthe right image line are indicated with light grey in the searchspace. Finding the correct match by searching the match withthe lowest SAD value is computationally expensive becausethe whole disparity interval has to be searched.
In [24], a method was shown for finding a minimum usingmultimedia extensions (MMX) instruction set that we havemodified to work with SSE2. In this approach two types ofSSE2 registers are used, one holding the range of disparityvalues and the other holding a copy of the associated SADvalues. All values of two SAD registers can be comparedin pairs using a single ‘compare smaller than’ instruction.Both the smaller SAD values and accompanying disparityvalues can be selected afterwards, using the resulting binarymask. This algorithm can be used to process a large disparityrange recursively, after which only eight values remain to besearched in order to find a single minimum.
D. Right to left minimum search
Disparity search can also be performed from right to left.Dark gray is used in Fig. 1 to indicate possible matches onthe left line for a right point r.
Right to left search does not require recomputation of theSAD values, the earlier computed left to right values can bere-used. However, because of the arrangement of the valuesin memory, a different algorithm is needed in order to applySIMD techniques. By evaluating the SAD value of multipleright points, instead of one point, this problem can be solved.Similar to the approach chosen for left to right search, westart out with an array holding the SAD values and anotherholding the disparity values. However, now the SAD valuesare compared with the SAD values in the next array. In orderto align the next SAD values, the values are shifted down oneposition. By repeating these steps, all the SAD values in thedisparity interval of a right pixel are compared sequentially.Eventually, the lowest SAD value and its disparity are the onesdiscarded from the arrays during the shift step.
E. Search optimizing technique
Almost all real-time SIMD based algorithms known fromliterature use the simple WTA technique for disparity search.We have also implemented a search optimizing method basedon dynamic programming. It is based on a technique, proposedby Kraft and Jonker [15], that uses two stages; a cost valuepropagation stage and a collection stage for retrieving the bestdisparity estimates.

IEEE TRANSACTIONS ON INTELLIGENT TRANSPORTATION SYSTEMS, VOL. 7, NO. 1, MARCH 2006 43
AB C
D
( )d,x 1− ( )1−d,x
( )11 +− d,x
Fig. 4. Possible predecessor points in cost propagation step. Predecessorpoint B has the same disparity as point D, while the points A and C arerespectively an occlusion or part of a discontinuity.
In the cost propagation stage, which runs from left to rightthrough the disparity space, each point receives a cost valuefrom a preceding point. The number of preceding points islimited to three possibilities, that are indicated for a singlepoint in Fig. 4. Each preceding point has a different weightcost added to its accumulated cost value. Constant weights WA
and WC are used for the points A and C which are occlusionand discontinuity points, respectively. The actual SAD valueof point B is used as its weight because its disparity is equalto that of the current point. The predecessor with the lowesttotal cost value is selected as predecessor of the current point.Each point also stores the location of its predecessor. Thesereferences link up to form a path trough the disparity searchspace. At the end of the propagation stage, the best path issimply selected by searching for the lowest accumulated costvalue. The best disparities are found in the collection stage bybacktracking this path.
F. Subpixel interpolation
The algorithms of our framework estimate disparity withsubpixel accuracy. Until now, we have described integer basedoperations with SSE2. The (older) SSE instruction set alsocontains SIMD operations for operations on 128 bit registerswith packed 32 bit floats. We use SSE instructions for comput-ing Eq. 3, which enables subpixel estimation for four pointssimultaneously.
G. Occlusion removal
We have implemented two types of algorithm componentsfor removing pixels in occlusions and erroneous matches. Thefirst type is the left-right check [10], [20], [24]. The secondtype is the “recover” approach [25]. Detected occluded pixelsare set to a predefined error code. This can be a value that ishigher than the disparity maximum or simply zero.
Because of the conditional dependencies used in both ap-proaches no straightforward application of SIMD is possible.Fortunately, each check only has to be executed one timefor every pixel. The required overhead is insignificant whencompared to the other steps.
H. Algorithms
Using the described components we have created sevendifferent stereo algorithms:
1) SADL: SAD WTA only left to right search.2) SADRec: SAD WTA with recover approach.3) SADLR: SAD WTA with left-right check.4) SADMW5 L: same as 1, but with multiple windows.5) SADMW5 Rec: same as 2, but with multiple windows.6) SADMW5 LR: same as 3, but with multiple windows.7) SADDP : SAD with dynamic programming disparity
search method.
IV. EXPERIMENTS
The presented implementations have been tested and com-pared, together with four other publicly available algorithms.These are the SSD, DP and SO implementations, created byScharstein and Szeliski (S&S) for their survey [22], that areavailable on the Internet [28]. Furthermore, an implementa-tion of Birchfield and Tomasi’s (B&T) [1] algorithm in theOpenCV library [27] is used.
The SSD algorithm is a WTA type algorithm like themajority of our implementations, however it uses the sum ofsquared differences for matching cost computation. Both DPand B&T use dynamic programming for searching the correctdisparities. In contrast to the other algorithms, B&T does notuse matching windows. Its measure is based on interpolatingvalues between real pixels to achieve sampling invariance. TheSO algorithm uses scanline optimization for improving thedisparity estimate.
A. Stereo image test sequence
For evaluation purposes, several standard stereo image pairswith ground truth are available. A well know example are thestereo pairs of Tsukuba University. Unfortunately, the disparityrange of these pairs is quite small (16 pixels) and the groundtruth disparity is only given with 1 pixel accuracy.
Another well known test set was introduced by Scharsteinand Szeliski in their survey [22]. It does provide wider baselinestereo images with subpixel accurate ground truth disparity.However, in order to keep the acquisition of ground truthdisparity simple, the images only contain planar surfaces.
Because our goal is to investigate the suitability of densestereo vision algorithms for application in the IV domain,test images are needed which show realistic traffic scenes.Unfortunately, none of the commonly used test sets resemblethis type of data.
Instead, we use both real and synthetic data of traffic scenesto evaluate the algorithms. The real image sequences wererecorded with a vehicle mounted stereo camera. These depicttypical traffic scenes with obstacles such as pedestrians andother cars. Unfortunately, the real images do not come with aground truth disparity. It is possible to obtain a ground truthdisparity image with techniques such as active lighting [23].However, this is not a practical approach for outdoor scenesand moving stereo camera rigs. Our analysis of the resultswith real stereo images is therefore limited to qualitativecomparisons.

IEEE TRANSACTIONS ON INTELLIGENT TRANSPORTATION SYSTEMS, VOL. 7, NO. 1, MARCH 2006 44
Fig. 5. Virtual left stereo images from the sequence used for our experiments (frame nr. 20, 60, 100, 140, 160, 220, 260 and 300).
a. Virtual left stereo image b. By S&S DP without noise
c. By WTA MW5 lr with noise d. By S&S DP with noise
Fig. 6. Results with simulated stereo images.
a. Real left stereo image b. By B&T DP
c. By WTA MW5 lr d. By S&S DP
Fig. 7. Results with real stereo images.
A stereo image pair and its ground truth disparity alsocan be generated synthetically from a 3D computer model.The MARS/PRESCAN software [19], [21] is a frameworkfor simulation of different vehicle mounted sensors; suchas radar, laser rangefinder or camera based systems such asstereo vision. With this simulator, a sequence was created of avirtual vehicle equipped with a stereo camera driving throughtraffic scenes. The used city-like scenery is complex and othermoving vehicles are present.
As ground truth, the simulator provides the range images foreach of the stereo images in the sequence. For our experiments,these are converted to disparity images.
The MARS/PRESCAN synthetic stereo images and ground
truth data used in our experiments is publicly available fordownload from the Internet [29]. Some of the 326 images ofthis sequence, which have a resolution of 512 by 512 pixelsand disparity range of 48 pixels, are shown in Fig. 5.
B. Adding real image influences to synthetic images
We first looked at the qualitative similarities between theoutput disparity images generated with the simulated imagesand real images. The results of the simulated data were verygood for all algorithms, see for example the DP result in thenoiseless case (fig. 6b). This is caused by the fact that noimage noise was added to the simulated images.
However, in the output for real stereo images we could more

IEEE TRANSACTIONS ON INTELLIGENT TRANSPORTATION SYSTEMS, VOL. 7, NO. 1, MARCH 2006 45
clearly see errors. An example of a real stereo image of avehicle mounted camera is shown in Fig. 7a. The output ofdynamic programming approaches such as B&T and DP nowshows a lot of “streaking” errors near object boundaries. WTAapproaches such as in our framework and SSD, on the otherhand, generate mainly errors on areas with insufficient texture.See for example the road surface in Fig. 7c.
In order to approach the conditions of the real imagesmore closely we added a number of stereo camera relatedperturbations. These perturbations are mainly due to the optics,sensor signal to noise ratio and the calibration of the stereorig itself.
Light passing through the edges of a camera lens will hitthe image sensor under a different angle than the light thatpasses trough the middle. The light rays at the image edgesare scatted over a larger sensor area than those at the middle.This effect is known as ‘vignetting’ and causes pixels far awayfrom the image centre to be darkened. Fig. 8, shows the pixelweights that are multiplied with the original image pixels toadd this effect. The weights where obtained with the cos4-law,which is the technique for calculating vignetting illuminationfall-off [16].
In real cameras two forms of image noise are caused by theimage sensor. The first type is called fixed pattern noise andis caused by physical differences between the light sensitiveelements on the sensor. However, in almost all modern camerasthe influence of this type of noise is negligible because non-uniformity correction is used. The other type is called temporalnoise and is due to the sensors signal to the noise ratio. Thistype of noise was introduced to the synthetic images by addingwhite Gaussian noise with zero mean and a variance of 1intensity level.
Because dense disparity estimation relies on steps for re-moving lens distortion and rectifying the stereo images, thestereo camera calibration itself is also a potential source ofperturbations. In order to add this influence to the “perfectly”rectified synthetic images, we performed the undistortion andrectification steps on them with parameters based on typicalresidual errors of stereo calibration. Fig. 8 shows the mag-nitudes of the distortion effect between the original and thedistorted synthetic images.
Outputs of the algorithms with these corrupted images nowinvolve similar artifacts as observed in the real images, e.g.see SADMW5 LR and DP results in Fig. 6c & d and Fig. 7c& d.
C. Error measures
Several approaches to quantitative evaluation of stereo al-gorithms exists. One of the most simplest error measures isthe averaged absolute mean error:
Eabs =1n
n∑
i=1
|gi − di| (4)
Where g is the estimate by the evaluated algorithm and dis the ground truth. Larger errors can be accentuated by usingthe squared error instead of the absolute error:
Esq =1n
n∑
i=1
(gi − di)2 (5)
The drawback of both error measures is that they do notdistinguish well between disparity estimates with a lot of smallerrors and disparity estimates with only a few large errors.
Another error measure is the bad pixel percentage. It usesa threshold δ to set a maximum allowed absolute error. Theabsolute differences with the ground truth larger than this valueare counted as bad pixels:
B = 100%1n
n∑
i=1
(|gi − di| > δ) (6)
In contrast to the previous two error measures, small errorsare ignored while other errors are counted regardless of theirmagnitude.
It is difficult to relate the error measures presented so farto problems encountered when dense stereo vision is used asa sensor on a intelligent vehicle. Issues that are of importancehere are the ability to detect objects such as obstacles anddetermine their range accurately.
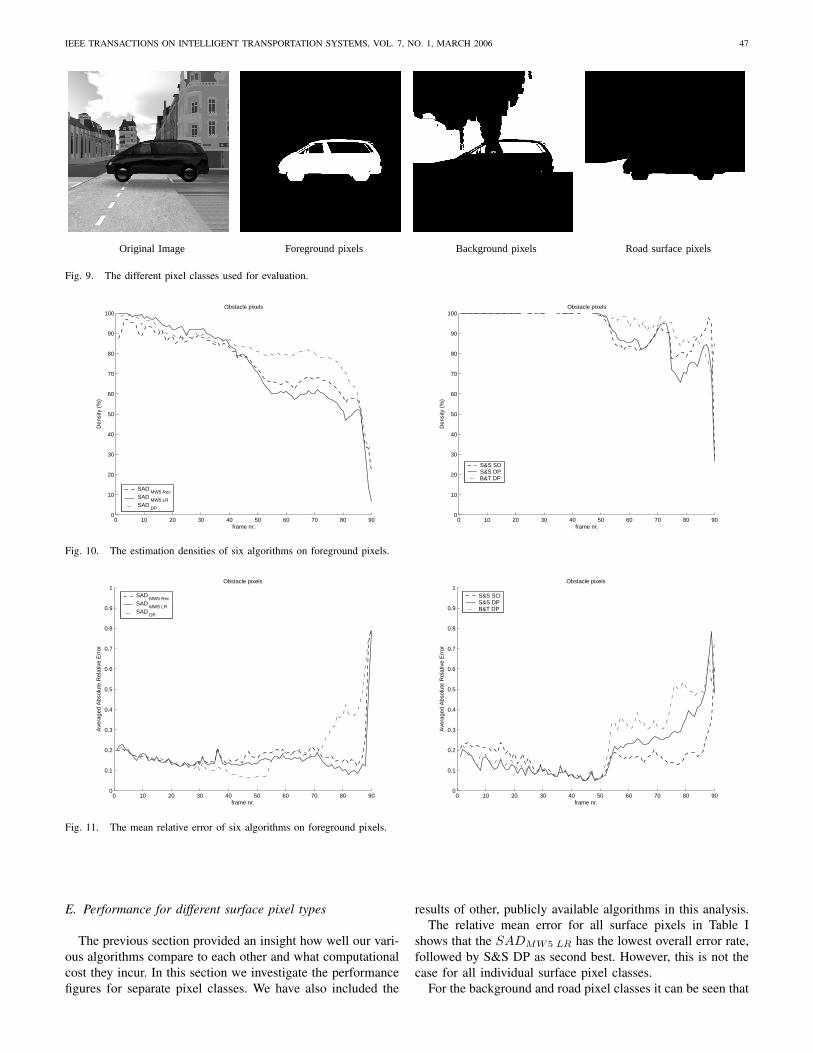
Classifying a group of pixels as an obstacle requires thatthey are distinguishable from other background items such asthe road surface, buildings or the sky. We therefore use theground truth disparity from the MARS/PRESCAN simulatorto divide pixels in each stereo image into four classes. Theseare foreground and background obstacles, road surface andsky. The two cars are the foreground obstacles in our sequencewhile the buildings are background obstacles. Both pixels onthe road and the curb belong to the road surface class. Pixelsthat have zero ground truth disparity are classified as beingsky. Examples of the three pixel classes are shown in Fig. 9.
A range can only be given for pixels that lie on surfaces,such as the foreground, background and road pixels. For thesethree pixel classes we define the estimation density D of adisparity image as:
D = 100%m
nwith m =
n∑
i=1
gi > 0 (7)
This measures which percentage of the foreground, back-ground or road surface pixels have been assigned a disparityestimate.
For stereo, range has an inverse relationship with disparity;small disparities correspond to large distances while largedisparities correspond to small distances. Thus, an error indisparity for a far away point corresponds to a larger errorin range than the same small error in disparity for a nearbypoint. The error measures of Eq. 4, 5 and 6 do not take thisinto account. In the Mean Relative Error measure the absoluteerror is divided by the ground truth disparity for each pixel.Therefore, this measure does actually relate to the expectederror in range estimation.
Erel =1m
m∑
i=1
((gi > 0)
|gi − di|di
)(8)

IEEE TRANSACTIONS ON INTELLIGENT TRANSPORTATION SYSTEMS, VOL. 7, NO. 1, MARCH 2006 46
Vignetting Sensor noise Distortion Resulting image
Fig. 8. Influences on the quality of a stereo image pair.
TABLE IRESULTS OF THE DISPARITY ESTIMATORS FOR DIFFERENT TYPES OF SURFACE PIXELS.
Foreground Background Road All SurfacesR% D% Erel R% D% Erel R% D% Erel R% D% Erel
SADL 0 98.8 0.233 0 99.1 0.662 0 99.7 0.142 0 99.2 0.346SADRec 25.4 72.7 0.182 18.3 80.9 0.460 11.5 88.2 0.109 18.4 80.6 0.250SADLR 26.8 73.0 0.156 17.7 82.0 0.386 9.0 90.9 0.100 17.8 82.0 0.214SADMW5L 0 98.9 0.213 0 99.2 0.535 0 99.8 0.120 0 99.3 0.289SADMW5Rec 20.9 75.8 0.172 14.4 84.3 0.397 11.0 88.1 0.098 15.5 82.7 0.222SADMW5LR 24.5 75.3 0.149 12.4 87.4 0.340 7.6 92.4 0.088 14.8 85.0 0.192SADDP 6.3 82.6 0.188 5.8 90.0 0.361 1.9 94.8 0.076 4.7 89.1 0.208S&S SSD 0 98.2 0.239 0 97.2 0.574 0 98.8 0.159 0 98.1 0.324S&S SO 0 93.9 0.153 0 97.5 0.457 0 95.4 0.126 0 95.6 0.246S&S DP 0 92.8 0.188 0 99.2 0.335 0 95.6 0.087 0 95.9 0.203B&T DP 0 96.3 0.233 0 99.6 0.333 0 99.2 0.110 0 98.4 0.226
For ITS applications it might be perceived that only theperformance measures for the foreground obstacles are im-portant. However, obstacle detection itself involves findingthe correct foreground pixels among the other pixels classes.Since the road surface is more easily distinguishable than the(smaller) foreground objects it is actually searched first insome approaches. The performance measures for the otherclasses are therefore significant because bad estimates herecan cause false positives.
D. Algorithms of the framework
The SIMD based algorithms of our framework and othersfrom the public domain were tested with our sequence. Thewindow based algorithms all used the same square windowsize of 9 by 9 pixels for cost computation. The weights forSADDP were set so that WA = 34000 and WC = 1000. Thetests were conducted on an Intel Pentium 4 3.2 GHz PC with1.0 GB RAM.
The results for the full resolution frames 1 until 90 areshown in Table I. For each of the surface pixel classes therejection percentage R%, estimate density D% and averagedrelative mean error Erel are shown. The fourth column showsthe overall results averaged over all the surface pixels.
We first studied the overall performance of the differentalgorithms from our framework. The algorithms that do notreject pixels show the highest error rates, see Table I. These aremainly caused by erroneous estimations in difficult areas suchas occlusions and textureless regions. The algorithms withpost-processing have lower error rates because they manageto reject many of these pixels. Comparing the percentages of
pixels rejected by the recovery and the left-right approach, itis clear that the left-right approach rejects more pixels. OurDP approach rejects the least amount of pixels.
Considering the timing results for both half and full res-olution frames in Table II, it is clear that the improvementby the post-processing steps comes at the price of a highercomputational cost. The left-right consistency check is moreexpensive than the recovery approach. If the processing timesof SADRec and SADLR algorithms are compared to thetime needed for SADL, the recovery approach shows a 10%increase, while the left-right check shows a 20% increase.The DP approach has the highest computational cost of ouroptimized algorithms. This is due to the fact that referenceshave to be stored for back propagation phase, which increasesthe number of expensive memory operations.
It should be noted that the achieved run times only givean outlook on future performance because they have beenachieved on general purpose computer hardware. For ITSit is much more likely that more dedicated and low-powerembedded SIMD hardware will be used.
As follows from Table I, the multiple window approachdoes improve results. It also decreases the number of rejectedpixels. Of all our algorithms the SADMW5 LR algorithm hasthe lowest mean relative error for all surfaces pixels. From thetiming results however, it is clear that the multiple windowapproach is expensive compared to the single window ap-proach. The multiple window approach increases computationby about 50%.
IEEE TRANSACTIONS ON INTELLIGENT TRANSPORTATION SYSTEMS, VOL. 7, NO. 1, MARCH 2006 47
Original Image Foreground pixels Background pixels Road surface pixels
Fig. 9. The different pixel classes used for evaluation.
0 10 20 30 40 50 60 70 80 900
10
20
30
40
50
60
70
80
90
100
frame nr.
Den
sity
(%
)
Obstacle pixels
SAD MW5 Rec
SAD MW5 LR
SAD DP
0 10 20 30 40 50 60 70 80 900
10
20
30
40
50
60
70
80
90
100
frame nr.
Den
sity
(%
)
Obstacle pixels
S&S SOS&S DPB&T DP
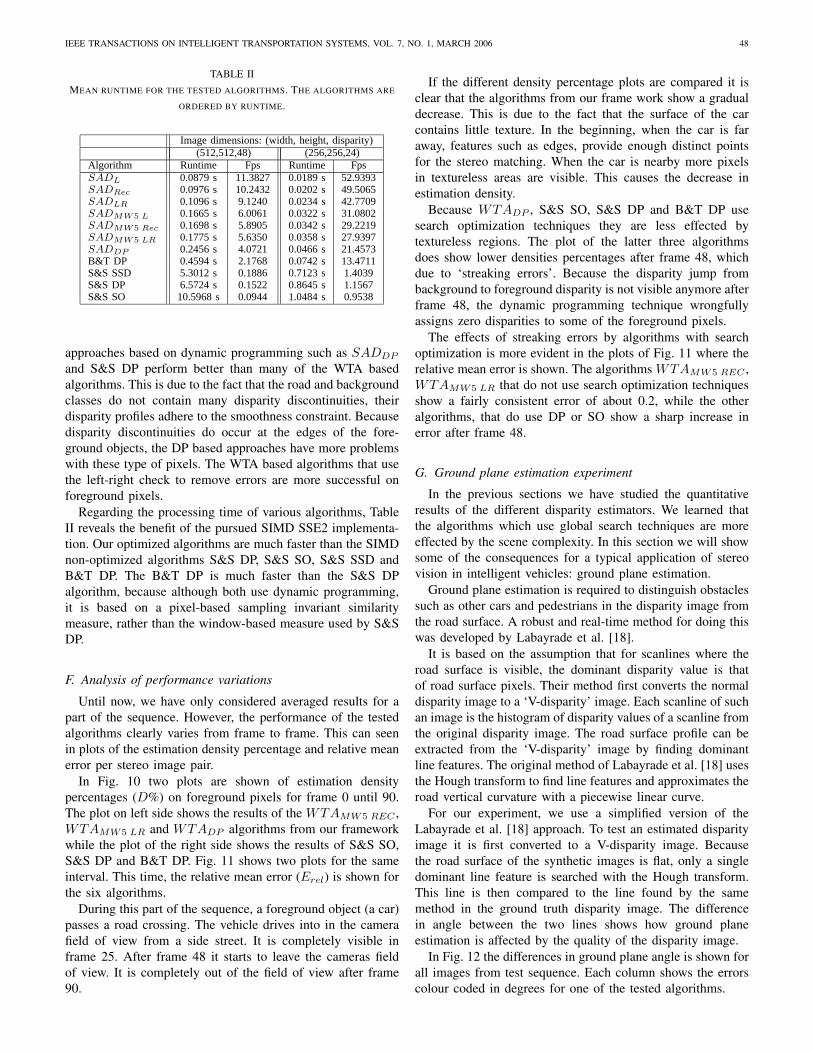
Fig. 10. The estimation densities of six algorithms on foreground pixels.
0 10 20 30 40 50 60 70 80 900
0.1
0.2
0.3
0.4
0.5
0.6
0.7
0.8
0.9
1
frame nr.
Ave
rage
d A
bsol
ute
Rel
ativ
e E
rror
Obstacle pixels
SAD MW5 Rec
SAD MW5 LR
SAD DP
0 10 20 30 40 50 60 70 80 900
0.1
0.2
0.3
0.4
0.5
0.6
0.7
0.8
0.9
1
frame nr.
Ave
rage
d A
bsol
ute
Rel
ativ
e E
rror
Obstacle pixels
S&S SOS&S DPB&T DP
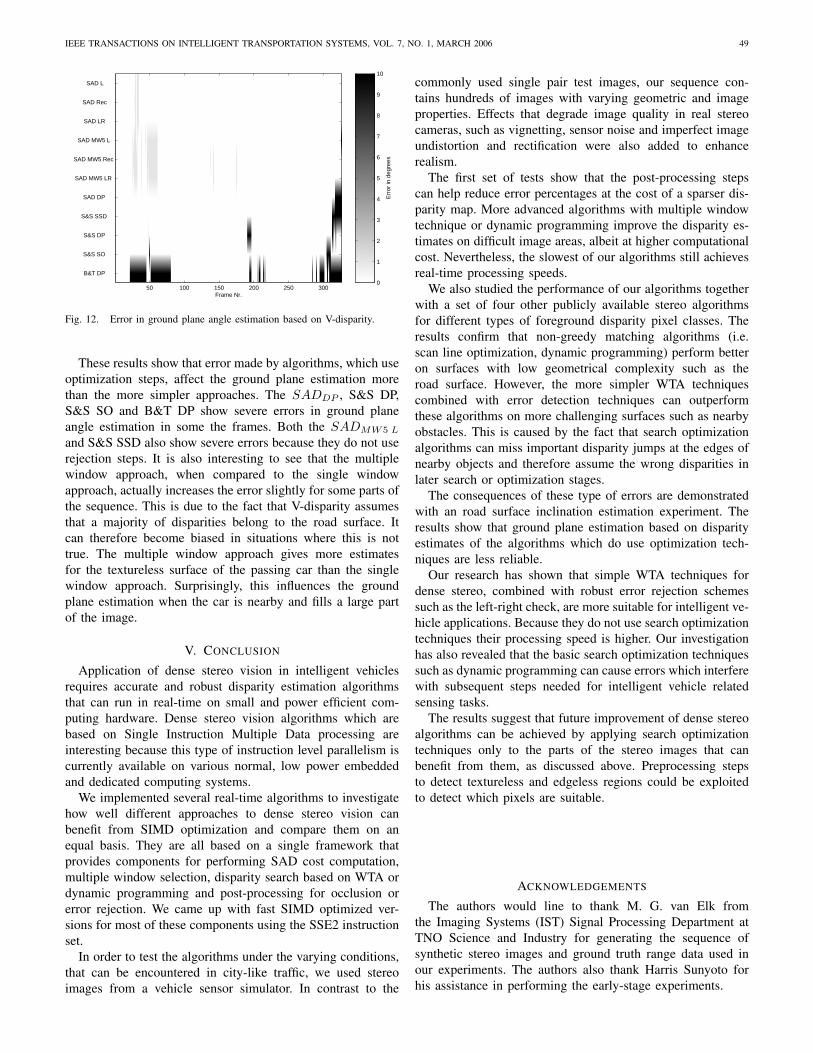
Fig. 11. The mean relative error of six algorithms on foreground pixels.
E. Performance for different surface pixel types
The previous section provided an insight how well our vari-ous algorithms compare to each other and what computationalcost they incur. In this section we investigate the performancefigures for separate pixel classes. We have also included the
results of other, publicly available algorithms in this analysis.The relative mean error for all surface pixels in Table I
shows that the SADMW5 LR has the lowest overall error rate,followed by S&S DP as second best. However, this is not thecase for all individual surface pixel classes.
For the background and road pixel classes it can be seen that
IEEE TRANSACTIONS ON INTELLIGENT TRANSPORTATION SYSTEMS, VOL. 7, NO. 1, MARCH 2006 48
TABLE IIMEAN RUNTIME FOR THE TESTED ALGORITHMS. THE ALGORITHMS ARE
ORDERED BY RUNTIME.
Image dimensions: (width, height, disparity)(512,512,48) (256,256,24)
Algorithm Runtime Fps Runtime FpsSADL 0.0879 s 11.3827 0.0189 s 52.9393SADRec 0.0976 s 10.2432 0.0202 s 49.5065SADLR 0.1096 s 9.1240 0.0234 s 42.7709SADMW5 L 0.1665 s 6.0061 0.0322 s 31.0802SADMW5 Rec 0.1698 s 5.8905 0.0342 s 29.2219SADMW5 LR 0.1775 s 5.6350 0.0358 s 27.9397SADDP 0.2456 s 4.0721 0.0466 s 21.4573B&T DP 0.4594 s 2.1768 0.0742 s 13.4711S&S SSD 5.3012 s 0.1886 0.7123 s 1.4039S&S DP 6.5724 s 0.1522 0.8645 s 1.1567S&S SO 10.5968 s 0.0944 1.0484 s 0.9538
approaches based on dynamic programming such as SADDP
and S&S DP perform better than many of the WTA basedalgorithms. This is due to the fact that the road and backgroundclasses do not contain many disparity discontinuities, theirdisparity profiles adhere to the smoothness constraint. Becausedisparity discontinuities do occur at the edges of the fore-ground objects, the DP based approaches have more problemswith these type of pixels. The WTA based algorithms that usethe left-right check to remove errors are more successful onforeground pixels.
Regarding the processing time of various algorithms, TableII reveals the benefit of the pursued SIMD SSE2 implementa-tion. Our optimized algorithms are much faster than the SIMDnon-optimized algorithms S&S DP, S&S SO, S&S SSD andB&T DP. The B&T DP is much faster than the S&S DPalgorithm, because although both use dynamic programming,it is based on a pixel-based sampling invariant similaritymeasure, rather than the window-based measure used by S&SDP.
F. Analysis of performance variations
Until now, we have only considered averaged results for apart of the sequence. However, the performance of the testedalgorithms clearly varies from frame to frame. This can seenin plots of the estimation density percentage and relative meanerror per stereo image pair.
In Fig. 10 two plots are shown of estimation densitypercentages (D%) on foreground pixels for frame 0 until 90.The plot on left side shows the results of the WTAMW5 REC ,WTAMW5 LR and WTADP algorithms from our frameworkwhile the plot of the right side shows the results of S&S SO,S&S DP and B&T DP. Fig. 11 shows two plots for the sameinterval. This time, the relative mean error (Erel) is shown forthe six algorithms.
During this part of the sequence, a foreground object (a car)passes a road crossing. The vehicle drives into in the camerafield of view from a side street. It is completely visible inframe 25. After frame 48 it starts to leave the cameras fieldof view. It is completely out of the field of view after frame90.
If the different density percentage plots are compared it isclear that the algorithms from our frame work show a gradualdecrease. This is due to the fact that the surface of the carcontains little texture. In the beginning, when the car is faraway, features such as edges, provide enough distinct pointsfor the stereo matching. When the car is nearby more pixelsin textureless areas are visible. This causes the decrease inestimation density.
Because WTADP , S&S SO, S&S DP and B&T DP usesearch optimization techniques they are less effected bytextureless regions. The plot of the latter three algorithmsdoes show lower densities percentages after frame 48, whichdue to ‘streaking errors’. Because the disparity jump frombackground to foreground disparity is not visible anymore afterframe 48, the dynamic programming technique wrongfullyassigns zero disparities to some of the foreground pixels.
The effects of streaking errors by algorithms with searchoptimization is more evident in the plots of Fig. 11 where therelative mean error is shown. The algorithms WTAMW5 REC ,WTAMW5 LR that do not use search optimization techniquesshow a fairly consistent error of about 0.2, while the otheralgorithms, that do use DP or SO show a sharp increase inerror after frame 48.
G. Ground plane estimation experiment
In the previous sections we have studied the quantitativeresults of the different disparity estimators. We learned thatthe algorithms which use global search techniques are moreeffected by the scene complexity. In this section we will showsome of the consequences for a typical application of stereovision in intelligent vehicles: ground plane estimation.
Ground plane estimation is required to distinguish obstaclessuch as other cars and pedestrians in the disparity image fromthe road surface. A robust and real-time method for doing thiswas developed by Labayrade et al. [18].
It is based on the assumption that for scanlines where theroad surface is visible, the dominant disparity value is thatof road surface pixels. Their method first converts the normaldisparity image to a ‘V-disparity’ image. Each scanline of suchan image is the histogram of disparity values of a scanline fromthe original disparity image. The road surface profile can beextracted from the ‘V-disparity’ image by finding dominantline features. The original method of Labayrade et al. [18] usesthe Hough transform to find line features and approximates theroad vertical curvature with a piecewise linear curve.
For our experiment, we use a simplified version of theLabayrade et al. [18] approach. To test an estimated disparityimage it is first converted to a V-disparity image. Becausethe road surface of the synthetic images is flat, only a singledominant line feature is searched with the Hough transform.This line is then compared to the line found by the samemethod in the ground truth disparity image. The differencein angle between the two lines shows how ground planeestimation is affected by the quality of the disparity image.
In Fig. 12 the differences in ground plane angle is shown forall images from test sequence. Each column shows the errorscolour coded in degrees for one of the tested algorithms.
IEEE TRANSACTIONS ON INTELLIGENT TRANSPORTATION SYSTEMS, VOL. 7, NO. 1, MARCH 2006 49
Frame Nr.50 100 150 200 250 300
SAD L
SAD Rec
SAD LR
SAD MW5 L
SAD MW5 Rec
SAD MW5 LR
SAD DP
S&S SSD
S&S DP
S&S SO
B&T DP
Err
or in
deg
rees
0
1
2
3
4
5
6
7
8
9
10
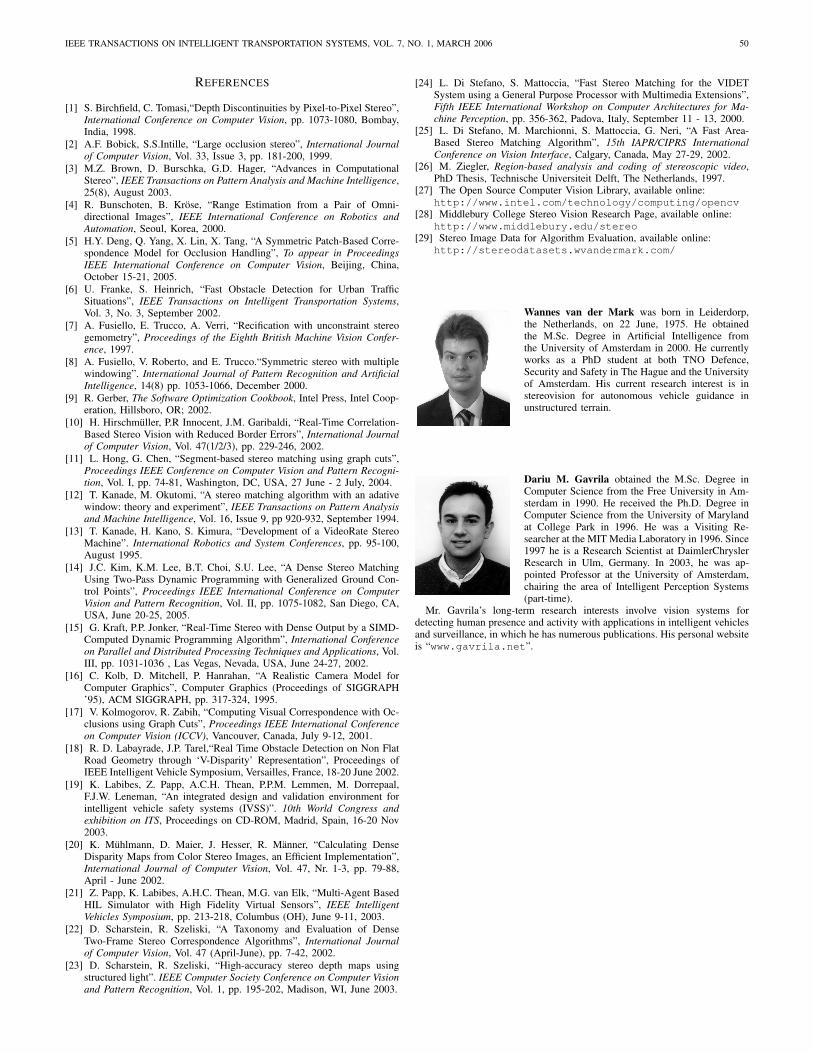
Fig. 12. Error in ground plane angle estimation based on V-disparity.
These results show that error made by algorithms, which useoptimization steps, affect the ground plane estimation morethan the more simpler approaches. The SADDP , S&S DP,S&S SO and B&T DP show severe errors in ground planeangle estimation in some the frames. Both the SADMW5 L
and S&S SSD also show severe errors because they do not userejection steps. It is also interesting to see that the multiplewindow approach, when compared to the single windowapproach, actually increases the error slightly for some parts ofthe sequence. This is due to the fact that V-disparity assumesthat a majority of disparities belong to the road surface. Itcan therefore become biased in situations where this is nottrue. The multiple window approach gives more estimatesfor the textureless surface of the passing car than the singlewindow approach. Surprisingly, this influences the groundplane estimation when the car is nearby and fills a large partof the image.
V. CONCLUSION
Application of dense stereo vision in intelligent vehiclesrequires accurate and robust disparity estimation algorithmsthat can run in real-time on small and power efficient com-puting hardware. Dense stereo vision algorithms which arebased on Single Instruction Multiple Data processing areinteresting because this type of instruction level parallelism iscurrently available on various normal, low power embeddedand dedicated computing systems.
We implemented several real-time algorithms to investigatehow well different approaches to dense stereo vision canbenefit from SIMD optimization and compare them on anequal basis. They are all based on a single framework thatprovides components for performing SAD cost computation,multiple window selection, disparity search based on WTA ordynamic programming and post-processing for occlusion orerror rejection. We came up with fast SIMD optimized ver-sions for most of these components using the SSE2 instructionset.
In order to test the algorithms under the varying conditions,that can be encountered in city-like traffic, we used stereoimages from a vehicle sensor simulator. In contrast to the
commonly used single pair test images, our sequence con-tains hundreds of images with varying geometric and imageproperties. Effects that degrade image quality in real stereocameras, such as vignetting, sensor noise and imperfect imageundistortion and rectification were also added to enhancerealism.
The first set of tests show that the post-processing stepscan help reduce error percentages at the cost of a sparser dis-parity map. More advanced algorithms with multiple windowtechnique or dynamic programming improve the disparity es-timates on difficult image areas, albeit at higher computationalcost. Nevertheless, the slowest of our algorithms still achievesreal-time processing speeds.
We also studied the performance of our algorithms togetherwith a set of four other publicly available stereo algorithmsfor different types of foreground disparity pixel classes. Theresults confirm that non-greedy matching algorithms (i.e.scan line optimization, dynamic programming) perform betteron surfaces with low geometrical complexity such as theroad surface. However, the more simpler WTA techniquescombined with error detection techniques can outperformthese algorithms on more challenging surfaces such as nearbyobstacles. This is caused by the fact that search optimizationalgorithms can miss important disparity jumps at the edges ofnearby objects and therefore assume the wrong disparities inlater search or optimization stages.
The consequences of these type of errors are demonstratedwith an road surface inclination estimation experiment. Theresults show that ground plane estimation based on disparityestimates of the algorithms which do use optimization tech-niques are less reliable.
Our research has shown that simple WTA techniques fordense stereo, combined with robust error rejection schemessuch as the left-right check, are more suitable for intelligent ve-hicle applications. Because they do not use search optimizationtechniques their processing speed is higher. Our investigationhas also revealed that the basic search optimization techniquessuch as dynamic programming can cause errors which interferewith subsequent steps needed for intelligent vehicle relatedsensing tasks.
The results suggest that future improvement of dense stereoalgorithms can be achieved by applying search optimizationtechniques only to the parts of the stereo images that canbenefit from them, as discussed above. Preprocessing stepsto detect textureless and edgeless regions could be exploitedto detect which pixels are suitable.
ACKNOWLEDGEMENTS
The authors would line to thank M. G. van Elk fromthe Imaging Systems (IST) Signal Processing Department atTNO Science and Industry for generating the sequence ofsynthetic stereo images and ground truth range data used inour experiments. The authors also thank Harris Sunyoto forhis assistance in performing the early-stage experiments.
IEEE TRANSACTIONS ON INTELLIGENT TRANSPORTATION SYSTEMS, VOL. 7, NO. 1, MARCH 2006 50
REFERENCES
[1] S. Birchfield, C. Tomasi,“Depth Discontinuities by Pixel-to-Pixel Stereo”,International Conference on Computer Vision, pp. 1073-1080, Bombay,India, 1998.
[2] A.F. Bobick, S.S.Intille, “Large occlusion stereo”, International Journalof Computer Vision, Vol. 33, Issue 3, pp. 181-200, 1999.
[3] M.Z. Brown, D. Burschka, G.D. Hager, “Advances in ComputationalStereo”, IEEE Transactions on Pattern Analysis and Machine Intelligence,25(8), August 2003.
[4] R. Bunschoten, B. Krose, “Range Estimation from a Pair of Omni-directional Images”, IEEE International Conference on Robotics andAutomation, Seoul, Korea, 2000.
[5] H.Y. Deng, Q. Yang, X. Lin, X. Tang, “A Symmetric Patch-Based Corre-spondence Model for Occlusion Handling”, To appear in ProceedingsIEEE International Conference on Computer Vision, Beijing, China,October 15-21, 2005.
[6] U. Franke, S. Heinrich, “Fast Obstacle Detection for Urban TrafficSituations”, IEEE Transactions on Intelligent Transportation Systems,Vol. 3, No. 3, September 2002.
[7] A. Fusiello, E. Trucco, A. Verri, “Recification with unconstraint stereogemometry”, Proceedings of the Eighth British Machine Vision Confer-ence, 1997.
[8] A. Fusiello, V. Roberto, and E. Trucco.“Symmetric stereo with multiplewindowing”. International Journal of Pattern Recognition and ArtificialIntelligence, 14(8) pp. 1053-1066, December 2000.
[9] R. Gerber, The Software Optimization Cookbook, Intel Press, Intel Coop-eration, Hillsboro, OR; 2002.
[10] H. Hirschmuller, P.R Innocent, J.M. Garibaldi, “Real-Time Correlation-Based Stereo Vision with Reduced Border Errors”, International Journalof Computer Vision, Vol. 47(1/2/3), pp. 229-246, 2002.
[11] L. Hong, G. Chen, “Segment-based stereo matching using graph cuts”,Proceedings IEEE Conference on Computer Vision and Pattern Recogni-tion, Vol. I, pp. 74-81, Washington, DC, USA, 27 June - 2 July, 2004.
[12] T. Kanade, M. Okutomi, “A stereo matching algorithm with an adativewindow: theory and experiment”, IEEE Transactions on Pattern Analysisand Machine Intelligence, Vol. 16, Issue 9, pp 920-932, September 1994.
[13] T. Kanade, H. Kano, S. Kimura, “Development of a VideoRate StereoMachine”. International Robotics and System Conferences, pp. 95-100,August 1995.
[14] J.C. Kim, K.M. Lee, B.T. Choi, S.U. Lee, “A Dense Stereo MatchingUsing Two-Pass Dynamic Programming with Generalized Ground Con-trol Points”, Proceedings IEEE International Conference on ComputerVision and Pattern Recognition, Vol. II, pp. 1075-1082, San Diego, CA,USA, June 20-25, 2005.
[15] G. Kraft, P.P. Jonker, “Real-Time Stereo with Dense Output by a SIMD-Computed Dynamic Programming Algorithm”, International Conferenceon Parallel and Distributed Processing Techniques and Applications, Vol.III, pp. 1031-1036 , Las Vegas, Nevada, USA, June 24-27, 2002.
[16] C. Kolb, D. Mitchell, P. Hanrahan, “A Realistic Camera Model forComputer Graphics”, Computer Graphics (Proceedings of SIGGRAPH’95), ACM SIGGRAPH, pp. 317-324, 1995.
[17] V. Kolmogorov, R. Zabih, “Computing Visual Correspondence with Oc-clusions using Graph Cuts”, Proceedings IEEE International Conferenceon Computer Vision (ICCV), Vancouver, Canada, July 9-12, 2001.
[18] R. D. Labayrade, J.P. Tarel,“Real Time Obstacle Detection on Non FlatRoad Geometry through ‘V-Disparity’ Representation”, Proceedings ofIEEE Intelligent Vehicle Symposium, Versailles, France, 18-20 June 2002.
[19] K. Labibes, Z. Papp, A.C.H. Thean, P.P.M. Lemmen, M. Dorrepaal,F.J.W. Leneman, “An integrated design and validation environment forintelligent vehicle safety systems (IVSS)”. 10th World Congress andexhibition on ITS, Proceedings on CD-ROM, Madrid, Spain, 16-20 Nov2003.
[20] K. Muhlmann, D. Maier, J. Hesser, R. Manner, “Calculating DenseDisparity Maps from Color Stereo Images, an Efficient Implementation”,International Journal of Computer Vision, Vol. 47, Nr. 1-3, pp. 79-88,April - June 2002.
[21] Z. Papp, K. Labibes, A.H.C. Thean, M.G. van Elk, “Multi-Agent BasedHIL Simulator with High Fidelity Virtual Sensors”, IEEE IntelligentVehicles Symposium, pp. 213-218, Columbus (OH), June 9-11, 2003.
[22] D. Scharstein, R. Szeliski, “A Taxonomy and Evaluation of DenseTwo-Frame Stereo Correspondence Algorithms”, International Journalof Computer Vision, Vol. 47 (April-June), pp. 7-42, 2002.
[23] D. Scharstein, R. Szeliski, “High-accuracy stereo depth maps usingstructured light”. IEEE Computer Society Conference on Computer Visionand Pattern Recognition, Vol. 1, pp. 195-202, Madison, WI, June 2003.
[24] L. Di Stefano, S. Mattoccia, “Fast Stereo Matching for the VIDETSystem using a General Purpose Processor with Multimedia Extensions”,Fifth IEEE International Workshop on Computer Architectures for Ma-chine Perception, pp. 356-362, Padova, Italy, September 11 - 13, 2000.
[25] L. Di Stefano, M. Marchionni, S. Mattoccia, G. Neri, “A Fast Area-Based Stereo Matching Algorithm”, 15th IAPR/CIPRS InternationalConference on Vision Interface, Calgary, Canada, May 27-29, 2002.
[26] M. Ziegler, Region-based analysis and coding of stereoscopic video,PhD Thesis, Technische Universiteit Delft, The Netherlands, 1997.
[27] The Open Source Computer Vision Library, available online:http://www.intel.com/technology/computing/opencv
[28] Middlebury College Stereo Vision Research Page, available online:http://www.middlebury.edu/stereo
[29] Stereo Image Data for Algorithm Evaluation, available online:http://stereodatasets.wvandermark.com/
Wannes van der Mark was born in Leiderdorp,the Netherlands, on 22 June, 1975. He obtainedthe M.Sc. Degree in Artificial Intelligence fromthe University of Amsterdam in 2000. He currentlyworks as a PhD student at both TNO Defence,Security and Safety in The Hague and the Universityof Amsterdam. His current research interest is instereovision for autonomous vehicle guidance inunstructured terrain.
Dariu M. Gavrila obtained the M.Sc. Degree inComputer Science from the Free University in Am-sterdam in 1990. He received the Ph.D. Degree inComputer Science from the University of Marylandat College Park in 1996. He was a Visiting Re-searcher at the MIT Media Laboratory in 1996. Since1997 he is a Research Scientist at DaimlerChryslerResearch in Ulm, Germany. In 2003, he was ap-pointed Professor at the University of Amsterdam,chairing the area of Intelligent Perception Systems(part-time).
Mr. Gavrila’s long-term research interests involve vision systems fordetecting human presence and activity with applications in intelligent vehiclesand surveillance, in which he has numerous publications. His personal websiteis “www.gavrila.net”.