ieee transactions on learning …eprints.bbk.ac.uk/17969/1/ieeetlt17.pdf · for modelling...
TRANSCRIPT
IEEE TRANSACTIONS ON LEARNING TECHNOLOGIES, VOL. 14, NO. 8, AUGUST XXXX 1
Design and evaluation of a case-based systemfor modelling exploratory learning behaviour of
math generalisationMihaela Cocea Member, IEEE and George D. Magoulas, Member, IEEE
Abstract—Exploratory learning environments (ELEs) promote a view of learning that encourages students to construct and/or exploremodels and observe the effects of modifying their parameters. The freedom given to learners in this exploration context leads to avariety of learner approaches for constructing models and makes modelling of learner behaviour a challenging task. To address thisissue, we propose a learner modelling mechanism for monitoring learners’ actions when constructing/exploring models by modellingsequences of actions reflecting different strategies in solving a task. This is based on a modified version of case-based reasoning forproblems with multiple solutions. In our formulation, approaches to explore the task are represented as sequences of simple caseslinked by temporal and dependency relations, which are mapped to the learners’ behaviour in the system by means of appropriatesimilarity metrics. This paper presents the development and validation of the modelling mechanism. The model was validated in thecontext of an ELE for mathematical generalisation using data from classroom sessions and pedagogically-driven learning scenarios.
Index Terms— Intelligent/ Adaptive learning systems, learner modelling, case-based reasoning, mathematics, evaluation.F
1 INTRODUCTION
THIS paper describes the development and validation ofa user model for an Exploratory Learning Environment
(ELE) allowing diagnosis during a task rather than at the endof it; to this end, a case-based reasoning inspired approach isused. The link between pedagogical rationale and modellingprocess is highlighted, including how pedagogy informs thechoice of modelling technique and its validation.
ELEs promote constructivist learning [1], allowing learn-ers to explore and learn from constructing and exploringmodels. Deep conceptual and structural knowledge emergesfrom this way of learning [2], being particularly suitable fordomains that allow multiple solutions or domains whoseunderstanding would be facilitated by having different per-spectives on the same phenomena [3].
Simulations [4], [5] and cognitive tools [6] have beenused to support exploratory learning. In computer simu-lations, models of a system or process are created and/orexplored [2]; learners typically change the values of theinput variables of the simulator and observe the results inthe output variables of the simulated models, thus discover-ing the characteristics of the domain underlying the sim-ulation. Several processes were identified for exploratorylearning [2], [7]: hypothesis generation, experiment design,prediction and data analysis. Cognitive tools have beenproposed to support learners with some of these processes.
Despite having features that benefit learning, ELEs posechallenges for learners and their effectiveness is affected bylearners’ activity level [8]. Research shows that learners havedifficulties with choosing the right variables [7], makingpredictions and interpreting data [9], and generalising the
• M. Cocea is with the School of Computing, University of Portsmouth,Buckingham Building, Lion Terrace, Portsmouth PO1 3HE, UK.E-mail: [email protected]
• G.D. Magoulas is with the Knowledge Lab, Birkbeck College, Universityof London, Malet Street, London WC1E 7HX, UK.
Manuscript received July XX, XXXX; revised January XX, XXXX.
results [10]. Exploratory learning without guidance andsupport seems to be less effective than more constrictive en-vironments, where step-by-step guidance is provided [11].
In this paper, we present an approach for identifyingwhen such difficulties occur through monitoring learners’interactive behaviour. The aim is to model learners’ pro-gression during task exploration, build a model of theirknowledge1 and store a history of their learning trajectory.This has been developed in the context of eXpresser, an ELEfor the domain of mathematical generalisation. To meet thisaim the work in the paper is organised as follows:
1) investigate what aspects of a learner’s activity are to bemonitored to assess the learner’s progress within a taskin eXpresser (the analysis process);
2) find an appropriate way to represent this knowledgeand a mechanism for identifying these aspects whenthe learner is using the system (the mapping process);
3) provide evidence of the identification mechanism’s va-lidity by means of scenario-based validation and realdata from classroom sessions using eXpresser, and fromsubject experts (validation).
This paper presents unpublished details of our approachfor designing and evaluating the learner model focusing on:(a) a revised list of pedagogically-driven scenarios; (b) theevaluation of the modelling mechanism with domain ex-perts; (c) outlining the role of pedagogy and system designin informing the choice and details of the modelling tech-nique and its evaluation. The role of the learner modellingmechanism in supporting feedback prioritisation has beenreported in [12], [13], [14], and a preliminary list of learningscenarios was mentioned in [15]. Issues of maintenance andenrichment of the knowledge representation in the system
1. This is different from the typical meaning of knowledge wherestudents learn domain-related concepts and their knowledge of theseconcepts is assessed through tests. In our context, knowledge refers toapproaches to individual tasks rather than concepts of the domain.

IEEE TRANSACTIONS ON LEARNING TECHNOLOGIES, VOL. 14, NO. 8, AUGUST XXXX 2
over time were discussed in [16], [17], [18], and details on theoverall methodology can be found in [19]. We argue that theproposed approach is particularly suitable for exploratorytasks and can offer a good balance between modelling underuncertainty and dealing with a wide solution space.
Section 2 overviews learner modelling in ELEs and Sec-tion 3 introduces mathematical generalisation with eXpresser.Section 4 covers the analysis process (conceptual model andlearning scenarios), Section 5 presents the mapping process(data representation and modelling mechanism), Section 6covers the validation of the approach and the subsequentsections discuss the results and conclude the paper.
2 LEARNER MODELLLING IN ELES
Exploratory/open/discovery/inquiry learning environ-ments are characterised by freedom and encourage learnersto explore the learning domain rather than being guided inthe structured manner typically used by Intelligent TutoringSystems (ITS). In ITS, the learner is typically guided towardsthe solution of a problem, with clear steps to be followed. InELEs, there is no linear structure and often there are severalsolutions to a problem that can be reached through variouscombinations of steps, which are not explicitly representedin a domain or solution space model. This different way ofinteraction requires a different approach for learner mod-elling compared with the traditional ITS approaches.
In the past decade there has been a significant growthin the development of exploratory environments used ineducation, of which some recent ones are: the Crystal Is-land educational game [20], BioLogica [21], [22], DC CircuitConstruction Kit [23] and Fraction Lab [24].
Despite the increased numbers of ELEs, there are veryfew that employ user/learner modelling. A learner modelis a representation of a learner and consists of data aboutthe learner or about what the learner does using the system.Typically, a learner model stores data about a learner’sknowledge, preferences, goals, tasks and interests [25].Learner modelling is the process of generating a learnermodel and typically includes three tasks [26]: (a) learnerdiagnosis: observing and interpreting user’s behaviour orpreferences and updating the model; (b) model maintenance:encoding and integrating the information in the model; (c)model employment: the usage of the model for various pur-poses, such as adaptive and personalised feedback, supportfor collaboration and support for the teacher.
In our work, learner diagnosis involves unobtrusiveobservations of user behaviour and its interpretation; weuse information which is either collected directly by unob-trusive observations of the user behaviour (e.g. landmarksmentioned later belong to this category) or inferred throughanalysis (e.g. similarity-based technique). Model employ-ment is discussed only in terms of what information fromthe learner models can be used for feedback purposes orinforming other pedagogical actions such as adapting theinterface and altering the tasks given.
Although there are a variety of intelligent learning en-vironments that use learner modelling, there are only fewreports in the literature that describe research in the area oflearner modeling in ELEs: (a) clustering and association rule
mining were used to identify an optimal representation oflearner behaviour for circuit construction [23], (b) Bayesiannetworks were used for a mathematical functions do-main [27] and (c) a neuro-fuzzy system is used for studentdiagnosis in a physics domain [28]. The first one used adata-driven approach to investigate the trade-offs betweenlow and high levels of detail in the representation on users’interactions. The second approach uses a “classic” overlaymodel approach and discusses the difficulty of identifyingwhat to model and of diagnosing the (in)correctness of useractions. The third approach employs expert knowledge fromphysics teachers which were encoded as fuzzy sets andrules; when the teachers’ knowledge was not well-defined,practical examples were used to train a neural network torepresent the expertise reflected in those examples.
Unlike prior research, our approach operates during taskexecution in the sense that it processes sequences of userdata, improving learner’s diagnosis on-the-fly as more evi-dence is collected (see Section 6.1); this is different from theway ITS provide feedback during problem-solving and it isfurther discussed in Section 7. In addition, our approach andits evaluation are informed by pedagogical considerations.
3 LEARNING WITH eXpresserIn this section, eXpresser is described, with details aboutthe target users and the types of tasks they are asked tosolve. We highlight how the system aims to address knownproblems in learning mathematical generalisation.
The tasks in eXpresser are about identifying structuralrelationships that underpin figural patterns [29], which arestandard in the English mathematics curriculum for Grades7 to 9 (11 to 14 year olds). Two examples, including the taskinstructions, typically given to students to do in class usingpen and paper are given in Fig. 1 [30]. The students tendto think in terms of a specific pattern instead of thinkinggenerally, which is partly attributed to the static nature ofthe figures [30] and partly to the use of the word any in theexamples given in Fig. 1, and the link between ‘any value’,i.e. the general, and a particular value, i.e. the specific [30].To overcome this, in eXpresser the task figural patterns areanimated when presented to students.
eXpresser (Fig. 2) was designed for classroom use, provid-ing a library of tasks and tools for teachers that enable themto see how students are progressing [30], [31]. Tasks canbe set up by the teacher: the students are asked to constructmodels, i.e. structural descriptions of figural patterns [30] andalgebraic rules that correspond to those models.
Fig. 2 illustrates the system, the property list of a pattern(i.e. a shape) linked to, and thus dependent on another
Fig. 1. Examples of typical curriculum tasks.
IEEE TRANSACTIONS ON LEARNING TECHNOLOGIES, VOL. 14, NO. 8, AUGUST XXXX 3
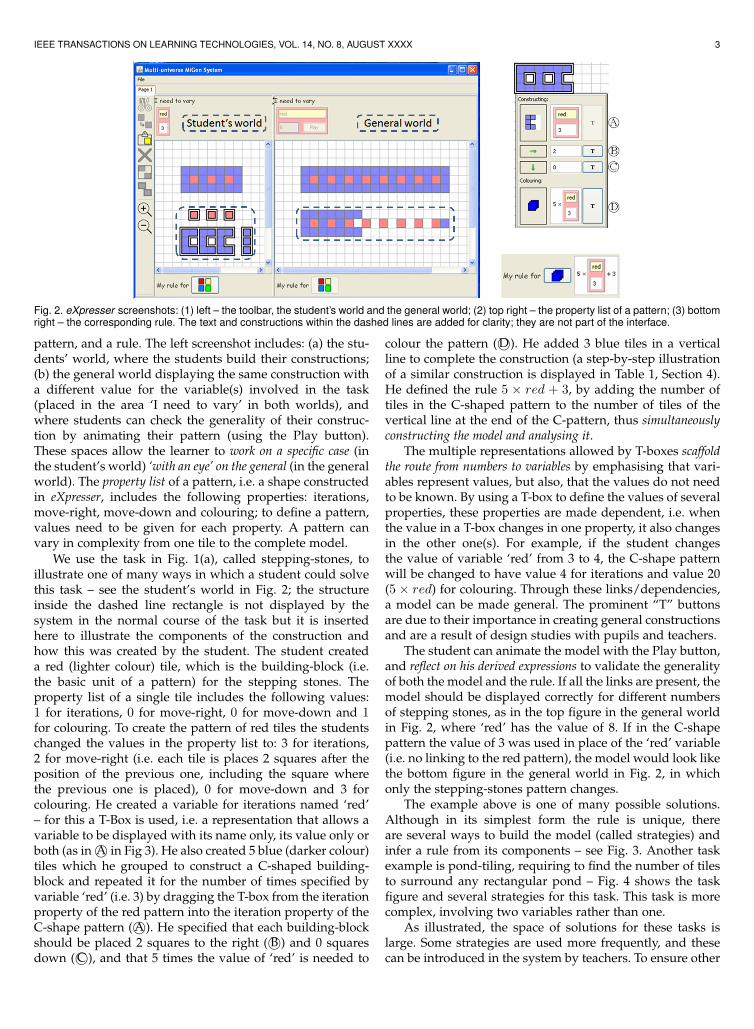
Fig. 2. eXpresser screenshots: (1) left – the toolbar, the student’s world and the general world; (2) top right – the property list of a pattern; (3) bottomright – the corresponding rule. The text and constructions within the dashed lines are added for clarity; they are not part of the interface.
pattern, and a rule. The left screenshot includes: (a) the stu-dents’ world, where the students build their constructions;(b) the general world displaying the same construction witha different value for the variable(s) involved in the task(placed in the area ‘I need to vary’ in both worlds), andwhere students can check the generality of their construc-tion by animating their pattern (using the Play button).These spaces allow the learner to work on a specific case (inthe student’s world) ‘with an eye’ on the general (in the generalworld). The property list of a pattern, i.e. a shape constructedin eXpresser, includes the following properties: iterations,move-right, move-down and colouring; to define a pattern,values need to be given for each property. A pattern canvary in complexity from one tile to the complete model.
We use the task in Fig. 1(a), called stepping-stones, toillustrate one of many ways in which a student could solvethis task – see the student’s world in Fig. 2; the structureinside the dashed line rectangle is not displayed by thesystem in the normal course of the task but it is insertedhere to illustrate the components of the construction andhow this was created by the student. The student createda red (lighter colour) tile, which is the building-block (i.e.the basic unit of a pattern) for the stepping stones. Theproperty list of a single tile includes the following values:1 for iterations, 0 for move-right, 0 for move-down and 1for colouring. To create the pattern of red tiles the studentschanged the values in the property list to: 3 for iterations,2 for move-right (i.e. each tile is places 2 squares after theposition of the previous one, including the square wherethe previous one is placed), 0 for move-down and 3 forcolouring. He created a variable for iterations named ‘red’– for this a T-Box is used, i.e. a representation that allows avariable to be displayed with its name only, its value only orboth (as in A© in Fig 3). He also created 5 blue (darker colour)tiles which he grouped to construct a C-shaped building-block and repeated it for the number of times specified byvariable ‘red’ (i.e. 3) by dragging the T-box from the iterationproperty of the red pattern into the iteration property of theC-shape pattern ( A©). He specified that each building-blockshould be placed 2 squares to the right ( B©) and 0 squaresdown ( C©), and that 5 times the value of ‘red’ is needed to
colour the pattern ( D©). He added 3 blue tiles in a verticalline to complete the construction (a step-by-step illustrationof a similar construction is displayed in Table 1, Section 4).He defined the rule 5 × red + 3, by adding the number oftiles in the C-shaped pattern to the number of tiles of thevertical line at the end of the C-pattern, thus simultaneouslyconstructing the model and analysing it.
The multiple representations allowed by T-boxes scaffoldthe route from numbers to variables by emphasising that vari-ables represent values, but also, that the values do not needto be known. By using a T-box to define the values of severalproperties, these properties are made dependent, i.e. whenthe value in a T-box changes in one property, it also changesin the other one(s). For example, if the student changesthe value of variable ‘red’ from 3 to 4, the C-shape patternwill be changed to have value 4 for iterations and value 20(5 × red) for colouring. Through these links/dependencies,a model can be made general. The prominent “T” buttonsare due to their importance in creating general constructionsand are a result of design studies with pupils and teachers.
The student can animate the model with the Play button,and reflect on his derived expressions to validate the generalityof both the model and the rule. If all the links are present, themodel should be displayed correctly for different numbersof stepping stones, as in the top figure in the general worldin Fig. 2, where ‘red’ has the value of 8. If in the C-shapepattern the value of 3 was used in place of the ‘red’ variable(i.e. no linking to the red pattern), the model would look likethe bottom figure in the general world in Fig. 2, in whichonly the stepping-stones pattern changes.
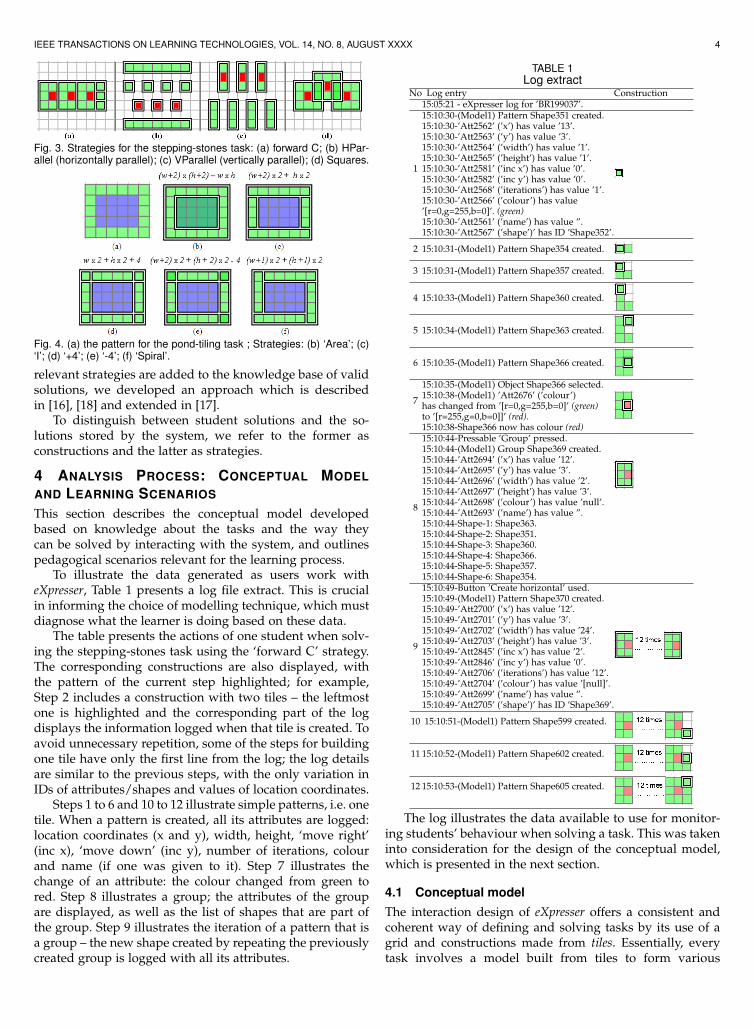
The example above is one of many possible solutions.Although in its simplest form the rule is unique, thereare several ways to build the model (called strategies) andinfer a rule from its components – see Fig. 3. Another taskexample is pond-tiling, requiring to find the number of tilesto surround any rectangular pond – Fig. 4 shows the taskfigure and several strategies for this task. This task is morecomplex, involving two variables rather than one.
As illustrated, the space of solutions for these tasks islarge. Some strategies are used more frequently, and thesecan be introduced in the system by teachers. To ensure other
IEEE TRANSACTIONS ON LEARNING TECHNOLOGIES, VOL. 14, NO. 8, AUGUST XXXX 4
Fig. 3. Strategies for the stepping-stones task: (a) forward C; (b) HPar-allel (horizontally parallel); (c) VParallel (vertically parallel); (d) Squares.
Fig. 4. (a) the pattern for the pond-tiling task ; Strategies: (b) ‘Area’; (c)‘I’; (d) ‘+4’; (e) ‘-4’; (f) ‘Spiral’.
relevant strategies are added to the knowledge base of validsolutions, we developed an approach which is describedin [16], [18] and extended in [17].
To distinguish between student solutions and the so-lutions stored by the system, we refer to the former asconstructions and the latter as strategies.
4 ANALYSIS PROCESS: CONCEPTUAL MODELAND LEARNING SCENARIOS
This section describes the conceptual model developedbased on knowledge about the tasks and the way theycan be solved by interacting with the system, and outlinespedagogical scenarios relevant for the learning process.
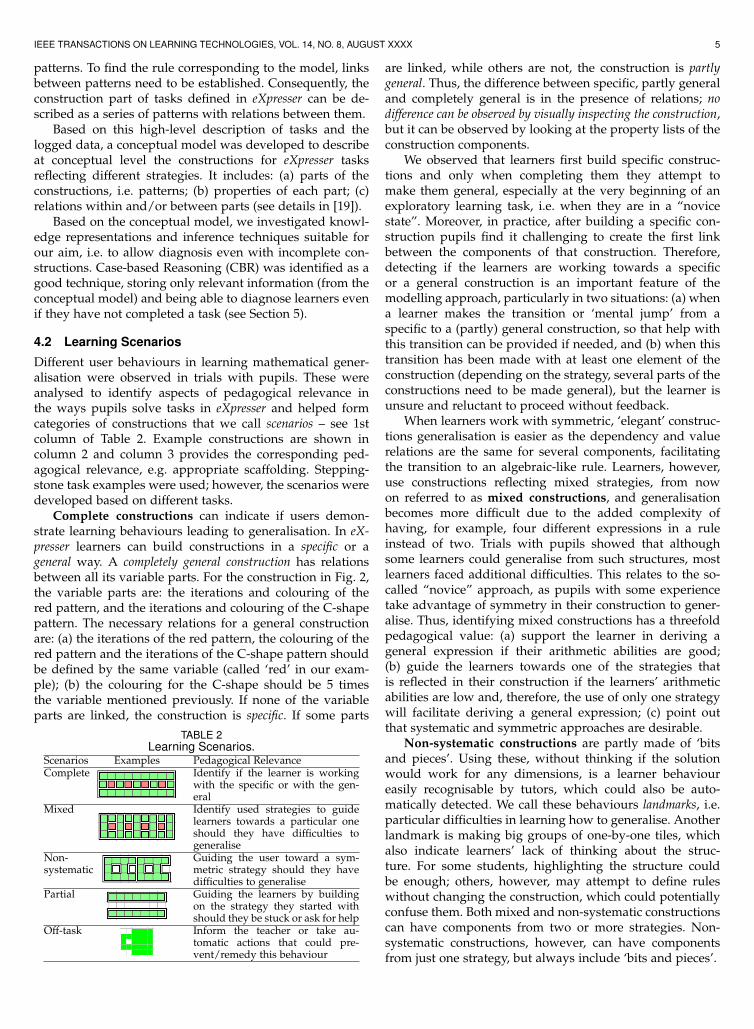
To illustrate the data generated as users work witheXpresser, Table 1 presents a log file extract. This is crucialin informing the choice of modelling technique, which mustdiagnose what the learner is doing based on these data.
The table presents the actions of one student when solv-ing the stepping-stones task using the ‘forward C’ strategy.The corresponding constructions are also displayed, withthe pattern of the current step highlighted; for example,Step 2 includes a construction with two tiles – the leftmostone is highlighted and the corresponding part of the logdisplays the information logged when that tile is created. Toavoid unnecessary repetition, some of the steps for buildingone tile have only the first line from the log; the log detailsare similar to the previous steps, with the only variation inIDs of attributes/shapes and values of location coordinates.
Steps 1 to 6 and 10 to 12 illustrate simple patterns, i.e. onetile. When a pattern is created, all its attributes are logged:location coordinates (x and y), width, height, ‘move right’(inc x), ‘move down’ (inc y), number of iterations, colourand name (if one was given to it). Step 7 illustrates thechange of an attribute: the colour changed from green tored. Step 8 illustrates a group; the attributes of the groupare displayed, as well as the list of shapes that are part ofthe group. Step 9 illustrates the iteration of a pattern that isa group – the new shape created by repeating the previouslycreated group is logged with all its attributes.
TABLE 1Log extract
No Log entry Construction15:05:21 - eXpresser log for ’BR199037’.
1
15:10:30-(Model1) Pattern Shape351 created.15:10:30-’Att2562’ (’x’) has value ’13’.15:10:30-’Att2563’ (’y’) has value ’3’.15:10:30-’Att2564’ (’width’) has value ’1’.15:10:30-’Att2565’ (’height’) has value ’1’.15:10:30-’Att2581’ (’inc x’) has value ’0’.15:10:30-’Att2582’ (’inc y’) has value ’0’.15:10:30-’Att2568’ (’iterations’) has value ’1’.15:10:30-’Att2566’ (’colour’) has value’[r=0,g=255,b=0]’. (green)15:10:30-’Att2561’ (’name’) has value ”.15:10:30-’Att2567’ (’shape’)’ has ID ’Shape352’.
2 15:10:31-(Model1) Pattern Shape354 created.
3 15:10:31-(Model1) Pattern Shape357 created.
4 15:10:33-(Model1) Pattern Shape360 created.
5 15:10:34-(Model1) Pattern Shape363 created.
6 15:10:35-(Model1) Pattern Shape366 created.
7
15:10:35-(Model1) Object Shape366 selected.15:10:38-(Model1) ’Att2676’ (’colour’)has changed from ’[r=0,g=255,b=0]’ (green)to ’[r=255,g=0,b=0]]’ (red).15:10:38-Shape366 now has colour (red)
8
15:10:44-Pressable ’Group’ pressed.15:10:44-(Model1) Group Shape369 created.15:10:44-’Att2694’ (’x’) has value ’12’.15:10:44-’Att2695’ (’y’) has value ’3’.15:10:44-’Att2696’ (’width’) has value ’2’.15:10:44-’Att2697’ (’height’) has value ’3’.15:10:44-’Att2698’ (’colour’) has value ’null’.15:10:44-’Att2693’ (’name’) has value ”.15:10:44-Shape-1: Shape363.15:10:44-Shape-2: Shape351.15:10:44-Shape-3: Shape360.15:10:44-Shape-4: Shape366.15:10:44-Shape-5: Shape357.15:10:44-Shape-6: Shape354.
9
15:10:49-Button ’Create horizontal’ used.15:10:49-(Model1) Pattern Shape370 created.15:10:49-’Att2700’ (’x’) has value ’12’.15:10:49-’Att2701’ (’y’) has value ’3’.15:10:49-’Att2702’ (’width’) has value ’24’.15:10:49-’Att2703’ (’height’) has value ’3’.15:10:49-’Att2845’ (’inc x’) has value ’2’.15:10:49-’Att2846’ (’inc y’) has value ’0’.15:10:49-’Att2706’ (’iterations’) has value ’12’.15:10:49-’Att2704’ (’colour’) has value ’[null]’.15:10:49-’Att2699’ (’name’) has value ”.15:10:49-’Att2705’ (’shape’)’ has ID ’Shape369’.
10 15:10:51-(Model1) Pattern Shape599 created.
11 15:10:52-(Model1) Pattern Shape602 created.
12 15:10:53-(Model1) Pattern Shape605 created.
The log illustrates the data available to use for monitor-ing students’ behaviour when solving a task. This was takeninto consideration for the design of the conceptual model,which is presented in the next section.
4.1 Conceptual modelThe interaction design of eXpresser offers a consistent andcoherent way of defining and solving tasks by its use of agrid and constructions made from tiles. Essentially, everytask involves a model built from tiles to form various
IEEE TRANSACTIONS ON LEARNING TECHNOLOGIES, VOL. 14, NO. 8, AUGUST XXXX 5
patterns. To find the rule corresponding to the model, linksbetween patterns need to be established. Consequently, theconstruction part of tasks defined in eXpresser can be de-scribed as a series of patterns with relations between them.
Based on this high-level description of tasks and thelogged data, a conceptual model was developed to describeat conceptual level the constructions for eXpresser tasksreflecting different strategies. It includes: (a) parts of theconstructions, i.e. patterns; (b) properties of each part; (c)relations within and/or between parts (see details in [19]).
Based on the conceptual model, we investigated knowl-edge representations and inference techniques suitable forour aim, i.e. to allow diagnosis even with incomplete con-structions. Case-based Reasoning (CBR) was identified as agood technique, storing only relevant information (from theconceptual model) and being able to diagnose learners evenif they have not completed a task (see Section 5).
4.2 Learning Scenarios
Different user behaviours in learning mathematical gener-alisation were observed in trials with pupils. These wereanalysed to identify aspects of pedagogical relevance inthe ways pupils solve tasks in eXpresser and helped formcategories of constructions that we call scenarios – see 1stcolumn of Table 2. Example constructions are shown incolumn 2 and column 3 provides the corresponding ped-agogical relevance, e.g. appropriate scaffolding. Stepping-stone task examples were used; however, the scenarios weredeveloped based on different tasks.
Complete constructions can indicate if users demon-strate learning behaviours leading to generalisation. In eX-presser learners can build constructions in a specific or ageneral way. A completely general construction has relationsbetween all its variable parts. For the construction in Fig. 2,the variable parts are: the iterations and colouring of thered pattern, and the iterations and colouring of the C-shapepattern. The necessary relations for a general constructionare: (a) the iterations of the red pattern, the colouring of thered pattern and the iterations of the C-shape pattern shouldbe defined by the same variable (called ‘red’ in our exam-ple); (b) the colouring for the C-shape should be 5 timesthe variable mentioned previously. If none of the variableparts are linked, the construction is specific. If some parts
TABLE 2Learning Scenarios.
Scenarios Examples Pedagogical RelevanceComplete Identify if the learner is working
with the specific or with the gen-eral
Mixed Identify used strategies to guidelearners towards a particular oneshould they have difficulties togeneralise
Non-systematic
Guiding the user toward a sym-metric strategy should they havedifficulties to generalise
Partial Guiding the learners by buildingon the strategy they started withshould they be stuck or ask for help
Off-task Inform the teacher or take au-tomatic actions that could pre-vent/remedy this behaviour
are linked, while others are not, the construction is partlygeneral. Thus, the difference between specific, partly generaland completely general is in the presence of relations; nodifference can be observed by visually inspecting the construction,but it can be observed by looking at the property lists of theconstruction components.
We observed that learners first build specific construc-tions and only when completing them they attempt tomake them general, especially at the very beginning of anexploratory learning task, i.e. when they are in a “novicestate”. Moreover, in practice, after building a specific con-struction pupils find it challenging to create the first linkbetween the components of that construction. Therefore,detecting if the learners are working towards a specificor a general construction is an important feature of themodelling approach, particularly in two situations: (a) whena learner makes the transition or ‘mental jump’ from aspecific to a (partly) general construction, so that help withthis transition can be provided if needed, and (b) when thistransition has been made with at least one element of theconstruction (depending on the strategy, several parts of theconstructions need to be made general), but the learner isunsure and reluctant to proceed without feedback.
When learners work with symmetric, ‘elegant’ construc-tions generalisation is easier as the dependency and valuerelations are the same for several components, facilitatingthe transition to an algebraic-like rule. Learners, however,use constructions reflecting mixed strategies, from nowon referred to as mixed constructions, and generalisationbecomes more difficult due to the added complexity ofhaving, for example, four different expressions in a ruleinstead of two. Trials with pupils showed that althoughsome learners could generalise from such structures, mostlearners faced additional difficulties. This relates to the so-called “novice” approach, as pupils with some experiencetake advantage of symmetry in their construction to gener-alise. Thus, identifying mixed constructions has a threefoldpedagogical value: (a) support the learner in deriving ageneral expression if their arithmetic abilities are good;(b) guide the learners towards one of the strategies thatis reflected in their construction if the learners’ arithmeticabilities are low and, therefore, the use of only one strategywill facilitate deriving a general expression; (c) point outthat systematic and symmetric approaches are desirable.
Non-systematic constructions are partly made of ‘bitsand pieces’. Using these, without thinking if the solutionwould work for any dimensions, is a learner behavioureasily recognisable by tutors, which could also be auto-matically detected. We call these behaviours landmarks, i.e.particular difficulties in learning how to generalise. Anotherlandmark is making big groups of one-by-one tiles, whichalso indicate learners’ lack of thinking about the struc-ture. For some students, highlighting the structure couldbe enough; others, however, may attempt to define ruleswithout changing the construction, which could potentiallyconfuse them. Both mixed and non-systematic constructionscan have components from two or more strategies. Non-systematic constructions, however, can have componentsfrom just one strategy, but always include ‘bits and pieces’.

IEEE TRANSACTIONS ON LEARNING TECHNOLOGIES, VOL. 14, NO. 8, AUGUST XXXX 6
Identifying strategies in partial constructions is impor-tant when learners are stuck or request help. Identifyingwhat strategy the learners are currently working with allowsfeedback related to that particular strategy, as guiding themtowards other strategies has been shown to confuse learners.
The last scenario covers off-task behaviour, as an indi-cator of other issues such as lack of challenging tasks, lackof motivation or disliking of mathematics, the teacher orthe system. It is important to detect off-task behaviour as itleads to poor learning [32], [33].
The scenarios could be considered equivalent to “correctsolutions”2 (i.e. complete general constructions) and several“misconceptions” (i.e. all the other scenarios, except the off-task one). The first three scenarios focus on generalisationand how to address difficulties learners face with this do-main. The fourth one is about helping learners reach oneof the first three scenarios, as some learners get stuck atan early stage. The last scenario is about off-task behaviour,which is a problem in many learning systems, but even moreso in ELEs due to the freedom of exploration [34].
5 THE MAPPING PROCESS: REPRESENTATION ANDDIAGNOSIS
This section presents our formalisation for knowledge rep-resentation and the similarity metrics used for identifyingthe strategies followed by learners in their constructions.
In CBR knowledge is stored as cases, typically includinga problem and a corresponding solution [35]. When a newproblem is encountered, the case base is searched for sim-ilar cases and the solution is retrieved/adapted from oneor more similar cases. The CBR cycle includes four pro-cesses [36]: (a) Retrieve similar cases to the current situation;(b) Reuse the cases and adapt them to solve the currentsituation; (c) Revise the proposed solution if necessary; (d)Retain the new solution as part of a new case.
Although CBR has been used in a variety of contexts,there is relatively little research using CBR for interactivelearning environments. For example, [37] used CBR forlegal reasoning, [38] used CBR and genetic algorithmsto construct an optimal learning path for each learnerand [39] used CBR within a case-based instruction sce-nario. Moreover, there is very little research in the areaof CBR for user modelling, in areas such as blood sugarlevel monitoring [40], management of experience [41] anduser context [42]. For learner modelling, CBR was used incombination with a rule-based approach to model learners’knowledge of programming; this is known as the ELM(episodic learner modelling) approach [43]; also, [44] usedCBR in the learner modelling process and called this ap-proach case-based student modelling. To the best of ourknowledge, there is no previous work in the area of usermodelling for ELEs inspired by Case-based Reasoning.
CBR is employed in our monitoring process as it offersa flexible way to represent knowledge and can cope withuncertainty, e.g. the case structure allows the flexible rep-resentation of knowledge (including missing information)
2. This is the terminology used for a valid solution, although wewould describe these as “potential pathways towards a solution”.
and there is no need to obtain a perfect match to identifywhat the learner is constructing in eXpresser. Unlike typicalCBR applications, we use a modified version of CBR to fitour problem. In eXpresser the same problem has multiplesolutions and the aim is to identify which one is used bythe learner. To address this, each task has a case base ofpotential pathways towards a solution (i.e. strategies orcomposite cases). When a learner is building a construction,a sequence of actions is transformed into a sequence ofsimple cases, with each simple case corresponding to apattern that is a component of the construction; for example,the construction illustrated in Fig 2 has 5 cases: the red tilespattern, the C-shape pattern and the 3 individual tiles. Thissequence of cases defines the learner’s construction (i.e. acomposite case) and is compared with all the strategies inthe case base for that task; the case base consists of completegeneral strategies. To retrieve the strategy that is most similarto the one used by the learner, appropriate similarity metricsare employed, which are described further in this section.
The learner modelling mechanism uses just the retrieveprocess of the CBR cycle and could be considered as aform of similarity-based classification; however, other pro-cesses of the CBR cycle are used to identify and store newstrategies [16] and to provide adaptive feedback [45]. Con-sequently, for consistency with other work, the learner mod-elling mechanism is reported as a CBR-inspired approach.
The following subsections present the knowledge rep-resentation and the similarity metrics employed to identifythe most similar cases from the case base.
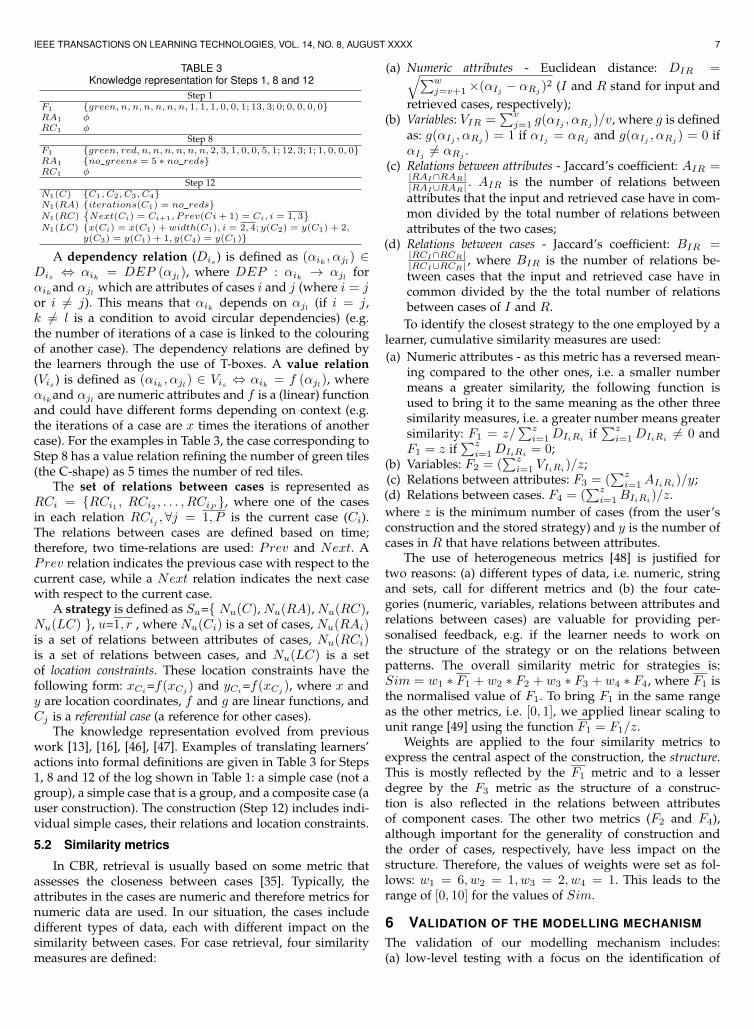
5.1 Knowledge RepresentationA case is defined as Ci = {Fi, RAi, RCi}, where Fi is aset of attributes, partly corresponding to the property list of apattern. RAi is a set of relations between attributes and RCiis a set of relations between Ci and other cases respectively.The set of attributes is defined as Fi = {αi1 , αi2 , . . . , αiN }.The set Fi includes two types of attributes: numeric andvariables. The variables refer to different string values (i.e.type) that an attribute can take. Some numeric attributesare boolean, indicating whether a case is a group of pat-terns, or can be considered in formulating a particularstrategy through a “part of strategy” function PartOfSu :Ci → {0, 1}, PartOfSu = 1 if Ci ∈ Su and PartOfSu =0 if Ci /∈ Su, where Su represents a strategy and is definedfurther on. The complete list of attributes (i.e. 6) that havea type (variable) and a value (numeric) is: width, height,iterations, ‘move left’, ‘move right’ and colour. All exceptthe first two are from the property list of a pattern. The listof attributes for 2 simple cases corresponding to step 1 (onetile) and step 8 (the C-shape) in Table 1 are given in Table 3.The first attribute is the colour, followed by 6 variablesstoring the types and 6 variables storing the values; next, thevalues indicate if the case is a group and the membershipto strategies. The set of relations between attributes of thecurrent case and attributes of other cases is represented asRAi = {RAi1 , RAi2 , . . . , RAiM }, where at least one of theattributes in each relation RAim ,∀m = 1,M , is from the setof attributes of the current case Fi. Two types of relationsare used: dependency relations and value relations.
IEEE TRANSACTIONS ON LEARNING TECHNOLOGIES, VOL. 14, NO. 8, AUGUST XXXX 7
TABLE 3Knowledge representation for Steps 1, 8 and 12
Step 1F1 {green, n, n, n, n, n, n, 1, 1, 1, 0, 0, 1; 13, 3; 0; 0, 0, 0, 0}RA1 φRC1 φ
Step 8F1 {green, red, n, n, n, n, n, n, 2, 3, 1, 0, 0, 5, 1; 12, 3; 1; 1, 0, 0, 0}RA1 {no greens = 5 ∗ no reds}RC1 φ
Step 12N1(C) {C1, C2, C3, C4}N1(RA) {iterations(C1) = no reds}N1(RC)
{Next(Ci) = Ci+1, Prev(Ci+ 1) = Ci, i = 1, 3
}N1(LC) {x(Ci) = x(C1) + width(C1), i = 2, 4; y(C2) = y(C1) + 2,
y(C3) = y(C1) + 1, y(C4) = y(C1)}
A dependency relation (Dis ) is defined as (αik , αjl) ∈Dis ⇔ αik = DEP (αjl), where DEP : αik → αjl forαikand αjl which are attributes of cases i and j (where i = jor i 6= j). This means that αik depends on αjl (if i = j,k 6= l is a condition to avoid circular dependencies) (e.g.the number of iterations of a case is linked to the colouringof another case). The dependency relations are defined bythe learners through the use of T-boxes. A value relation(Vis ) is defined as (αik , αjl) ∈ Vis ⇔ αik = f (αjl), whereαikand αjl are numeric attributes and f is a (linear) functionand could have different forms depending on context (e.g.the iterations of a case are x times the iterations of anothercase). For the examples in Table 3, the case corresponding toStep 8 has a value relation refining the number of green tiles(the C-shape) as 5 times the number of red tiles.
The set of relations between cases is represented asRCi = {RCi1 , RCi2 , . . . , RCiP }, where one of the casesin each relation RCij ,∀j = 1, P is the current case (Ci).The relations between cases are defined based on time;therefore, two time-relations are used: Prev and Next. APrev relation indicates the previous case with respect to thecurrent case, while a Next relation indicates the next casewith respect to the current case.
A strategy is defined as Su={ Nu(C),Nu(RA),Nu(RC),Nu(LC) }, u=1, r , where Nu(Ci) is a set of cases, Nu(RAi)is a set of relations between attributes of cases, Nu(RCi)is a set of relations between cases, and Nu(LC) is a setof location constraints. These location constraints have thefollowing form: xCi
=f(xCj) and yCi
=f(xCj), where x and
y are location coordinates, f and g are linear functions, andCj is a referential case (a reference for other cases).
The knowledge representation evolved from previouswork [13], [16], [46], [47]. Examples of translating learners’actions into formal definitions are given in Table 3 for Steps1, 8 and 12 of the log shown in Table 1: a simple case (not agroup), a simple case that is a group, and a composite case (auser construction). The construction (Step 12) includes indi-vidual simple cases, their relations and location constraints.
5.2 Similarity metrics
In CBR, retrieval is usually based on some metric thatassesses the closeness between cases [35]. Typically, theattributes in the cases are numeric and therefore metrics fornumeric data are used. In our situation, the cases includedifferent types of data, each with different impact on thesimilarity between cases. For case retrieval, four similaritymeasures are defined:
(a) Numeric attributes - Euclidean distance: DIR =√∑wj=v+1×(αIj − αRj
)2 (I and R stand for input andretrieved cases, respectively);
(b) Variables: VIR =∑vj=1 g(αIj , αRj )/v, where g is defined
as: g(αIj , αRj ) = 1 if αIj = αRj and g(αIj , αRj ) = 0 ifαIj 6= αRj .
(c) Relations between attributes - Jaccard’s coefficient: AIR =|RAI∩RAR||RAI∪RAR| . AIR is the number of relations betweenattributes that the input and retrieved case have in com-mon divided by the total number of relations betweenattributes of the two cases;
(d) Relations between cases - Jaccard’s coefficient: BIR =|RCI∩RCR||RCI∪RCR| , where BIR is the number of relations be-tween cases that the input and retrieved case have incommon divided by the the total number of relationsbetween cases of I and R.To identify the closest strategy to the one employed by a
learner, cumulative similarity measures are used:(a) Numeric attributes - as this metric has a reversed mean-
ing compared to the other ones, i.e. a smaller numbermeans a greater similarity, the following function isused to bring it to the same meaning as the other threesimilarity measures, i.e. a greater number means greatersimilarity: F1 = z/
∑zi=1DIiRi if
∑zi=1DIiRi 6= 0 and
F1 = z if∑zi=1DIiRi = 0;
(b) Variables: F2 = (∑zi=1 VIiRi)/z;
(c) Relations between attributes: F3 = (∑zi=1AIiRi)/y;
(d) Relations between cases. F4 = (∑zi=1BIiRi)/z.
where z is the minimum number of cases (from the user’sconstruction and the stored strategy) and y is the number ofcases in R that have relations between attributes.
The use of heterogeneous metrics [48] is justified fortwo reasons: (a) different types of data, i.e. numeric, stringand sets, call for different metrics and (b) the four cate-gories (numeric, variables, relations between attributes andrelations between cases) are valuable for providing per-sonalised feedback, e.g. if the learner needs to work onthe structure of the strategy or on the relations betweenpatterns. The overall similarity metric for strategies is:Sim = w1 ∗ F1 + w2 ∗ F2 + w3 ∗ F3 + w4 ∗ F4, where F1 isthe normalised value of F1. To bring F1 in the same rangeas the other metrics, i.e. [0, 1], we applied linear scaling tounit range [49] using the function F1 = F1/z.
Weights are applied to the four similarity metrics toexpress the central aspect of the construction, the structure.This is mostly reflected by the F1 metric and to a lesserdegree by the F3 metric as the structure of a construc-tion is also reflected in the relations between attributesof component cases. The other two metrics (F2 and F4),although important for the generality of construction andthe order of cases, respectively, have less impact on thestructure. Therefore, the values of weights were set as fol-lows: w1 = 6, w2 = 1, w3 = 2, w4 = 1. This leads to therange of [0, 10] for the values of Sim.
6 VALIDATION OF THE MODELLING MECHANISM
The validation of our modelling mechanism includes:(a) low-level testing with a focus on the identification of

IEEE TRANSACTIONS ON LEARNING TECHNOLOGIES, VOL. 14, NO. 8, AUGUST XXXX 8
various types of exploratory learning behaviour; (b) experts’evaluation to compare the performance of the modellingmechanism with the diagnosis from several domain experts.
The low-level validation focuses on the learner mod-elling mechanism rather than the entire system, as our aimis to evaluate the correctness of learner diagnosis, which isnot visible to the learners, rather than the feedback (basedon the diagnosis), which is visible to the learners. In anevaluation of the whole system, if problems arise withregard to feedback, it would not be possible to establish ifthose problems arise from a faulty diagnosis or from otherissues such as feedback content, form or timing. Thus, thetwo need to be evaluated separately. Consequently, here wepresent the validation of the diagnosis mechanism.
Unknown test data were used from two classroom ses-sions using eXpresser to solve the stepping-stones task, ina secondary school in London. There were 18 Grade 7students (11-12 years old) in each session (the same studentstook part in both sessions) who were previously familiarisedwith an earlier version of the software [50]. In addition, datafrom several smaller studies with 2 to 5 pupils working onthe pond-tiling task were used. In total, 19 pupils partici-pated in these studies; they were Grade 7 and 8, and 11 to13 years old. In both the classroom sessions and the smallerstudies, the students spent 40 to 50 minutes on the giventask. The 36 logs from the 2 classroom sessions and the 19logs from the smaller studies were used to test the strategydiagnosis for the scenarios outlined in Section 4.2: gen-eral/partly general/specific complete, mixed, non-systematic,and partial constructions, and off-task behaviour.
As only one student had a partial construction by theend of the session, to increase the data available for testingpartial constructions, the complete constructions logs wereused to extract “intermediate constructions”. We chose twosnapshots from 18 user complete construction employingeach of the stored strategies of the 2 tasks, i.e. 8 for stepping-stones and 10 for pond-tiling (more details in the followingsection). For all other scenarios, each log/construction wasassigned exclusively to one scenario.
The constructions from the logs were labelled with themost similar strategy by one expert who watched the screencapture for each of the constructions that were used fortesting. In the case of mixed strategies, the expert labelledthe construction with all the strategies that were relevantfor the particular construction and ranked them in orderof similarity. For example, a construction of the stepping-stones task that had elements of the ‘HParallel’ and ‘VParal-lel’ strategies had both labels and the expert specified whichof the two strategies was most similar; if the expert consid-ered that the 2 strategies were equally represented in theconstruction, ‘equally similar’ was used. The same processwas applied if elements from more than 2 strategies werepresent in a construction. The labels (distribution in Fig. 5)were compared with the output of the strategy identificationmechanism; the results are presented in Section 6.1.
In addition, we presented five experts with a selectionof constructions from the user studies reflecting situationsthat are difficult to diagnose. For each user construction, theexperts were asked to rank three strategies in the order of
Fig. 5. Distribution of strategies according to the expert.
similarity to the user’s construction. These rankings werethen compared with the outputs of the modelling mecha-nism; details and results are presented in Section 6.2.
6.1 Identification of strategiesThis section presents the results on strategy diagnosis for thescenarios described in Section 4.2. For each category, one ormore examples are presented and discussed, and statisticsfor all tested constructions are given.Complete constructions. These refer to complete construc-tions built using one of several strategies. They could bespecific, general or partly general. The similarities betweenspecific and general user constructions for the stepping-stones task and stored (general) strategies are shown inTable 4 – the rows are the student solutions (as labelled bythe expert), the 1st column is the number of students persolution and the rest of the columns are stored solutions.
The similarity values are between 1 and 10. A perfectmatch is obtained for a complete general strategy: 10 whenthe strategy has at least 2 cases; 9 when the strategy has justone case, as in the ‘Squares’ strategy (due to no relationsbetween cases which has a maximum value of 1). Generally,complete specific constructions have values greater than 8,and complete partly general strategies have values between8 and 10 (depending on the number of cases in the strategyand the number of relations between them). The bold num-bers in Table 4 indicate high similarities for specific completeconstruction (values grater than 8) and perfect similaritiesfor complete and general constructions (values of 10 and 9).
All general (9), partly general (5) and specific construc-tions (15) were identified successfully by the CBR approach.Complete constructions (specific, partly general and gen-eral) are easy to identify due to their structure; consequently,the identification is successful in all cases.Mixed constructions. For the stepping-stones task, only onestudent built a mixed construction and did not generaliseit (no links between components) – see Fig. 6 and the
TABLE 4Similarity metrics for complete constructions of stepping-stones task.Constructions Freq. Forward C HParallel VParallel SquaresForward C specific 3 9.33 2.18 2.33 1.66Forward C general 1 10.00 2.51 2.83 2.66HParallel specific 2 2.18 9.33 2.34 1.34HParallel general 1 3.18 10.00 3.34 2.34VParallel specific 2 2.33 2.34 9.33 1.48VParallel general 1 3.33 2.84 10.00 2.48Squares specific 1 1.66 1.34 1.48 8.33Squares general 1 1.66 1.34 1.48 9.00

IEEE TRANSACTIONS ON LEARNING TECHNOLOGIES, VOL. 14, NO. 8, AUGUST XXXX 9
Fig. 6. Combination of VParallel and HParallel strategies.
TABLE 5Similarity of the construction in Fig. 6 to stored strategies
Forward C HParallel VParallel SquaresFig. 6 construction 2.28 2.37 3.14 1.48
Fig. 7. Mixed constructions with: (a) three strategies (‘H’, ‘+4’ and‘Spiral’; (b) 2 strategies (‘+4’ and ‘I’), of which one is dominant (‘+4’);(c) 2 strategies equally similar (‘Spiral’ and ‘H’).
similarity metrics in Table 5. The construction is adequatelyidentified as most similar to the ‘VParallel’ and ‘HParallel’strategies. On one hand, one could argue that this approachis a solution in its own right. On the other hand, this solutionis not optimal, as some components of the construction canbe combined to achieve a more simple and elegant solution.Simple, as well as elegant or systematic approaches, areeasier to generalise. This aspect is further discussed underthe following scenario, i.e. non-systematic strategies.
Nine mixed constructions from the pond-tiling task werealso tested and correctly identified. Six of the nine construc-tions combined 2 strategies, while three had elements from3 strategies. Three of the six constructions that mixed 2strategies had a dominant strategy, while three were equallysimilar to both strategies (see Fig. 7).Non-systematic constructions. Learners sometimes use ‘bitsand pieces’ in their constructions, making generalisationmore difficult. They may start with such an approach andgradually move towards a more systematic one; however,they do not always replace all the ‘bits and pieces’ theystarted with – see Fig. 8a; the overall approach correspondsto the ‘HParallel’ strategy, but the top row of green tiles iscomposed of ‘bits and pieces’: one row of six tiles plus onetile; also, the row of six tiles is composed as a group of threetiles repeated twice – see the property list in Fig. 8b.
For the student whose construction is presented inFig. 8a, the values of the similarity metric with respect tostored strategies are shown in Table 6. The maximum valuereflects the similarity in structure to the ‘HParallel’ strategy;however, the low value indicates the construction has partsthat do not entirely correspond to the ‘HParallel’ strategy.
All 10 tested non-systematic constructions had a ‘dom-inant’ strategy with only one or occasionally two compo-nents of the construction built in a non-systematic way andall were identified as most similar to a stored strategy.Partial constructions. For each strategy two partial con-structions are illustrated in Fig. 9, corresponding to differentstages in the building process. They are essentially snap-shots of learners’ constructions at different points in time,where the first snapshot, corresponding to version 1 is takenfairly early (and contains one component), while the second
Fig. 8. Construction with non-systematic parts: (a) the structure of theconstruction; (b) the property list of the top component.
TABLE 6Similarities of the construction in Fig. 8 to stored strategies
Forward C HParallel VParallel SquaresFig. 8 construction 2.09 4.31 2.30 1.32
one, corresponding to version 2, is taken later, but before thelearners have completed the construction (and contains twoor three components). The purpose is to test the metrics inrelation to how early they can reliably detect similarity to aparticular strategy. The metrics are displayed in Table 7.
The construction in Fig. 9e has a low similarity to allstored strategies, as it could be the starting point for three ofthem: ‘forward C’, ‘HParallel’ and ‘VParallel’. Table 7 showsthat ‘forward C’ and ‘HParallel’ strategies have a highersimilarity than the ‘VParallel’ strategy. On the other hand,the similarity metrics show very close values for all strate-gies, which could be an indication that with the availableinformation no strategy can be considered most similar tothe learner’s construction. Consequently, an assessment oflearners’ constructions should not be made too early and ifhelp is requested at such an early stage, the students shouldbe encouraged to continue with building the construction.
To assess the likelihood of identifying the strategy thelearners are working with at different stages in their par-tial constructions we used 24 partial strategies from thestepping-stones task and 71 from the pond-tiling task. Theseconstructions were extracted from the logs and represent in-stances of constructions at different time steps. We used con-
Fig. 9. Partial strategies: (a) partial forward C v1; (b) partial forward Cv2; (c) partial HParallel v1; (d) partial HParallel v2; (e) partial VParallelv1; (f) partial VParallel v2.
TABLE 7Similarities of the construction in Fig. 9 to stored strategies
Forward C HParallel VParallelPartial forward C v1 (Fig. 9a) 7.00 2.41 2.90Partial forward C v2 (Fig. 9b) 7.83 2.06 2.35Partial HParallel v1 (Fig. 9c) 1.61 7.00 1.93Partial HParallel v2 (Fig. 9d) 2.13 7.83 2.49Partial VParallel v1 (Fig. 9e) 2.80 2.50 2.41Partial VParallel v2 (Fig. 9f) 2.28 1.93 7.00

IEEE TRANSACTIONS ON LEARNING TECHNOLOGIES, VOL. 14, NO. 8, AUGUST XXXX 10
Fig. 10. Average probability of identifying a dominant strategy frompartial constructions with 1, 2 and 3 components.
structions with one component3 (7 from the stepping-stonestask and 21 from pond-tiling), two components (10 fromstepping-stones, 30 from pond-tiling) and three components(7 from stepping-stones and 20 from pond-tiling). Similaritymetrics were computed for all partial constructions and theprobability of identifying a unique ‘dominant’ strategy wascalculated as follows. If a construction is most similar toa strategy, the probability is 100%; if the construction isequally similar to two strategies, the probability is 50%, andso on. A construction was considered similar to a strategyif the similarity metric had a value higher than 3.50, whichwas identified as a minimal value for indicating structuralsimilarity [17], [47]. The average probabilities per number ofcomponents in the partial constructions (one, two or three)for the two tasks, as well as overall, are displayed in Fig. 10.
Fig. 10 shows that the more components a constructionhas, the easier it is to identify its most similar strategy. Aconstruction with one component can be identified in somecases, with a higher probability for constructions with alower number of components per strategy (as for stepping-stones) than for constructions with a higher number of com-ponents per strategy (as for pond-tiling). Similarly, when aconstruction has two components, the probability is higher,with the same tendency as for one component. From threecomponents onwards the strategy is identifiable in all cases.Consequently, 2 components can be used as the minimumrequirement for applying the identification mechanism.Detecting off-task exploratory behaviour. The case base ofsolutions and a rule-based approach are used to identifyoff-task behaviour. Two sources of information are used:(a) the characteristics of the task in terms of variations ofwidth and height, and the relation between them, if any, and(b) the relative position of patterns. The information aboutthe task acts as a valuable filter when random tiles are left onthe pattern construction area along with a construction thatis related to the task. For example, in the stepping-stonestask these characteristics are: height is three, width can vary,with a minimum of three, and there is no particular relationbetween the height and the width. The relative positions aremapped to the position constraints of the stored strategiesand if there is at least a partial correspondence, the similaritymetrics are calculated. If there is no correspondence, no met-rics are computed. Algorithm 1 formalises this approach.
3. this excludes the pond component for the pond-tiling task, asthe pond is present in all strategies and all students started theirconstructions with the pond
Algorithm 1 OffTask(StrategiesCaseBase, InputStrategy)
if Task.Width is fixed thenif InputStrategy.Width > Task.Width then
cap InputStrategy {cap left or right}end if
end ifif Task.Height is fixed then
if InputStrategy.Height > Task.Height thencap InputStrategy {cap top or bottom}
end ifend iffor all combinations of capped constructions do
verify position constraintsif at least one constraint is satisfied then
calculate similarity to all strategies in StrategiesCaseBaseelse
return student is off-taskend if
end for
Fig. 11. (a) off-task; (b) on-task, inefficient strategy
We use an off-task example observed in the secondclassroom session, and compare it with a behaviour which,although on-task, is inefficient in terms of its generalisationpotential – see Fig. 11. The construction in Fig. 11b looksvery much like the ‘forward C’ strategy, but it is constructedfrom a group of ten individual tiles that are repeated twicewhich makes it difficult to generalise. Nevertheless, unlikethe construction in Fig. 11a, this construction is task-related.
From the construction in Fig. 11a two different construc-tions can be obtained by filtering out the top or the bottomrow to satisfy the ‘height equals 3’ characteristic; these twoconstructions do not map the position constraints of anystored strategy. Therefore, using both sources of informa-tion the algorithm outputs that the learner is off-task. Theheight of the construction in Fig. 11b corresponds to thetask characteristics and the relative positions of the patternspartly map the position constraints of two strategies. Thus,the similarity metrics are computed and ‘forward C’ isidentified as the most similar strategy.
We also tested four off-task constructions from the pond-tiling task. These occurred after the students finished theirtask constructions and were ‘playing’ with the system. Thealgorithm labelled all these constructions as off-task.
6.2 Experts’ evaluation
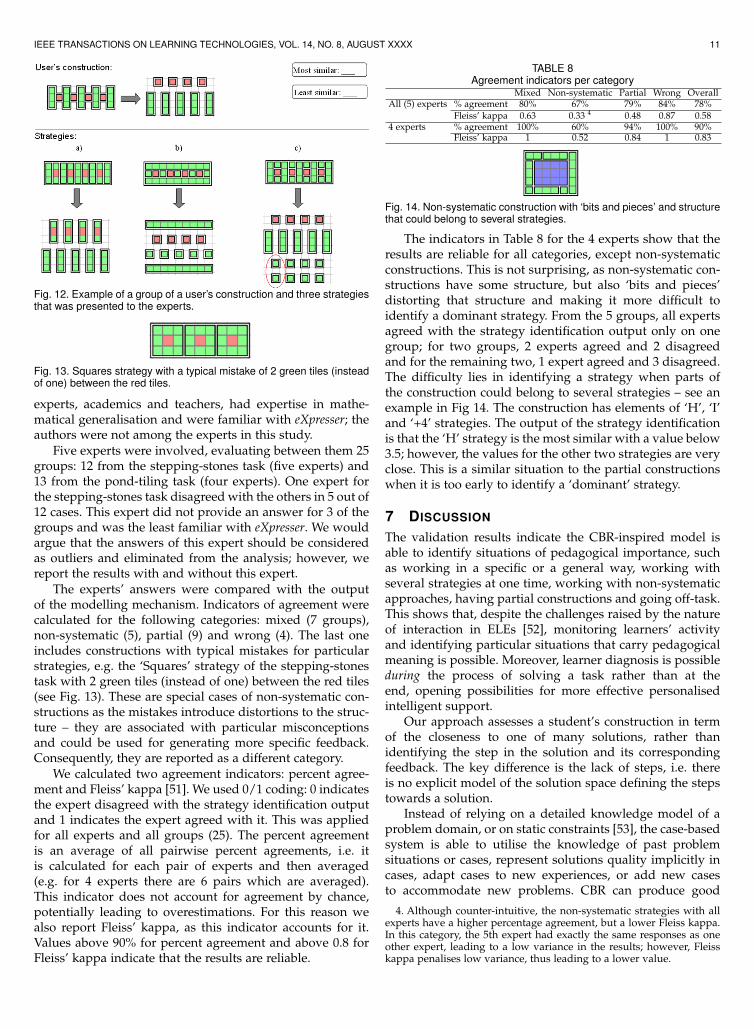
To further evaluate our strategy identification mechanismwe presented experts with several groups composed of auser’s construction and three strategies, and asked them toidentify the most similar and the least similar strategy to theuser’s construction. An example of a group that the expertswere presented with is given in Fig. 12. The constructionswere decomposed into constituent parts to outline theirstructure. The red circle indicates a group that is a buildingblock of one component that could otherwise be mistakenfor two separate components, e.g. strategy c) in Fig. 12. The
IEEE TRANSACTIONS ON LEARNING TECHNOLOGIES, VOL. 14, NO. 8, AUGUST XXXX 11
Fig. 12. Example of a group of a user’s construction and three strategiesthat was presented to the experts.
Fig. 13. Squares strategy with a typical mistake of 2 green tiles (insteadof one) between the red tiles.
experts, academics and teachers, had expertise in mathe-matical generalisation and were familiar with eXpresser; theauthors were not among the experts in this study.
Five experts were involved, evaluating between them 25groups: 12 from the stepping-stones task (five experts) and13 from the pond-tiling task (four experts). One expert forthe stepping-stones task disagreed with the others in 5 out of12 cases. This expert did not provide an answer for 3 of thegroups and was the least familiar with eXpresser. We wouldargue that the answers of this expert should be consideredas outliers and eliminated from the analysis; however, wereport the results with and without this expert.
The experts’ answers were compared with the outputof the modelling mechanism. Indicators of agreement werecalculated for the following categories: mixed (7 groups),non-systematic (5), partial (9) and wrong (4). The last oneincludes constructions with typical mistakes for particularstrategies, e.g. the ‘Squares’ strategy of the stepping-stonestask with 2 green tiles (instead of one) between the red tiles(see Fig. 13). These are special cases of non-systematic con-structions as the mistakes introduce distortions to the struc-ture – they are associated with particular misconceptionsand could be used for generating more specific feedback.Consequently, they are reported as a different category.
We calculated two agreement indicators: percent agree-ment and Fleiss’ kappa [51]. We used 0/1 coding: 0 indicatesthe expert disagreed with the strategy identification outputand 1 indicates the expert agreed with it. This was appliedfor all experts and all groups (25). The percent agreementis an average of all pairwise percent agreements, i.e. itis calculated for each pair of experts and then averaged(e.g. for 4 experts there are 6 pairs which are averaged).This indicator does not account for agreement by chance,potentially leading to overestimations. For this reason wealso report Fleiss’ kappa, as this indicator accounts for it.Values above 90% for percent agreement and above 0.8 forFleiss’ kappa indicate that the results are reliable.
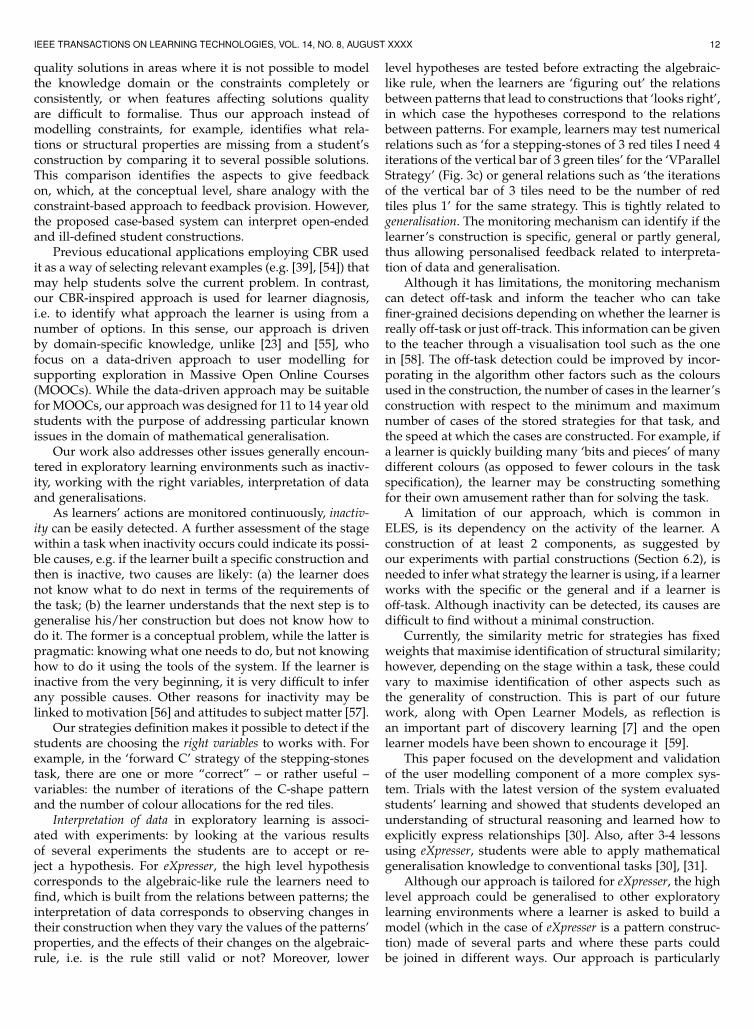
TABLE 8Agreement indicators per category
Mixed Non-systematic Partial Wrong OverallAll (5) experts % agreement 80% 67% 79% 84% 78%
Fleiss’ kappa 0.63 0.33 4 0.48 0.87 0.584 experts % agreement 100% 60% 94% 100% 90%
Fleiss’ kappa 1 0.52 0.84 1 0.83
Fig. 14. Non-systematic construction with ‘bits and pieces’ and structurethat could belong to several strategies.
The indicators in Table 8 for the 4 experts show that theresults are reliable for all categories, except non-systematicconstructions. This is not surprising, as non-systematic con-structions have some structure, but also ‘bits and pieces’distorting that structure and making it more difficult toidentify a dominant strategy. From the 5 groups, all expertsagreed with the strategy identification output only on onegroup; for two groups, 2 experts agreed and 2 disagreedand for the remaining two, 1 expert agreed and 3 disagreed.The difficulty lies in identifying a strategy when parts ofthe construction could belong to several strategies – see anexample in Fig 14. The construction has elements of ‘H’, ‘I’and ‘+4’ strategies. The output of the strategy identificationis that the ‘H’ strategy is the most similar with a value below3.5; however, the values for the other two strategies are veryclose. This is a similar situation to the partial constructionswhen it is too early to identify a ‘dominant’ strategy.
7 DISCUSSION
The validation results indicate the CBR-inspired model isable to identify situations of pedagogical importance, suchas working in a specific or a general way, working withseveral strategies at one time, working with non-systematicapproaches, having partial constructions and going off-task.This shows that, despite the challenges raised by the natureof interaction in ELEs [52], monitoring learners’ activityand identifying particular situations that carry pedagogicalmeaning is possible. Moreover, learner diagnosis is possibleduring the process of solving a task rather than at theend, opening possibilities for more effective personalisedintelligent support.
Our approach assesses a student’s construction in termof the closeness to one of many solutions, rather thanidentifying the step in the solution and its correspondingfeedback. The key difference is the lack of steps, i.e. thereis no explicit model of the solution space defining the stepstowards a solution.
Instead of relying on a detailed knowledge model of aproblem domain, or on static constraints [53], the case-basedsystem is able to utilise the knowledge of past problemsituations or cases, represent solutions quality implicitly incases, adapt cases to new experiences, or add new casesto accommodate new problems. CBR can produce good
4. Although counter-intuitive, the non-systematic strategies with allexperts have a higher percentage agreement, but a lower Fleiss kappa.In this category, the 5th expert had exactly the same responses as oneother expert, leading to a low variance in the results; however, Fleisskappa penalises low variance, thus leading to a lower value.
IEEE TRANSACTIONS ON LEARNING TECHNOLOGIES, VOL. 14, NO. 8, AUGUST XXXX 12
quality solutions in areas where it is not possible to modelthe knowledge domain or the constraints completely orconsistently, or when features affecting solutions qualityare difficult to formalise. Thus our approach instead ofmodelling constraints, for example, identifies what rela-tions or structural properties are missing from a student’sconstruction by comparing it to several possible solutions.This comparison identifies the aspects to give feedbackon, which, at the conceptual level, share analogy with theconstraint-based approach to feedback provision. However,the proposed case-based system can interpret open-endedand ill-defined student constructions.
Previous educational applications employing CBR usedit as a way of selecting relevant examples (e.g. [39], [54]) thatmay help students solve the current problem. In contrast,our CBR-inspired approach is used for learner diagnosis,i.e. to identify what approach the learner is using from anumber of options. In this sense, our approach is drivenby domain-specific knowledge, unlike [23] and [55], whofocus on a data-driven approach to user modelling forsupporting exploration in Massive Open Online Courses(MOOCs). While the data-driven approach may be suitablefor MOOCs, our approach was designed for 11 to 14 year oldstudents with the purpose of addressing particular knownissues in the domain of mathematical generalisation.
Our work also addresses other issues generally encoun-tered in exploratory learning environments such as inactiv-ity, working with the right variables, interpretation of dataand generalisations.
As learners’ actions are monitored continuously, inactiv-ity can be easily detected. A further assessment of the stagewithin a task when inactivity occurs could indicate its possi-ble causes, e.g. if the learner built a specific construction andthen is inactive, two causes are likely: (a) the learner doesnot know what to do next in terms of the requirements ofthe task; (b) the learner understands that the next step is togeneralise his/her construction but does not know how todo it. The former is a conceptual problem, while the latter ispragmatic: knowing what one needs to do, but not knowinghow to do it using the tools of the system. If the learner isinactive from the very beginning, it is very difficult to inferany possible causes. Other reasons for inactivity may belinked to motivation [56] and attitudes to subject matter [57].
Our strategies definition makes it possible to detect if thestudents are choosing the right variables to works with. Forexample, in the ‘forward C’ strategy of the stepping-stonestask, there are one or more “correct” – or rather useful –variables: the number of iterations of the C-shape patternand the number of colour allocations for the red tiles.
Interpretation of data in exploratory learning is associ-ated with experiments: by looking at the various resultsof several experiments the students are to accept or re-ject a hypothesis. For eXpresser, the high level hypothesiscorresponds to the algebraic-like rule the learners need tofind, which is built from the relations between patterns; theinterpretation of data corresponds to observing changes intheir construction when they vary the values of the patterns’properties, and the effects of their changes on the algebraic-rule, i.e. is the rule still valid or not? Moreover, lower
level hypotheses are tested before extracting the algebraic-like rule, when the learners are ‘figuring out’ the relationsbetween patterns that lead to constructions that ‘looks right’,in which case the hypotheses correspond to the relationsbetween patterns. For example, learners may test numericalrelations such as ‘for a stepping-stones of 3 red tiles I need 4iterations of the vertical bar of 3 green tiles’ for the ‘VParallelStrategy’ (Fig. 3c) or general relations such as ‘the iterationsof the vertical bar of 3 tiles need to be the number of redtiles plus 1’ for the same strategy. This is tightly related togeneralisation. The monitoring mechanism can identify if thelearner’s construction is specific, general or partly general,thus allowing personalised feedback related to interpreta-tion of data and generalisation.
Although it has limitations, the monitoring mechanismcan detect off-task and inform the teacher who can takefiner-grained decisions depending on whether the learner isreally off-task or just off-track. This information can be givento the teacher through a visualisation tool such as the onein [58]. The off-task detection could be improved by incor-porating in the algorithm other factors such as the coloursused in the construction, the number of cases in the learner’sconstruction with respect to the minimum and maximumnumber of cases of the stored strategies for that task, andthe speed at which the cases are constructed. For example, ifa learner is quickly building many ‘bits and pieces’ of manydifferent colours (as opposed to fewer colours in the taskspecification), the learner may be constructing somethingfor their own amusement rather than for solving the task.
A limitation of our approach, which is common inELES, is its dependency on the activity of the learner. Aconstruction of at least 2 components, as suggested byour experiments with partial constructions (Section 6.2), isneeded to infer what strategy the learner is using, if a learnerworks with the specific or the general and if a learner isoff-task. Although inactivity can be detected, its causes aredifficult to find without a minimal construction.
Currently, the similarity metric for strategies has fixedweights that maximise identification of structural similarity;however, depending on the stage within a task, these couldvary to maximise identification of other aspects such asthe generality of construction. This is part of our futurework, along with Open Learner Models, as reflection isan important part of discovery learning [7] and the openlearner models have been shown to encourage it [59].
This paper focused on the development and validationof the user modelling component of a more complex sys-tem. Trials with the latest version of the system evaluatedstudents’ learning and showed that students developed anunderstanding of structural reasoning and learned how toexplicitly express relationships [30]. Also, after 3-4 lessonsusing eXpresser, students were able to apply mathematicalgeneralisation knowledge to conventional tasks [30], [31].
Although our approach is tailored for eXpresser, the highlevel approach could be generalised to other exploratorylearning environments where a learner is asked to build amodel (which in the case of eXpresser is a pattern construc-tion) made of several parts and where these parts couldbe joined in different ways. Our approach is particularly
IEEE TRANSACTIONS ON LEARNING TECHNOLOGIES, VOL. 14, NO. 8, AUGUST XXXX 13
suitable for problems with multiple solutions, making itappropriate for domains where multiple pathways to anacceptable solution for the same problem are common. Thecontents of a case and the similarity metrics in our approachwere defined for our particular types of problems, where thefocus was on the structure of a construction. The attributesof cases and the similarity metrics would need to be rede-fined for particular problems in order to use our approach.The high level concept, however, can be developed for othersystems where monitoring during a task is important. Thus,case-based reasoning is well-suited for exploratory tasksgiven its capacity to deal with uncertainty and the fact thatthe knowledge base can be expanded.
The evaluation involved testing our approach on realdata from 37 pupils. Although this may seem a small sam-ple, access to participants needs to be considered. Schoolsin the UK rarely allow researchers access to pupils, limit thenumber of participants and put constraints on the settingin which evaluation can take place, as already pointed outin relevant literature [60]. Nevertheless, the evaluation wasdone under realistic conditions and the limitation in samplesize was compensated by use of real-life test data.
8 CONCLUSIONS
In this paper we presented a mechanism for monitoringlearners’ behaviour in an exploratory learning environmentfor mathematics. This work addresses some difficulties ofexploratory learning such as choosing the right variables, in-terpretation of data and generalising. The monitoring mech-anism was designed to unobtrusively monitor the learners’interactive behaviour in eXpresser, an exploratory learningenvironment for mathematical generalisation. The aim wasto assess a learner’s progress within a task by monitoringkey aspects of the interaction with the system.
Scenarios of pedagogical importance were identified:complete, mixed, non-systematic and partial strategies, andoff-task behaviour. All except the last one rely exclusivelyon the similarity metrics for identification. Using data fromtwo classroom sessions and several smaller studies, themonitoring mechanism was validated for all scenarios.
Our mechanism has at its centre the idea of strategy –a particular way of reaching a solution. In our approach,a strategy is defined as a series of cases linked by certainproperties. While the learner is solving a task, his/her wayof creating the construction is compared with stored strate-gies – for this purpose, similarity metrics have been definedto compare cases and strategies. Using different weights forthe four similarities defined to compare cases, the emphasisof the aggregated similarity metric for strategies was givento structure, as the most important aspect of a construction.
Modelling strategies, rather than concepts, gives theadvantage of having a more holistic view of the learner’sperspective on a particular task. In other words, a strategycontains more information than a probability attached to aconcept. This fits domains with multiple pathways to anacceptable solution for which exploratory learning is moresuitable than tutoring, as these domains are often charac-terised by complex problems, in which a concept cannot be
explored in separation from other ones because the essencelies in the relation between concepts.
ACKNOWLEDGMENTSThis work was partially funded by the ESRC/EPSRC Teach-ing and Learning Research Programme (Technology En-hanced Learning; Award no: RES-139-25-0381).
REFERENCES
[1] L. Vygotsky, Mind and society: The development of higher mentalprocesses. Cambridge, MA: Harvard Univ. Press, 1978.
[2] T. de Jong and W. van Joolingen, “Scientific discovery learningwith computer simulations of conceptual domains,” Review ofEducational Research, vol. 68, pp. 179–202, 1998.
[3] D. Levy, “Insights and conflicts in discussing recursion: A casestudy,” Computer Science Education, vol. 11, no. 4, pp. 305–322, 2001.
[4] J. Swaak, W. van Joolingen, and T. de Jong, “Supportingsimulation-based learning; the effects of model progression andassignments on definitional and intuitive knowledge,” Learningand Instruction, vol. 8, no. 3, pp. 235–253, 1998.
[5] C. Hulshof, T. Eysink, S. Loyens, and T. de Jong, “Zaps: Usinginteractive programs for learning psychology,” Interactive LearningEnvironments, vol. 13, no. 1-2, pp. 39–53, 2005.
[6] W. van Joolingen, “Cognitive tools for discovery learning,” Int. J.of Artificial Intelligence and Education, vol. 10, pp. 385–397, 1999.
[7] T. de Jong, “Scaffolds for scientific discovery learning,” in Handlingcomplexity in learning environments: research and theory, J. Elen andD. Clark, Eds., 2006, pp. 107–128.
[8] M. Njoo and T. de Jong, “Exploratory learning with a computersimulation for control theory: learning processes and instructionalsupport,” J. Res in Sci Teaching, vol. 30, no. 8, pp. 821–844, 1993.
[9] E. Lewis, J. Stern, and M. Linn, “The effect of computer simu-lations on introductory thermodynamics understanding,” Educa-tional Technology, vol. 33, pp. 45–58, 1993.
[10] W. van Joolingen and T. de Jong, “Supporting hypothesis gener-ation by learners exploring an interactive computer simulation,”Instructional Science, vol. 20, pp. 389–404, 1991.
[11] P. Kirschner, J. Sweller, and R. Clark, “Why minimal guidanceduring instruction does not work: An analysis of the failure ofconstructivist, discovery, problem-based, experiential and inquiry-based teaching,” Educ Psychol, vol. 41, no. 2, pp. 75–86, 2006.
[12] M. Cocea and G. D. Magoulas, “Context-dependent personalisedfeedback prioritisation in exploratory learning for mathematicalgeneralisation,” in User Modeling, Adaptation, and Personalization,ser. LNCS. Springer, 2009, vol. 5535, pp. 271–282.
[13] ——, “Hybrid model for learner modelling and feedback priori-tisation in exploratory learning,” Int. J. Hybrid Intell. Syst., vol. 6,no. 4, pp. 211–230, 2009.
[14] ——, “Context-dependent feedback prioritisation in exploratorylearning revisited,” in User Modeling, Adaption and Personalization,ser. LNCS. Springer, 2011, vol. 6787, pp. 62–74.
[15] ——, “Task-oriented modeling of learner behaviour in exploratorylearning for mathematical generalisation,” in Proceedings of the 2ndISEE workshop, AIED, 2009, pp. 16–24.
[16] M. Cocea, S. Gutierrez-Santos, and G. D. Magoulas, “Adaptivemodelling of users’ strategies in exploratory learning using case-based reasoning,” in Proceedings of KES, 2010, pp. 124–134.
[17] ——, “Case-based reasoning approach to adaptive modelling inexploratory learning,” in Innovations in Intelligent Machines - 2,T. Watanabe and L. Jain, Eds. Springer, 2012, vol. 376, pp. 167–184.
[18] M. Cocea and G. D. Magoulas, “Learning task-related strategiesfrom user data through clustering,” in IEEE ICALT, 2012, pp. 400–404.
[19] ——, “Participatory learner modelling design: A methodology foriterative learner models development,” Information Sciences, vol.321, pp. 48–70, 2015.
[20] H. Spires, J. Rowe, B. Mott, and J. Lester, “Problem-solving andgame-based learning: effects of middle grade students’ hypothesistesting strategies on science learning outcomes,” Journal of Educa-tional Computing Research, vol. 44, pp. 453–472, 2011.
[21] B. Kim, S. Pathak, M. Jacobson, B. Zhang, and J. Gobert, “Cycles ofexploration, reflection, and consolidation in model-based learningof genetics,” J Sci Educ Technol, pp. 1–14, 2015.
IEEE TRANSACTIONS ON LEARNING TECHNOLOGIES, VOL. 14, NO. 8, AUGUST XXXX 14
[22] B. C. Buckley, J. D. Gobert, P. Horwitz, and L. M. O’Dwyer, “Look-ing inside the black box: assessing model-based learning andinquiry in biologica,” International Journal of Learning Technology,vol. 5, no. 2, pp. 166–190, 2010.
[23] C. Conati, L.Fratamico, S.Kardan, and I. Roll, “Comparing repre-sentations forlearner modelsininteractivesimulations,” in ArtificialIntelligence in Education, ser. LNCS, 2015, vol. 9112, pp. 74–83.
[24] W. Holmes, M. Mavrikis, A. Hansen, and B. Grawemeyer, “Pur-pose and level of feedback in an exploratory learning environmentfor fractions,” in Artificial Intelligence in Education, ser. LNCS.Springer, 2015, vol. 9112, pp. 620–623.
[25] P. Brusilovsky, “Adaptive hypermedia,” User Modeling and User-Adapted Interaction Journal, vol. 11, no. 1-2, pp. 87–110, 2001.
[26] R. Morales, “Exploring participative learner modelling and itseffects on learner behaviour,” Ph.D. dissertation, Edinburgh, 2000.
[27] A. Bunt and C. Conati, “Probabilistic Student Modelling to Im-prove Exploratory Behaviour,” User Modelling and User-AdaptiveInteraction, vol. 13, no. 3, pp. 269–309, 2003.
[28] R. Stathacopoulou, G. Magoulas, M. Grigoriadou, and M. Sama-rakou, “Neuro-fuzzy knowledge processing in intelligent learningenvironments for improved student diagnosis,” Inform Sci, vol.170, pp. 273–307, 2005.
[29] R. Noss, C. Hoyles, M. Mavrikis, E. Geraniou, S. Gutierrez-Santos,and D. Pearce, “Broadening the sense of ‘dynamic’: a microworldto support students’ mathematical generalisation,” ZDM, vol. 41,no. 4, pp. 493–503, 2009.
[30] R. Noss, A. Poulovassilis, E. Geraniou, S. Gutierrez-Santos,C. Hoyles, K. Kahn, G. D. Magoulas, and M. Mavrikis, “Thedesign of a system to support exploratory learning of algebraicgeneralisation,” Comp & Educ, vol. 59, no. 1, pp. 63 – 81, 2012.
[31] M. Mavrikis, R. Noss, C. Hoyles, and E. Geraniou, “Sowing theseeds of algebraic generalization: designing epistemic affordancesfor an in- telligent microworld,” J Comput Assist Lear, vol. 29, no. 1,pp. 68–84, 2013.
[32] R. Baker, “Modeling and understanding students’ off-task behav-ior in intelligent tutoring systems,” in Proceedings of the ACMSIGCHI conference, 2007, pp. 1059–1068.
[33] M. Cocea, A. Hershkovitz, and R. Baker, “The impact of off-taskand gaming behaviors on learning: immediate or aggregate?” inProceedings of AIED, 2009, pp. 507–514.
[34] J. P. Rowe, S. W. McQuiggan, J. L. Robison, and J. C. Lester, “Off-task behavior in narrative-centered learning environments.” inAIED, 2009, pp. 99–106.
[35] J. Kolodner, Case-Based Reasoning, 2nd ed.Morgan Kaufmann, 1993.[36] A. Aamodt and E. Plaza, “Case-based reasoning: Foundation
issues: Methodological variations, and system approaches,” AICommunications, vol. 7, no. 1, pp. 39–59, 1994.
[37] V. Aleven, “Using background knowledge in case-based legalreasoning: A computational model and an intelligent learningenvironment,” Artif Intell, vol. 150, no. 1-2, pp. 183–237, 2003.
[38] M.-J. Huang, H.-S. Huang, and M.-Y. Chen, “Constructing apersonalized e-learning system based on genetic algorithm andcase-based reasoning approach,” Expert Systems with Applications,vol. 33, no. 3, pp. 551–564, 2007.
[39] R. Stottler and S. Ramachandran, “A Case-Based Reasoning Ap-proach to Internet Intelligent Tutoring Systems (ITS) and ITSAuthoring,” in The 12th International Florida Artificial IntelligenceResearch Society Conference, 1999, pp. 181–186.
[40] C. Z. Yuan, D. Isa, and P. Blanchfield, “A hybrid data mining andcase-based reasoning user modeling system (HDCU) for monitor-ing and predicting of blood sugar level,” in IEEE CSSE Int Conf,vol. 1, 2008, pp. 653–656.
[41] A. Jedlitschka and K.-D. Althoff, “Using case-based reasoning foruser modeling in an experience management system,” in Work-shop Adaptivitt und Benutzermodellierung in Interaktiven Systemen(ABIS01), 2001, pp. 8–12.
[42] A. Zimmermann, “Context-awareness in user modelling: Require-ments analysis for a case-based reasoning application,” in Case-Based Reasoning Research and Development, K. Ashley and D. Bridge,Eds. Springer, 2003, vol. 2689, pp. 718–732.
[43] G. Weber, “Episodic learner modeling,” Cognitive Science, vol. 20,no. 2, pp. 195–236, 1996.
[44] S.-G. Han, S.-G. Lee, and S. Jo, “Case-based tutoring systems forprocedural problem solving on the www,” Expert Systems withApplications, vol. 29, no. 3, pp. 573–582, 2005.
[45] S. Gutierrez, M. Cocea, and G. D. Magoulas, “A case-based rea-soning approach to provide adaptive feedback in microworlds,”in Proceedings of ITS, 2010, pp. 330–333.
[46] M.Cocea, “Amodellingframeworkforconstructivist learninginex-ploratorylearningenvironments,” in Proc.of ITS, 2008, pp.157–166.
[47] M. Cocea and G. Magoulas, “Identifying user strategies in ex-ploratory learning with evolving task modelling,” in IEEE Intel-ligent Systems, 2010, pp. 13–18.
[48] D. R. Wilson and T. R. Martinez, “Improved heterogeneous dis-tance functions,” Artif Int Res, vol. 6, pp. 1–34, 1997.
[49] S. Aksoy and R. Haralick, “Feature normalisation and likelihood-based similarity measures for image retrieval,” Pattern RecognitionLetters, vol. 22, pp. 563–582, 2001.
[50] S. Gutierrez, M. Mavrikis, and D. Pierce, “A learning environmentfor promoting structured algebraic thinking in children,” in Pro-ceedings of IEEE ICALT, 2008, pp. 74–76.
[51] J. L. Fleiss, “Measuring nominal scale agreement among manyraters.” Psychological bulletin, vol. 76, no. 5, pp. 378–382, 1971.
[52] M. Cocea, S. Gutierrez-Santos, and G. Magoulas, “Challenges forintelligent support in exploratory learning: the case of Shape-Builder,” in 1st ISEE Workshop, ECTEL, ser. CEUR, vol. 381, 2008.
[53] A. Mitrovic and P. Suraweera, “Teaching database design withconstraint-based tutors,” Int J Artif Intell Educ, pp. 1–9, 2015.
[54] V. Aleven, “An intelligent learning environment for case-basedargumentation,” Technology, Instruction, Cognition, and Learning,vol. 4, no. 2, pp. 191–241, 2006.
[55] S. Kardan and C. Conati, “Providing adaptive support in aninteractive simulation for learning: An experimental evaluation,”in Proceedings of CHI ’15. ACM, 2015, pp. 3671–3680.
[56] P. Pintrich and D. Schunk, Motivation in Education: Theory, Researchand Applications, 2nd ed. Prentice-Hall, 2002.
[57] C. R. Beal, L. Qu, and H. Lee, “Classifying learner engagementthrough integration of multiple data sources,” in The 21st nationalconference on Artificial intelligence, 2006, pp. 151–156.
[58] S. Gutierrez-Santos, E. Geraniou, D. Pearce-Lazard, and A. Poulo-vassilis, “Design of teacher assistance tools in an exploratorylearning environment for algebraic generalization,” Learning Tech-nologies, IEEE Transactions on, vol. 5, no. 4, pp. 366–376, 2012.
[59] S. Bull and J. Kay, “Student models that invite the learner in: TheSMILI open learner modelling framework,” Int J Artif Intell Educ,vol. 17, pp. 89–120, 2007.
[60] S. Hossain and L. Brooks, “Fuzzy cognitive map modelling educa-tionalsoftwareadoption,”Comp&Educ, vol.51, pp.1569–1588,2008.
Mihaela Cocea is currently a Senior Lec-turer in the School of Computing, University ofPortsmouth. She was awarded a PhD in Com-puter Science from Birkbeck College, Universityof London (2011) and an MSc by Research inLearning Technologies from National College ofIreland (2008). She has published over 50 pa-pers in the areas of Intelligent Systems, with afocus on adaptation to the user needs by usingArtificial Intelligence (AI) solutions. Her researchreceived a best conference paper award from
KES International in 2010. More information is available on her web-page: http://coceam.myweb.port.ac.uk/.
George D. Magoulas is Professor of ComputerScience at the Knowledge Lab (klab.bbk.ac.uk),Birkbeck College, University of London. He waseducated at the University of Patras, Greece,and holds a Post Graduate Certificate in Teach-ing and Learning in Higher Education fromBrunel University, UK. His research receivedbest conference paper awards from the IEEE(2000 and 2008), the European Network on In-telligent Technologies for Smart Adaptive Sys-tems (2001 and 2004), the International Asso-
ciation for Development of the Information Society (2006), the Associ-ation for Computing Machinery (2009) and KES International (2010).Prof Magoulas research portfolio includes research grants from theEPSRC, the ESRC, the AHRC, and the JISC, UK, and the EC. Moreinformation on his activities and publications is available on his webpagewww.dcs.bbk.ac.uk/∼gmagoulas.