ieee transactions on ultrasonics,...
TRANSCRIPT

IEEE TRANSACTIONS ON ULTRASONICS, FERROELECTRICS, AND FREQUENCY CONTROL, VOL. 63, NO. 9, SEPTEMBER 2016 1335
High-Frequency Quantitative UltrasoundSpectroscopy of Excised Canine Livers
and Mouse Tumors Using theStructure Factor Model
Pauline Muleki-Seya, Régine Guillermin, Julien Guglielmi, Jiangang Chen, Thierry Pourcher,Elisa Konofagou, Member, IEEE, and Emilie Franceschini, Member, IEEE
Abstract— Three scattering models were examined forcharacterizing ex vivo canine livers and HT29 mouse tumorsin the 10–38- and the 15–42-MHz frequency bandwidth, respec-tively. The spherical Gaussian model (SGM) and the fluid spheremodel (FSM) that were examined are suitable for dealing withsparse media, whereas the structure factor model (SFM) isadapted for characterizing concentrated media. For the caninelivers, the scatterer radius and the acoustic concentration esti-mated with the three models were similar and matched well thenuclear structures obtained from histological analysis (with rela-tive errors less than 7%). These results show that the livers couldbe considered as a diluted medium and that the nuclei in livercould be a dominant source of scattering. For the homogeneousmouse tumors, containing mostly viable HT29 cells, scattererradius and volume fraction estimated with the SFM showedgood agreement with the whole cell structures obtained fromhistological analysis (with relative errors less than 15%), whereasthe sparse models (the SGM and the FSM) gave no consistentquantitative ultrasound parameters. This suggests that the viableHT29 cell areas have densely packed cellular content and thatthe whole HT29 cell could be responsible for scattering. For theheterogeneous tumors, the hyperechogenic zones observed in theB-mode images were linked to the presence of small necrotic areas
Manuscript received February 9, 2016; accepted May 1, 2016. Date ofpublication May 4, 2016; date of current version September 12, 2016. Thiswork was supported by the Investissements d’Avenir French Government Pro-gram within the French National Research Agency through the Projects Can-ceropole Provence Alpes Côte d’Azur (PACA) and Initiative D’EXcellenceAix-Marseille (A*MIDEX) under Grant ANR-11-IDEX-0001-02.
P. Muleki-Seya was with the Laboratoire de Mécanique et d’AcoustiqueLMA CNRS UPR 7051, Aix-Marseille Université, Centrale Marseille,13453Marseille Cedex 13, France. He is now with the Bioacoustics ResearchLaboratory, Department of Electrical and Computer Engineering, Univer-sity of Illinois at Urbana–Champaign, Urbana, IL 61801 USA (e-mail:[email protected]).
R. Guillermin and E. Franceschini are with the Laboratoire de Mécaniqueet d’Acoustique LMA CNRS UPR 7051, Aix-Marseille Université, Cen-trale Marseille,13453 Marseille Cedex 13, France (e-mail: guillermin.@
.lma.cnrs-mrs.fr; [email protected]).J. Guglielmi and T. Pourcher are with the Laboratoire Transporteurs
en Imagerie et Radiothérapie en Oncologie, institut de Biologie Environ-nementale et Biotechnologie, Departement des Sciences de la Vie, Com-missariat a l’Energie Atomique et aux énergies alternatives, University ofNice Sophia Antipolis, Nice 06107, France (e-mail: [email protected];[email protected]).
J. Chen was with the Department of Biomedical Engineering and Radiology,Columbia University, New York, NY 10027 USA. He is now with PhilipsResearch China, Shanghai 200233, China (e-mail: [email protected]).
E. Konofagou is with the Department of Biomedical Engineering andRadiology, Columbia University, New York, NY 10027 USA (e-mail:[email protected]).
Digital Object Identifier 10.1109/TUFFC.2016.2563169
surrounded by viable HT29 cells. Comparison between sparseand concentrated models shows that these hyperechogenic zonescould be considered as a concentrated medium.
Index Terms— Backscatter coefficient, ex-vivo tissues,quantitative ultrasound, structure function.
I. INTRODUCTION
QUANTITATIVE ultrasound (QUS) techniques provid-ing insight into tissue microstructure are based on the
frequency-based analysis of the signals backscattered frombiological tissues. A spectral analysis approach consists inestimating two spectral parameters: spectral slope and inter-cept [1]. The spectral slope is the slope with respect to thefrequency of the linear regression of the normalized powerspectrum (expressed in dB), and the spectral intercept is theextrapolation of the normalized power spectrum linear fit tozero frequency. The slope is related to the effective scattererradius, and the intercept is determined by the scatterer radiusand the acoustic concentration (the acoustic concentration isthe product of the scatterer volume fraction times the squareof the relative impedance difference between the scatterersand the surrounding tissue). Another QUS method used toextract effective scatterer radius and acoustic concentrationrelies on theoretical scattering models in order to fit themeasured backscatter coefficient (BSC) from biological tis-sues to an estimated BSC using an appropriate theoreticalscattering model [2]. In general, two models are used todescribe the scattering from tissue. The more frequently usedmodel, called the spherical Gaussian model (SGM), describestissue as a random inhomogeneous continuum with impedancefluctuations [1], [3]. The second model, called the fluid spheremodel (FSM), describes tissue as an ensemble of discrete scat-terers with an impedance differing from that of a homogeneousbackground medium, where the cells are generally consideredas the dominant source of scatterers and modeled as fluidspheres [4]. Both the models yield two QUS parameters: theaverage scatterer radius and the acoustic concentration.
The goal of QUS is to associate these parameter valueswith specific tissue structures [1]. Feleppa et al. [5], [6]demonstrated that the effective scatterer radius was relevant todetect ocular or prostate tumors. In ocular malignant tumors,larger scatterer radii were estimated by ultrasound when
0885-3010 © 2016 IEEE. Personal use is permitted, but republication/redistribution requires IEEE permission.See htt.p://ww.w.ieee.org/publications_standards/publications/rights/index.html for more information.

1336 IEEE TRANSACTIONS ON ULTRASONICS, FERROELECTRICS, AND FREQUENCY CONTROL, VOL. 63, NO. 9, SEPTEMBER 2016
compared with normal tissues and were related to clustersof melanin-laden histiocytes [5]. Waag et al. [7] related theultrasound backscatter measurements to the lobule structuresin the liver. Oelze et al. [8] distinguished fibroadenomas(benign tumors) and carcinomas (malignant tumors) based onthe QUS estimates. The scatterer radius QUS images suggestthat the fibroadenomas have larger scatterers consistent withthe glandular acini radii and that carcinomas have smaller,more uniform scatterer radii [8]. However, it is often difficultto establish a relationship between QUS scatterer propertyestimates and actual tissue structures (generally identified fromoptical microscope images) [4], [9]. Oelze and O’Brien [4]compared three scattering models (the SGM, the FSM, anda new cell model to consider backscattering from cell nucleiand cytoskeleton) to examine two mouse models of mammarycancers: carcinomas containing uniformly distributed cells andsarcomas containing cell clusters. None of the three modelsproduced good fits to the data, and QUS estimates did notfaithfully represent the actual microstructural differences asobserved from histological images [4].
In the aforementioned models (the SGM, the FSM, and thenew cell model), the scatterers are assumed to be indepen-dently and randomly distributed (i.e., to have a low scatterervolume fraction) and multiple scattering is neglected (in linewith the Born approximation). Under these hypotheses, thepower of the backscattered signals linearly increases withthe scatterer volume fraction and depends on the radius andacoustic properties of the scattering structures. This linearrelationship has been used to monitor the scatterer radiusand/or acoustic concentration. However, the assumption ofrandomly distributed scatterers may not hold in concentratedcell pellet biophantoms [11] or in tumors with densely packedcells [12]. Therefore, our hypothesis is that a scatteringmodel considering the interference effects caused by thecorrelations among scatterer positions (i.e., considering thecoherent scattering) may help to estimate QUS parameterswith better accuracy on densely packed media. The structurefactor model (SFM) is based on the same hypothesis used inthe FSM that the cells are a dominant source of scattering. TheSFM considers the coherent scattering by summing the contri-butions from individual cells and modeling the cellular inter-actions by a statistical mechanics structure factor [13], [14].Our group performed experiments on tissue-mimicking phan-toms [15] and cell pellet biophantoms [16] to show thesuperiority of the SFM in comparison with other classicalmodels that do not take the structure factor into account(i.e., the SGM and the FSM) to explain the BSC behavior forconcentrated media. More recently, the SGM, the FSM, andthe SFM were compared to estimate the scatterer radius andthe acoustic concentration from backscattering measurementsfor cell pellet biophantoms [17]. In that study, the three scat-tering models gave similar QUS parameters for diluted media(φ∗ ≤ 0.06). However, the SGM and the FSM did not yieldaccurate structural parameter estimates for the highest volumefractions φ∗ ≥ 0.12, whereas the SFM yielded satisfactoryestimates for actual cell volume fractions ranging from 0.006to 0.30, i.e., for both diluted and concentrated cell pelletbiophantoms [17].
This paper examined the SFM to estimate the QUS proper-ties of excised canine livers and mouse tumors, and comparedthe use of the SFM with that of the SGM and the FSM. Thecanine liver is quite homogeneous whereas some of the mousetumors were composed of two different areas: a cellular areacontaining viable tumor cells and a necrotic area containinglymphocytes and no viable tumor cells. The ability of the SFMto simultaneously estimate the scatterer radius, the volumefraction, and the relative contrast impedance was evaluated.These QUS parameter estimates obtained from the threemodels were compared with the true cellular structure prop-erties observed from histological slides.
II. MATERIALS AND METHODS
A. Excised Tissues
1) Canine Livers: Experiments were conducted on fourexcised canine livers obtained from four mongrel male dogs.Liver was used because of its relative homogeneity comparedwith other tissues. Before ultrasound scanning, each speci-men was immersed in the phosphate buffered saline (PBS)solution and placed in a vacuum chamber for 30 min priorto each experiment. All animal experimental procedures wereapproved by the Columbia University Institutional AnimalCare and Use Committee (protocol number: Columbia Uni-versity AC-AAAD5650).
2) Mouse Tumors: The human colon adenocarcinoma cellline HT29 was grown in Dulbecco’s modified Eagles’s mediumcontaining 4.5 g of glucose/liter and supplemented with 10%fetal calf serum. This cell line represents a very usefulxenograft model. HT29 xenografts rapidly grow and is a poorvascularized tissue. Necrotic areas could appear in the tumorcore as a result of rapid growth and exacerbated by the lowvascularity of this tumor model. The 106 HT29 cells in 100 μLof PBS were subcutaneously inoculated into the flankof 6–8-week-old nude mice (Charles River Laboratories).After two or three weeks of growth, the mice were euthanizedunder anesthesia by cervival dislocation. For each mouse, thetumor was excised and a part of the skin was removed. Thetumors were then immersed in PBS and were ultrasonicallyimaged. A total of six tumors were used in this paper.Animal housing and procedures were conducted according tothe guidelines of the French Agriculture Ministry and wereapproved by the local ethics committee.
The time between euthanasia and the end of ultrasonicacquisition was comprised between one hour and one hourand a half for all the experiments, on both canine livers andmouse tumors.
B. High-Frequency Ultrasound Data Acquisition
Ultrasound measurements were acquired using a Vevo 770high-frequency ultrasound system (Visualsonic Inc., Toronto,Canada) with an RMV 707 probe for the liver measure-ments and with an RMV 703 probe for the mouse tumormeasurements. The oscillating single-element focused circulartransducer of the RMV 707 and the RMV 703 probes hadthe center frequencies of 25 and 30 MHz, the focuses of12.7 and 10 mm, and the f-numbers of 2.1 and 2.5, respec-tively. The lateral resolution of both the probes was ∼115 μm.

MULEKI-SEYA et al.: HIGH-FREQUENCY QUS SPECTROSCOPY OF EXCISED CANINE LIVERS AND MOUSE TUMORS 1337
The radio frequency (RF) data were acquired from this scannerat a sampling frequency of 100 MHz for the canine livers and250 MHz for the mouse tumors with 8-bit resolution using adata acquisition board (GaGe, USA).
RF data were collected from 20 different scan planes witha step size of 500 μm for the livers, and from 5 to 10different scan planes in the middle of the tumor witha step size of 300 μm for the mouse tumors, using amicropositioning system. Note that, in the case of the liver,the orientation and the position of the probe were chosento prevent the presence in the scan plane of specular echoesoriginating from the veins or arteries. A scan plane containsapproximately 312 echo lines. The probe focus was positionedbetween 1 and 2 mm below the PBS/tissue interface. Foreach scan plane, the data were separated into overlappingrectangular regions-of-interest (ROIs), defined as the gatedregion. The axial length of an ROI corresponds to the range-gated RF echo with a length of 0.6 mm for the livers andof 0.5 mm for the tumors, corresponding to ten wavelengthsat the center frequency. The lateral length of an ROI corre-sponds to 60 adjacent echo lines from the Visualsonics probe(corresponding to a length comprised between 0.6 and 1 mm).BSC estimates were obtained for each ROI from the RF sig-nals, as described in Section II-C. ROIs were chosen within theliver or within the tumors where the B-mode images appearedto be quite homogeneous. The overlap of ROIs was 75% forboth lateral and axial directions. Note that only one depth wasexamined for the liver experiments, since a large number ofscan planes (equal to 20) were collected. The average numberof independent QUS estimates for a single liver was 80. For themouse tumors, the scanned depth varied according to tumorvolumes and ranged between 1.1 and 3.8 mm in the axialdirection (corresponding to a number of overlapping ROIscomprised between 6 and 27, respectively).
C. Attenuation and BSC Measurement
The attenuation coefficients of the tissues were determinedusing a standard substitution method [18]. Experiments wereconducted with a focused transducer with a center frequency of20 MHz, a focus of 13 mm, and an f-number of 2.1. The powerspectrum of the emitted signal, denoted by Sref ( f ), is foundby reflecting the pulse from a reflector, with no tissue in theacoustic path. A tissue specimen is then put in contact with thereflector to determine its thickness as well as its attenuation.The thickness of the tissue specimen D is deduced fromthe time of flight between the transducer and the PBS/tissueinterface. The spectrum of the pulse transmitted through thetissue back to the transducer is denoted by S( f ). The measuredtissue attenuation α0 (in dB/mm) is computed by taking thelog spectral difference between the two spectra [18]
α0( f ) = αPBS( f ) + 10
2Dlog10
(Sref( f )
S( f )
)(1)
where f is the frequency and αPBS is the frequency-dependentattenuation of PBS, which is taken to be similar to water,2.17 × 10−4 dB · MHz−2 · m−1 at 20 °C [19]. Assuming thatthe tissue attenuation linearly increases with the frequency(α0( f ) = α f ), a linear regression analysis provides the
Fig. 1. Illustration of the data processing of a mouse tumor.
attenuation coefficient α in dB/mm/MHz. For each tissuespecimen, the averaged attenuation coefficient was obtainedfrom ten different locations in the tissue specimen. The meanattenuation coefficients were αL = 0.65 ± 0.05 dB/cm/MHz(n = 4), αT = 0.63 ± 0.09 dB/cm/MHz (n = 4), andαS = 3.36 ± 0.06 dB/cm/MHz (n = 2), for the canineliver, the HT29 mouse tumor, and the skin, respectively(n being the number of tissue specimens measured). Theattenuation coefficients found in the literature were in thesame range: 0.69 dB/cm/MHz at 10–30 MHz for the bovineliver [20], 0.6 dB/cm/MHz at 10–30 MHz for the mousecarcinoma tumor [21], and 2.6 dB/cm/MHz at 11–26.6 MHzfor the human dermis [22].
To take into account the attenuation effects, attenuationcompensation was individually conducted for every RF lineof each ROI. In the case of the canine liver experiments,sound has to travel through only one layer of liver tissuecorresponding to the distance between the PBS/liver interfaceand the beginning of the ROI, denoted by dL . In the case ofthe mouse tumor experiments, before reaching the beginningof the ROI, sound had to pass through two layers of attenuatingtissues: a first layer of highly attenuating residual skin oflength dS and a second layer composed mainly of HT29 cellsof length dT (see Fig. 1). For each RF segment of the ROI, thevalues of dS and dT are different. Note that the residual skinboundaries were delineated manually. The power spectrum ofthe RF segment, denoted by Pmeas, was compensated for theattenuation effects as follows [23]:Pmeas( f ) = |FT{RFL(t)WL(t)}|2 e4dLαL ( f )
×[
4LαL( f )
1 − e−4LαL( f )
]for the liver
= |FT{RFL(t)WL(t)}|2 e4dSαS( f )
×e4dT αT ( f )[
4LαT ( f )
1 − e−4LαT ( f )
]for the mouse tumor
where FT is the Fourier transform operator, RFL is the rawRF-segment signal data, and WL is the rectangular window oflength L centered on the middle of the RF segment. Finally, the60 attenuation-compensated power spectra of the RF signalsin the ROI were averaged to obtain Pmeas.
QUS images based on BSC analysis depict tissue proper-ties in a system-independent manner. A reference phantom

1338 IEEE TRANSACTIONS ON ULTRASONICS, FERROELECTRICS, AND FREQUENCY CONTROL, VOL. 63, NO. 9, SEPTEMBER 2016
technique [24] was employed for BSC estimation to accountfor the electromechanical system response and the depth-dependent diffraction and focusing effects of the ultrasoundbeam. The reference phantom was composed of distilled water,2% agar powder (A9799, Sigma Aldrich, France), and 1%of polyamide microsphere with a radius of 2.5 μm (orgasol2001 UD NAT1, Arkema, France). Polyamide microspheres(a sound speed of 2300 m/s, a density of 1030 kg/m3, andPoisson’s ratio of 0.42) have been already used in studiesof BSC estimation [15]. The reference sample is easy toprepare and to handle, and the scattering process occurringin an ensemble of identical solid microspheres at a verylow volume fraction of 1% (dilute medium) has been welldocumented using the Faran model [15], [25]. Echoes fromthe reference scattering medium were acquired and windowed,as had previously been done with the tissue specimen underconsideration. Their power spectra were compensated for theattenuation (using αref = 0.004 dB/mm/MHz, which wasmeasured independently by a standard substitution method[18]) and then averaged to obtain Pref . The measured BSCwas thus computed as follows [24]:
BSCmeas(k) = BSCref(k)Pmeas(k)
Pref (k)(2)
where k is the wavenumber and BSCref is the theoreticalBSC of the reference sample given by (2) in [15] using theFaran [25] model.
D. QUS Parameter Estimates
This paper compared QUS estimates from three models—the SGM, the FSM, and the SFM. Using the SGM, the BSCis modeled using a spatial autocorrelation function describingthe size, shape, acoustic properties, and distribution of thescatterers in the medium. The BSC can be expressed as theproduct of the BSC in the Rayleigh limit and the backscatterform factor FF [26]. The form factor describes the frequencydependence of the scattering, in terms of the size, shape, andacoustic properties of the scatterers. The Gaussian form factorhas been used for many applications [1]–[4] and models amedium with continuous changes in acoustic properties. Thetheoretical BSC using the SGM formulation is given by [26]
BSCSGM(k) = k4V 2s nz
4π2 e−2k2d2 = k4V 2s nz
4π2 e−0.827k2a2G (3)
where nz is the acoustic concentration, d is the correlationdistance that characterized the continuous isotropic medium,and Vs = (2πd2)3/2. The effective scatterer radius aG isrelated to the correlation distance d by setting values of Vs fora continuum model equal to the volume of an effective sphereof radius aG : Vs = (2πd2)3/2 = (4/3)πa3
G [26, Sec. IV].The FSM describes tissue as an ensemble of discrete scat-
terers with impedance differing from that of a homogeneousbackground medium. By considering an ensemble of identi-cal fluid spheres of radius aF (randomly and independentlydistributed), the theoretical BSC for the FSM formulation isgiven by [26]
BSCFSM(k) = k4V 2s nz
4π2
[3
(2kaF )3 j1(2kaF )
]2
(4)
where j1 is the spherical Bessel function of the first kind oforder 1 and aF is the radius of the fluid sphere. When usingthe SGM or the FSM, the unknown QUS parameters are theacoustic concentration nz and the effective scatterer radius aG
for the SGM (or aF for the FSM). In the rest of this paper,the subscript G or F for the effective scatterer radius will beomitted.
The SFM is based on the assumption that, at high scat-terer volume fractions, interference effects are mainly causedby correlations between the spatial positions of individualscatterers that can be modeled with the structure factor.By considering an ensemble of identical spheres of radius a,the theoretical BSC for the SFM formulation is givenby [14], [15]
BSCSFM(k) = nk4V 2
s γ 2z
4π2
[3
(2ka)3 j1(2ka)
]2
S(k) (5)
where n is the sphere number density and S is the struc-ture factor, which can be analytically obtained as describedin [15, eqs. (A1)–(A4)] based on [27]. The unknown QUSparameters are the scatterer radius a, the volume fraction φ,and the relative impedance contrast γz .
Estimated values of the QUS parameters were determinedby fitting the measured BSCmeas to the theoretical BSCs,i.e., by minimizing the cost function
F =∑
j
‖BSCmeas(k j ) − BSCtheo(k j )‖2 (6)
where BSCtheo is given by (3) for the SGM, by (4) forthe FSM, and by (5) for the SFM. The cost functions wereminimized over 10–38 MHz for the canine liver experimentswith the RMV 707 probe and over 15–42 MHz for theHT29 mouse tumor with the RMV 703 probe, approximatelycorresponding to the −12-dB frequency bandwidth of Pmeas.For the three models, the fitting procedure was performedusing the minimization routine fminsearch without constraintin the MATLAB (The MathWorks, Inc., Natick, MA), i.e., aNelder–Mead simplex method. In the case of the SFM, thefmincon routine was also tested with the constraint conditionsthat 0 ≤ a ≤ 100 μm, 0 ≤ φ ≤ 1, and 0 ≤ γz ≤ 0.20.The fmincon and fminsearch routines were compared becausefminsearch sometimes gave unrealistic values for the estimatedrelative impedance contrast γz (up to values of 0.7). This lastpoint will be discussed later in Section IV-C. For the purposeof comparison between the sparse models and the SFM, theacoustic concentration for the SFM was also calculated as:n∗
z = (φ∗γ ∗2z /(4/3)πa∗3).
For the three scattering models (the SGM, the FSM, andthe SFM), the goodness of fit of the model to the measuredBSCmeas was assessed by the goodness-of-fit statistic, R2,given by [4]
R2 = 1 −∑
j ‖BSCmeas(k j ) − BSCopt(k j )‖2
∑j ‖BSCmeas(k j ) − BSCopt‖2
where BSCopt represents the theoretical BSC computed withthe estimated values of the QUS parameters (obtained bythe minimization procedure), and BSCopt represents the mean

MULEKI-SEYA et al.: HIGH-FREQUENCY QUS SPECTROSCOPY OF EXCISED CANINE LIVERS AND MOUSE TUMORS 1339
Fig. 2. (a) 3-D illustration of a Gaussian distribution of spheres with the corresponding 2-D virtual slice (in red line) for HT29 nuclear radii for a volumefraction of 0.3. (b) Corresponding projection of spheres for a 2-μm slice thickness. (c) Relationship between surface and volume fractions for the simulatedmedium mimicking HT29 nuclei.
value of BSCopt over the studied frequency range (10–38 MHzfor the canine livers and 15–42 MHz for the HT29 mousetumors). The closer the R2 value is to 1, the better the fit ofthe model to the data.
E. Estimation of the Cellular Structures From theHistological Sections
After the ultrasound measurements, the tissues were fixed in10% formalin solution, processed, and embedded in paraffin.Tissues were approximately sectioned in the same orientationas the ultrasound scanning planes. The slices were thenstained with hematoxylin and eosin (H&E). For each tissue(liver or mouse tumor) specimen, six histological imageswere selected to measure several nuclear areas using theImageJ software. Assuming that the nuclei had circular shapes,the corresponding nucleus radii were computed from thearea estimates. The mean nucleus radius was estimated bymeasuring 3000 randomly selected cells. A procedure wasthen performed to approximately obtain the nucleus volumefraction from the 2-D histological images, as described in thefollowing. First, the number N of nuclei was calculated ina given area Lx × L y of the histological images in order toobtain the real surface fraction, as φ2D = Nπa2
N /(Lx L y).The calculation of the surface fractions was obtained from15 histological images of area 150 μm × 150 μm. Second,a correlation between the nuclear surface and volume fractionswas established for each cell category. To do this, spheresmimicking nuclei were uniformly randomly distributed withina simulated volume for a given volume fraction [Fig. 2(a)]using a Monte Carlo algorithm [30, Sec. II.B.A]. The sphereshad a Gaussian distribution, with the mean radius and standarddeviation corresponding to those of the nuclei. Then, the2-D virtual slices with a thickness of 10 μm (or of 2 μm)were generated from the 3-D simulated volume [Fig. 2(b)].The virtual slices thicknesses are equal to those of histology:10 μm for the liver and 2 μm for the mouse tumor. The surfacefraction of the 2-D virtual slices was finally calculated to berelated to the volume fraction of the 3-D simulated volume.This procedure was repeated several times for different volumefractions varying from 0.02 to 0.40, and for the radii of thedifferent categories of cells. Fig. 2(c) shows an example ofthe relationship between surface and volume fractions for the
Fig. 3. Histological image of a canine liver.
simulated medium mimicking HT29 nuclei. It is evident thatthe surface and volume fractions follow a linear relationship.Similar linear relationships were obtained for the radii of thedifferent categories of cell (data not shown).
III. RESULTS
A. Canine Livers
1) Estimation of the Hepatocyte Structures From the His-tological Sections: The liver is a homogeneous tissue, whichconsists of densely packed hepatocytes. An example of thehistological slice of the canine liver using light microscopy isshown in Fig. 3. The hepatocyte nuclei are distinctly round,and the cytoplasmatic membranes are well defined. Most cellshave a single nucleus, and 15% of them are binucleatedcells [28]. On these histological slices, the nucleus and wholecells radii were estimated, along with the nucleus-to-cell-ratio.Note that this ratio for hepatocytes is quite small, around 0.35.The volume fraction of nuclei was estimated from their surfacefraction on the histological slices, and the volume fraction ofwhole cells was calculated as φC = 0.925φN (aC/aN )3 [wherethe coefficient 0.925 = (1−0.15)+0.15/2 corresponds to the15% of binucleated cells]. These nucleus and cells radii aswell as the corresponding volume fractions are summarizedin Table I.
2) QUS Parameters: For each of the four canine livers,the QUS parameters were estimated with the SFM in the10–38-MHz frequency bandwidth. An example of the esti-mated scatterer radii a∗ and volume fraction φ∗ estimated

1340 IEEE TRANSACTIONS ON ULTRASONICS, FERROELECTRICS, AND FREQUENCY CONTROL, VOL. 63, NO. 9, SEPTEMBER 2016
TABLE I
ESTIMATES OF THE CELLULAR STRUCTURES MEASURED OR DEDUCED FROM THE HISTOLOGICAL IMAGES FOR THE HEPATOCYTES IN THE CANINELIVERS AND FOR THE HT29 CELLS AND NK LYMPHOCYTES IN THE MOUSE TUMORS. THE ASTERISK SYMBOL DENOTES THE VALUES
ESTIMATED DIRECTLY FROM THE OPTICAL MICROSCOPE IMAGES
TABLE II
MEAN ESTIMATED VALUES OF a∗ , φ∗ , γ ∗z , AND n∗
z OBTAINED WITH THE SFM (USING BOTH fminsearch AND fmincon) FOR THE
FOUR CANINE LIVERS AND THE CORRESPONDING GOODNESS-OF-FIT R2 . THE LAST COLUMN INDICATES THE
PERCENTAGE OF QUS PROPERTY ESTIMATES THAT WERE SEPARATED IN TWO CLUSTERS
Fig. 4. Scatterer radii a∗ and volume fractions φ∗ estimated with the SFMfor liver 1 (using fmincon). QUS property estimates were separated in twoclusters.
using fmincon is given in Fig. 4. This plot of data points(a∗ and φ∗) displays two point clusters. The same behaviorswere obtained with the four canine livers, such that the QUSparameter estimates were separated in two clusters. Therefore,data clustering was performed using the routine fitgmdist inthe MATLAB to fit Gaussian mixture distribution model withtwo components to data points (a∗ and φ∗). Table II lists theQUS parameters a∗, φ∗, and γ ∗
z averaged for the four caninelivers and estimated with the SFM using both fminsearchand fmincon. Most SFM estimates (around 65%) were foundfor cluster 1 with the lowest volume fraction, whatever theoptimization routine used. In the following analysis, we willfocus on the results obtained in cluster 1.
For the ROIs where the SFM estimates were found incluster 1 with fmincon, the scatterer radius a∗ and the acousticconcentration n∗
z estimated from the FSM and the SGM werecalculated. Fig. 5 summarizes the results for the four caninelivers using the three scattering models. To compare the scat-terer property estimates to underlying tissue microstructures,
Fig. 5 also shows in dashed lines the nuclear radius and theacoustic concentration deduced from the histological analysis.The nuclear acoustic concentration deduced from histologicalanalysis was calculated as the ratio φN /((4/3)πa3
N ) (withaN and φN given in Table I) multiplied by estimates for therelative impedance contrast comprised between 0.06 and 0.12.This range of values for the relative impedance contrast seemsto be reasonable when compared with the impedance contrastof leukemia cells (γz = 0.051) [16] or of red blood cells(γz = 0.11) [31] found in the literature. The SFM, the FSM,and the SGM yielded quasi-identical values of a∗ and n∗
z ,except for liver 2 for which the acoustic concentration wasslightly higher. The goodness-of-fit statistics for the threemodels given in Fig. 5(c) are similar, with a mean valuearound 0.88.
B. Mouse Tumors
1) Estimation of the Cellular Structures From the Histo-logical Sections: Some of the mouse tumors studied hereare heterogeneous because when a tumor grows, it maydevelop what is known as a necrotic core. An example ofthe histological slice of such a heterogeneous mouse tumor isshown in Fig. 6(a). It contains two different areas: a cellulararea containing viable HT29 tumor cells and a necrotic areacontaining a majority of natural killer (NK) lymphocytes andno viable tumor cells. The nuclei boundaries of HT29 cellsin the viable cellular area are well defined, but not the cyto-plasmatic membranes [Fig. 6(b)]. The nuclei of lymphocytesin the necrotic area are piknotic, and NK lymphocytes aresurrounded by fluid filled spaces that may correspond to spacesleft by HT29 cells [Fig. 6(c)]. The cytoplasmatic membraneswere not observable for the HT29 cells and NK lymphocytesin the histological images from mouse tumors. Therefore,the nucleus-to-cell ratio of HT29 cells was estimated on acomplementary experiment on fixed cells from in vitro culture,whereas the nucleus-to-cell ratio of the NK lymphocytes wasdeduced from the literature [29]. The volume fraction ofnuclei was estimated from their surface fraction on histologicslices, and the volume fraction of whole cells was calculated

MULEKI-SEYA et al.: HIGH-FREQUENCY QUS SPECTROSCOPY OF EXCISED CANINE LIVERS AND MOUSE TUMORS 1341
Fig. 5. (a) and (b) Structure parameters a∗ and n∗z estimated with the
SFM (using both fminsearch and fmincon), the SGM, and the FSM forthe four canine livers. Only the SFM results found in cluster 1 are given.Dashed lines: nuclear radius and acoustic concentration deduced from histo-logical analysis. (c) Corresponding goodness-of-fit R2.
as φC = φN (aC/aN )3. These nucleus and cells radii, as wellas their volume fractions for HT29 cells and NK lymphocytes,are summarized in Table I. Note that the estimations ofthe cellular structures could have some uncertainties, sincethe cells/tissues shrink a little during the fixation process.In addition, the estimations of the whole NK lymphocytesmay be less reliable in comparison with the other cellularstructures (nuclear NK lymphocyte, or nuclear/whole HT29cells), because the nucleus-to-cell ratio used to estimate thewhole NK lymphocyte radius was obtained from the literature.
2) B-Mode Images From the Mouse Tumors: Experimentswere conducted on growing HT29 mouse tumors. Based on the
histological observations, the smaller tumors 1–3 were homo-geneous, mainly containing viable HT29 cells while the biggertumors 4–6 were heterogeneous, with the presence of severalnecrotic areas containing NK lymphocytes. Fig. 7 representsthe typical examples of histological slices from homogeneousand heterogeneous tumors, and their corresponding B-modeimages. On the histological image of the heterogeneous tumor,one can observe some necrotic areas corresponding to regionsno longer containing HT29 cells but infiltrated by NK cells(see also Fig. 6). The corresponding B-mode image presentsa central hyperechogenic area [see Fig. 7(e)], which is notobserved in the B-mode image of the homogeneous tumor.
We quantified the whole tumor area as well as the necroticarea from 20 successive histological slices (2-μm thin sectionsevery 10 μm), as shown in Fig. 7(d). For each histologicalslice, the ratio of the necrotic to the total tumor area wasthen calculated. A similar procedure was applied for fiveB-mode images to compute the ratio of the hyperechogenicto the total tumor area, as shown in Fig. 7(e). This studywas performed on tumor 4, whose central zone was sectionedinto serial histological slices. The ratio obtained from thehistological images was found around 0.13 ± 0.01, whereasthe ratio estimated from the B-mode images was even greater,approximately 0.34 ± 0.05.
3) Spectral Parameters From the Homogeneous andHeterogeneous Tumors: The averaged ultrasound-integratedbackscatter (UIB) corresponding to the averaged BSCmeas overthe analyzed frequency bandwidth (i.e., 15–42 MHz for theRMV 703) was calculated for each tumor over the entire tumorarea (including the part that was necrotic in the heterogeneoustumors). The averaged UIB was found equal to 0.36 ± 0.16,0.37 ± 0.20, and 0.31 ± 0.15 10−2 cm−1 · sr−1 for tumors 1,2, and 3, respectively, and equal to 0.79 ± 0.41, 0.90 ± 0.56,and 0.84 ± 0.52 10−2 cm−1 · sr−1 for tumors 4, 5, and 6,respectively. Tumors 1–3 present lower values of averagedUIB with a smaller variance than other tumors. Statisticalsignificant differences were observed between the homo-geneous group (tumors 1–3) and the heterogeneous group(tumors 4–6) when using the UIB (P < 0.001 with an ANOVAKruskal–Wallis test). The enhancement of the UIB values fortumors 4–6 is linked to the hyperechogenic areas in thosetumors and corroborates the presence of necrosis, as previouslyobserved in [34].
In Sections III-B4 and III-B5, the QUS parameters of thehomogeneous tumors were estimated from a gated B-moderegion of the whole tumors. For the heterogeneous tumors,two gated B-mode regions were manually defined to surrounda hyperechogenic area (due to the presence of some necroticareas) and a less echogenic area that mainly contained viableHT29 cells (called in the remainder of this paper viable HT29cell area). Note that both the gated B-mode regions wereselected as having a quite homogenous aspect.
4) QUS Parameters From the Viable HT29 Cell Areas:Fig. 8 shows an example of QUS parameters estimatedwith the SFM using fmincon, as well as the UIB para-meter. The scatterer radius a∗, acoustic concentration n∗
z ,and UIB images were constructed by superimposing color-coded pixels on a conventional gray-scale B-mode image

1342 IEEE TRANSACTIONS ON ULTRASONICS, FERROELECTRICS, AND FREQUENCY CONTROL, VOL. 63, NO. 9, SEPTEMBER 2016
Fig. 6. (a) General view of a histological image from a heterogeneous mouse tumor containing viable and necrotic areas. Histological images of (b) cellulararea containing viable HT29 cells and (c) necrotic area containing a majority of NK lymphocytes.
Fig. 7. (a) Histological slice from a homogeneous tumor and (b) corresponding B-mode image. (c) and (d) Histological slice from a heterogeneous tumorand (e) corresponding B-mode image. Panel (d) shows the contours of several necrotic areas and corresponds to a zoomed-in view of the histological sectionpresented on Panel (c).
of the tumor. The size and the location of the color-codedpixels corresponded to ROIs from which parameters esti-mates were obtained. The UIB was rather homogeneousaround 0.37 × 10⁻² cm−1 · sr−1, the scatterer radius a∗around 6.6 μm, and the acoustic concentration n∗
z around35.3 dB · mm−3.
When considering the SFM estimates for the mouse tumors,two clusters of data points (a∗ and φ∗) were obtained (datanot shown): one cluster with a high volume fraction, approx-imately 0.54–0.59 (called cluster 1), and another cluster withlower volume fraction, approximately 0.10 (called cluster 2),as previously observed with the canine liver experiments.Table III lists the QUS parameters a∗, φ∗, and γ ∗
z aver-aged for the six tumors on the viable HT29 cell areas andestimated with the SFM using both fminsearch and fmincon.
The majority of the SFM estimates (around 87%) was foundfor cluster 1, whatever the optimization routine used. Con-cerning the SFM estimates from cluster 1, the scatterer radiusand the volume fraction obtained using fminsearch are slightlyhigher than those obtained using fmincon, but the relativeimpedance contrast estimates are very different using fmin-search and fmincon. Table IV also lists the QUS parametersa∗, φ∗, γ ∗
z , and n∗z , and UIB estimated with the SFM from
cluster 1 (using fmincon) for each mouse tumor in the viableHT29 cell areas.
For the ROIs where the SFM estimates were found incluster 1 with fmincon, the QUS parameters from the SGMand the FSM are estimated. The scatterer radius a∗ and theacoustic concentration n∗
z for the SFM, the SGM, and the FSMare presented in Fig. 9. Also given in Fig. 9 (dashed lines) are

MULEKI-SEYA et al.: HIGH-FREQUENCY QUS SPECTROSCOPY OF EXCISED CANINE LIVERS AND MOUSE TUMORS 1343
TABLE III
MEAN ESTIMATED VALUES OF a∗ , φ∗ , γ ∗z , AND n∗
z OBTAINED WITH THE SFM (USING BOTH fminsearch AND fmincon) FOR THE SIX TUMORS ON THE
VIABLE HT29 AREAS AND THE CORRESPONDING GOODNESS-OF-FIT R2 . THE LAST COLUMN INDICATES THE PERCENTAGE OF QUS PROPERTYESTIMATES THAT WERE SEPARATED IN TWO CLUSTERS
Fig. 8. Quantitative images using the SFM for a homogeneous tumorsuperimposed on the gray-scale B-mode image.
the whole cell radius and the acoustic concentration deducedfrom the histological analysis in order to compare the QUSparameter estimates to the underlying tissue microstructures.The QUS parameters estimated with the sparse SGM and FSMare very different from the concentrated SFM. The comparisonbetween the goodness-of-fit statistics for the three modelsgiven in Fig. 9 shows that the concentrated SFM had the bestfit to the experimental data (R2 ≈ 0.93) followed by the sparseSGM (R2 ≈ 0.86).
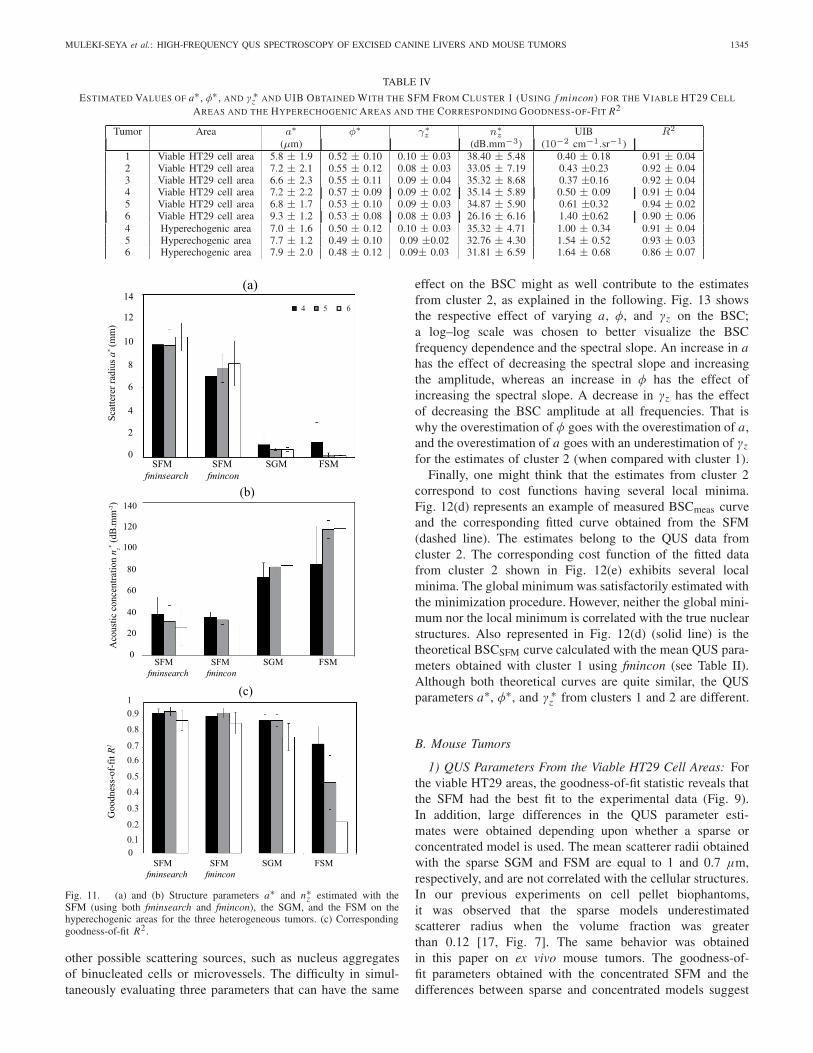
5) QUS Parameters From the Hyperechogenic Areas:An example of QUS parameter images obtained with theSFM is given in Fig. 10 for a heterogeneous tumor composedof a hyperechogenic area (due to the presence of somenecrotic areas) and a less echogenic area (mainly containingviable HT29 cells). Fig. 10 reveals that the scatterer radiiestimated with the SFM were quite similar in both theareas, but the acoustic concentrations were slightly higherin the less echogenic area when compared with the hyper-echogenic area. The UIB is higher in the hyperechogenic area
(>1.1 × 10⁻² cm−1 · sr−1) than in the viable HT29 cell area(<0.8 × 10⁻² cm−1 · sr−1).
The QUS parameters estimated with the SFM from cluster 1(using fmincon) are given in Table IV for each mouse. Forthe ROIs where the SFM estimates were found in cluster 1with fmincon, the QUS parameters from the SGM and theFSM are estimated. The scatterer radius a∗ and the acousticconcentration n∗
z estimated by the SFM, the SGM, and theFSM are presented in Fig. 11. The goodness-of-fit statisticreveals that the concentrated SFM gave satisfactory fittingcurves (R2 ≈ 0.90) followed by the sparse SGM (R2 ≈ 0.84).
IV. DISCUSSION
A. Canine Livers
1) Comparison Between Sparse and Concentrated Models:The scatterer radius a∗ and the acoustic concentration n∗
zobtained from the FSM, SGM, and SFM are quasi-identical,as shown in Fig. 5. This had been observed on diluted cellpellet biophantom experiments for cell volume fractions lessthan 0.06 [17, Fig. 7]. Indeed, when the medium is diluted, thestructure factor is close to the unity value, and the concentratedSFM is equivalent to the sparse FSM modeling. In addition,the goodness-of-fit statistic reveals that all the models fit wellthe measured data. Thus, the similarities of the QUS estimatesand of the goodness-of-fit statistics obtained with the sparseand concentrated models suggest that the liver is a dilutedmedium (with low scatterer volume fraction).
Moreover, the sparse models (the SGM and the FSM) andthe SFM from cluster 1 give a mean scatterer radius around5.3 μm that closely matches the true radius of hepathocytenuclei with a difference around 8%. The mean acoustic con-centration (around 26 dB · mm−3) estimated with the threemodels agrees well with the nuclear acoustic concentrationof 25 dB · mm−3 deduced from histological analysis. Thesefindings also corroborate our suggestion that the liver is adiluted medium. Indeed, if the nuclei (and not the wholecells) are the cellular structures responsible for scattering,the corresponding scatterer volume fraction is expected tobe approximately 0.02 (see Table I). To conclude, the QUSparameter estimates from the three scattering models suggestthat the nucleus is the dominant source of scattering in theliver in this frequency range. This conclusion was previouslysuggested in a numerical study based on 3-D impedance mapsof rabbit liver [32].
2) Simultaneous Estimation of the Volume Fraction andRelative Impedance Contrast Using the SFM: One of the

1344 IEEE TRANSACTIONS ON ULTRASONICS, FERROELECTRICS, AND FREQUENCY CONTROL, VOL. 63, NO. 9, SEPTEMBER 2016
Fig. 9. (a) and (b) Structure parameters a∗ and n∗z estimated with the SFM
(using both fminsearch and fmincon), the SGM, and the FSM on the viableHT29 cell areas for the six tumors. Only the SFM results found in cluster 1are given. Dashed lines: whole cell radius and acoustic concentration deducedfrom histological analysis. (c) Corresponding goodness-of-fit R2.
characteristics of the SFM is its ability to provide the volumefraction and the relative impedance contrast (whereas thesparse models SGM and FSM provide only the acoustic con-centration). The frequency-dependent BSC behavior dependson the product σb(k, a)S(k, a, φ), whereas it only depends onσb(k, a) when using the sparse models (the SGM or the FSM).This ability was studied here on the canine liver data, as shownin Table II.
For the SFM estimates from cluster 1, bothoptimization routines gave similar scatterer radii and
Fig. 10. Quantitative images using the SFM for a heterogeneous tumorsuperimposed on the gray-scale B-mode image.
acoustic concentrations. Moreover, the mean scatterer radiusagrees well with the true nuclear radius of hepathocyte.However, the volume fraction and the impedance contrastare very different depending upon the optimization routine.When using fminsearch, the mean volume fraction was sixtimes smaller than the nuclear volume fraction estimatedfrom histology, and the impedance contrast was higher,around 0.34. Note that we empirically found that fminsearchprovides the global minimum, as observed by plotting somecost function surfaces. An example is given in Fig. 12.As expected, several couples (φ and γz) gave the sameBSC behavior and quasi-identical cost function values, asshown in Fig. 12(a) and (c). When using fmincon, excellentagreements were obtained between the nuclear structures(radius and volume fraction) estimated by ultrasound andby histology. The mean volume fraction was found equal to0.024 and agrees well with the nuclear volume fraction ofapproximately 0.02 estimated from histological analysis. Themean impedance contrast was found equal to 0.12 and seemsto be in a reasonable range of values [16], [31].
The SFM estimates from cluster 2 are quasi-identicalwhatever the optimization routine tested (i.e., fminsearch orfmincon). The mean scatterer radius estimate was comprisedbetween 7.4 and 7.8 μm, which is slightly larger than theactual nuclear radii of ∼5.7 μm. The mean volume frac-tion estimate was six times larger than the nuclei volumefraction and three times smaller than the whole cell volumefraction. Thus, the estimates from cluster 2 did not matchany microstructural characteristics observed from histologicalimages. There could be several meanings for the estimatesfrom cluster 2. They could be attributed to the presence of
MULEKI-SEYA et al.: HIGH-FREQUENCY QUS SPECTROSCOPY OF EXCISED CANINE LIVERS AND MOUSE TUMORS 1345
TABLE IV
ESTIMATED VALUES OF a∗ , φ∗ , AND γ ∗z AND UIB OBTAINED WITH THE SFM FROM CLUSTER 1 (USING f mincon) FOR THE VIABLE HT29 CELL
AREAS AND THE HYPERECHOGENIC AREAS AND THE CORRESPONDING GOODNESS-OF-FIT R2
Fig. 11. (a) and (b) Structure parameters a∗ and n∗z estimated with the
SFM (using both fminsearch and fmincon), the SGM, and the FSM on thehyperechogenic areas for the three heterogeneous tumors. (c) Correspondinggoodness-of-fit R2.
other possible scattering sources, such as nucleus aggregatesof binucleated cells or microvessels. The difficulty in simul-taneously evaluating three parameters that can have the same
effect on the BSC might as well contribute to the estimatesfrom cluster 2, as explained in the following. Fig. 13 showsthe respective effect of varying a, φ, and γz on the BSC;a log–log scale was chosen to better visualize the BSCfrequency dependence and the spectral slope. An increase in ahas the effect of decreasing the spectral slope and increasingthe amplitude, whereas an increase in φ has the effect ofincreasing the spectral slope. A decrease in γz has the effectof decreasing the BSC amplitude at all frequencies. That iswhy the overestimation of φ goes with the overestimation of a,and the overestimation of a goes with an underestimation of γz
for the estimates of cluster 2 (when compared with cluster 1).Finally, one might think that the estimates from cluster 2
correspond to cost functions having several local minima.Fig. 12(d) represents an example of measured BSCmeas curveand the corresponding fitted curve obtained from the SFM(dashed line). The estimates belong to the QUS data fromcluster 2. The corresponding cost function of the fitted datafrom cluster 2 shown in Fig. 12(e) exhibits several localminima. The global minimum was satisfactorily estimated withthe minimization procedure. However, neither the global mini-mum nor the local minimum is correlated with the true nuclearstructures. Also represented in Fig. 12(d) (solid line) is thetheoretical BSCSFM curve calculated with the mean QUS para-meters obtained with cluster 1 using fmincon (see Table II).Although both theoretical curves are quite similar, the QUSparameters a∗, φ∗, and γ ∗
z from clusters 1 and 2 are different.
B. Mouse Tumors
1) QUS Parameters From the Viable HT29 Cell Areas: Forthe viable HT29 areas, the goodness-of-fit statistic reveals thatthe SFM had the best fit to the experimental data (Fig. 9).In addition, large differences in the QUS parameter esti-mates were obtained depending upon whether a sparse orconcentrated model is used. The mean scatterer radii obtainedwith the sparse SGM and FSM are equal to 1 and 0.7 μm,respectively, and are not correlated with the cellular structures.In our previous experiments on cell pellet biophantoms,it was observed that the sparse models underestimatedscatterer radius when the volume fraction was greaterthan 0.12 [17, Fig. 7]. The same behavior was obtainedin this paper on ex vivo mouse tumors. The goodness-of-fit parameters obtained with the concentrated SFM and thedifferences between sparse and concentrated models suggest

1346 IEEE TRANSACTIONS ON ULTRASONICS, FERROELECTRICS, AND FREQUENCY CONTROL, VOL. 63, NO. 9, SEPTEMBER 2016
Fig. 12. (a) Example of measured BSC and corresponding fitted curve obtained with the SFM using both fminsearch and fmincon. (b) Logarithm of thecost function F(a, φ) for a fixed value of γ ∗
z = 0.15 for the SFM. The logarithm is shown here in order to increase the visual contrast. (c) Cost functionF(a∗, φ∗, γz) with the SFM for varying values of γz (a∗ and φ∗ being calculated for each fixed value of γz ). (d) Example of measured BSC for cluster 2and corresponding fitted curve obtained with the SFM (dashed line). Also represented in solid line is the theoretical BSCSFM curve calculated with the meanQUS parameters of the SFM for cluster 1. (e) Similar to (b) for γ ∗
z = 0.033. (f) Similar to (c).
Fig. 13. Effect of increasing a and φ and of decreasing γz on the BSC,when using the SFM.
that the viable HT29 areas could be considered as concentratedmedia with densely packed cells.
The SFM estimates from cluster 1 represent the majority(around 86%) of the estimates. The mean scatterer radius esti-mated with the SFM was found equal to 7.1 μm using fminconand 8.9 μm using fminsearch, which is slightly larger than thewhole HT29 cell radius, with relative errors of 7% and 32%,respectively. The scatterer volume fraction matches quite wellthe whole cell volume fraction deduced from histological
analysis, with relative errors less than 15%, whatever theoptimization routine tested. Using fminsearch, the impedancecontrast is overestimated, when compared with the cellularimpedance contrast values comprised between 0.05 and 0.11found in the literature [16], [31]. Overall, excellent agreementswere obtained between the cellular structures estimated byultrasound and the whole cellular structures deduced fromhistological observations using the SFM with fmincon. Thescatterer radius and the volume fraction estimated with theSFM using fminsearch are also quite satisfactory. This findingsuggests that the whole HT29 cell is the dominant scatteringsource in the HT29 mouse tumors.
For both fminsearch and fmincon routines, the SFM esti-mates from cluster 2 gave a mean scatterer radius comprisedbetween 3.6 and 4.2 μm, which is slightly smaller than theHT29 nuclear radius. However, the mean scatterer volumefraction was ∼0.10, which does not match the HT29 nuclearvolume fraction with a relative error of 58%. So the estimatesfrom cluster 2 did not represent the actual microstructuralparameters of viable HT29 cells, whatever the optimizationroutine tested.
2) B-Mode Images and QUS Parameters From the Hypere-chogenic Areas: The ratios between the necrotic and wholetumor areas obtained from the B-mode images (0.34) andfrom the histological images (0.13) were very different. Thisdiscrepancy could be due to small necrotic areas close to eachother. If the distance between necrotic areas is smaller than thelateral resolution of the RMV703 probe (equal to 110 μm),
MULEKI-SEYA et al.: HIGH-FREQUENCY QUS SPECTROSCOPY OF EXCISED CANINE LIVERS AND MOUSE TUMORS 1347
these areas cannot be discriminated on the B-mode images.In addition, the spaces between necrotic areas could containHT29 cells undergoing a cell death process that could alsocontribute to the increase in echogenicity [12]. To test thesehypotheses, we delimited a larger area that surrounds allthe small necrotic areas, as shown in Fig. 7(c). The newratio was found equal to 0.32 ± 0.05, which is close to thehyperechogenic area value found on the B-mode images. Thelarge hyperechogenic area found in the B-mode image may becomposed of a mix of HT29 cells (viable or undergoing a celldeath process) and NK lymphocytes. The difference betweenthe new ratio (0.32) and the initial estimated ratio (0.13) fromthe histological images suggests that both cell lines occupy anequivalent proportion in the large hyperechogenic area.
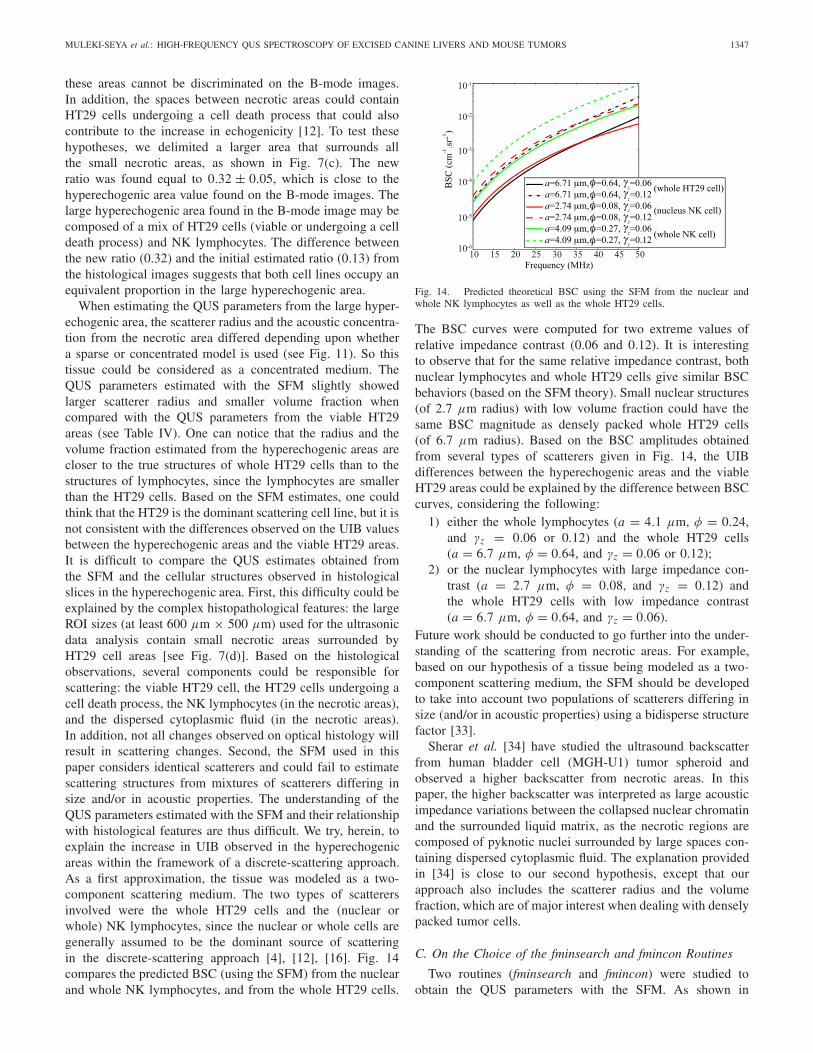
When estimating the QUS parameters from the large hyper-echogenic area, the scatterer radius and the acoustic concentra-tion from the necrotic area differed depending upon whethera sparse or concentrated model is used (see Fig. 11). So thistissue could be considered as a concentrated medium. TheQUS parameters estimated with the SFM slightly showedlarger scatterer radius and smaller volume fraction whencompared with the QUS parameters from the viable HT29areas (see Table IV). One can notice that the radius and thevolume fraction estimated from the hyperechogenic areas arecloser to the true structures of whole HT29 cells than to thestructures of lymphocytes, since the lymphocytes are smallerthan the HT29 cells. Based on the SFM estimates, one couldthink that the HT29 is the dominant scattering cell line, but it isnot consistent with the differences observed on the UIB valuesbetween the hyperechogenic areas and the viable HT29 areas.It is difficult to compare the QUS estimates obtained fromthe SFM and the cellular structures observed in histologicalslices in the hyperechogenic area. First, this difficulty could beexplained by the complex histopathological features: the largeROI sizes (at least 600 μm × 500 μm) used for the ultrasonicdata analysis contain small necrotic areas surrounded byHT29 cell areas [see Fig. 7(d)]. Based on the histologicalobservations, several components could be responsible forscattering: the viable HT29 cell, the HT29 cells undergoing acell death process, the NK lymphocytes (in the necrotic areas),and the dispersed cytoplasmic fluid (in the necrotic areas).In addition, not all changes observed on optical histology willresult in scattering changes. Second, the SFM used in thispaper considers identical scatterers and could fail to estimatescattering structures from mixtures of scatterers differing insize and/or in acoustic properties. The understanding of theQUS parameters estimated with the SFM and their relationshipwith histological features are thus difficult. We try, herein, toexplain the increase in UIB observed in the hyperechogenicareas within the framework of a discrete-scattering approach.As a first approximation, the tissue was modeled as a two-component scattering medium. The two types of scatterersinvolved were the whole HT29 cells and the (nuclear orwhole) NK lymphocytes, since the nuclear or whole cells aregenerally assumed to be the dominant source of scatteringin the discrete-scattering approach [4], [12], [16]. Fig. 14compares the predicted BSC (using the SFM) from the nuclearand whole NK lymphocytes, and from the whole HT29 cells.
Fig. 14. Predicted theoretical BSC using the SFM from the nuclear andwhole NK lymphocytes as well as the whole HT29 cells.
The BSC curves were computed for two extreme values ofrelative impedance contrast (0.06 and 0.12). It is interestingto observe that for the same relative impedance contrast, bothnuclear lymphocytes and whole HT29 cells give similar BSCbehaviors (based on the SFM theory). Small nuclear structures(of 2.7 μm radius) with low volume fraction could have thesame BSC magnitude as densely packed whole HT29 cells(of 6.7 μm radius). Based on the BSC amplitudes obtainedfrom several types of scatterers given in Fig. 14, the UIBdifferences between the hyperechogenic areas and the viableHT29 areas could be explained by the difference between BSCcurves, considering the following:
1) either the whole lymphocytes (a = 4.1 μm, φ = 0.24,and γz = 0.06 or 0.12) and the whole HT29 cells(a = 6.7 μm, φ = 0.64, and γz = 0.06 or 0.12);
2) or the nuclear lymphocytes with large impedance con-trast (a = 2.7 μm, φ = 0.08, and γz = 0.12) andthe whole HT29 cells with low impedance contrast(a = 6.7 μm, φ = 0.64, and γz = 0.06).
Future work should be conducted to go further into the under-standing of the scattering from necrotic areas. For example,based on our hypothesis of a tissue being modeled as a two-component scattering medium, the SFM should be developedto take into account two populations of scatterers differing insize (and/or in acoustic properties) using a bidisperse structurefactor [33].
Sherar et al. [34] have studied the ultrasound backscatterfrom human bladder cell (MGH-U1) tumor spheroid andobserved a higher backscatter from necrotic areas. In thispaper, the higher backscatter was interpreted as large acousticimpedance variations between the collapsed nuclear chromatinand the surrounded liquid matrix, as the necrotic regions arecomposed of pyknotic nuclei surrounded by large spaces con-taining dispersed cytoplasmic fluid. The explanation providedin [34] is close to our second hypothesis, except that ourapproach also includes the scatterer radius and the volumefraction, which are of major interest when dealing with denselypacked tumor cells.
C. On the Choice of the fminsearch and fmincon Routines
Two routines (fminsearch and fmincon) were studied toobtain the QUS parameters with the SFM. As shown in

1348 IEEE TRANSACTIONS ON ULTRASONICS, FERROELECTRICS, AND FREQUENCY CONTROL, VOL. 63, NO. 9, SEPTEMBER 2016
Figs. 5, 9, and 11, both routines gave similar R2 values, what-ever the tissue studied. The scatterer radius and the acousticconcentration estimated with both the routines were alsowithin the same range of values for each cluster, respectively(see also Tables II and III). However, the volume fractionand the relative impedance contrast differ depending onthe routine used. Investigators interested in using the SFMfor clinical studies have to decide which routine to use.On one side, the fminsearch routine empirically provided theglobal minimum (as observed by plotting the cost functionsurfaces—Fig. 6), but could result in unrealistic values withthe underestimation of the volume fraction (φ = 0.0032 for theliver—Table II) or the overestimation of the impedance con-trast (γz = 0.43 ± 0.88 for the mouse tumors—Table III).On the other side, a major constraint when using the fminconroutine was put on the relative impedance contrast comprisedbetween 0 and 0.2, but the QUS parameters estimated fromcluster 1 matched quite well the cellular structures obtainedfrom histology (note that the other conditions 0 ≤ a ≤ 100 μmand 0 ≤ φ ≤ 1 did not greatly constrain the minimizationroutine). Therefore, both the routines could be used to deter-mine the scatterer radius and the acoustic concentration, butthe fmincon routine should probably be preferred to estimatethe QUS parameters (a∗, φ∗, and γ ∗
z ). For in vivo clinicalapplications, the estimates from cluster 2 could bias theQUS parameters but this paper shows that these estimatesrepresent only 35% and 14% for the liver and the mousetumor, respectively. As previously discussed in Section IV-A2,there are several meanings for the estimates from cluster 2: thepresence of other possible scattering sources (microvessels orcell aggregates, and so on) or the difficulty to simultaneouslyestimate three parameters.
D. On the Use of the Structure Factor Model
The comparison of the goodness-of-fit statistics between thesparse and the concentrated models shows the superiority ofthe concentrated SFM to explain the measured BSC in denselypacked media. The values of R2 obtained with the SFM arearound 0.89 for the livers, 0.93 for the viable HT29 areas,and 0.90 for the hyperechogenic areas. It is interesting toobserve that the sparse and concentrated models gave similarR2 statistics and identical QUS parameters (scatterer radiusand acoustic concentrations) for the canine liver experiments.Since both sparse and concentrated models explained themeasured BSC very well, this tissue could be considered as adiluted medium. On the contrary, the sparse and concentratedmodels yield different R2 statistics and QUS parameters forthe homogeneous mouse tumors, and the SFM provides thebest fit to the data. This suggests that the SFM is the mostadequate to estimate the QUS parameters for cellular structuresand that the HT29 mouse tumors could be considered as aconcentrated medium.
For the canine liver, the SFM estimates matched well thenuclear structures obtained from histological analysis (withrelative errors less than 7% on the scatterer radius and volumefraction). This is corroborated by the similar QUS parametersestimated with the three scattering models meaning that the
medium may be diluted. These results demonstrate that thenucleus could be a dominant source of scattering in the liver.For the viable HT29 cell areas, scatterer radius and volumefraction estimated with the SFM showed good agreement(with relative errors less than 15%) with the HT29 cellularstructure obtained from histological analysis, whereas thesparse models (the SGM and the FSM) gave no consistentQUS parameters. This suggests that the viable HT29 cellareas have densely packed cellular content and that the wholeHT29 cell is responsible for the scattering. Concerning thehyperechogenic areas (containing several small necrotic areaswith NK lymphocytes surrounded by HT29 cell areas), QUSparameter estimates with the SFM were difficult to interpretbecause of the presence of two cell types (HT29 cells and NKlymphocytes). However, as the sparse models provide smallerscatterer radius values and higher acoustic concentration val-ues as for HT29 viable cells areas, these hyperechogenicareas could be considered as a dense medium. Future studiesshould focus on the understanding of the necrotic process byconducting controlled experiments on cell pellet biophantomsand on the improvement of the SFM to take into account thetumor heterogeneity of the cell types.
High ultrasonic frequencies are required to estimatemicrostructural parameters at the level of the nuclei or cells.It is well known that the most accurate measurements areobtained in the range of 0.5 < ka ≤ 1.2 (with ka the productof the wavenumber and the scatterer radius) [35]. In this range,the size of the scatterer is the principal factor determiningthe frequency dependence of the BSC when using the sparsemodels. At the center frequency of 25 MHz in livers (or atthe center frequency of 30 MHz in mouse tumors), QUSis thus most sensitive to scatterer radius comprised between4.8 and 11.5 μm (or between 4 and 9.5 μm, respectively).Insana and Hall [35] have reported that for ka < 0.5 (theRayleigh scattering regime), the noise of the spectral estimateis much greater that the changes due to the scatterer structure,and measurement sensitivity is lost. In this paper, the scattererradius estimates less than 4.8 μm in livers or less than 4 μmin mouse tumors (corresponding to ka < 0.5) are likelyerroneous. It is important to notice that when using the SFMfor examining densely packed media, both scatterer radiusand volume fraction could strongly modify the frequencydependence of the BSC [that depends on the fluid sphereform factor FF(k, a) and the structure factor S(k, a, φ)].Franceschini et al. [17] recently demonstrated the SFM supe-riority over sparse scattering models (such as the SGM orthe FSM) to estimate the radius and acoustic concentrationfor a product ka around 0.7, especially for concentrated mediawith volume fractions φ ≥ 0.12. Further studies are requiredto determine the accuracy of QUS parameters estimated usingthe SFM for wider ka range and for several scatterer sizedistributions and volume fractions.
V. CONCLUSION
In summary, for both canine livers and viable HT29 cellareas, the QUS parameters estimated with the SFM werefound to be well correlated with the true nuclear or cellularstructures, and the SFM (using fmincon) was able to provide

MULEKI-SEYA et al.: HIGH-FREQUENCY QUS SPECTROSCOPY OF EXCISED CANINE LIVERS AND MOUSE TUMORS 1349
quantitatively satisfactory estimates for the volume fractionand the relative contrast impedance (instead of only theacoustic concentration for the sparse models). This paperdemonstrated that the SFM is a more-appropriate model touse for modeling densely packed cellular content in HT29mouse tumors. The concentrated SFM provides better fit whencompared with classical models (the SGM and the FSM)valid for diluted media. The SFM model makes it possibleto estimate structure parameters close to cellular structures onthe homogeneous HT29 mouse tumors, which the classicalsparse models (the SGM and the FSM) are incapable of. TheSFM has been initially developed for characterizing red bloodcell aggregation in flowing blood [13], [36], and it has beenused in a 2-D numerical study to explain the contribution ofchanges in cellular size variance to the increases in the BSCduring a cell death process [21]. The method based on theSFM described here could be a promising tool for assessingdisease or monitoring the response to anticancer treatment.
REFERENCES
[1] F. L. Lizzi, M. Ostromogilsky, E. J. Feleppa, M. C. Rorke, andM. M. Yaremko, “Relationship of ultrasonic spectral parameters tofeatures of tissue microstructure,” IEEE Trans. Ultrason., Ferroelectr.,Freq. Control, vol. 34, no. 3, pp. 319–329, May 1986.
[2] M. F. Insana, R. F. Wagner, D. G. Brown, and T. J. Hall, “Describingsmall-scale structure in random media using pulse-echo ultrasound,”J. Acoust. Soc. Amer., vol. 87, no. 1, pp. 179–192, 1990.
[3] F. L. Lizzi, M. Greenebaum, E. J. Feleppa, M. Elbaum, andD. J. Coleman, “Theoretical framework for spectrum analysis in ultra-sonic tissue characterization,” J. Acoust. Soc. Amer., vol. 73, no. 4,pp. 1366–1373, 1983.
[4] M. L. Oelze and W. D. O’Brien, Jr., “Application of three scatteringmodels to characterization of solid tumors in mice,” Ultrason. Imag.,vol. 28, no. 2, pp. 83–96, 2006.
[5] E. J. Feleppa, F. L. Lizzi, D. J. Coleman, and M. M. Yaremko, “Diag-nostic spectrum analysis in ophthalmology: A physical perspective,”Ultrasound Med. Biol., vol. 12, no. 8, pp. 623–631, 1986.
[6] E. J. Feleppa et al., “Typing of prostate tissue by ultrasonic spectrumanalysis,” IEEE Trans. Ultrason., Ferroelectr., Freq. Control, vol. 43,no. 4, pp. 609–619, Jul. 1996.
[7] R. C. Waag, J. O. Nilsson, and J. P. Astheimer, “Characterizationof volume scattering power spectra in isotropic media from powerspectra of scattering by planes,” J. Acoust. Soc. Amer., vol. 74, no. 5,pp. 1555–1571, 1983.
[8] M. L. Oelze, W. D. O’Brien, Jr., J. P. Blue, Jr., and J. F. Zachary,“Differentiation and characterization of rat mammary fibroadenomas and4T1 mouse carcinomas using quantitative ultrasound imaging,” IEEETrans. Med. Imag., vol. 23, no. 6, pp. 764–771, Jun. 2004.
[9] A. Han, R. Abuhabsah, J. P. Blue, Jr., S. Sarwate, and W. D. O’Brien, Jr.,“Ultrasonic backscatter coefficient quantitative estimates from high-concentration Chinese hamster ovary cell pellet biophantoms,” J. Acoust.Soc. Amer., vol. 130, no. 6, pp. 4139–4147, 2011.
[10] J. McNew, R. Lavarello, and W. D. O’Brien, Jr., “Sound scattering fromtwo concentric fluid spheres (L),” J. Acoust. Soc. Amer., vol. 125, no. 1,pp. 1–4, 2009.
[11] A. Han and W. D. O’Brien, Jr., “Structure function for high-concentration biophantoms of polydisperse scatterer sizes,” IEEE Trans.Ultrason., Ferroelectr., Freq. Control, vol. 62, no. 2, pp. 303–318,Feb. 2015.
[12] R. M. Vlad, R. K. Saha, N. M. Alajez, S. Ranieri, G. J. Czarnota, andM. C. Kolios, “An increase in cellular size variance contributes to theincrease in ultrasound backscatter during cell death,” Ultrasound Med.Biol., vol. 36, no. 9, pp. 1546–1558, 2010.
[13] D. Savéry and G. Cloutier, “A point process approach to assess thefrequency dependence of ultrasound backscattering by aggregating redblood cells,” J. Acoust. Soc. Amer., vol. 110, no. 6, pp. 3252–3262, 2001.
[14] V. Twersky, “Low-frequency scattering by correlated distributions ofrandomly oriented particles,” J. Acoust. Soc. Amer., vol. 81, no. 5,pp. 1609–1618, 1987.
[15] E. Franceschini and R. Guillermin, “Experimental assessment offour ultrasound scattering models for characterizing concentratedtissue-mimicking phantoms,” J. Acoust. Soc. Amer., vol. 132, no. 6,pp. 3735–3747, 2012.
[16] E. Franceschini, R. Guillermin, F. Tourniaire, S. Roffino, E. Lamy, andJ.-F. Landrier, “Structure factor model for understanding the measuredbackscatter coefficients from concentrated cell pellet biophantoms,”J. Acoust. Soc. Amer., vol. 135, no. 6, pp. 3620–3631, 2014.
[17] E. Franceschini, R. de Monchy, and J. Mamou, “Quantitative character-ization of tissue microstructure in concentrated cell pellet biophantomsbased on the structure factor model,” IEEE Trans. Ultrason., Ferroelectr.,Freq. Control, to be published.
[18] R. Kuc and M. Schwartz, “Estimating the acoustic attenuation coefficientslope for liver from reflected ultrasound signals,” IEEE Trans. SonicsUltrason., vol. SU-26, no. 5, pp. 353–361, Sep. 1979.
[19] F. A. Duck, Physical Properties of Tissue: A Comprehensive ReferenceBook. London, U.K.: Academic, 1990, ch. 4, p. 95.
[20] S. Maruvada, K. K. Shung, and S.-H. Wang, “High-frequency backscat-ter and attenuation measurements of selected bovine tissues between10 and 30 MHz,” Ultrasound Med. Biol., vol. 26, no. 6, pp. 1043–1049,2000.
[21] R. M. Vlad, S. Brand, A. Giles, M. C. Kolios, and G. J. Czarnota,“Quantitative ultrasound characterization of responses to radiother-apy in cancer mouse models,” Clin. Cancer Res., vol. 15, no. 6,pp. 2067–2075, 2009.
[22] C. Fournier, S. L. Bridal, A. Coron, and P. Laugier, “Optimization ofattenuation estimation in reflection for in vivo human dermis character-ization at 20 MHz,” IEEE Trans. Ultrason., Ferroelectr., Freq. Control,vol. 50, no. 4, pp. 408–418, Apr. 2003.
[23] M. O’Donnell and J. G. Miller, “Quantitative broadband ultrasonicbackscatter: An approach to nondestructive evaluation in acousticallyinhomogeneous materials,” J. Appl. Phys., vol. 52, no. 2, pp. 1056–1065,1981.
[24] L. X. Yao, J. A. Zagzebski, and E. L. Madsen, “Backscatter coefficientmeasurements using a reference phantom to extract depth-dependentinstrumentation factors,” Ultrason. Imag., vol. 12, no. 1, pp. 58–70,1990.
[25] J. J. Faran, Jr., “Sound scattering by solid cylinders and spheres,”J. Acoust. Soc. Amer., vol. 23, no. 4, pp. 405–418, 1951.
[26] M. F. Insana and D. G. Brown, “Acoustic scattering theory applied tosoft biological tissues,” in Ultrasonic Scattering in Biological Tissues,K. K. Shung and G. A. Thieme, Eds. Boca Raton, FL, USA: CRC Press,1993, ch. 4, pp. 76–124.
[27] M. S. Wertheim, “Exact solution of the Percus–Yevick integral equationfor hard spheres,” Phys. Rev. Lett., vol. 10, no. 8, pp. 321–323,1963.
[28] C. Stockhaus, T. Van Den Ingh, J. Rothuizen, and E. Teske, “Amultistep approach in the cytologic evaluation of liver biopsy samplesof dogs with hepatic diseases,” Vet. Pathol., vol. 41, no. 5, pp. 461–470,2004.
[29] T. Abo, M. D. Cooper and C. M. Balch, “Characterization of HNK-1’(Leu-7) human lymphocytes 1. Two distinct phenotypes of human NKcells with different cytotoxic capability,” J. Immunol., vol. 129, no. 4,pp. 1752–1757, 1982.
[30] R. K. Saha and G. Cloutier, “Monte Carlo study on ultrasound backscat-tering by three-dimensional distributions of red blood cells,” Phys.Rev. E, vol. 78, no. 6, p. 061919, 2008.
[31] Y. W. Yuan and K. K. Shung, “Ultrasonic backscatter from flowingwhole blood. I: Dependence on shear rate and hematocrit,” J. Acoust.Soc. Amer., vol. 84, no. 1, pp. 52–58, 1998.
[32] A. D. Pawlicki, A. J. Dapore, S. Sarwate, and W. D. O’Brien, Jr.,“Three-dimensional impedance map analysis of rabbit liver,” J. Acoust.Soc. Amer., vol. 130, no. 5, pp. EL334–EL338, 2011.
[33] N. W. Ashcroft and D. C. Langreth, “Structure of binary liquid mix-tures. I,” Phys. Rev., vol. 156, no. 3, pp. 685–692, 1967.
[34] M. D. Sherar, M. B. Noss, and F. S. Foster, “Ultrasound backscattermicroscopy images the internal structure of living tumour spheroids,”Nature, vol. 330, no. 3, pp. 493–495, 1987.
[35] M. F. Insana and T. J. Hall, “Parametric ultrasound imaging frombackscatter coefficient measurements: Image formation and interpreta-tion,” Ultrason. Imag., vol. 12, no. 4, pp. 245–267, 1990.
[36] E. Franceschini, R. K. Saha, and G. Cloutier, “Comparison of threescattering models for ultrasound blood characterization,” IEEE Trans.Ultrason., Ferroelectr., Freq. Control, vol. 60, no. 11, pp. 2321–2334,Nov. 2013.

1350 IEEE TRANSACTIONS ON ULTRASONICS, FERROELECTRICS, AND FREQUENCY CONTROL, VOL. 63, NO. 9, SEPTEMBER 2016
Pauline Muleki-Seya received the M.S. degree inacoustics from the University of Le Mans, Le Mans,France, in 2011, and the Ph.D. degree in acousticsfrom the University of Lyon, Lyon, France, in 2014.
She was a Postdoctoral Fellow with the Labora-toire de Mécanique et d’Acoustique, Aix-MarseilleUniversity, Marseille, France, from 2015 to 2016,where she conducted research on quantitative ultra-sound techniques on soft tissues. Since 2016, shehas been a Postdoctoral Fellow with the BioacousticsResearch Laboratory, Department of Electrical and
Computer Engineering, University of Illinois at Urbana–Champaign, Cham-paign, IL, USA. Her current research interests include quantitative ultrasoundtechniques, ultrasound tissue characterization, and sonoporation.
Dr. Muleki-Seya is a member of the French Acoustical Society.
Régine Guillermin received the graduate degrees(eq. M.S.) from the Ecole Nationale Supérieure dePhysique de Marseille, Marseille, France, in 1996,and received the Ph.D. degree in physics fromAix-Marseille University, Marseille, in 2000.
She has been a Research Engineer with theLaboratoire de Mécanique et d’Acoustique,French National Center for Scientific Research,Aix-Marseille University, since 2001. Her workis focused on ultrasonic imaging and ultrasonicquantitative characterization for biomedical and
underwater applications.Dr. Guillermin is a member of the French Acoustical Society.
Julien Guglielmi received the graduate degree(eq. M.S.) in biological engineering from the ÉcolePratique des Hautes Études, Paris, France.
He has been an Engineer with the University ofNice Sophia Antipolis, Nice, France, since 2005,where he is currently with the Research Group ofT. Pourcher. His current research interests includeSPECT and ultrasound in vivo imaging.
Jiangang Chen was born in Zhangjiakou, China,in 1980. He received the B.S. degree in electricalengineering from Nanchang Hangkong University,Nanchang, China, in 2003, the M.Phil. degree inbiomedical engineering from Xi’an Jiaotong Univer-sity, Xi’an, China, in 2006, and the Ph.D. degreein mechanical engineering from The Hong KongPolytechnic University, Hong Kong, in 2010.
He was a Postdoctoral Fellow with the Ultra-sound and Elasticity Imaging Laboratory, ColumbiaUniversity, New York, NY, USA, in 2013. He is
currently a Senior Scientist with Philips Research China, Shanghai, China.
Thierry Pourcher received the Ph.D. degree inmolecular biology from the University of NiceSophia Antipolis, Nice, France, in 1989.
He has been a Researcher with the French AtomicEnergy Commission (CEA) since 1990, and theTeam Leader since 1998. He has been the Directorof a research laboratory that joins CEA and theUniversity of Nice Sophia Antipolis since 2004.His current research interests include iodide trans-porters, thyroid metabolism and cancer, and in vivoimaging, includes SPECT and ultrasound.
Elisa Konofagou (M’09) is currently a Professorof Biomedical Engineering and Radiology, and theDirector of the Ultrasound and Elasticity ImagingLaboratory with Columbia University, New York,NY, USA. She has coauthored over 140 publishedarticles in her research fields. Her main researchinterests are in the development of novel elastic-ity imaging techniques and therapeutic ultrasoundmethods and more notably, myocardial elastogra-phy, electromechanical and pulse wave imaging,harmonic motion imaging, and focused ultrasound
therapy and drug delivery in the brain, with several clinical collaborationswith the Columbia Presbyterian Medical Center, New York, and elsewhere.
Dr. Konofagou is a fellow of the American Institute for Medical andBiological Engineering, and a member of the IEEE Engineering in Medicineand Biology Society, the IEEE Ultrasonics, Ferroelectrics, and FrequencyControl Society, the Acoustical Society of America, and the American Instituteof Ultrasound in Medicine. She has served as a Technical Committee Memberof the Acoustical Society of America, the International Society of TherapeuticUltrasound, the IEEE Engineering in Medicine and Biology Conference, theIEEE International Ultrasonics Symposium, and the American Associationof Physicists in Medicine, and a Technical Standards Committee and Boardof Governors Member of the American Institute of Ultrasound in Medicine.She serves as an Associate Editor of the Medical Physics Journal, Ultra-sonic Imaging, and the IEEE TRANSACTIONS ON ULTRASONICS, FERRO-ELECTRICS, AND FREQUENCY CONTROL. She is a recipient of awards fromthe American Heart Association, the Acoustical Society of America, the Amer-ican Institute of Ultrasound in Medicine, the Wallace H. Coulter Foundation,the National Institutes of Health, the National Science Foundation, the Societyof Photo-Optical Instrumentation Engineers, and the Radiological Society ofNorth America.
Emilie Franceschini (M’09) received theM.S. degree in acoustics from Aix-MarseilleUniversity, Marseille, France, in 2003, and thePh.D. degree in acoustics from the University ofProvence, Marseille, in 2006.
She was a Postdoctoral Fellow with the Laboratoryof Biorheology and Medical Ultrasonics, ResearchCenter, University of Montreal Hospital, Montreal,QC, Canada, in 2007, where she conducted researchon ultrasonic blood characterization. Since 2008,she has been a Researcher with the Laboratoire de
Mécanique et d’Acoustique, French National Center for Scientific Research,Aix-Marseille University. Her current research interests include ultrasoundtissue characterization, ultrasound tomography, quantitative ultrasoundtechniques, and inverse problems.
Dr. Franceschini is a member of the French Acoustical Society and theIEEE Ultrasonics, Ferroelectrics, and Frequency Control Society.