ieee transactions on visualization and computer …ieee transactions on visualization and computer...
TRANSCRIPT

IEEE TRANSACTIONS ON VISUALIZATION AND COMPUTER GRAPHICS, VOL. X, NO. X, JANUARY XXXX 1
Felix: A Topology based Framework for VisualExploration of Cosmic Filaments
Nithin Shivashankar, Student Member, IEEE , Pratyush Pranav, Vijay Natarajan, Member, IEEE ,Rien van de Weygaert, E G Patrick Bos, and Steven Rieder.
Abstract—The large-scale structure of the universe is comprised of virialized blob-like clusters, linear filaments, sheet-like walls andhuge near empty three-dimensional voids. Characterizing the large scale universe is essential to our understanding of the formationand evolution of galaxies. The density range of clusters, walls and voids are relatively well separated, when compared to filaments,which span a relatively larger range. The large scale filamentary network thus forms an intricate part of the cosmic web.In this paper, we describe Felix, a topology based framework for visual exploration of filaments in the cosmic web. The filamentarystructure is represented by the ascending manifold geometry of the 2-saddles in the Morse-Smale complex of the density field. Wegenerate a hierarchy of Morse-Smale complexes and query for filaments based on the density ranges at the end points of the filaments.The query is processed efficiently over the entire hierarchical Morse-Smale complex, allowing for interactive visualization.We apply Felix to computer simulations based on the heuristic Voronoi kinematic model and the standard ΛCDM cosmology, anddemonstrate its usefulness through two case studies. First, we extract cosmic filaments within and across cluster like regions in Voronoikinematic simulation datasets. We demonstrate that we produce similar results to existing structure finders. Second, we extract differentclasses of filaments based on their density characteristics from the ΛCDM simulation datasets. Filaments that form the spine of thecosmic web, which exist in high density regions in the current epoch, are isolated using Felix. Also, filaments present in void-like regionsare isolated and visualized. These filamentary structures are often over shadowed by higher density range filaments and are not easilycharacterizable and extractable using other filament extraction methodologies.
Index Terms—Morse-Smale complexes, tessellations, cosmology theory, cosmic web, large-scale structure of the universe.
F
1 INTRODUCTION
A T scales from a megaparsec to a few hundred mega-parsecs1, the universe has a web-like appearance. In
the cosmic web [1], [2], galaxies, intergalactic gas, and darkmatter have aggregated in an intricate wispy spatial pat-tern marked by dense compact clusters, elongated filamentsand sheetlike walls, and large near-empty void regions. Thefilaments, stretching out as giant tentacles from the densecluster nodes, serve as transport channels along which massflows towards the clusters. They surround the flattened walls,which are tenuous, membrane-like features in the cosmic massdistribution.
All structures and objects in the universe emerged outof primordial fluctuations that were generated during the
• N. Shivashankar is with the Department of Computer Science andAutomation, Indian Institute of Science, Bangalore, India, 560038.Email: [email protected]
• P. Pranav is with Kapteyn Astronomical Institute, University of Groningen,Netherlands. Email: [email protected]
• V. Natarajan is with the Department of Computer Science and Automationand Supercomputer Education and Research Centre, Indian Institute ofScience, Bangalore, India, 560038. Email: [email protected]
• R. van de Weygaert is with Kapteyn Astronomical Institute, University ofGroningen, Netherlands. Email: [email protected]
• E G P Bos is with Kapteyn Astronomical Institute, University of Groningen,Netherlands. Email: [email protected]
• S. Rieder is with RIKEN Advanced Institute for Computational Science,Japan. Email: [email protected]
1. A parsec is the standard unit of measurement of distances in the cosmos.A parsec is 3.26 times the light-year, the distance light covers in a year. Amegaparsec is a million parsecs, the typical scale of measurement of size ofthe large scale structures in the universe.
inflationary era, moments after its birth, as the universeunderwent a rapid phase of expansion [3], [4], [5]. Thequantum fluctuations generated during this phase manifestthemselves as fluctuations in the temperature of the cosmicmicrowave background [6], [7], [8]. The gravitational growthof these density and velocity perturbations has resulted in thewealth of structure that we see in the Universe. The web-like patterns mark the transition phase from the primordialGaussian random field to highly nonlinear structures that havefully collapsed into halos and galaxies. As our insight into thecomplex structural pattern of the cosmic web has increasedrapidly over the past years, it has become clear that thecosmic-web contains a wealth of information on a range ofcosmological and astronomical aspects and processes.
An important illustration of the cosmological significance ofthe cosmic web concerns its dependence on the nature of darkenergy and matter, the dominant but as yet unidentified formsof energy and matter in the Universe. One telling example ofthis is the recent realization that cosmic voids are sensitive anduseful probes of the nature of dark energy and dark matter andtesting grounds for modified gravity theories [9], [10], [11],[12], [13], [14], [15], [16]. As the cosmic web is first andforemost defined and shaped by the gravitationally dominantdark matter, it would be of considerable importance to beable to obtain detailed maps of dark matter distribution. Inrecent years, great strides have been made towards this goalas gravitational lensing of distant galaxies and objects by thedark matter have enabled an increasingly accurate view ofits spatial distribution [17], [18]. Initial efforts concentratedon the detection and mapping of the deep potential wells
arX
iv:1
508.
0073
7v1
[as
tro-
ph.C
O]
4 A
ug 2
015
IEEE TRANSACTIONS ON VISUALIZATION AND COMPUTER GRAPHICS, VOL. X, NO. X, JANUARY XXXX 2
of the nodes in the cosmic web, i.e., of galaxy clusters.Recent results have opened the path towards the mappingof filaments via their lensing effect on background sources[19]. The identification of the structural components of thecosmic web is also important for our understanding of therelation between the formation, evolution, and properties ofgalaxies and the structural environment of the cosmic web. Adirect manifestation of this is the generation of the angularmomentum of galaxies. This is a product of the torqueing bythe large-scale tidal force field [20], [21], [22]. While theseforce fields are also the agents for the formation and shapingof filaments, we would expect that this results in the alignmentof the spin axis of galaxies with respect to cosmic filaments[23], [24], [25].
The identification, description, and characterization of theelements of the cosmic web is a non-trivial problem. Severalcharacteristics of the mass distribution in the cosmic web havemade it an extremely challenging task to devise an appropriaterecipe for identifying them:
a) The cosmic web is a complex spatial pattern of connectedstructures displaying a rich geometry with multiple morpholo-gies and shapes.
b) There are no well-defined structural objects at a singlespatial scale or within a specific density range. Instead, ele-ments of cosmic web are found at a wide range of densitiesand spatial scales. This is a consequence of the hierarchicalevolution of structure formation in the universe, such thatsmaller high-density structures merge to form larger objects.
c) There is a clear anisotropy in the structures of thecosmic web, a consequence of gravitational instability. Thestructures in the cosmic web exhibit elongated and flattenedcharacteristics.
The attempts to analyze the structure of the cosmic webhave a long history. The absence of an objective and quan-titatively accurate procedure for identifying and isolating thecomponents of the cosmic web has been a major obstacle indescribing it. In recent years, more elaborate and advancedtechniques have been developed to analyze and describe thestructural patterns in the cosmic web. Nonetheless, a consensuson the proper definition of filaments is yet to be achieved. Inthe subsequent subsection 1.1 we present a short account ofthe available techniques and the definitions on which they arebased.
1.1 Related Work
Statistical measures such as the auto-correlation function [26]of the matter distribution in the web have been the mainstay ofcosmological studies over many decades. However, while thissecond-order measure of clustering does not contain any phaseinformation (one may e.g. always reproduce a distribution withthe same 2nd order moments and random Fourier phases), theauto-correlation function is not sensitive to the existence ofcomplex spatial patterns. Higher order correlation functionsonly contain a very limited amount of such structural informa-tion, while in practical observational circumstances, it quicklybecomes cumbersome to measure them as the magnitude ofthe error increases drastically with increasing order.
The first attempts towards characterizing complex geometricpatterns in the galaxy distribution mainly involved heuristicmeasures. Early examples of techniques addressing the globalconnectivity of structure in the Universe are percolation anal-ysis [27] and the minimum spanning tree of the spatial galaxydistribution [28], [29]. While these are useful global descrip-tions, they do not capture and describe local characteristics ofthe mass distribution.
More elaborate and advanced techniques have been devel-oped in recent years. Several of these methods apply sophis-ticated mathematical and visualization techniques, involvinggeometric and topological properties of the cosmic massdistribution. There are a multitude of different methods fordetecting filaments, based on a range of different techniques.We may recognize several categories of techniques.
One class of methods seeks to describe the local geometryon the basis of the Hessian of the density field [30], [31], [32],[33] or closely related quantities such as the tidal force field[34], [35] or the velocity shear field [36], [33]. The Hessianprovides direct information on the local shape and dynamicalimpact of the corresponding field. The morphological elementsof the cosmic web are identified by connecting the areas withinwhich a specific range of anisotropies is registered.
These studies concentrate on a single scale by appropri-ately smoothing the field, and do not consider the multi-scale nature of the cosmic mass distribution. The Hessianbased Nexus/MMF technique [31], which was perfected intoa versatile and parameter-free method [33], implicitly takesinto account the multi-scale nature of the web-related fields.It accomplishes this by a scale-space analysis of the fields.At each location the optimal morphological signal is extractedvia the application of a sophisticated filter bank applied tothe Hessian of the corresponding fields in scale space. Theapplication of this machinery has enabled thorough studies ofthe hierarchical evolution and buildup of the cosmic web [37].
A promising and highly interesting recent development hasopened up the path towards dynamical analysis of the evolvingmass distribution in full six-dimensional phase-space (in whichthe position of each mass element is specified by its spacecoordinates and velocity/momentum). In the 6D phase space,the cosmic mass distributions defines a 3D sheet. Indepen-dently, three groups arrived at tessellation based formalismsthat exploit the evolving structure and folding of the phasespace sheet in phase space [38], [39], [40] (also see e.g.[41]). The number of folds of the phase space sheet at agiven location indicates the number of local velocity streams,and forms a direct indication of the morphology of the localstructure. Interestingly, the resulting characterization of theweb-like distribution, the Origami formalism of Neyrinck [40]for example, appears to resemble that of the Nexus/MMFformalism [37].
An entirely different class of techniques, based on statisticalmethods, have also been used to recover the filamentarypatterns in the Universe. The key idea behind these techniquesis to treat the galaxy distribution as a Markov point process.Within this class, particularly worth mentioning is the Bisousor the Candy model, which has been used by Stoica et al. [42]

IEEE TRANSACTIONS ON VISUALIZATION AND COMPUTER GRAPHICS, VOL. X, NO. X, JANUARY XXXX 3
to detect the filamentary network 2. In this model, one placesa random configuration of interacting geometric cylindricalobjects on the point process to detect filamentary structure.It has been developed into a versatile, statistically solid yetcomputationally challenging formalism for the identificationof filaments in a spatial point distribution, such as N-bodysimulations and galaxy redshift surveys [44]. An additionalexample of a method involving statistical analysis of a ge-ometric model is that of Genovese et al. [45], which seeksto describe the filamentary patterns of the cosmic web in anon-parametric way by recovering the medial axis [46] of thepoint-set of galaxies.
The fourth major class of methods, the one which we willalso pursue in this paper, exploits the topological structure ofthe cosmic mass distribution. The fundamental basis of thesemethods is Morse theory [47]. The geometric structure of theMorse-Smale complex [48] naturally delineates the variousmorphological components on the basis of the connectionsbetween the critical points of the density fields and the higherdimensional cells that are incident on the critical points.Various Morse theory based formalisms have been appliedto the identification of components of the cosmic web. Oneof the first applications concerned the detection of voids inthe cosmic density field. The Watershed Void Finder [49]identifies these with the watershed basins around the densityminima. The SpineWeb procedure [50] extended the watershedtransform towards the detection of the full array of structuralcomponents, filaments, walls and voids. These techniques usea user-defined filter to incorporate the multi-scale structure ofthe cosmic density field.
A natural topological means to address the multi-scaletopological structure emanates from the concept of persistence[51]. It provides a natural recipe for detecting and quantifyingthe components of the cosmic web in a truly hierarchicalfashion. Sousbie [52], [53] has exploited and framed this in anelegant and impressive framework, the DisPerSE formalism.Following the construction of the Morse-Smale complex,they proceed to simplify it. The simplification proceeds bycanceling pairs of critical points iteratively, where each pairrepresents a structure in the cosmic web. Topological persis-tence is invoked to order the critical point pairs. However, thismeasure of importance is not unique, and one may consideralternatives, dependent on the specific interest and purpose.
In effect, to tackle similar issues in other visualization areas,a range of variations have been proposed in other studies[54], [55], [56]. Weinkauf et al. [56] describe the concept ofseparatrix persistence, where they compute the strength of sep-aration of points on a separatrix curve (in 2D) connected to asaddle as the sum of the absolute differences of function valuesof the saddle and the extrema connected to it. This conceptis extended to 3D separating sheets by Gunther et al. [54].Reininghaus et al. [55] develop the concept of scale-spacepersistence where they accumulate the absolute difference infunction value measure of critical points across a hierarchy ofderived functions. The set of derived functions are generated
2. See Stoica et al.[43], for a detailed description of this object pointprocess which is used to characterize an observed point distribution by afitting procedure using global optimization techniques.
by smoothing the function using a family of Gaussian kernelsof increasing variances. This is similar to the Multi-scaleMorphology Filter Nexus/MMF [31], [33] described above.Both methods adopt the scale space formalism as the firststep to detect features at multiple scales. However, scalespace persistence and separatrix persistence, disregard specificdensity regimes of interest and are potentially inappropriatewhen small scale features with specific density characteristicsare of interest.
1.2 Present study: contributionsIn the present study, we describe and introduce a techniquefor the identification of filaments based on the topologicalcharacteristics of the density field. A key aspect of the pro-posed technique is its interactive nature, involving a tunabledensity parameter. Specifically, we describe the followingcontributions:
a) We describe Felix3: a topology based framework forvisual exploration of filaments in the cosmic web. In particular,we develop a query framework to extract filamentary structuresfrom a hierarchy of Morse-Smale complexes of the densityfield. The filaments in Felix are parameterized by the densityvalues of the maxima and the 2-saddles that define them.
b) Using Felix, we develop a semi-automatic structurefinder that classifies galaxies as cluster/filamentary or not.We demonstrate its efficiency through two tests. First, usingthe Voronoi Kinematic model as a benchmark, we demon-strate that we are able to recover the classification withhigh efficiency. Second, we show that the classifications arequantitatively comparable to, and in several cases better than,existing classifiers.
c) We investigate the nature of filaments in two differentdensity regimes from the ΛCDM simulations. The first con-cerns filaments in the high density regions around compactdense clusters, which are known to function as the transportchannels along which matter moves into the clusters. A secondregime concerns the tenuous low-density filaments found inlow-density void regions. In the supplemental document, wepresent an additional experiment, where we investigate thenature of three classes of filaments in a relatively cleanerregion of a ΛCDM dataset.
d) In the supplemental document, we describe an efficientstructure based volume rendering enhancement routine thatallows us to highlight the density distribution in regions thatare close to the selected features.
The distinction between noise and significant structures isoften ill-defined, and at occasions noise may be confusedwith genuine structures in the hierarchically evolved massdistribution (see Figure 4 and the caption thereof for an illus-tration). This problem is more pronounced when one studiesthe properties of tenuous filaments and walls in low densityvoid-like regions. For the understanding of the formation andevolution of galaxies in such regions, we need to assessthe possible dependence of galaxy and halo properties onthe morphology and density of the local environment. Thismust be based on the successful extraction of filaments in
3. The name Felix is formed from an abbreviation of Filament explorer.

IEEE TRANSACTIONS ON VISUALIZATION AND COMPUTER GRAPHICS, VOL. X, NO. X, JANUARY XXXX 4
Fig. 1: Ascending manifolds of a 2-saddle (yellow sphere).The scalar function is a sum of two 3D Gaussians centeredon either side of the volume. The two arcs incident on the 2-saddle constitute the ascending manifold and terminate at thetwo maxima (red spheres) of the scalar function.
low density regions and the correct identification of galaxiesassociated with them. In view of this, we include an interactivehandle on the density regimes so that one can concentrate onand probe structures in specific density regimes.
The remainder of the paper is organized as follows. Sec-tion 2 introduces necessary background material. Section 3describes Felix. Section 4 introduces the cosmological datasetsused in the experiments. Section 5 discusses the application ofFelix as a structure finder and as a tool for exploring filamentsin different density regimes. Section 6 concludes the paper bysummarizing the main results and possible future directions.
2 BACKGROUND
This section reviews relevant background on Morse functions,the Morse-Smale complex, and topological simplification. Thisis a necessary prerequisite for understanding the definition offilaments and extraction methods described in the subsequentsections.
2.1 Morse theory and the Morse-Smale complexLet f : M→ R be a real-valued scalar function defined on amanifold M. Critical points of f are points of f where thegradient of f vanishes i.e., ∇ f = 0. Morse theory is the studyof the relationship between the topology of level sets of scalarfunctions and the critical points of the function. The functionf is said to be a Morse function if all of its critical pointsare non-degenerate i.e., the Hessian of f , equal to the matrixof second order partial derivatives, is non-singular. The non-degeneracy condition imposes a locally quadratic form for fwithin a small neighborhood of its critical points. In otherwords, using a coordinate transformation, the function neara critical point p of the n-dimensional manifold M can bewritten as fp(x) = f (p)± x2
1± x22± ...± x2
n. The index of p isequal to the number of negative quadratic terms in the aboveexpression. In 3D, the index 0 corresponds to minima, theindex 1 corresponds to 1-saddles, the index 2 corresponds to2-saddles, and the index 3 corresponds to maxima. An integralline is a maximal curve in the domain, whose tangent alignswith the gradient of f at every point. The function f increasesalong the integral line and its limit points are the critical pointsof f .
The set of all integral lines that originate at the criticalpoint p together with p is called the ascending manifold ofp. Similarly, the set of all integral lines that terminate at
Fig. 2: Topological cancellation of a pair of critical pointsin a 2D Morse-Smale complex. (a) Morse-Smale complexof the function shown in Figure 1 restricted to a 2D slice.Maxima are denoted by �, saddles by ⊕, and minima by}. A pair (pi+1,qi) of critical points connected by a singlearc is scheduled to be canceled. (b) D(pi+1) is the set ofsurviving index i critical points connected to pi+1 and A(qi)is the set of surviving index i+ 1 critical points connectedto qi. (c) Combinatorial realization: connect all critical pointsD(pi+1) to those in A(qi). Geometric realization: merge thedescending manifold of pi+1 with those of critical pointsin A(qi). Merge the ascending manifold of qi with those ofcritical points in D(pi+1).
the critical point p together with p is called the descendingmanifold of p. The ascending manifolds (similarly, the de-scending manifolds) of all critical points partition the domain.The ascending manifold of a critical point with index i hasdimension n− i, where n is the dimension of the domain. Thus,the ascending manifold of a minimum is a three dimensionalcell, the ascending manifold of a 1-saddle is a two dimen-sional sheet, the ascending manifold of a 2-saddle is a onedimensional arc (see Figure 1), and the ascending manifoldof a maximum is equal to the maximum. The converse istrue for the descending manifold i.e., the descending manifoldof a critical point with index i has dimension i. The Morse-Smale complex is a partition of the domain into cells formedby the collection of integral lines that share a common sourceand a common destination. The function f is called a Morse-Smale function if the ascending and descending manifolds ofall pairs of critical points intersect only transversally i.e., ifthe ascending and descending manifolds of two critical pointsintersect, then the intersection has dimension exactly equalto the difference in the indices of the two critical points.The critical points, referred to as nodes, together with the 1-manifolds that connect them, referred to as arcs, form the1-skeleton of the Morse-Smale complex, which is referred toas the combinatorial structure of the Morse-Smale complex.
2.2 Morse-Smale complex simplificationThe Morse-Smale complex may be simplified by repeatedapplication of the topological cancellation procedure. Topo-logical cancellation eliminates a pair of critical points inthe Morse-Smale complex connected by a single arc. Theresulting complex is representative of a smoother version off , which may be obtained by a local smoothing operationwithin an infinitesimal neighborhood of the arc. The canceledpair of points are no longer critical in the smoother versionof f . By repeatedly applying topological cancellations, oneobtains a simpler Morse-Smale complex, where undesirablepairs of critical points are eliminated. This simplified Morse-Smale complex is representative of the function f with several

IEEE TRANSACTIONS ON VISUALIZATION AND COMPUTER GRAPHICS, VOL. X, NO. X, JANUARY XXXX 5
smoothing operations applied to it. Pairs of critical points thatare multiply connected in the Morse-Smale complex, referredto as strangulations, cannot be simplified by topologicalcancellation.
The cancellation procedure mandates changes to the com-binatorial structure and ascending/descending manifolds ofcritical points that survive the cancellation. These changes arerespectively referred to as the combinatorial and geometricrealization of the cancellation. Let pi+1 and qi denote thepair of critical points to be eliminated with i+1 and i beingthe respective Morse indices. The combinatorial realizationproceeds by first removing pi+1 and qi as well as all arcsincident upon them. Next, new arcs are introduced betweenevery surviving index i critical point that was connectedto pi+1 and every surviving index i + 1 critical point thatwas connected to qi. The geometric realization merges thedescending manifold of pi+1 with the descending manifoldof each surviving index i+ 1 critical point connected to qi.Analogously, the ascending manifold of qi is merged with theascending manifold of each surviving index i critical pointconnected to pi+1. Figure 2 illustrates both realizations of atopological cancellation procedure applied to the Morse-Smalecomplex of a two-dimensional slice of the function shown inFigure 1.
The ordering of cancellation pairs plays a crucial role in de-termining the resulting structure of the Morse-Smale complexand its geometry. To simplify the Morse-Smale complex, pairsof singularly connected critical points having the least absolutedifference in function value are iteratively canceled. Thisapproach is equivalent to the notion of topological persistence[48], [51] for 2D Morse-Smale complexes, but not necessarilyfor 3D Morse-Smale complexes [57].
2.3 The hierarchical Morse-Smale complex
A sequence of cancellations results in a hierarchical se-quence of Morse-Smale complexes MSC0,MSC1, ...,MSCn,where each Morse-Smale complex is a simpler version ofthe preceding Morse-Smale complex containing fewer criticalpoints. Morse-Smale complex MSCi is said to be coarser thanMSC j if i> j and finer if i< j. The version index i enumeratesthe Morse-Smale complexes in the hierarchy. Each non-zeroversion of the Morse-Smale complex, MSCi, is associated withthe absolute difference in function value, ti, of the pair ofcritical points canceled in the preceding version, MSCi−1. Aseach iteration selects the pair of critical points with the leastabsolute difference in function value, the sequence of ti’s ismonotonically increasing i.e. (t0 = 0) ≤ t1 ≤ t2 . . . ≤ tn. Forcompleteness of the sequence, t0 is set to zero. Figure 3illustrates a hierarchy of Morse-Smale complexes of a 2Dequivalent of the function shown in Figure 1.
It is not necessary to explicitly store all versions of thehierarchy of Morse-Smale complexes. Instead, the combi-natorial representation of only MSC0 is computed initially.Subsequently, MSCi can be obtained from a finer MSCi−1 byperforming topological cancellation (see Section 2.2). Analo-gously, MSCi is obtained from a coarser MSCi+1 by applyingthe inverse operation of a topological cancellation.
Fig. 3: Hierarchical Morse-Smale complex. A family ofMorse-Smale complexes generated by iteratively cancelingpairs of critical points. MSC0 is the Morse-Smale complexof a 2D equivalent of the function shown in Figure 1. It issimplified to generate a coarser version, MSC1, by cancelinga pair of critical points (cyan) connected by a single arcand having least absolute difference in function value t1.Successive versions MSCi are computed similarly by selectingarcs so that t0 = 0≤ t1 ≤ . . .≤ t6.
3 METHODOLOGY
Exploring the filamentary patterns of the cosmic web ischallenging because of the large range of the spatial scalesand density range it exhibits. A proper characterization shouldalso account for the hierarchical nature of structures, whichadds considerable challenges to the task. Though there existdifferent notions of filaments, the primary evidence relied uponfor extraction and analysis is most often visual. It is thereforenot surprising that structure finding methods often visuallyverify results by superimposing the extracted structures uponvisualizations of the density field or the particle distribution.However the visualization plays a role only after structure ex-traction process in these methods. We differ in this respect byproviding the capability to interact with the structure findingprocedure and extract structures that are visually relevant. Toaccomplish such a visual exploration framework, a succinctmodel of filament definition, an efficient representation ofhierarchical structures, and an appropriate query mechanismthat supports the extraction of these structures are paramount.The following exposition details our framework on theseterms.
3.1 Density estimation and filament modeling
Cosmological simulations are N-body particle experiments thatsimulate structure formation and evolution by tracing positionsof the particles under the influence of physical laws. In theobservational reality, the information about structures in thecosmos comes through observing the galaxies. The galaxiescan be treated as particles also for the purpose of analysis inthe context of large scale structures.
The input to Felix is the logarithm of the density scalarfield on the given 3D domain of interest. The domain couldbe 3D structured grids or tetrahedral meshes, with the densityspecified on the vertices of the grid/mesh. We find that thelogarithm of the density field, instead of the density fielditself, resolves the structures with more visual clarity. Thishas also been independently established in an earlier work[33]. Additionally, the input may be specified as a distributionof particles within a 3D region of interest. This could bea snapshot from a cosmological simulation, or galaxies inreal observational data. We use the Delaunay tessellation fieldestimator (DTFE) [58], [59] to estimate the density of the input
IEEE TRANSACTIONS ON VISUALIZATION AND COMPUTER GRAPHICS, VOL. X, NO. X, JANUARY XXXX 6
(a) (b)
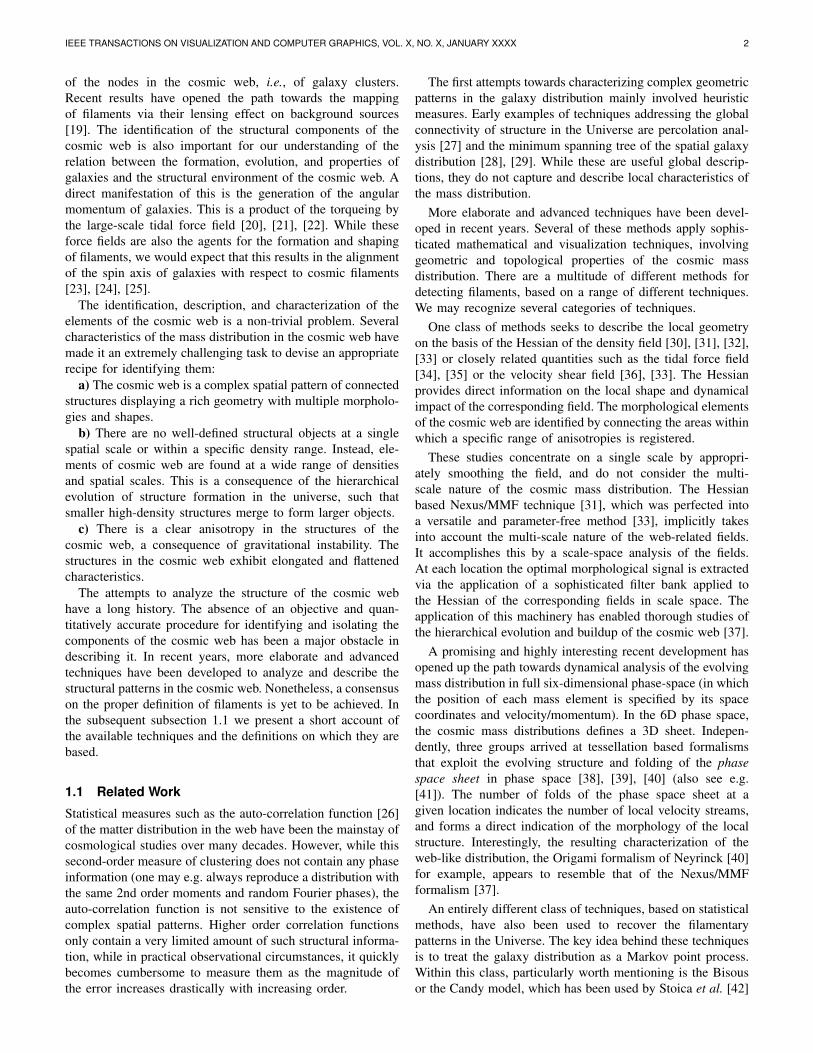
Fig. 4: (a) A scatter plot of the function values of the canceledcritical point pairs for the function shown in Figure 1. A2-saddle-maximum pair is the only pair that is far removedfrom the diagonal. This corresponds to cancellation of the 2-saddle with a maximum that represents one of the Gaussiansin Figure 1. Other pairs close to the diagonal representinsignificant features that manifest due to the added Gaussiannoise as well as sampling noise. (b) A scatter plot of thefunction values of the canceled critical point pairs for theVoronoi-Kinematic dataset B (see Section 4.1). No discernibleseparation of points is seen, though there are many pointsthat are far removed from the diagonal. Thus, no clear globalsimplification threshold may be used for filament extraction.
particles in the 3D region of interest. This procedure beginsby computing the periodic Delaunay triangulation[60] on thepoints (simulation particles or galaxies). Next, the density ateach vertex of the triangulation is estimated by the inverseof the volume of the tetrahedra incident upon it. Finally,the density is linearly interpolated onto the edges, faces, andtetrahedra of the Delaunay triangulation to yield a piecewiselinear density function on the domain. The periodic Delaunaytriangulation, computed by the DTFE procedure, is used torepresent the domain.
The Morse-Smale complex of the logarithm of the densityfield is computed. Filaments are modeled as the ascendingmanifolds of 2-saddles of the Morse-Smale complex. Thesearcs represent paths of steepest descent from the two maximamerging at the 2-saddle. This 2-saddle represents the lowestdensity point along the arcs connecting the two maxima. Aschematic illustration of this is presented in Figure 1. Thereare many algorithms available in the literature to compute the3D Morse-Smale complex. The algorithms are primarily basedon either the quasi Morse-Smale complex formulation [61],[62] or Forman’s [63] discrete Morse theory[64], [65], [66],[67]. We use a parallel algorithm based on the latter approach[67] resulting in fast computation even for large datasets.
The density field is rarely smooth and several local maximaobscure a view of the larger scale behavior of the densityfield. This is especially true if the density field is computedon the raw particle distribution, where the density field tendsto be spiky and with a lot of fluctuations in the high densitycluster-like regions. The Morse-Smale complex is simplifiedby iteratively canceling pairs of singularly connected criticalpoints with least absolute difference in function value togenerate a hierarchy of Morse-Smale complexes.
In most applications, a specific version of the Morse-Smale
complex from the hierarchy is chosen based on a perceptiblyclear separation of noise and features. One way to choose sucha threshold separating noise and feature is by using a scatterplot of the function values of canceled critical point pairs(see Figure 4) where the lower function value among the paircorresponds to the x-coordinate and the higher function valuecorresponds to the y-coordinate. In datasets where topologicalfeatures are well separated (see Figure 4a), pairs representingsignificant features appear far away and isolated from thediagonal. In such cases, the coarsest Morse-Smale complexversion wherein the insignificant pairs are removed is selectedfor feature analysis/extraction. However, this strategy is noteasily applicable to cosmology datasets (see Figure 4b). A welldefined separation is rarely discernible, though there are manyscatter points that are far removed from the diagonal. Hence,we drop the assumption that we must work with a specificversion of the Morse-Smale complex. Instead, we query forfeatures across all Morse-Smale complexes in the hierarchy,as discussed in the following sub-section.
3.2 Density range based filament selection
Cosmic filaments exhibit a large range of variation in theirdensity characteristics. Indeed, one expects filaments to bepresent both in void like regions and between cluster likeregions. While strong dense filaments in between clustersdefine the spine of the Cosmic Web, in the hierarchicallyevolving mass distribution we encounter a wide spectrum ofever more tenuous filaments on smaller mass scales. Smallfilaments define the directions of mass inflow into galaxies,and form a crucial component in the formation of galaxies[68]. Even more tenuous are the systems of filaments stretch-ing over the hollows of voids, often conspicuously alignedalong the direction defined by neighbouring superstructures.The understanding of this network is tightly related to theissue of the “missing” dwarf galaxies in voids [69]. While thisillustrates the complexity of the multiscale filigree of filamentsin the Cosmic Web, we follow a strategy in which we focusour attention on specific aspects and details of the cosmicweb. Dependent on the identity of objects and structures ofinterest, we wish to be able to zoom in on to the correspondingfilamentary network. This is largely dependent on the massscales of the objects involved, and the density values of thecorresponding filament generating density peaks [70], [37].
Following this rationale, we translate this strategy into theuse of queries that depend on the density properties of interest.Specifically, we query for filaments by specifying the densityrange [Mb,Me] of the clusters they connect (the maxima atthe end points), as well as the density range [Sb,Se] of thelowest point along the connecting path (the density range ofthe 2-saddles). Figure 5 conceptually illustrates the character-ization of filaments using density ranges, where density alongfilaments varies significantly necessitating simplification.
Algorithm SELECT2SADDLES lists the algorithm to processsuch a query. The algorithm accepts, together with the com-binatorial Morse-Smale complex MSC, the density ranges of2-saddles [Sb,Se] and maxima [Mb,Me] as input (the subscriptsb and e denote the beginning and ending of each density range

IEEE TRANSACTIONS ON VISUALIZATION AND COMPUTER GRAPHICS, VOL. X, NO. X, JANUARY XXXX 7
Fig. 5: (a) Filaments are modeled as the ascending paths of2-saddles connecting two extrema. The 2-saddles are filteredbased on the range constraints [Mb,Me] and [Sb,Se] on thehighest and lowest values respectively along the ascendingpaths. The highest values along the 2-saddle’s ascendingmanifold are at extrema and the lowest value is at the 2-saddle.The function along the paths needs to be simplified as it israrely smooth. In the illustration, a simplification threshold oft reveals a filament with appropriate density characteristics.However, imposing such a threshold uniformly will causeanother filament (b) having the required density characteristicsto be destroyed. It is therefore necessary to extract filaments byquerying all Morse-Smale complexes within a given hierarchy.
respectively). The algorithm returns a list of 2-saddles thatsatisfy the above criteria together with the maximal Morse-Smale complex version in which they do so.
Algorithm SELECT2SADDLES ([Sb,Se], [Mb,Me] )
1: Sver = Empty Map2: S = {s|s is a 2-saddle,Sb < f (s)< Se}3: for all s ∈ S do4: va = Max{i|s is not simplified in MSCi}5: vb = Max{i|ti < Mb− f (s)}6: vc = Max{i|s connects distinct Maxima in MSCi}7: Sver[s] = Min(va,vb,vc)8: Sort S by Sver9: Ssel = Empty Set
10: for all s ∈ S do11: i = Sver[s]12: ma,mb = Maxima connected to s in MSCi13: if Mb < f (ma), f (mb)< Me then14: insert (s,Sver[s]) in Ssel15: return Ssel
The algorithm begins by creating a list S of 2-saddles thathave their function value in the given 2-saddle range [Sb,Se].Then, for each 2-saddle in S, a Morse-Smale complex versionin which it possibly connects two maxima within [Mb,Me] iscomputed. The appropriate version is given by the minimumof three version indices va,vb and vc.
The version index va is the finest Morse-Smale complexversion in which the 2-saddle s survives. In other words, s iscanceled in MSCva+1 but not in MSCva . This is pre-computedby examining the cancellation sequence. The version indexvb corresponds to the last Morse-Smale complex version atwhich the 2-saddle s connects two maxima, both with functionvalue less than Me. This is possible because in successive
versions of the Morse-Smale complex, the maxima connectedto a 2-saddle via the same arc form an increasing sequence interms of their function value. Thus, in the version where theabsolute difference in function value of the last canceled pairis less than Mb− f (s), the 2-saddle s still possibly connectstwo maxima with function value less than Me. The versionindex vc is the last Morse-Smale complex version at whichthe 2-saddle s separates distinct maxima. In other words, itis not a strangulation in MSCvc . As a consequence of thecancellation preconditions, once a strangulation is created by a2-saddle, it may be destroyed only by canceling the 2-saddlewith a 1-saddle. Thus there exists a maximal version indexvc after which the 2-saddle remains connected to a singlemaximum. The version index vc is −1 when the 2-saddle is astrangulation in the initial Morse-Smale complex. In this case,the 2-saddle is not considered in further steps and is removedfrom S. Again, this is easily pre-computed for each 2-saddleby examining the cancellation sequence.
The 2-saddles in the set S are sorted based on their versionindices. This is done to optimize switching between therequired Morse-Smale complex versions. Next, each 2-saddles in S is checked to see if it separates two maxima withinthe maxima density range [Mb,Me]. The list of 2-saddles thatfulfill all of the above criteria is returned together with theassociated version number of each 2-saddle. This above list of2-saddles is used to extract the filament geometry. Specifically,the ascending manifold of each 2-saddle is extracted from thecorresponding version of the Morse-Smale complex. This maybe done efficiently using the cancellation merge DAG datastructure discussed by Gyulassy et al. [71].
In some situations, it is desirable to perform some simpli-fication to eliminate Poisson noise introduced due to meshingthe domain. In these cases, a global simplification specif-ically for noise elimination, can be optionally introduced.Specifically, Algorithm SELECT2SADDLES returns only those2-saddles that survive in hierarchical Morse-Smale complexversions above a specified threshold Ts, where Ts is specifiedas a normalized fraction of the range of log-density values(normalized to [0,1]). Ts is set to 0.0 unless specifically men-tioned. Similar to the inputs of Algorithm SELECT2SADDLES,Ts may be updated during run-time.
3.3 Volume Rendering
We use volume visualizations of the density field to aidselection of parameters for Algorithm SELECT2SADDLES.The geometry of the selected filaments using Algorithm SE-LECT2SADDLES is superimposed upon a volume rendering ofthe density field. Based on the visualization of the extractedfilaments and the density volume rendering, the parametersmay be adjusted so that the structures correspond with thedensity volume rendering. Figure 6 shows an example ofthe overlay of the volume visualization with the selectedstructures. Direct volume rendering of the density is oftennot effective for visualization because of the formation ofclusters at multiple scales. Furthermore, these clusters areoften spatially far removed from the features of interest. Inthe supplemental document, we describe an application of

IEEE TRANSACTIONS ON VISUALIZATION AND COMPUTER GRAPHICS, VOL. X, NO. X, JANUARY XXXX 8
our framework to suppress the opacity of regions spatially farremoved from filamentary features of interest, which leads toa feature based volume rendering enhancement.
4 MODEL DESCRIPTION
In this section, we briefly describe the models used to test ourfilament detection routine. These are the Voronoi evolutionmodels and ΛCDM cosmological simulations.
The Voronoi models provide us with vital quantitative in-formation on the sensitivity of Felix to anisotropic filamentarypatterns in the galaxy distribution. To this end it is of keyimportance that the Voronoi models have an a-priori knownpopulation fraction in different morphological elements: clus-ters, filaments, walls and voids. This makes them perfect testmodels for evaluating success and failure rates of the variousidentification methods.
Although they involve filaments with a broad distributionof densities, the Voronoi models do not incorporate the multi-scale web-like patterns seen in realistic cosmological scenar-ios. To assess this aspect of the cosmic mass distribution,we turn to simulations of structure formation in the stan-dard ΛCDM cosmology. Implicitly these include all relevantphysical and dynamical processes of the evolving cosmicdark matter distribution. However, as we have no controlover all aspects of the emerging mass distribution in ΛCDMsimulations, for testing purposes they are not as informativeas Voronoi models 4
4.1 Voronoi evolution modelsThe Voronoi evolution models are a class of heuristic modelsfor cellular distributions of galaxies that mimics the evolutionof the Megaparsec universe towards a weblike pattern. Theyuse Voronoi tessellations as a template for distribution ofmatter and related galaxy population [76], [77], [74], and itssubsequent evolution.
In these models, one begins by fixing an underlying Voronoiskeleton, defined by a small set of randomly distributednuclei in the simulation box. One then superposes a set of Nrandomly distributed particles on this skeleton. The resultingspatial distribution of particles in the model is obtained byprojecting the initially random distribution of particles on tothe faces, edges, and nodes of the Voronoi tessellation. Thisresults in a pattern in which one can distinguish four structuralcomponents: field particles located in the interior of Voronoicells, wall particles within and around the Voronoi faces,filament particles within and around the Voronoi edges andcluster particles within and around the Voronoi nodes.
One particular class of Voronoi clustering models are theVoronoi kinematic models, which seek to approximate thedynamical evolution of the large scale cosmic mass distri-bution. These models involve a continuous flow of galaxiestowards the nearest wall, along a filament at the wall’s edge,and subsequently towards the final destination, a vertex of the
4. In the literature, several studies use simplistic models using Voronoitessellations. The models we use here are considerably more sophisticated,and represent a rather realistic depiction of the cosmic web in void-dominatedcosmologies, see e.g. [72], [73], [74], [75].
cell wall filament clusterA 29.88% 43.57% 22.20% 4.33%B 9.82% 32.13% 38.62% 19.42%C 3.5% 16.50% 28.70% 51.30%
TABLE 1: The relative abundance of particles in each struc-tural element throughout the course of evolution.
Voronoi tessellation. This motion is regulated by the increaseof mean distance between the galaxies, an expression of voidexpansion and evacuation as a function of time.
The Voronoi models used in our experiments have 262,144particles distributed along the vertices, edges, faces and cellsof the Voronoi skeleton in a box of side-length 200h−1Mpc.The skeleton is generated by 32 randomly placed nuclei in thebox. For the least evolved stage, most of the particles are in thecells, while for the most evolved stage, most of the particles arelocated in and around clusters. Table 1 presents the percentagedistribution of particles in the various structural elements, asit changes with time. Stage 1 (dataset A) is the least evolved,while Stage 3 (dataset C) is the most evolved. The particlesin and around the nodes, edges, and walls are Gaussiandistributed around these elements, characterized by a thicknessscale R f which is the standard deviation of the distribution. Forour models, R f = 2h−1Mpc. In the supplemental document, wepresent the volume renderings of the density distribution.
4.2 ΛCDM cosmological simulationsThe ΛCDM simulations are fully physical models that tracethe distribution and evolution of dark matter in the universebased on current understanding of real physical laws. Darkmatter is the gravitationally dominant matter component in theUniverse and constitutes the major fraction of matter. As it isknown to only interact gravitationally, modeling the behaviorof dark matter is computationally fast and efficient. Such darkmatter simulations form one of the principal tools towardsunderstanding the evolution of the matter distribution in theUniverse.
The cosmological simulations that we used follow thestandard ΛCDM cosmology. In this model, the matter contentof this Universe is dominated by collisionless cold darkmatter (CDM) particles. The biggest contribution to the energycontent of this Universe comes from dark energy, in the formof the cosmological constant Λ (see [78]), which drives itsaccelerated expansion at the current epoch.
To present the results of our visual exploration framework,we use the Cosmogrid simulations [79]. It is a suite ofsimulations in a box of size 21h−1Mpc, each differing in thenumber of particles. The particular simulation we use for ourstudy comprises of 5123 particles. This is a relatively smallscale in the context of the cosmic web. The mass resolutionachieved is 8.21× 10⁶M�. The initial conditions are setupat z = 65 using the Zel’dovich approximation [80]. The log-density field is available on a 128×128×128 structured grid.
Particularly characteristic in the evolving mass distributionof the Cosmogrid simulation is the large central under-density,surrounded by a range of smaller voids near its outer edge.In combination with its extremely high spatial resolution andstate-of-the-art dynamic range, this renders the Cosmogrid

IEEE TRANSACTIONS ON VISUALIZATION AND COMPUTER GRAPHICS, VOL. X, NO. X, JANUARY XXXX 9
simulation uniquely suited as a testbed for a case study of theinternal structure of voids. It was precisely this circumstancethat formed the rationale behind its exploitation in a previousstudy of the formation of dark halos along tenuous voidfilaments [81].
5 RESULTS AND DISCUSSIONIn this section, we demonstrate and discuss the salient featuresand potential applications of Felix. First, we evaluate the fila-ments extracted using Felix and compare with those extractedusing MMF, SpineWeb, and DisPerSE using the Voronoikinematic datasets. Next, we present a visual exploration of thefilaments in the Cosmogrid simulation. The methods describedabove were implemented and tested on a computer systemwith an Intel Xeon(R) 2.0 GHz CPU and 8GB of RAM. Inthe supplemental document, we briefly discuss the structurefinders against which we compare Felix.
5.1 Filaments in the Voronoi model: a comparisonHere we present an analysis of the filamentary structuresextracted using Felix, and compare the results with the tech-niques detailed above. The comparison study concerns theanalysis results obtained for the set of heuristic Voronoievolution models described above. Since they are input pa-rameters, in these models the classification of galaxies asvoid, wall, filament, and cluster are known a-priori. Followingthe application of one of the detection techniques we maythen examine the validity and authenticity of the extractedstructures by direct comparison with the true identity of agalaxy.
For the comparison study, we define two measures. Onequantifies the true detection rate of a method, the other thefalse identifications. We classify all galaxies within a distanced from the extracted structures to be filament and clusterparticles and the others to be void and wall galaxies. For agiven set of structures extracted from a given dataset and adistance d, the true positive classification rate T Pd is definedas
T Pd =# filament and cluster galaxies correctly classified
# filament and cluster galaxies.
Similarly, the false positive classification rate FPd is definedas
FPd =# filament and cluster galaxies incorrectly classified
# filament and cluster galaxies.
A large separation between these two measures indicatesgood discriminatory power of the classifier, and thus theproximity of relevant galaxies to the extracted structures.
As we discuss in more detail below, the Felix’s true and falsedetection rates are comparable, and in some situations better,than those obtained by DisPerSE, SpineWeb and Nexus/MMF.A brief description of SpineWeb, and Nexus/MMF is providedin the supplemental document. As the DisPerSE methodologyis closely related to Felix, in the following paragraphs, webriefly describe it and contrast it against Felix.
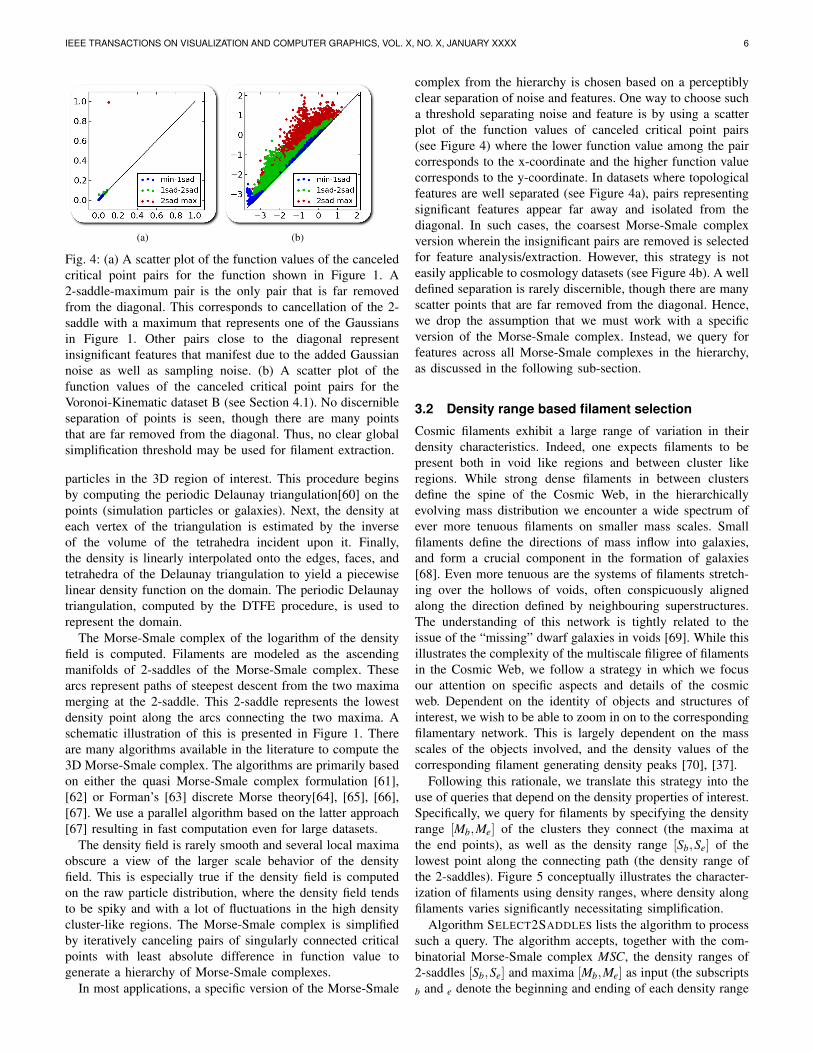
Felix: Figure 6 shows the extracted filaments for theVoronoi kinematic datasets A, B, and C using Felix. The inputdensity range parameters for Algorithm SELECT2SADDLESare selected interactively, using the visualization informationof the procedure. Each update is accomplished within 2-3 seconds. This enables interactive visual feedback so thatparameters may be adjusted further in subsequent iterativesteps.
Comparison A: Felix and DisPerSE: DisPerSE [52],[53] is a closely related structure finder that also uses theMorse-Smale complex of the logarithm of the density field.It simplifies the Morse-Smale complex using TopologicalPersistence. The function values are normalized by the rmsof the density field fluctuation with respect to the mean, andthe significance level for simplification is quoted in this unit.Felix is closely related to DisPerSE as both use the Morse-Smale complex of the log-density field and involve featureextraction from it. DisPerSE defines significant features asonly those that remain unsimplified using the user definedsignificance threshold. It ignores the density range charac-teristics of the extracted features. A significant consequenceis that filaments within void-like regions and cluster likeregions are ignored/simplified away. If they are retained, thenthe mixing of features causes visual clutter. Furthermore, thesignificance parameter selection is a fixed constant and visualinteraction plays no role in its selection. In contrast, given theubiquity of filaments in various density regimes, Felix allowsfor density ranged based probes into filaments, within clustersand voids. Furthermore, the visual interactive aspect allowsfor user engagement in parameter selection, which is crucialfor the set of features identified. Another difference is thatFelix uses simplification only for noise removal and not featureidentification.
In this experiment, we demonstrate the consequences of notcorrelating the density characteristics for filament extraction.Specifically, we demonstrate that the filaments extracted usingFelix are more spatially proximal to filament and clusterparticles in the Voronoi Kinematic simulation. Furthermore,we show that tuning the significance parameter is not asufficient mechanism to extract the desired filaments in thisdataset. In the next experiment, we demonstrate the explorationof filaments within high-density cluster like regions and low-density void like regions. Such a delineation, coupled with thevisual exploration process, is not possible using DisPerSE.
The recovery and failure rates for the Voronoi kinematicmodels A, B, and C are shown in Figure 8. The TPd andFPd of the Felix filaments are plotted in the top-left panel,the ones for DisPerSE can be found in the top right-handpanel (1σ significance threshold), bottom left-hand panel (3σ
significance threshold) and bottom-right panel (5σ significancethreshold).
Felix shows good recovery rates for all datasets, particularlyaround d = 3h−1Mpc. For the least evolved configuration A,and for locations where structures are least distinct, Felixstill obtains moderately good recovery rates. The results forDisPerSE with simplification thresholds 1σ and 3σ are com-parable: at short distances the true detection rate is slightlylower than that of Felix, while at larger distances it performs

IEEE TRANSACTIONS ON VISUALIZATION AND COMPUTER GRAPHICS, VOL. X, NO. X, JANUARY XXXX 10
(a) (b) (c)
Fig. 6: Filamentary structures extracted from datasets A, B, and C of the Voronoi evolution time-series using Felix withparameters for Algorithm SELECT2SADDLES set as follows: (a) [Sb,Se] = [10−1.6,∞] and [Mb,Me] = [10−0.1,∞], (b,c) [Sb,Se] =[10−1.6,∞] and [Mb,Me] = [100,∞]. Filaments are shown as orange tubes along with a volume rendering of the log-densityfield. The dense knot like structures show filaments within cluster-like regions.
(a) (b) (c)
Fig. 7: Filamentary structures extracted from datasets A, B and C of the Voronoi evolution time-series using DisPerSE withsignificance level of 5σ . Filaments are shown as orange tubes along with a volume rendering of the log-density field. Theinset pictures show identified filaments that are within wall-like and void-like regions of the Voronoi kinematic datasets.
Fig. 8: Classification recovery rates for Voronoi kinematicdatasets A, B, and C. Top left: Felix; top right: DisPerSE,1σ significance level; bottom left: DisPerSE, 3σ significancelevel, and (bottom right) DisPerSE with a 5σ significancelevel. False positive rates greater than 1.0 are clipped andrespective values are shown.
marginally better. The situation is slightly different in the caseof DisPerSE with a 5σ simplification threshold. In the caseof the more strongly evolved B and C datasets, DisPerSE andFelix have similar false detection rates FPd , while the truedetection rates T Pd of Felix are consistently higher.
For the lesser evolved datasets A and B, the false detectionrates FPd for DisPerSE quickly increase to rather large values.For simplification thresholds of 1σ and 3σ it even surpassesvalues of unity. This may indicate that in certain circumstancesan automatic detection of filaments from the Morse-Smalecomplex runs the risk of over-determining the population offilaments, even after considerable simplification. While theproblem is not so acute in the most evolved stage C, wherethe morphologies are well separated, direct simplificationstrategies may not always succeed in properly classifying allfilament, wall and void regions in the more moderately evolvedstages A and B.
Figure 7 shows the filaments in the three Voronoi modelsdetected by DisPerSE, with a simplification threshold of 5σ .In comparison with the structures in Figure 6, the knot likestructures present in clusters are absent. This leads to thecluster particles being far away from the filament end points,and thus the reduced T Pd rates of DisPerSE. In contrast,
IEEE TRANSACTIONS ON VISUALIZATION AND COMPUTER GRAPHICS, VOL. X, NO. X, JANUARY XXXX 11
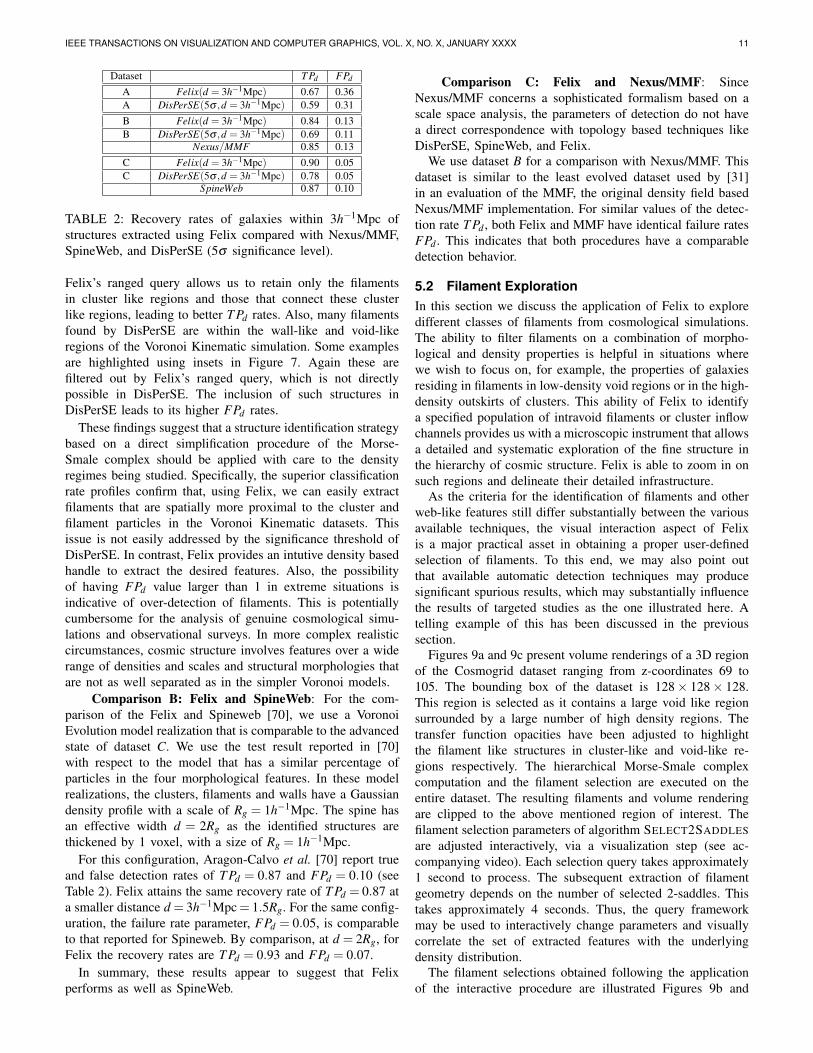
Dataset T Pd FPd
A Felix(d = 3h−1Mpc) 0.67 0.36A DisPerSE(5σ ,d = 3h−1Mpc) 0.59 0.31B Felix(d = 3h−1Mpc) 0.84 0.13B DisPerSE(5σ ,d = 3h−1Mpc) 0.69 0.11
Nexus/MMF 0.85 0.13C Felix(d = 3h−1Mpc) 0.90 0.05C DisPerSE(5σ ,d = 3h−1Mpc) 0.78 0.05
SpineWeb 0.87 0.10
TABLE 2: Recovery rates of galaxies within 3h−1Mpc ofstructures extracted using Felix compared with Nexus/MMF,SpineWeb, and DisPerSE (5σ significance level).
Felix’s ranged query allows us to retain only the filamentsin cluster like regions and those that connect these clusterlike regions, leading to better T Pd rates. Also, many filamentsfound by DisPerSE are within the wall-like and void-likeregions of the Voronoi Kinematic simulation. Some examplesare highlighted using insets in Figure 7. Again these arefiltered out by Felix’s ranged query, which is not directlypossible in DisPerSE. The inclusion of such structures inDisPerSE leads to its higher FPd rates.
These findings suggest that a structure identification strategybased on a direct simplification procedure of the Morse-Smale complex should be applied with care to the densityregimes being studied. Specifically, the superior classificationrate profiles confirm that, using Felix, we can easily extractfilaments that are spatially more proximal to the cluster andfilament particles in the Voronoi Kinematic datasets. Thisissue is not easily addressed by the significance threshold ofDisPerSE. In contrast, Felix provides an intutive density basedhandle to extract the desired features. Also, the possibilityof having FPd value larger than 1 in extreme situations isindicative of over-detection of filaments. This is potentiallycumbersome for the analysis of genuine cosmological simu-lations and observational surveys. In more complex realisticcircumstances, cosmic structure involves features over a widerange of densities and scales and structural morphologies thatare not as well separated as in the simpler Voronoi models.
Comparison B: Felix and SpineWeb: For the com-parison of the Felix and Spineweb [70], we use a VoronoiEvolution model realization that is comparable to the advancedstate of dataset C. We use the test result reported in [70]with respect to the model that has a similar percentage ofparticles in the four morphological features. In these modelrealizations, the clusters, filaments and walls have a Gaussiandensity profile with a scale of Rg = 1h−1Mpc. The spine hasan effective width d = 2Rg as the identified structures arethickened by 1 voxel, with a size of Rg = 1h−1Mpc.
For this configuration, Aragon-Calvo et al. [70] report trueand false detection rates of T Pd = 0.87 and FPd = 0.10 (seeTable 2). Felix attains the same recovery rate of T Pd = 0.87 ata smaller distance d = 3h−1Mpc= 1.5Rg. For the same config-uration, the failure rate parameter, FPd = 0.05, is comparableto that reported for Spineweb. By comparison, at d = 2Rg, forFelix the recovery rates are T Pd = 0.93 and FPd = 0.07.
In summary, these results appear to suggest that Felixperforms as well as SpineWeb.
Comparison C: Felix and Nexus/MMF: SinceNexus/MMF concerns a sophisticated formalism based on ascale space analysis, the parameters of detection do not havea direct correspondence with topology based techniques likeDisPerSE, SpineWeb, and Felix.
We use dataset B for a comparison with Nexus/MMF. Thisdataset is similar to the least evolved dataset used by [31]in an evaluation of the MMF, the original density field basedNexus/MMF implementation. For similar values of the detec-tion rate T Pd , both Felix and MMF have identical failure ratesFPd . This indicates that both procedures have a comparabledetection behavior.
5.2 Filament ExplorationIn this section we discuss the application of Felix to exploredifferent classes of filaments from cosmological simulations.The ability to filter filaments on a combination of morpho-logical and density properties is helpful in situations wherewe wish to focus on, for example, the properties of galaxiesresiding in filaments in low-density void regions or in the high-density outskirts of clusters. This ability of Felix to identifya specified population of intravoid filaments or cluster inflowchannels provides us with a microscopic instrument that allowsa detailed and systematic exploration of the fine structure inthe hierarchy of cosmic structure. Felix is able to zoom in onsuch regions and delineate their detailed infrastructure.
As the criteria for the identification of filaments and otherweb-like features still differ substantially between the variousavailable techniques, the visual interaction aspect of Felixis a major practical asset in obtaining a proper user-definedselection of filaments. To this end, we may also point outthat available automatic detection techniques may producesignificant spurious results, which may substantially influencethe results of targeted studies as the one illustrated here. Atelling example of this has been discussed in the previoussection.
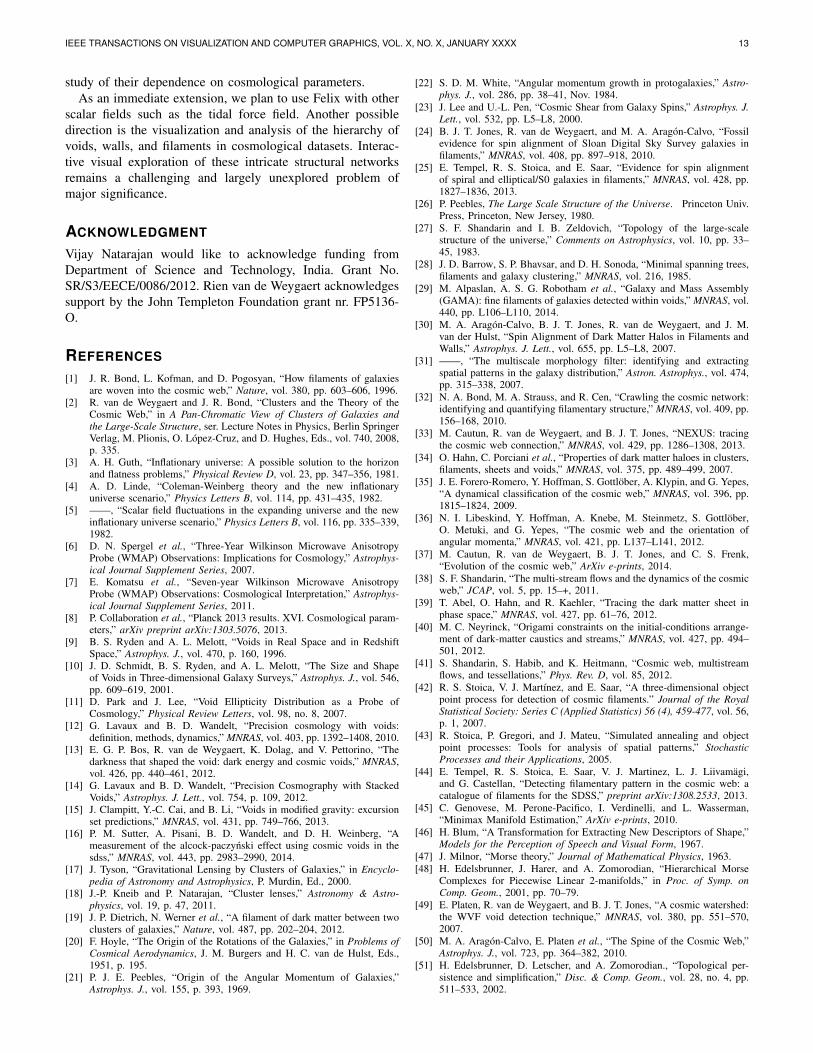
Figures 9a and 9c present volume renderings of a 3D regionof the Cosmogrid dataset ranging from z-coordinates 69 to105. The bounding box of the dataset is 128× 128× 128.This region is selected as it contains a large void like regionsurrounded by a large number of high density regions. Thetransfer function opacities have been adjusted to highlightthe filament like structures in cluster-like and void-like re-gions respectively. The hierarchical Morse-Smale complexcomputation and the filament selection are executed on theentire dataset. The resulting filaments and volume renderingare clipped to the above mentioned region of interest. Thefilament selection parameters of algorithm SELECT2SADDLESare adjusted interactively, via a visualization step (see ac-companying video). Each selection query takes approximately1 second to process. The subsequent extraction of filamentgeometry depends on the number of selected 2-saddles. Thistakes approximately 4 seconds. Thus, the query frameworkmay be used to interactively change parameters and visuallycorrelate the set of extracted features with the underlyingdensity distribution.
The filament selections obtained following the applicationof the interactive procedure are illustrated Figures 9b and

IEEE TRANSACTIONS ON VISUALIZATION AND COMPUTER GRAPHICS, VOL. X, NO. X, JANUARY XXXX 12
Fig. 9: Exploring filaments in high-density cluster-like environments and low-density void like regions in the Cosmogrid dataset.The selected region, comprising of a 3D region of z-slices from 69 through 105, contains filamentary structures in both types ofenvironments. Volume rendering of the density field with opacity adjusted to highlight filaments in (a) high density cluster-likeregions, and (c) low density void-like regions. (b) Filaments within high density cluster-like regions extracted with parameters[Sb,Se] = [100,109.6] and [Mb,Me] = [102.3,109.6]. (d) Filaments within low density void-like regions extracted with parameters[Sb,Se] = [10−2.5,100.5] and [Mb,Me] = [100.5,103.5]. For both sets of filaments, the value of Ts is set to 0.05.
9d. Each shows filaments in a different environmental densityregime. Figure 9b shows filaments that exist near and withinthe high density cluster like regions. These are the filamentsthat form the spine of the cosmic web. Figure 9d showsfilaments within void-like regions. The combination of densitycriteria and interactive visualization enables us to zoom in onthis system of intra-void filaments. They are the faint residualsof the smaller-scale filaments that constituted the spine of thecosmic web at earlier cosmic epochs, and as such representa direct manifestation of the hierarchical buildup of cosmicstructure. At the current epoch, the intra-void filaments appearto define a different pattern than the prominent filamentarybridges between clusters of galaxies. As a result of the tidalinfluence of surrounding large-scale mass concentrations theyare conspicuously aligned along a direction correlated with themain axis of the embedding void.
6 CONCLUSION
We have presented a Topology based Framework, namedFelix, to probe filament structure in the large scale universe.The framework is particularly designed to probe filamentary
structures in different density regimes, and optimally preservestructural detail in regimes of interest. While other cosmicstructure analysis tools do not include a facility to select web-like features according to tailor-made aspects and characteris-tics, this is precisely the mission of the Felix procedure. Wedirected Felix towards a case study of the the filamentary in-frastructure and architecture of cosmic voids and demonstratedthat it successfully extracts the network of tenuous filamentspervading their interior [72], [73], [74], [75] .
In an accompanying study, we plan to exploit the Felixfacility to study the physical characteristics of the extractedsamples of intra-void filaments. This also involves their haloand subhalo population, their gas content, and the relation ofthese with the embedding voids and surrounding large-scalemass distribution. This will be of key importance towardsunderstanding the formation and evolution of void galaxies[82], [83], [84] and specifically that of the issue of the missingdwarf galaxies [69]. In addition, following the recognition thatvoid architecture represents a potentially sensitive probe ofdark energy and dark matter and a keen test of modified gravitytheories [9], [10], [11], [12], [13], [14], [15], [16], the filamentsamples extracted by Felix will be subjected to a systematic
IEEE TRANSACTIONS ON VISUALIZATION AND COMPUTER GRAPHICS, VOL. X, NO. X, JANUARY XXXX 13
study of their dependence on cosmological parameters.As an immediate extension, we plan to use Felix with other
scalar fields such as the tidal force field. Another possibledirection is the visualization and analysis of the hierarchy ofvoids, walls, and filaments in cosmological datasets. Interac-tive visual exploration of these intricate structural networksremains a challenging and largely unexplored problem ofmajor significance.
ACKNOWLEDGMENT
Vijay Natarajan would like to acknowledge funding fromDepartment of Science and Technology, India. Grant No.SR/S3/EECE/0086/2012. Rien van de Weygaert acknowledgessupport by the John Templeton Foundation grant nr. FP5136-O.
REFERENCES
[1] J. R. Bond, L. Kofman, and D. Pogosyan, “How filaments of galaxiesare woven into the cosmic web,” Nature, vol. 380, pp. 603–606, 1996.
[2] R. van de Weygaert and J. R. Bond, “Clusters and the Theory of theCosmic Web,” in A Pan-Chromatic View of Clusters of Galaxies andthe Large-Scale Structure, ser. Lecture Notes in Physics, Berlin SpringerVerlag, M. Plionis, O. Lopez-Cruz, and D. Hughes, Eds., vol. 740, 2008,p. 335.
[3] A. H. Guth, “Inflationary universe: A possible solution to the horizonand flatness problems,” Physical Review D, vol. 23, pp. 347–356, 1981.
[4] A. D. Linde, “Coleman-Weinberg theory and the new inflationaryuniverse scenario,” Physics Letters B, vol. 114, pp. 431–435, 1982.
[5] ——, “Scalar field fluctuations in the expanding universe and the newinflationary universe scenario,” Physics Letters B, vol. 116, pp. 335–339,1982.
[6] D. N. Spergel et al., “Three-Year Wilkinson Microwave AnisotropyProbe (WMAP) Observations: Implications for Cosmology,” Astrophys-ical Journal Supplement Series, 2007.
[7] E. Komatsu et al., “Seven-year Wilkinson Microwave AnisotropyProbe (WMAP) Observations: Cosmological Interpretation,” Astrophys-ical Journal Supplement Series, 2011.
[8] P. Collaboration et al., “Planck 2013 results. XVI. Cosmological param-eters,” arXiv preprint arXiv:1303.5076, 2013.
[9] B. S. Ryden and A. L. Melott, “Voids in Real Space and in RedshiftSpace,” Astrophys. J., vol. 470, p. 160, 1996.
[10] J. D. Schmidt, B. S. Ryden, and A. L. Melott, “The Size and Shapeof Voids in Three-dimensional Galaxy Surveys,” Astrophys. J., vol. 546,pp. 609–619, 2001.
[11] D. Park and J. Lee, “Void Ellipticity Distribution as a Probe ofCosmology,” Physical Review Letters, vol. 98, no. 8, 2007.
[12] G. Lavaux and B. D. Wandelt, “Precision cosmology with voids:definition, methods, dynamics,” MNRAS, vol. 403, pp. 1392–1408, 2010.
[13] E. G. P. Bos, R. van de Weygaert, K. Dolag, and V. Pettorino, “Thedarkness that shaped the void: dark energy and cosmic voids,” MNRAS,vol. 426, pp. 440–461, 2012.
[14] G. Lavaux and B. D. Wandelt, “Precision Cosmography with StackedVoids,” Astrophys. J. Lett., vol. 754, p. 109, 2012.
[15] J. Clampitt, Y.-C. Cai, and B. Li, “Voids in modified gravity: excursionset predictions,” MNRAS, vol. 431, pp. 749–766, 2013.
[16] P. M. Sutter, A. Pisani, B. D. Wandelt, and D. H. Weinberg, “Ameasurement of the alcock-paczynski effect using cosmic voids in thesdss,” MNRAS, vol. 443, pp. 2983–2990, 2014.
[17] J. Tyson, “Gravitational Lensing by Clusters of Galaxies,” in Encyclo-pedia of Astronomy and Astrophysics, P. Murdin, Ed., 2000.
[18] J.-P. Kneib and P. Natarajan, “Cluster lenses,” Astronomy & Astro-physics, vol. 19, p. 47, 2011.
[19] J. P. Dietrich, N. Werner et al., “A filament of dark matter between twoclusters of galaxies,” Nature, vol. 487, pp. 202–204, 2012.
[20] F. Hoyle, “The Origin of the Rotations of the Galaxies,” in Problems ofCosmical Aerodynamics, J. M. Burgers and H. C. van de Hulst, Eds.,1951, p. 195.
[21] P. J. E. Peebles, “Origin of the Angular Momentum of Galaxies,”Astrophys. J., vol. 155, p. 393, 1969.
[22] S. D. M. White, “Angular momentum growth in protogalaxies,” Astro-phys. J., vol. 286, pp. 38–41, Nov. 1984.
[23] J. Lee and U.-L. Pen, “Cosmic Shear from Galaxy Spins,” Astrophys. J.Lett., vol. 532, pp. L5–L8, 2000.
[24] B. J. T. Jones, R. van de Weygaert, and M. A. Aragon-Calvo, “Fossilevidence for spin alignment of Sloan Digital Sky Survey galaxies infilaments,” MNRAS, vol. 408, pp. 897–918, 2010.
[25] E. Tempel, R. S. Stoica, and E. Saar, “Evidence for spin alignmentof spiral and elliptical/S0 galaxies in filaments,” MNRAS, vol. 428, pp.1827–1836, 2013.
[26] P. Peebles, The Large Scale Structure of the Universe. Princeton Univ.Press, Princeton, New Jersey, 1980.
[27] S. F. Shandarin and I. B. Zeldovich, “Topology of the large-scalestructure of the universe,” Comments on Astrophysics, vol. 10, pp. 33–45, 1983.
[28] J. D. Barrow, S. P. Bhavsar, and D. H. Sonoda, “Minimal spanning trees,filaments and galaxy clustering,” MNRAS, vol. 216, 1985.
[29] M. Alpaslan, A. S. G. Robotham et al., “Galaxy and Mass Assembly(GAMA): fine filaments of galaxies detected within voids,” MNRAS, vol.440, pp. L106–L110, 2014.
[30] M. A. Aragon-Calvo, B. J. T. Jones, R. van de Weygaert, and J. M.van der Hulst, “Spin Alignment of Dark Matter Halos in Filaments andWalls,” Astrophys. J. Lett., vol. 655, pp. L5–L8, 2007.
[31] ——, “The multiscale morphology filter: identifying and extractingspatial patterns in the galaxy distribution,” Astron. Astrophys., vol. 474,pp. 315–338, 2007.
[32] N. A. Bond, M. A. Strauss, and R. Cen, “Crawling the cosmic network:identifying and quantifying filamentary structure,” MNRAS, vol. 409, pp.156–168, 2010.
[33] M. Cautun, R. van de Weygaert, and B. J. T. Jones, “NEXUS: tracingthe cosmic web connection,” MNRAS, vol. 429, pp. 1286–1308, 2013.
[34] O. Hahn, C. Porciani et al., “Properties of dark matter haloes in clusters,filaments, sheets and voids,” MNRAS, vol. 375, pp. 489–499, 2007.
[35] J. E. Forero-Romero, Y. Hoffman, S. Gottlober, A. Klypin, and G. Yepes,“A dynamical classification of the cosmic web,” MNRAS, vol. 396, pp.1815–1824, 2009.
[36] N. I. Libeskind, Y. Hoffman, A. Knebe, M. Steinmetz, S. Gottlober,O. Metuki, and G. Yepes, “The cosmic web and the orientation ofangular momenta,” MNRAS, vol. 421, pp. L137–L141, 2012.
[37] M. Cautun, R. van de Weygaert, B. J. T. Jones, and C. S. Frenk,“Evolution of the cosmic web,” ArXiv e-prints, 2014.
[38] S. F. Shandarin, “The multi-stream flows and the dynamics of the cosmicweb,” JCAP, vol. 5, pp. 15–+, 2011.
[39] T. Abel, O. Hahn, and R. Kaehler, “Tracing the dark matter sheet inphase space,” MNRAS, vol. 427, pp. 61–76, 2012.
[40] M. C. Neyrinck, “Origami constraints on the initial-conditions arrange-ment of dark-matter caustics and streams,” MNRAS, vol. 427, pp. 494–501, 2012.
[41] S. Shandarin, S. Habib, and K. Heitmann, “Cosmic web, multistreamflows, and tessellations,” Phys. Rev. D, vol. 85, 2012.
[42] R. S. Stoica, V. J. Martınez, and E. Saar, “A three-dimensional objectpoint process for detection of cosmic filaments.” Journal of the RoyalStatistical Society: Series C (Applied Statistics) 56 (4), 459-477, vol. 56,p. 1, 2007.
[43] R. Stoica, P. Gregori, and J. Mateu, “Simulated annealing and objectpoint processes: Tools for analysis of spatial patterns,” StochasticProcesses and their Applications, 2005.
[44] E. Tempel, R. S. Stoica, E. Saar, V. J. Martinez, L. J. Liivamagi,and G. Castellan, “Detecting filamentary pattern in the cosmic web: acatalogue of filaments for the SDSS,” preprint arXiv:1308.2533, 2013.
[45] C. Genovese, M. Perone-Pacifico, I. Verdinelli, and L. Wasserman,“Minimax Manifold Estimation,” ArXiv e-prints, 2010.
[46] H. Blum, “A Transformation for Extracting New Descriptors of Shape,”Models for the Perception of Speech and Visual Form, 1967.
[47] J. Milnor, “Morse theory,” Journal of Mathematical Physics, 1963.[48] H. Edelsbrunner, J. Harer, and A. Zomorodian, “Hierarchical Morse
Complexes for Piecewise Linear 2-manifolds,” in Proc. of Symp. onComp. Geom., 2001, pp. 70–79.
[49] E. Platen, R. van de Weygaert, and B. J. T. Jones, “A cosmic watershed:the WVF void detection technique,” MNRAS, vol. 380, pp. 551–570,2007.
[50] M. A. Aragon-Calvo, E. Platen et al., “The Spine of the Cosmic Web,”Astrophys. J., vol. 723, pp. 364–382, 2010.
[51] H. Edelsbrunner, D. Letscher, and A. Zomorodian., “Topological per-sistence and simplification,” Disc. & Comp. Geom., vol. 28, no. 4, pp.511–533, 2002.

IEEE TRANSACTIONS ON VISUALIZATION AND COMPUTER GRAPHICS, VOL. X, NO. X, JANUARY XXXX 14
[52] T. Sousbie, “The persistent cosmic web and its filamentary structure I.Theory and implementation,” MNRAS, vol. 414, pp. 350–383, 2011.
[53] T. Sousbie, C. Pichon, and H. Kawahara, “The persistent cosmic weband its filamentary structure II. Illustrations,” MNRAS, vol. 414, no. 1,pp. 384–403, 2011.
[54] D. Gunther, H.-P. Seidel, and T. Weinkauf, “Extraction of dominantextremal structures in volumetric data using separatrix persistence,”Comp. Graph. Forum, vol. 31, no. 8, pp. 2554–2566, 2012.
[55] J. Reininghaus, N. Kotava et al., “A scale space based persistencemeasure for critical points in 2d scalar fields,” IEEE Trans. Vis. & Comp.Graphics, vol. 17, no. 12, pp. 2045–2052, 2011.
[56] T. Weinkauf and D. Gunther, “Separatrix persistence: extraction ofsalient edges on surfaces using topological methods,” in Proc. of Symp.on Geom. Proc., 2009, pp. 1519–1528.
[57] D. Gunther, J. Reininghaus, H. P. Seidel, and T. Weinkauf, “Notes on thesimplification of the Morse-Smale complex,” in Topological Methods inData Analysis and Visualization III, ser. Mathematics and Visualization,P.-T. Bremer, I. Hotz, V. Pascucci, and R. Peikert, Eds. SpringerInternational Publishing, 2014.
[58] W. E. Schaap and R. van de Weygaert, “Continuous fields and discretesamples: reconstruction through delaunay tessellations,” arXiv, vol. 363,pp. L29–L32, 2000.
[59] R. van de Weygaert and W. Schaap, “The Cosmic Web: GeometricAnalysis,” in Data Analysis in Cosmology, ser. Lecture Notes in Physics,Berlin Springer Verlag, V. J. Martınez, E. Saar, E. Martınez-Gonzalez,and M.-J. Pons-Borderıa, Eds., vol. 665, 2009, pp. 291–413.
[60] “Computational Geometry Algorithms Library,” http://www.cgal.org.[61] A. Gyulassy, V. Natarajan et al., “Efficient computation of Morse-Smale
complexes for three-dimensional scalar functions,” IEEE Trans. Vis. &Comp. Graphics, vol. 13, no. 6, pp. 1440–1447, 2007.
[62] H. Edelsbrunner, J. Harer, V. Natarajan, and V. Pascucci, “Morse-Smalecomplexes for piecewise linear 3-manifolds,” in Proc. of Symp. on Comp.Geom., 2003, pp. 361–370.
[63] R. Forman, “A user’s guide to discrete Morse theory,” SeminaireLotharingien de Combinatoire, vol. 48, 2002.
[64] A. Gyulassy, P.-T. Bremer et al., “A practical approach to Morse-Smalecomplex computation: Scalability and generality,” IEEE Trans. Vis. &Comp. Graphics, vol. 14, no. 6, pp. 1619–1626, 2008.
[65] V. Robins, P. Wood, and A. Sheppard, “Theory and algorithms forconstructing discrete Morse complexes from grayscale digital images,”IEEE Trans. on Pattern Analysis and Machine Intelligence, vol. 33,no. 8, pp. 1646–1658, 2011.
[66] N. Shivashankar, M. Senthilnathan, and V. Natarajan, “Parallel com-putation of 2D Morse-Smale complexes,” IEEE Trans. Vis. & Comp.Graphics, vol. 18, no. 10, pp. 1757–1770, 2012.
[67] N. Shivashankar and V. Natarajan, “Parallel computation of 3D Morse-Smale complexes,” Computer Graphics Forum, vol. 31, no. 3pt1, pp.965–974, 2012.
[68] S. Codis, C. Pichon et al., “Connecting the cosmic web to the spin ofdark haloes: implications for galaxy formation,” MNRAS, vol. 427, pp.3320–3336, 2012.
[69] P. J. E. Peebles, “The Void Phenomenon,” Astrophys. J, vol. 557, pp.495–504, 2001.
[70] M. A. Aragon-Calvo, R. van de Weygaert, and B. J. T. Jones, “Multiscalephenomenology of the cosmic web,” MNRAS, vol. 408, pp. 2163–2187,2010.
[71] A. Gyulassy, N. Kotava et al., “Direct feature visualization using Morse-Smale complexes,” IEEE Trans. Vis. & Comp. Graphics, vol. 18, no. 9,pp. 1549–1562, 2012.
[72] R. van de Weygaert and E. van Kampen, “Voids in GravitationalInstability Scenarios - Part One - Global Density and Velocity Fieldsin an Einstein - De-Sitter Universe,” MNRAS, vol. 263, 1993.
[73] R. K. Sheth and R. van de Weygaert, “A hierarchy of voids: much adoabout nothing,” MNRAS, vol. 350, pp. 517–538, 2004.
[74] R. v. d. Weygaert, “Voronoi tessellations and the cosmic web: Spatialpatterns and clustering across the universe,” in ISVD ’07: Proc. of Symp.on Voronoi Diagrams in Science and Engineering. Washington, DC,USA: IEEE Computer Society, 2007, pp. 230–239.
[75] M. A. Aragon-Calvo and A. S. Szalay, “The hierarchical structure anddynamics of voids,” MNRAS, vol. 428, pp. 3409–3424, 2013.
[76] R. van de Weygaert and V. Icke, “Fragmenting the universe. II - Voronoivertices as Abell clusters,” Astron. Astrophys., vol. 213, pp. 1–9, 1989.
[77] R. van de Weygaert, Voids and the geometry of large scale structure.PhD thesis, University of Leiden, 1991.
[78] E. Komatsu et al., “Five-Year Wilkinson Microwave Anisotropy ProbeObservations: Cosmological Interpretation,” Astrophysical Journal Sup-plement Series, vol. 180, no. 2, 2009.
[79] T. Ishiyama, S. Rieder et al., “The Cosmogrid Simulation: StatisticalProperties of Small Dark Matter Halos,” Astrophys. J., vol. 767, 2013.
[80] Y. B. Zel’dovich, “Gravitational instability: An approximate theory forlarge density perturbations,” Astronomy & astrophysics, vol. 5, pp. 84–89, 1970.
[81] S. Rieder, R. van de Weygaert, M. Cautun, B. Beygu, and S. PortegiesZwart, “Assembly of filamentary void galaxy configurations,” MNRAS,vol. 435, pp. 222–241, 2013.
[82] R. van de Weygaert, K. Kreckel et al., “The Void Galaxy Survey,” inEnvironment and the Formation of Galaxies: 30 Years Later, I. Ferrerasand A. Pasquali, Eds., 2011, p. 17.
[83] K. Kreckel, E. Platen et al., “Only the Lonely: H I Imaging of VoidGalaxies,” Astron.J., vol. 141, p. 4, 2011.
[84] ——, “The Void Galaxy Survey: Optical Properties and H I Morphologyand Kinematics,” Astron.J., vol. 144, p. 16, 2012.
Nithin Shivashankar is a doctoral candidateat the Department of Computer Science andAutomation, Indian Institute of Science, Banga-lore. He holds a bachelors degree in computerscience from the Manipal Institute of Technology.His research interests include scientific visual-ization and computational topology.
Pratyush Pranav is working for his PhD degreeat the Kapteyn Astronomical Institute, Gronin-gen, the Netherlands. He received a bachelorsdegree from St. Stephens college, Delhi, India,and holds a Masters degree from the Depart-ment of Physics at the Indian Institute of Sci-ence, Bangalore, India. His research interests in-clude computational topology, cosmology, largescale structures in the Universe and Scientificvisualization.
Vijay Natarajan is an associate professor atthe Indian Institute of Science, Bangalore. Hereceived the Ph.D. degree in computer sciencefrom Duke University in 2004 and holds the B.E.degree in computer science and M.Sc. degreein mathematics from Birla Institute of Technol-ogy and Science, Pilani, India. His researchinterests include scientific visualization, compu-tational geometry, computational topology, andmeshing.
Rien van de Weygaert is professor of cosmicstructure formation at the Kapteyn Astronomi-cal Institute of the University of Groningen. Hereceived his Ph.D. in astrophysics at LeidenUniversity in 1991 on the role of cosmic voids inthe large scale mass distribution in the Universe.His research interests are cosmology, the largescale structure of the Universe, cosmic struc-ture formation, galaxy formation and evolution,computational geometry and topology, and thehistory of astronomy.
Patrick Bos is a PhD student at the Kapteyn As-tronomical Institute of the University of Gronin-gen in The Netherlands. He studies alterna-tive models of dark energy through simulationsand tries to find new probes to disentangle thenature of dark energy. He is also involved inbuilding high-dimensional statistical models andtechniques for inferring the initial conditions ofthe universe.
Steven Rieder is a postdoctoral researcher atRIKEN Advanced Institute for ComputationalScience, Japan. He received his Ph.D. degreein astrophysics at Leiden University in 2013, onthe topic of multi-scale N-body simulations. Hisresearch interests include computational astro-physics, the large scale structure of the Uni-verse, galaxy formation and evolution and theformation and disruption of star clusters.