ieee/acm transactions on networking, vol. 16, …shavitt/pub/16tnet01-shavitt.… · ·...
TRANSCRIPT

IEEE/ACM TRANSACTIONS ON NETWORKING, VOL. 16, NO. 1, FEBRUARY 2008 1
Hyperbolic Embedding of Internet Graph for DistanceEstimation and Overlay ConstructionYuval Shavitt, Senior Member, IEEE, and Tomer Tankel, Student Member, IEEE
Abstract—Estimating distances in the Internet has been studiedin the recent years due to its ability to improve the performance ofmany applications, e.g., in the peer-to-peer realm. One scalable ap-proach to estimate distances between nodes is to embed the nodes insome dimensional geometric space and to use the pair distancesin this space as the estimate for the real distances. Several algo-rithms were suggested in the past to do this in low dimensional Eu-clidean spaces.
It was noted in recent years that the Internet structure has ahighly connected core and long stretched tendrils, and that mostof the routing paths between nodes in the tendrils pass throughthe core. Therefore, we suggest in this work, to embed the Internetdistance metric in a hyperbolic space where routes are bent towardthe center. We found that if the curvature, that defines the extendof the bending, is selected in the adequate range, the accuracy ofInternet distance embedding can be improved.
We demonstrate the strength of our hyperbolic embedding withtwo applications: selecting the closest server and building an appli-cation level multicast tree. For the latter, we present a distributedalgorithm for building geometric multicast trees that achieve goodtrade-offs between delay (stretch) and load (stress). We also presenta new efficient centralized embedding algorithm that enables theaccurate embedding of short distances, something that have neverbeen done before.
I. INTRODUCTION
I NTERNET distance estimation is important to improve per-formance of many applications, such as peer-to-peer appli-
cation and application layer multicast. The network distancematrix can be compactly represented by mapping its nodes toa real geometric space. Such a mapping, called embedding, isdesigned to preserve the distance between any pair of networknodes close to the distance between their geometric images. Asmall subset of nodes, called Tracers, is embedded first, con-sidering all inter Tracer distances. The coordinates of each ofthe other nodes is calculated by minimizing the distortion of thedistances from this node to several or all Tracers. Euclidean em-bedding for predicting network distances was first suggested byNg and Zhang [1], which named it Global Network Positioning(GNP). Lim et al. [2] suggest to use uncorrelated and orthogonalCartesian coordinates to replace the minimization suggested atGNP. Tang and Crovella [3] suggest to use Lipschitz embed-ding, which ignore the distance between Tracers, and thus isless accurate.
Manuscript received January 21, 2005; revised December 14, 2005, and July19, 2006; approved by IEEE/ACM TRANSACTIONS ON NETWORKING EditorZ.-L. Zhang.
The authors are with the School of Electrical Engineering, The Iby and Al-adar Fleischman Faculty of Engineering, Tel-Aviv University, Israel (e-mail:[email protected]; [email protected]).
Digital Object Identifier 10.1109/TNET.2007.899021
Recently, we introduced BBS [4], a new numerical methodfor Euclidean embedding. Euclidean BBS had achieved thelowest embedding distortion with relatively low complexitycompared to other numerical methods. In particular for APembedding, defined hereon, our method was more accurate andfar more scalable than DHS, the numerical method of GNP.While we achieved good embedding in [4] the results are farfrom perfect due to the Internet AS topology structure, whichwas shown to have a core in the middle and many tendrilsconnected to it [5], [6].
To understand the problem, consider embedding of the In-ternet in two dimensions. If the tendrils are placed with the cor-rect distance from the core and are well spaced in all directions,the distance between them in the plane makes a shortcut notpassing through the core and thus underestimates the real graphdistance. Embedding in higher dimension space enables us tospread the tendrils tips farther apart, and thus improves the em-bedding, but at some point an increase in the number of dimen-sions gives us diminishing return. To overcome this effect andthus improve distance estimation accuracy, we introduced in [4]a threshold criteria above which simple triangulation is used.Although the threshold can be tuned, it does not reveal the geo-metric shape of the Internet structure.
In this paper we take a new and different approach for embed-ding the Internet graph in a geometric space. The core idea is tobend the line between two points in the tendrils to pass throughthe core and thus, follow the true Internet route. To make thishappen we use hyperbolic geometric space where a distanceunit decreases as one moves away from the origin. The calcula-tion of distances in hyperbolic spaces is not significantly harderthan in Euclidean spaces, which makes our approach practical.Our algorithm embeds the Internet graph into a hyperbolic spacewith preselected curvature, but was found to be insensitive to theexact curvature value. Therefore, we obtained the curvature tobe used by an off-line iterative guessing algorithm. We were ableto improve the performance of three applications: delay estima-tion (which can be used for QoS threshold estimation), serverselection, and application level multicast.
A. Embedding Algorithms
An integrated embedding mechanism consists of three ingre-dients that distinguish it from its counterparts. The geometricspace and the geometric distance function it defines is the firstingredient. The second ingredient is the algorithm of selectingone or more subsets of the pair distances in a given input metric.The third is the numerical method that calculates from the inputof subset pair distances, the coordinates of each node, whichminimize the symmetric distortion of these pairs. The symmetric
1063-6692/$25.00 © 2008 IEEE
2 IEEE/ACM TRANSACTIONS ON NETWORKING, VOL. 16, NO. 1, FEBRUARY 2008
pair distortion is defined for each pair as the maximum of theratio between the original and the geometric distance and its in-verse. The three selection algorithms we are aware of are
1) All Pairs (AP)2) Two phase (TP)3) Log-Random and Neighbors (LRN)The input to AP Euclidean embedding is the entire -nodes
metric, and these distance pairs are embedded atonce.
In TP Euclidean embedding, named GNP in [1], a smallsubset of Tracers is embedded first, considering all
pair distances. The coordinates of other nodesare calculated from their distance to several or all Tracers byminimizing the symmetric distortion of these node-Tracerdistance pairs.
We introduce here a third selection algorithm calledLog-Random and Neighbors (LRN) embedding. Short dis-tance pairs were largely overlooked by previous research, sincetheir estimation errors were insignificant in some applicationssuch as server selection. In [4] we compared distance estimationaccuracy of GNP, TP Euclidean BBS, and IDMaps triangula-tion. For small distances, below 20% of the network diameter,all these methods yielded large relative estimation errors. TPembedding completely ignores the neighbor distances, whereasthe input of AP embedding consists all distancepairs, which is not a practical alternative. Aiming to increaseneighbor distances accuracy, the LRN algorithm concurrentlyembed a subset of the entire metric, comprising the pairs whosedistance is below a certain threshold, and the set of randomlysampled pairs. The pairs in are selected uniformly at randomwith probability , and thus . The distancethreshold is selected so that the number of distance pairs belowthe threshold is also . Thus, the total number of pairsin the embedded subset is .
Although the number of input pairs to LRN is similar to thatof TP embedding, LRN cannot be calculated distributively sinceit embeds all the nodes concurrently. The CPU complexity ofthe LRN calculation is higher than TP embedding, thus, BBSwas the only scalable method that could handle medium to largeLRN group sizes, .
B. Internet Embedding in Hyperbolic Space
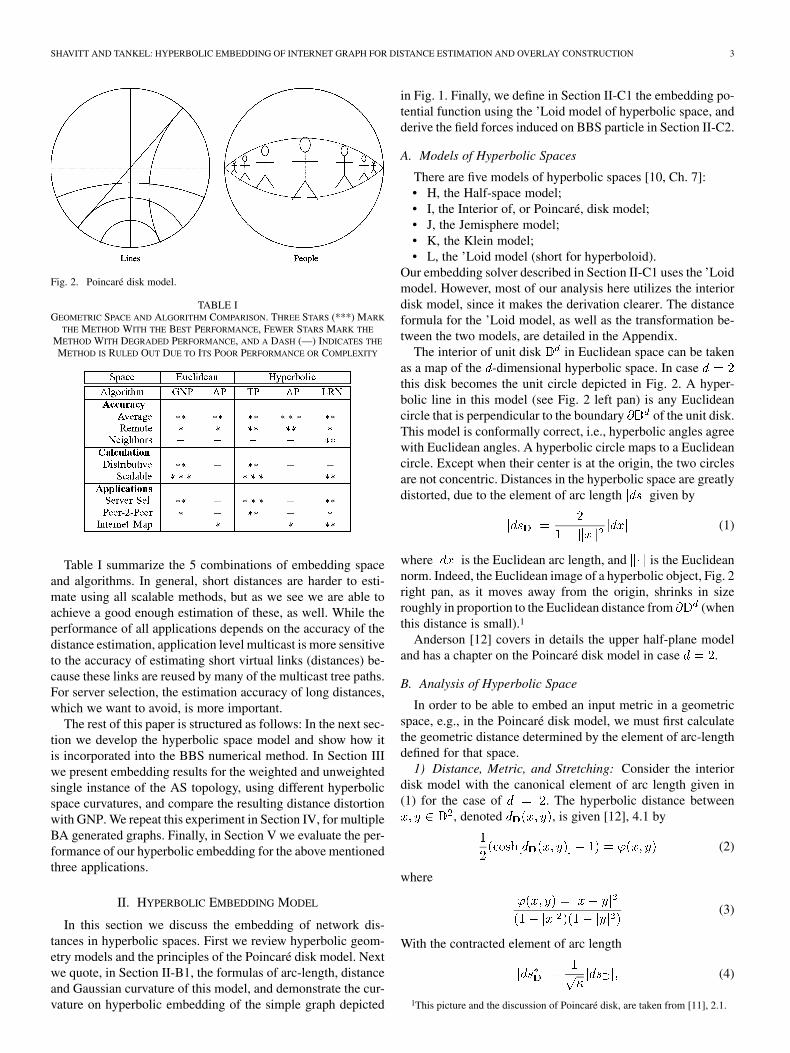
As an Euclidean line, the hyperbolic line between two pointsis defined, as the parametric curve, connecting between thepoints, over which the integral of arc length is minimized.Unlike the Euclidean line, a hyperbolic line bends toward theorigin point, , see Fig. 2. The amount of bent depends onthe curvature of the hyperbolic space. As the space curvatureincreases, the bending becomes larger, and thus the hyperbolicdistance between the points increases.
The Internet structure has been the subject of many recentworks. Researchers have looked at various features of the In-ternet graph, and proposed theoretical models to describe itsevolvement. Faloutsos et al. [7] experimentally discovered thatthe degree distribution of the Internet AS and router level graphsobey a power law. Barabási and Albert [8], [9] developed anevolutionary model of preferential attachment, that can be usedfor generating topologies with power-law degree distributions.
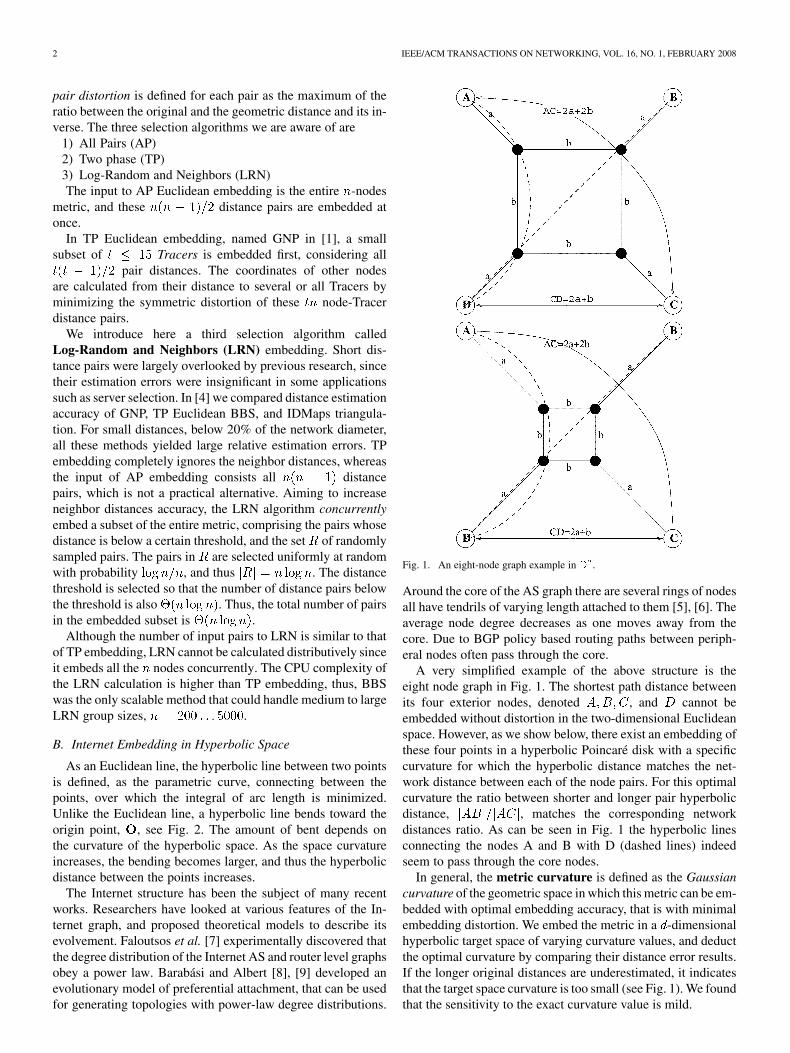
Fig. 1. An eight-node graph example in .
Around the core of the AS graph there are several rings of nodesall have tendrils of varying length attached to them [5], [6]. Theaverage node degree decreases as one moves away from thecore. Due to BGP policy based routing paths between periph-eral nodes often pass through the core.
A very simplified example of the above structure is theeight node graph in Fig. 1. The shortest path distance betweenits four exterior nodes, denoted , and cannot beembedded without distortion in the two-dimensional Euclideanspace. However, as we show below, there exist an embedding ofthese four points in a hyperbolic Poincaré disk with a specificcurvature for which the hyperbolic distance matches the net-work distance between each of the node pairs. For this optimalcurvature the ratio between shorter and longer pair hyperbolicdistance, , matches the corresponding networkdistances ratio. As can be seen in Fig. 1 the hyperbolic linesconnecting the nodes A and B with D (dashed lines) indeedseem to pass through the core nodes.
In general, the metric curvature is defined as the Gaussiancurvature of the geometric space in which this metric can be em-bedded with optimal embedding accuracy, that is with minimalembedding distortion. We embed the metric in a -dimensionalhyperbolic target space of varying curvature values, and deductthe optimal curvature by comparing their distance error results.If the longer original distances are underestimated, it indicatesthat the target space curvature is too small (see Fig. 1). We foundthat the sensitivity to the exact curvature value is mild.
SHAVITT AND TANKEL: HYPERBOLIC EMBEDDING OF INTERNET GRAPH FOR DISTANCE ESTIMATION AND OVERLAY CONSTRUCTION 3
Fig. 2. Poincaré disk model.
TABLE IGEOMETRIC SPACE AND ALGORITHM COMPARISON. THREE STARS (***) MARK
THE METHOD WITH THE BEST PERFORMANCE, FEWER STARS MARK THE
METHOD WITH DEGRADED PERFORMANCE, AND A DASH (—) INDICATES THE
METHOD IS RULED OUT DUE TO ITS POOR PERFORMANCE OR COMPLEXITY
Table I summarize the 5 combinations of embedding spaceand algorithms. In general, short distances are harder to esti-mate using all scalable methods, but as we see we are able toachieve a good enough estimation of these, as well. While theperformance of all applications depends on the accuracy of thedistance estimation, application level multicast is more sensitiveto the accuracy of estimating short virtual links (distances) be-cause these links are reused by many of the multicast tree paths.For server selection, the estimation accuracy of long distances,which we want to avoid, is more important.
The rest of this paper is structured as follows: In the next sec-tion we develop the hyperbolic space model and show how itis incorporated into the BBS numerical method. In Section IIIwe present embedding results for the weighted and unweightedsingle instance of the AS topology, using different hyperbolicspace curvatures, and compare the resulting distance distortionwith GNP. We repeat this experiment in Section IV, for multipleBA generated graphs. Finally, in Section V we evaluate the per-formance of our hyperbolic embedding for the above mentionedthree applications.
II. HYPERBOLIC EMBEDDING MODEL
In this section we discuss the embedding of network dis-tances in hyperbolic spaces. First we review hyperbolic geom-etry models and the principles of the Poincaré disk model. Nextwe quote, in Section II-B1, the formulas of arc-length, distanceand Gaussian curvature of this model, and demonstrate the cur-vature on hyperbolic embedding of the simple graph depicted
in Fig. 1. Finally, we define in Section II-C1 the embedding po-tential function using the ’Loid model of hyperbolic space, andderive the field forces induced on BBS particle in Section II-C2.
A. Models of Hyperbolic Spaces
There are five models of hyperbolic spaces [10, Ch. 7]:• H, the Half-space model;• I, the Interior of, or Poincaré, disk model;• J, the Jemisphere model;• K, the Klein model;• L, the ’Loid model (short for hyperboloid).
Our embedding solver described in Section II-C1 uses the ’Loidmodel. However, most of our analysis here utilizes the interiordisk model, since it makes the derivation clearer. The distanceformula for the ’Loid model, as well as the transformation be-tween the two models, are detailed in the Appendix.
The interior of unit disk in Euclidean space can be takenas a map of the -dimensional hyperbolic space. In casethis disk becomes the unit circle depicted in Fig. 2. A hyper-bolic line in this model (see Fig. 2 left pan) is any Euclideancircle that is perpendicular to the boundary of the unit disk.This model is conformally correct, i.e., hyperbolic angles agreewith Euclidean angles. A hyperbolic circle maps to a Euclideancircle. Except when their center is at the origin, the two circlesare not concentric. Distances in the hyperbolic space are greatlydistorted, due to the element of arc length given by
(1)
where is the Euclidean arc length, and is the Euclideannorm. Indeed, the Euclidean image of a hyperbolic object, Fig. 2right pan, as it moves away from the origin, shrinks in sizeroughly in proportion to the Euclidean distance from (whenthis distance is small).1
Anderson [12] covers in details the upper half-plane modeland has a chapter on the Poincaré disk model in case .
B. Analysis of Hyperbolic Space
In order to be able to embed an input metric in a geometricspace, e.g., in the Poincaré disk model, we must first calculatethe geometric distance determined by the element of arc-lengthdefined for that space.
1) Distance, Metric, and Stretching: Consider the interiordisk model with the canonical element of arc length given in(1) for the case of . The hyperbolic distance between
, denoted , is given [12], 4.1 by
(2)
where
(3)
With the contracted element of arc length
(4)
1This picture and the discussion of Poincaré disk, are taken from [11], 2.1.

4 IEEE/ACM TRANSACTIONS ON NETWORKING, VOL. 16, NO. 1, FEBRUARY 2008
the hyperbolic distance is also contracted by , i.e.,
(5)
Let denote an input metric, being embedded into a Hy-perbolic space with the contracted element of arc length definedby (4). Consider a stretched metric, , being embedded inhyperbolic space with canonical element of arc length, .The canonical hyperbolic distance approximates the stretchedmetric, that is
(6)
Dividing by and substituting (5) we find
Thus embedding of the stretched metric, , in space withcanonical arc length, is equivalent to embedding of the inputmetric in space with the contracted element of arc length, .
2) Hyperbolic Curvature: The Gaussian curvature of ametric induced by an element of arc length isgiven by
(7)
where denote the Laplacian
For the interior disk model, the element of arc length given in(1) is , yielding
(8)
Similarly the Gaussian curvature for the contracted element ofarc length (4) is given by
(9)
Namely, by contracting the element of arc length we can achieveany curvature in the Interior disk model.
3) Embedding Example in Disk: Examine the eight nodegraph of Fig. 1 and consider the four exterior nodes, denoted A,B, C, and D. These four nodes measure the internodal distancesamong themselves. The induced metric is
and . Dividingthe two metric values we have
(10)
where is the ratio between the length of the inner andouter edges of the graph. Taking the limit as approaches 0or we have
Fig. 3. The Hyperbolic curvature of the graph from Fig. 1.
(11)
Embedding of this metric in Euclidean plane must form aA-B-C-D square with diagonal length of .Substituting in (10) and extracting, we see that only the ratio
can be exactly embedded in Euclidean plane.However, in the Hyperbolic disk, the metric curvature can
be adjusted to achieve an exact embedding of all values. Wenormalize the multiplier by the maximal metric value, anddefine
(12)
Due to metric symmetry the four points must be placed ona circle centered at the unit disk origin. We can assumethat the points reside on the XY axis at the four points
. Substituting the stretched dis-tance pairs and for in (2) we get
(13)
(14)
Multiplying (13) by 2, subtracting it from (14), and substituting(10) we obtain
(15)
This implicit function can be solved numerically, and the an-alytic derivative can then be calculated.Fig. 3 depicts the resulting normalized curvature and its firstderivative for the interval .
C. Hyperbolic Embedding Solver
Embedding of network distances in geometric space is a map-ping between its nodes to points in the -dimensional space,

SHAVITT AND TANKEL: HYPERBOLIC EMBEDDING OF INTERNET GRAPH FOR DISTANCE ESTIMATION AND OVERLAY CONSTRUCTION 5
such that the geometric distances between pairs of points ap-proximates the input network distances metric .
1) BBS Embedding Method: For calculating this mappingwe use the same minimization method we used earlier for Eu-clidean embedding [4], with adaptations to Hyperbolic space.This method, Big-Bang Simulation or BBS, minimizes the en-ergy of a set of particles, traveling in the geometric space underthe affect of a force field. Each of the network nodes is repre-sented by a particle. We define the potential energy as the em-bedding error
(16)
Here are vectors designating the coordinatesof the network nodes in the Hyperbolic space . The pairembedding error is the embedding error of the distance be-tween a pair of particles.
Our embedding solver uses the ’Loid model of hyperbolicspace, which averts the distance singularity on the boundary ofthe Poincaré disk. As in [4] we divide the embedding into fourcalculation phases. The phase pair embedding error function de-noted by , assumes the form
(17)
where is the Hyperbolic distance in , the upper sheetof hyperboloid
(18)
(19)
For simplicity, we denote . At the end ofeach phase, the particles reach a least energy configuration. Fi-nally, at the end of the last phase, each network node is mappedto the coordinates of the corresponding particle in the final lowenergy configuration.
2) Potential Field Force: The particle movement equationsand their initial conditions were derived in [4], sec. 2 that dis-cusses friction force and other implementation details. The po-tential force field in Hyperbolic space is different from the Eu-clidean space, since the two distance expressions differ. We thusredo here the calculation of potential force field for Hyperboliccase.
The field force that is derived from the potential energy(16), is given by
(20)
(21)
where denotes the pair hyperbolic distancebetween and , and its gradient with respect tois given by
(22)
III. HYPERBOLIC EMBEDDING IN REAL TOPOLOGIES
In Section III-B we use the Internet router topology extractedfrom Tel-Aviv University DIMES database [13] dated October23–24, 2005. In Sections III-C and III-D we use the AS topologyinstance from the University of Oregon RouteViews databasedated March 31, 2001.
A. Experiment Details and Legend
We use two measures to compare the accuracy• Symmetric Pair Distortion Defined for each node pair as
the maximum of the ratio of the measured to the geometricdistance, and its inverse.
• Directional relative error Defined by [1], (4) as the ratioof the difference between the geometric and measured dis-tances, to the minimum of the two distances.
The Symmetric pair distortion can be calculated by adding 1 tothe absolute value of the directional relative error [4].
We experiment with different curvatures of the target hyper-bolic space. In Section II-B2 we showed that embedding a givenmetric in hyperbolic space with curvature is equivalent to em-bedding the metric in canonical hyperbolicspace. Before stretching we first divide the distances of eachmetric by
(23)
The following legend notations were used in all the figures:“GNP” stands for DHS (which was used by GNP) and “HYP,#”stands for hyperbolic BBS with normalized stretch “#”. Positivestretch stands for dividing by for AP and TP,respectively, whereas negative stretch, that is legend “HYP,-#”,stands for dividing by , and for TP and LRN, re-spectively.
In each experiment we select a group of the router or ASnodes, called an overlay, and embed the shortest-path distancesamong these overlay nodes. The overlay from the routerstopology in Section III-B consists of the 190 traced accessrouters of the DIMES agents used to measure the routertopology instance. We combined the traceroute information Forthis relatively small overlay we evaluate the relative distanceerror of all pairs of overlay members. In Sections III-C andIII-D, two overlays of 2000 low degree AS nodes are randomlyselected from the AS topology. We select 400 of the overlayASs, and evaluate for each one of them the relative error of alldistance pairs from it to all other 1999 overlay members.
B. Embedding Measured Internet Distances
To generate the router level topology, we selected about 900DIMES agents and performed UDP traceroute to each other.

6 IEEE/ACM TRANSACTIONS ON NETWORKING, VOL. 16, NO. 1, FEBRUARY 2008
After combining agents with the same first hop address (agentsin the same LAN), and removing nodes that were either unreach-able or could not perform UDP traceroute, we were left with540 nodes. Due to the way the experiment was executed, we didnot receive all the possible distances between node agent pairs.Thus, we removed all nodes that did not measure to enoughother nodes and were left with 460 nodes. Among them we hadalmost 35 000 measured paths (we used the shortest of the twounidirectional paths between two nodes), which constitute 33%of the node pairs.
The simulated Tracers were selected randomly among the 31nodes that could see over 90% of the other nodes, and no twoTracers from the same AS were selected. We end up with sixnodes in the USA, one in Denmark, three in Great Britain, onein Norway, two in Israel, and two in Australia. Only two ofthe Tracers were inside universities, at UTDallas and TAU. 350nodes were seen by all these Tracers, and the rest were seen byat least 10 of them.
We compare our TP hyperbolic embedding results withEuclidean Down-Hill-Simplex (DHS) embedding, the methodused in Global-Network-Positioning (GNP) [1]. For this com-parison we did not to compare hyperbolic BBS with EuclideanBBS, since for a small number or Tracers, , EuclideanBBS and GNP, yields similar intra-Tracers distortion [4],and are thus comparable. For TP embedding we selected thesame Tracers used in Section V-A, and embed all 15node-Tracer distances.
The centralized step of the TP embedding, that is the embed-ding of the Tracers matrix holding Tracer-Tracerpairs (Fig. 4), is very efficient compared to other embedding al-gorithms. For instance the embedding in -dimensionalspace, took 0.5 and 1.75 CPU seconds for -stretchedand -stretched, respectively, on a PIV-1.5 GHz. Eu-clidean DHS embedding of the same matrix took 0.33 seconds.Indeed with larger curvature HYP is considerably slower thanGNP. Nevertheless, HYP’s absolute CPU time is negligible,considering that the centralized step is performed infrequently.
Fig. 4 compares Euclidean and Hyperbolic embedding, fordifferent embedding dimensions . Fig. 4(c) depictsthe 5, 25, 50, 75, and 95 percentile lines of the directional rel-ative error. In Figs. 4(a) and (b) depict the accuracy statisticsof embedding of the measured hop distance and delay, respec-tively. The mean and median relative error and its standard de-viation are depicted on the left, center and, in reverse -axis, onthe right side respectively.
Fig. 4(a) indicates that GNP has slightly better median andaverage error but its variance is significantly worse. This factcan be clearly seen even for , where it performs best, inFig. 4(c). Fig. 4(b) shows that there is no clear advantage foreither method. The results above are depicted in more detailsin Section V-A. The surprising finding regarding delay, may beattributed to the strong correlation of Internet delay with geo-graphic distance, while BGP policy routing is more dominantregarding hop distance.
C. Two-Phase Hop Distance Embedding
The distribution of the directional relative error, estimatinghop distance in the AS topology, is depicted in Fig. 5. The re-
Fig. 4. DIMES Router Relative Error versus Embedding Dimension and Cur-vature: (a) & (c) hop count, (b) delay.
sults of five-dimensional TP embedding, with HYP and GNP,are depicted on the top part. We select the Tracers ran-domly among overlay members and embed all 15 node-Tracerdistances.
The frequency of pair distances is depicted by the thick blackcurve. We group the directional relative errors for the same
network hop distance pairs. The vertical lines correspond to in-tegral hop distance, in the unweighted AS graph. The methodmarker is placed at the average directional relative error, and thestar marker depicts the median. Each method line has whiskersat the 5, 25, 75, and 95 percentiles.
As we reported in [4], GNP underestimates longerhop distances, having negative relative errors. The
-stretched metric has the best relative hop error.For 4–6 hops distances the 5 to 95 HYP relative error percentiles

SHAVITT AND TANKEL: HYPERBOLIC EMBEDDING OF INTERNET GRAPH FOR DISTANCE ESTIMATION AND OVERLAY CONSTRUCTION 7
Fig. 5. AS Graph Relative Hops Error.
are inside , compared to forGNP. In the two-hops distances the corresponding percentilesare for HYP, compared to for GNP.
The interval of relative error for which the rounded distanceis an exact estimate of the hop distance ,
is depicted in Fig. 5 between the GNP and TP percentile lines.For 3–7 hops distances the hop distance estimate of HYP coor-dinates is exact in 70 of the pairs!
D. LRN Hop Distance Embedding
The results of five-dimensional LRN embedding are depictedon the bottom of Fig. 5. The dotted black curve depicts thefrequency of the pairs embedded by LRN, whereasthe solid black curve depicts the frequency of the other pairs.Each curve is scaled by its maximum frequency to enable plot-ting both curves together. The input to LRN embedding is iden-tical to the one in Section III-C(two overlays of the AS topology,each containing nodes). As indicated by the twocurves, the group members are not directly connected to eachother, as expected for stub ASs. Because the neighboring pairsthreshold is a hard limiter, all two-hops pairs are embedded.There are approximately two-hops pairs, while there areless than half random pairs . As in the case of APembedding, only BBS could handle 2000 members group andconcurrently embed over 70 distance pairs. The CPU time,running on PIV-1.5 GHz, was up to 300 seconds.
The dashed vertical lines, with “HYP k” legend, depict thedirectional relative error percentiles of embedded pairs, whereasthe solid vertical lines depict percentiles of other pairs.
As expected, for short distance pairs, LRN is far more accu-rate than TP (and GNP). For two-hops distances the hop dis-tance estimate of LRN is exact in over 75% of the pairs, andjust 5% of all pairs are overestimated. This higher accuracy of
two-hops pairs, is gained by compromising accuracy forthe rest of the pairs which are three-hops or more apart.Indeed, among four to six hops distances, the 5 to 95 HYP rela-tive error percentiles are inside , which is approx-
imately double than the gap of TP HYP with similarcurvature.
IV. HYPERBOLIC EMBEDDING OF GENERATED
POWER-LAW GRAPHS
We evaluate the hyperbolic embedding of five 1000 nodeBarabási–Albert (BA) topologies [9]. The overlay nodes areselected at random from the group of low degree nodes. For
we evaluate the relative embedding error of allpairs. For , we select members,
and evaluate for each one of them the relative error of all dis-tance pairs from it to all other members.
To increase the confidence each experiment was conductedusing 3 sets of random weights per generated topology. Theweights drawn here, are i.i.d. random variables, distributeduniformly in the interval [1,1000]. From each random weightsgraph we embedded two random overlays as explained above.Namely each point in the comparison graph results from 30embedding experiments, 6 per a generated BA topology.
Fig. 6(a) compares TP HYP and GNP with different embed-ding dimensions. We select the Tracers randomly amongoverlay members and embed all 15 node-Tracer distances. Themean standard deviation of the relative estimation error are de-picted on the left and, in reverse -axis, on the right side, re-spectively. The accuracy of our method is far better than GNPfor all HYP stretch values. The figure also demonstrate the in-sensitivity to the curvature: for , there is little differencebetween stretch values 6 to 9. Fig. 6(b) compares TP HYP andGNP, with embedding dimension , for different overlapsizes ranging from 20 to 800 members.
The standard deviation with optimal HYP stretch is minimaland the mean error is closest to 0. The common optimal stretchfor all overlay sizes and larger embedding dimensions is
, moreover, all values in the rangegives superb results.
V. APPLICATIONS
In this section, we evaluate Two-Phase embedding withvarying hyperbolic curvature, in three applications: delay es-timation, server selection, and application level multicast. Wepresent only TP results, since the TP embedding can be com-puted distributively, while LRN requires central calculation.
A. Delay Estimation
In this application we are interested in estimating the delaybetween a single source node and all other nodes of the graph.This can be used by a VoIP exchange that can connect its clientseither through its (almost) free Internet connection, or if thedelay is too long through the POTS system.
The distribution of the directional relative estimation error,for the DIMES Router topology of Section III-B, are depictedin Fig. 7. The measured Route Delay and Path Length results aredepicted in Fig. 7(a) and (b), respectively. The delay and pathlength data were measured during two days, October 23–24,2005, among 460 DIMES agents. The results of seven-dimen-sional TP hyperbolic embedding are compared with GNP. All

8 IEEE/ACM TRANSACTIONS ON NETWORKING, VOL. 16, NO. 1, FEBRUARY 2008
Fig. 6. Generated BA graphs with random weights. Relative error versus groupsize, embedding dimension and curvature.
HYP and GNP embedding depicted in Fig. 7 use Tracersand 15 host-Tracer measurements.
In order to capture the distribution of the estimation error, wegroup the pair distances in 25 ms wide bins. Surprisingly, forthis experiment the difference between HYP and GNP was neg-ligible (see Fig. 7(a)). However, the picture is different for thehop distance as depicted in Fig. 7(b). While the average direc-tional relative error is similar for both methods, GNP has a no-ticeable larger spread almost for the entire hop distance range.
B. Server Selection
This experiment used two Internet AS data sets, the Univer-sity of Oregon RouteViews dataset and the combined Route-View with looking glass and router registry, as described in [14].The nine couples of peering data sets were collected weeklystarting March 2001. To increase the confidence each experi-ment was conducted using 3 sets of random weights per each ofthe peering topologies.
Following [15] we randomly selected 10 mirror servers andestimated the closet mirror to each of the rest of the graph nodes
Fig. 7. DIMES router map relative error: (a) delay and (b) minimum hop.
acting as clients. A client’s decision is considered correct if itselects the mirror whose client-mirror distance is at mosttimes the optimal distance. We used . For each mirrorgroup, rank accuracy is defined as the percentage of correctclient decisions.
Fig. 8 depicts the average cumulative distribution function(CDF) of rank accuracy for the IDMaps, GNP, and TP HYPmethods. For all three methods, we used in this experiment
low degree Tracers and 8 measurements per node. Eachmark is the average of the CDFs from the sim-ulated graphs, where each CDF consists of 300 mirror groupexperiments performed on a single graph. Marks denoted withthe postfix depict the effect of the “leaf correction” proce-dure. In leaf correction, the distances from a degree-1 node areestimated by the geometric distance to the adjacent node, plusthe distance between the degree-1 node and the correspondingneighbor.
Figs. 8(a) and (b) depicts the results for the RouteViewsdataset, and for the combined dataset, respectively. IDMapsranking performance are nearly perfect, achieving at least 98.5correct answers in 99% of the mirror experiments. GNP how-ever, has the worst ranking accuracy, due to underestimating ofall the distances, and is thus ruled out as a practical method for

SHAVITT AND TANKEL: HYPERBOLIC EMBEDDING OF INTERNET GRAPH FOR DISTANCE ESTIMATION AND OVERLAY CONSTRUCTION 9
Fig. 8. RouteViews AS graph with random weights: mirror selection for var-ious curvatures.
server selection with accuracy . Our method rankingaccuracy improves with increasing the embedding curvature,and is comparable with IDMaps performance for the stretchof . For the RouteViews dataset, our performanceeven slightly supersedes IDMaps, achieving, at least, 99 correctanswers in 99 of the mirror group experiments.
C. Application Level Multicast
In application level multicast [16], [17], we wish to build amulticast tree without network support. To make the tree effi-cient, we need to know the distances among the multicast groupnodes. Otherwise, one may build a tree where the delay to somenodes is a large multiple of the unicast delay.
The first scalable approach for building application layer mul-ticast trees was CAN [18], [19] and its derivatives [20], [21].Due to the high accuracy of our embedding we are presentingsmaller stretch factors for distances, i.e., the delays on our treesare shorter, while maintaining good stress factor distribution,namely, most of our tree links are not congested.
Fig. 9. RouteViews AS graph with random weights: 3-D multicast tree layout.
An alternative tree-first approach is NICE application multi-cast [22], which creates a hierarchy of clusters while selectingthe same or adjacent cluster for all nodes that are “close by”.CAN and NICE both have low, and thus scalable, link stress andcontrol overhead. However, NICE incurs higher control load onthe root node and its direct descendants.
We are given a multicast group, , which is a subset of thegraph nodes, a source node, ; and we construct , amulticast tree from to all the nodes in . Latency Stretch is de-fined per member as the ratio of the path lengthalong the tree from to to the length of the direct unicastpath. Link Stress is defined per link of the underlying topologyand counts the number of identical packets sent between mem-bers of M over that link. This definition of stress, following [23],is from the network’s perspective, rather than the application’s.
Fig. 9(a) depicts the three-dimensional multicast tree con-structed by our algorithm. Fig. 9(b) and (c) depict the hyperbolicdistance stretch and node stress of that tree. The constructed treefollows the structure of the underlying “physical” network, andthus reduces the latency stretch. The tree roots are the 20 largestdegree nodes, depicted by the marker in the vicinity of the hy-perbolic origin. From these roots the tree descends to mediumdegree nodes and then reaches the leaves that are the lowest de-gree nodes.
The JoinNode procedure listed in Fig. 10 is run by nodesthat join the multicast tree and by tree nodes with large latencystretch that wish to reduce this stretch. The procedure descendsdown the tree in BFS order searching for candidate parents forthe given node . In the first BFS iteration it scans the orphansgroup . If no candidate parent is found in this iteration thanis added to the orphans group .
Otherwise, each of the following iterations (lines 2-8) checksthe children of the candidate parent nodes found in the previousBFS iteration. The number of candidate parents found in each it-eration is bounded (line 5). Only the candidate parents thatare the nearest to are scanned in the next BFS iteration. Afterthe last BFS iteration that does not find any more candidates,assigns the nearest available candidate found in all iterations asits parent. A parent is considered available if the number of itschildren is smaller than (line 8).
The QueryBranch(Broot, ) function listed in Fig. 11 checksthe children of a given node Broot and returns the ones which

10 IEEE/ACM TRANSACTIONS ON NETWORKING, VOL. 16, NO. 1, FEBRUARY 2008
Fig. 10. The JoinNode function.
Fig. 11. The QueryBranch function.
are candidate parents of . For a node to be a candidate parentof , it must satisfy the two conditions in line 2
• ’s -distance is less than ’s -distance• ’s -distance is small relative to ’s -distance
Alternatively, if and satisfies the above two conditions withswitched roles (line 4), then if or the ’s distance fromits current parent is less than its distance from ,then assigns as its parent (line 6).
The tree origin distance of an orphan node is givenby , i.e., the hyper-bolic distance to the origin. For the rest of the tree nodes
, that is the dis-tance along the tree path to their root ancestor plus ancestor’sorigin distance.
Our Iterative-Geometric-Tree (IGT) (see Fig. 12) assumesno topology or routing information from the underlying “phys-ical” network, and uses only the hyperbolic coordinates, as-signed by the embedding of each node. For clarity, the algorithmis presented as central. However, the algorithm can be easily dis-tributed since all data structures used, except the orphans groups
, can be managed locally by each of the nodes.Following are the parameter values for the IGT algorithm:
Fig. 12. The Iterative Geometric Tree algorithm.
Initially, all nodes execute JoinNode once, and are assignedeither to an existing parent or to the orphans group . Theconstructed tree is then improved by several rewire sweeps. Allrecently rewired nodes, having , participate in the nextrewire sweep. Each such node compares (line 7, Fig. 12) itstree origin distance with its hyperbolic distance to the origin.If the tree distance is significantly larger than the hyperbolicdistance the node executes the JoinNode function again. Ifthe new parent reduces the tree distance significantly, thenthe node rewires to the new parent. The algorithm ends after
sweeps or if the ratio of rewired nodes tois less then .
To evaluate our algorithm we performed the following ex-periment. Select members of randomly among low-degreenodes of the graph. Use TP embedding with Tracers and15 measurements per node to embed these nodes in five-dimen-sional Hyperbolic space, and run our IGT algorithm from 40 dif-ferent source nodes. We also use TP embedding in five-dimen-sional Euclidean space, and run the Geometric-Multicast-Treealgorithm of [24], Fig. 10 from these source nodes.
Fig. 13(a) depicts the calculation results on the AS topologyinstance from the University of Oregon RouteViews databasedated January 2, 2000, for a group of members. Weuse the same legend as above, which is “HYP,#” for hyperbolicBBS with normalized stretch “#”. The legend “GNP” marks theGeometric Multicast Tree algorithm which run using GNP co-ordinates.
The complementary distribution function, depicted on the lefthand side, was aggregated from latency stretches of all the nodes
, from each of the 40 source nodes. The average stressfrequency, depicted on the right hand side, is the total numberof links having a given stress value, averaged over the 40 sourcenode trees.
The multicast tree in application level multicast is constructedfrom shorter pairs, among which LRN estimation is more accu-rate. Nevertheless, TP performance is better since the two-hoppairs consist of the distance pairs, which are negligibleamong pairs for which TP estimation is better.

SHAVITT AND TANKEL: HYPERBOLIC EMBEDDING OF INTERNET GRAPH FOR DISTANCE ESTIMATION AND OVERLAY CONSTRUCTION 11
Fig. 13. Latency Stretch versus Stress and multicast group size: (a) RouteviewsAS graph with random weights, (b) generated GA-Tech graph.
Fig. 13(a) shows a clear trade-off between stretch and stress.An increase in the HYP curvature yields smaller (better)stretch and larger (worse) stress. The stress of GNP is sim-ilar to “HYP,-25” stress, with normalized stretch .However, the 95 percentile latency stretch of HYP with thiscurvature is 1.95, compared to 11.2 of GNP (omitted fromplotted range).
For comparison with [19], [23] we performed the above ex-periment also for a Transit-Stub topology of 10000 nodes. Theeffect of multicast tree size on latency stretch is depicted inFig. 13(b). With normalized stretch ( marker) ouraverage latency stretch depicted on the left graph, is comparablewith topology aware CAN [19], Fig 9. Note that results for CANassume global and perfect knowledge of the topology.
VI. CONCLUDING REMARKS
Given the fact that Internet distances tend towards the core,we suggested to embed the Internet graph in hyperbolic space.We showed that this idea works well for generated power-lawgraphs (Fig. 6), and for calculated minimum hop distances ofthe RouteViews AS topology. Indeed, all three studied applica-tions distance estimation, mirror selection, and application layermulticast (Figs. 7, 8, and 13, respectively) benefited from ourapproach.
However, for distances measured between endpoints in theInternet the picture is surprisingly different (Figs. 4 and 7). Forthe hop distance estimation, hyperbolic embedding is still betterthan Euclidean. Interestingly, for delay estimation there is noclear advantage for using the hyperbolic space. This puzzlingpoint is the subject of our future research.
APPENDIX
The following formulas for hyperbolic distance in ’Loidmodel, are derived in [11], 2.6. This ’Loid space is embeddedin the upper sheet of the hyperboloid (18), (19).
The Hyperbolic distance in ’Loid model is given by
(24)
where denotes the Minkowski inner product, defined as
(25)
Here and are defined by (19). The hyperboloid isisometrically transformed to the Poincaré disk
, via stereographic projection through the point. The equations of this transformation
are
(26)
In Poincaré Disk, , the hyperbolic distance between eachpair , is given in [12], 4.1 by,
(27)
(2), where is given by (3). Applying the Euclidean cosinelaw in the triangle and substituting with thenormalized inner product yields

12 IEEE/ACM TRANSACTIONS ON NETWORKING, VOL. 16, NO. 1, FEBRUARY 2008
Substituting the images of the projected ,respectively, as given in (26) we have
(28)
according to (24).
REFERENCES
[1] T. S. E. Ng and H. Zhang, “Predicting Internet network distance withcoordinates-based approaches,” Proc. IEEE , vol. 1, pp. 170–179, Jun.2002.
[2] H. Lim, J. C. Hou, and C. H. Choi, “Provisioning of network distanceservice on the Internet,” IEEE/ACM Trans. Netw., vol. 13, no. 3, 2005.
[3] Tang and M. Crovella, “Virtual landmarks for the Internet,” ACM In-ternet Measurement, Nov. 2003.
[4] Y. Shavitt and T. Tankel, “Big-Bang simulation for embedding networkdistances in Euclidean space,” IEEE/ACM Trans. Netw., pp. 993–1006,Dec. 2004, an earlier version appeared in IEEE INFOCOM 2003.
[5] L. Subramanian, S. Agarwal, J. Rexford, and R. Katz, “Characterizingthe Internet hierarchy from multiple vantage points,” in Proc. IEEEINFOCOM, 2002, pp. 618–627.
[6] L. Tauro, C. Palmer, G. Siganos, and M. Faloutsos, “A simple concep-tual model for the Internet topology,” Global Internet, Nov. 2001.
[7] M. Faloutsos, P. Faloutsos, and C. Faloutsos, “On power-law relation-ships of the Internet topology,” in ACM SIGCOMM 1999, Boston, MA,Aug./Sep. 1999.
[8] A.-L. Barabási and R. Albert, “Emergence of scaling in random net-works,” Science, vol. 286, pp. 509–512, Oct. 15, 1999.
[9] R. Albert and A.-L. Barabási, “Topology of evolving networks: Localevents and universality,” Phys. Rev. Lett., pp. 5234–5237, Dec. 2000.
[10] J. W. Cannon, W. J. Floyd, R. Kenyon, and W. R. Parry, , S. Levy, Ed., Hyperbolic Geometry. Cambridge, U.K.: Cambridge Univ. Press,1997.
[11] W. P. Thurston, The Geometry and Topology of Three-Manifolds.Princeton, NJ: Princeton Univ. Press, 1997.
[12] J. W. P. Anderson, Hyperbolic Geometry. New York: Springer, 2001.[13] Y. Shavitt and E. Shir, “DIMES: Let the Internet measure itself,” ACM
SIGCOMM Comput. Commun. Rev., vol. 35, no. 5, Oct. 2005.[14] Q. Chen, H. Chang, R. Govindan, S. Jamin, S. J. Shenker, and W. Will-
inger, “The origin of power laws in Internet topologies revisited,” inProc. IEEE INFOCOM, New York, NY, Apr. 2002, pp. 608–617.
[15] P. Francis, S. Jamin, C. Jin, Y. Jin, D. Raz, Y. Shavitt, and L.Zhang, “IDMaps: A global Internet host distance estimation service,”IEEE/ACM Trans. Netw., Oct. 2001.
[16] P. Francis, “YOID: Extending the Internet Multicast Architecture,”2000 [Online]. Available: http://www.icir.org/yoid
[17] S. Pendarakis, S. Shi, D. Verma, and M. Waldvogel, “ALMI: An ap-plication level multicast infrastructure,” in 3rd USNIX Symp. InternetTechn. Syst. (USITS’01), San Francisco, CA, Mar. 2001, pp. 49–60.
[18] S. Ratnasamy, P. Francis, M. Handley, R. Karp, and S. Shenker, “Ascalable content-addressable network,” ACM SIGCOMM, Aug. 2001.
[19] S. Ratnasamy, M. Handley, R. Karp, and S. Shenker, “Topology-awareoverlay construction and server selection,” in Proc. IEEE INFOCOM,Jun. 2002, pp. 1190–1199.
[20] Z. Xu and Z. Zhang, “Building low-maintenance expressways for p2psystems,” no. HPL-2002-41, 2001.
[21] Z. Xu, C. Tang, and Z. Zhang, “Building topology-aware overlays usingglobal soft-state,” Proc. ICDCS, May 2003.
[22] S. Banerjee, B. Bhattacharjee, and C. Kommareddy, “Scalable appli-cation layer multicast,” ACM SIGCOMM, Aug. 2002.
[23] S. Jain, R. Mahajan, and D. Wetherall, “A study of performance po-tential of dht-based overlays,” in Usenix Symp. Internet Technologies(USITS), Mar. 2003.
[24] Y. Shavitt and T. Tankel, “On the curvature of the interent and its usagefor overlay construction and distance estimation,” in Proc. IEEE IN-FOCOM, Mar. 2004, pp. 374–384.
Yuval Shavitt (S’88–M’97–SM’00) received theB.Sc. degree in computer engineering (cum laude),the M.Sc. degree in electrical engineering, and theD.Sc. degree from the Technion, Israel Instituteof Technology, Haifa, in 1986, 1992, and 1996,respectively.
From 1986 to 1991, he served in the Israel DefenseForces first as a System Engineer and the last twoyears as a Software Engineering Team Leader. Aftergraduation, he spent a year as a Postdoctoral Fellow atthe Department of Computer Science at Johns Hop-
kins University, Baltimore, MD. Between 1997 and 2001, he was a Memberof Technical Staff at the Networking Research Laboratory at Bell Labs, LucentTechnologies, Holmdel, NJ. Since October 2000, he has been a Faculty Memberin the School of Electrical Engineering at Tel-Aviv University, Tel-Aviv, Israel.
Dr. Shavitt served as a TPC member for INFOCOM 2000–2003 and 2005,IWQoS 2001 and 2002, ICNP 2001, IWAN 2002–2005, TRIDENTCOM2005–2006, and others, and on the executive committee of INFOCOM 2000,2002, and 2003. He was an Editor of Computer Networks from 2003 to 2004,and served as a Guest Editor for JSAC and JWWW. His recent researchfocuses on Internet measurement, mapping, and characterization and on QoSin networks.
Tomer Tankel (S’03) received the B.Sc. degree inscientific computation in 1986 and the M.Sc. degreein electrical engineering in 1992, both from Tel-AvivUniversity, Israel.
From 1992 to 2002, he worked as a Software Ar-chitect in subsidiaries of Comverse Tech. Since 2002,he has been a Ph.D. candidate in the School of Elec-trical Engineering at Tel-Aviv University, where heworks in the computer network laboratory. His re-search focuses on Internet mapping and peer-to-peernetworks.