ieq-jul2013-english · ihsan, shakira jones, alex sienaert, ashley taylor and violeta vulovic....
TRANSCRIPT

July 2013
Adjusting to pressures

July 2013
Time of adjustment

INDONESIA ECONOMIC QUARTERLY Adjusting to pressures
July 2013


Preface
The Indonesia Economic Quarterly (IEQ) has two main aims. First, it reports on the key developments over the past three months in Indonesia’s economy, and places these in a longer-term and global context. Based on these developments, and on policy changes over the period, the IEQ regularly updates the outlook for Indonesia’s economy and social welfare. Second, the IEQ provides a more in-depth examination of selected economic and policy issues, and analysis of Indonesia’s medium-term development challenges. It is intended for a wide audience, including policymakers, business leaders, financial market participants, and the community of analysts and professionals engaged in Indonesia’s evolving economy.
The IEQ is a product of the World Bank’s Jakarta office. The report is compiled by the Macro and Fiscal Policy Cluster, Poverty Reduction and Economic Management (PREM) Network, under the guidance of Jim Brumby, Sector Manager and Lead Economist, Ndiame Diop, Lead Economist and Economic Advisor, and Ashley Taylor, Senior Economist. The core project team, with responsibility for Part A (economic update), editing and production, comprises Gomez Agou, Arsianti, Magda Adriani, Fitria Fitrani, Brendan Coates, Ahya Ihsan, Shakira Jones, Alex Sienaert, Ashley Taylor and Violeta Vulovic. Administrative support is provided by Titi Ananto and Sylvia Njotomihardjo. Dissemination is organized by Dini Sari Djalal, Farhana Asnap, Indra Irnawan, Jerry Kurniawan, Nugroho, Marcellinus Winata and Randy Salim.
This edition of the IEQ also includes contributions from Timothy Brown, Werner Kornexl and Yue Man Lee (Section A.7, haze impacts discussion), (Edgar Janz, Matthew Wai-Poi and Vivi Alatas (Section B.1, social assistance measures), Mitchell Wiener and Iene Muliati (Section B.2, SJSN), Claudia Rokx and Roger Shrimpton (Section C.1 on nutrition), Erwin Ariadharma, Sheheryar Banuri, Zahid Hasnain, Richard Hooper, Matthew Kearney, Philip Keefer, Brendan Murphy, Staffan Synnerstrom and Maria Tambunan (Section C.2 on bureaucracy reform). Key input was also received from Ekaterine Vashakmadze (international update), Djauhari Sitorus, Neni Lestari and The Fei Ming (banking sector, credit and corporate sector update), Mark Ahern (bureaucracy reform), Darren Dorkin, Mega Kapoor, Eko Setyo Pambudi, Leslie Elder and Puti Marzoeki (nutrition). Soekarno Wirokartono provided in-depth comments. Edgar Janz provided invaluable editing assistance.
This report is a product of the staff of the International Bank for Reconstruction and Development / The World Bank, supported by funding from the Australian Government –– AusAID, under the Support for Enhanced Macroeconomic and Fiscal Policy Analysis (SEMEFPA) program.
The findings, interpretations, and conclusions expressed in this report do not necessarily reflect the views of the Executive Directors of The World Bank or the governments they represent, AusAID or the Australian Government. The World Bank does not guarantee the accuracy of the data included in this work. The boundaries, colors, denominations, and other information shown on any map in this work do not imply any judgment on the part of The World Bank concerning the legal status of any territory or the endorsement or acceptance of such boundaries. Cover and chapter photographs are by Josh Estey and copyright of the World Bank. All rights reserved.
For more World Bank analysis of Indonesia’s economy:
For information about the World Bank and its activities in Indonesia, please visit www.worldbank.org/id. In order to be included on an email distribution list for this Quarterly series and related publications, please contact [email protected]. For questions and comments relating to this publication, please contact [email protected].

July 2013 THE WORLD BANK | BANK DUNIAii
Table of contents
PREFACE III
EXECUTIVE SUMMARY: ADJUSTING TO PRESSURES VI
A. ECONOMIC AND FISCAL UPDATE 1
1. Emerging market assets fell sharply in recent months 1 2. The revised Budget: subsidized fuel prices raised and a larger deficit projected 3 3. Indonesia’s financial, currency and credit markets: a turbulent quarter 8 4. The outlook for the Indonesian economy has weakened 10 5. Inflation will increase temporarily following the rise in subsidized fuel prices 15 6. Indonesia’s current account deficit persists despite slowing import growth 18 7. Risks to the outlook remain heightened on domestic and external grounds 23
B. SOME RECENT DEVELOPMENTS IN INDONESIA’S ECONOMY 26
1. Examining the fuel subsidy compensation package 26 a. Short-term programs to protect poor and vulnerable households .............................................................. 27 b. Long-term programs to promote poor and vulnerable households ........................................................... 30
2. Indonesia’s challenge: implementing the new social security system 34 a. Putting the change in context: Where Indonesia is now ............................................................................ 34 b. Coverage, cost and fiscal sustainability considerations ............................................................................. 36 c. Administration, governance and capacity considerations .......................................................................... 37 d. Communication is key as part of a lengthy implementation process ........................................................ 39 e. Summary: a long journey towards comprehensive social security coverage .............................................. 39
C. INDONESIA 2014 AND BEYOND: A SELECTIVE LOOK 40
1. Indonesia: Facing up to the Double Burden of Malnutrition 40 a. The nature and serious consequences of the Double Burden of Malnutrition .......................................... 40 b. The Double Burden of Malnutrition is a serious and urgent problem in Indonesia ................................. 41 c. Understanding the causes of DBM in Indonesia ....................................................................................... 43 d. Addressing DBM in Indonesia ................................................................................................................... 45
2. Bureaucracy reform in Indonesia: progress and pitfalls 46 a. Impact of bureaucracy reform .................................................................................................................... 46 b. Sustainability of bureaucracy reform .......................................................................................................... 47 c. Restructuring and rightsizing in the Government of Indonesia ................................................................ 48 d. Streamlining government agencies ............................................................................................................. 49 e. Appointing staff to new structures .............................................................................................................. 49 f. Constraints and reform options for right-sizing ......................................................................................... 50
APPENDIX: A SNAPSHOT OF INDONESIAN ECONOMIC INDICATORS 51

July 2013 THE WORLD BANK | BANK DUNIAiv
LIST OF FIGURES
Figure 1: Emerging markets had a poor Q2, with EM equities further underperforming US stocks… ........................................................................................................................ 2
Figure 2: …coinciding with significant divergence in economic momentum across major economies .................................................................................................................... 2
Figure 3: Indonesian equities and domestic government bonds have also weakened sharply since May… ........................................................................................................................... 2
Figure 4: …amidst heavy net offshore selling of bonds and equities ............................................... 2 Figure 5: In coming years, fiscal savings are substantial, relative to “business as usual” spending
on fuel subsidies .......................................................................................................... 5 Figure 6: The Rupiah has appreciated on a nominal and real trade-weighted basis so far in 2013 9 Figure 7: Investment lending has eased in line with the slowing pace of real investment growth . 9 Figure 8: Residential house prices continue to accelerate despite slowing property lending
growth… ..................................................................................................................... 10 Figure 9: …with commercial property in Jabodetabek recording rapid price growth amid strong
demand ....................................................................................................................... 10 Figure 10: Real GDP growth continued to ease, with the contribution from investment narrowing
further .......................................................................................................................... 11 Figure 11: Nominal GDP remains weak, in line with weak growth in the GDP deflator ................ 11 Figure 12: The moderation in investment has largely been driven by a sharp drop off in foreign
machinery and equipment, and transportation .......................................................... 11 Figure 13: Mining sector output continues to be weak ................................................................... 12 Figure 14: Continued weakness in capital imports points to more weakness in fixed investment
growth… ..................................................................................................................... 13 Figure 15: …while high frequency economic indicators are suggestive of a continued moderation
in growth .................................................................................................................... 13 Figure 16: Projected headline inflation, with and without fuel subsidy reform .............................. 15 Figure 17: Inflation has moderated in recent months… ................................................................ 16 Figure 18: …as prices for a number of key food staples have fallen .............................................. 16 Figure 19: The balance of payments returned to deficit in Q1 ........................................................ 18 Figure 20: The non-oil and gas trade surplus widened in Q1 2013, before slipping back into a
small deficit in April… ............................................................................................... 19 Figure 21: …while a sizable oil and gas trade deficit has opened up since mid-2012 .................... 19 Figure 22: Capital goods have led a broad-based decline in imports… ......................................... 20 Figure 23: …while Indonesia’s export revenues are still pressured ................................................ 20 Figure 24: Indonesia’s exports have underperformed most of its regional peers ........................... 20 Figure 25: Manufacturing exports have been flat, amidst recent signs of weaker manufacturing
export growth in Asia ................................................................................................. 20 Figure 26: Low quality coal accounts for 20 percent of Indonesian coal exports and could be hit
by a Chinese ban ........................................................................................................ 21 Figure 27: External debt solvency metrics have improved but some liquidity risk indicators have
increased .................................................................................................................... 23 Figure 28: Private external debt is widely distributed across economic sectors ............................ 23 Figure 29: Indonesia’s foreign exchange reserves are substantial but so are external exposures . 24 Figure 30: Savings support a range of programs ............................................................................. 27 Figure 31: With BLSM, the poverty rate will continue to drop ....................................................... 30 Figure 32: Programs will significantly increase coverage of poor and vulnerable households… .. 31 Figure 33: …and benefit levels are increasing ................................................................................. 31 Figure 34: A growing proportion of middle-aged Indonesians are overweight .............................. 42 Figure 35: Hypertension is a significant problem amongst Indonesian adults… ......................... 44 Figure 36: …and a high proportion of Indonesians do not get enough physical exercise ............ 44

July 2013 THE WORLD BANK | BANK DUNIAv
LIST OF APPENDIX FIGURES
Appendix Figure 1: Quarterly and annual GDP growth.................................................................. 51 Appendix Figure 2: Contributions to GDP expenditures ............................................................... 51 Appendix Figure 3: Contributions to GDP production ................................................................... 51 Appendix Figure 4: Motor cycle and motor vehicle sales ............................................................... 51 Appendix Figure 5: Consumer indicators........................................................................................ 51 Appendix Figure 6: Industrial production indicators ..................................................................... 51 Appendix Figure 7: Real trade flows ............................................................................................... 52 Appendix Figure 8: Balance of payments ........................................................................................ 52 Appendix Figure 9: Goods exports .................................................................................................. 52 Appendix Figure 10: Goods imports ................................................................................................ 52 Appendix Figure 11: Reserves and portfolio capital inflows ........................................................... 52 Appendix Figure 12: Inflation and monetary policy ........................................................................ 52 Appendix Figure 13: Monthly breakdown of CPI ........................................................................... 53 Appendix Figure 14: Inflation comparison across countries .......................................................... 53 Appendix Figure 15: Domestic and international rice prices .......................................................... 53 Appendix Figure 16: Poverty and unemployment rate .................................................................... 53 Appendix Figure 17: Regional equity indices .................................................................................. 53 Appendix Figure 18: Dollar index and Rupiah exchange rate ........................................................ 53 Appendix Figure 19: 5-year local currency government bond yields .............................................. 54 Appendix Figure 20: Sovereign USD Bond EMBI spreads ............................................................ 54 Appendix Figure 21: International commercial bank lending ........................................................ 54 Appendix Figure 22: Banking sector indicators .............................................................................. 54 Appendix Figure 23: Government debt ........................................................................................... 54 Appendix Figure 24: External debt .................................................................................................. 54
LIST OF TABLES
Table 1: Under the baseline scenario, Indonesia’s growth is projected at 5.9 percent in 2013 ..... viii Table 2: Commodity prices remain under pressure .......................................................................... 3 Table 3: In 2013, fiscal savings from the fuel subsidy reform are modest, net of the sizable
compensation package ................................................................................................ 5 Table 4: The World Bank projects a fiscal deficit of 2.1 percent, slightly lower than in the
proposed revised Budget ............................................................................................. 5 Table 5: Budget execution for Jan – May has improved compared to previous years but remains
challenging ................................................................................................................... 6 Table 6: Under the baseline scenario GDP growth of 5.9 percent is projected for 2013, rising to
6.2 percent in 2014 ...................................................................................................... 14 Table 7: Compensation will reach 15.5 million households ............................................................ 27 Table 8: The DBM situation of Indonesia is one of the worst in ASEAN ..................................... 42 Table 9: There is survey evidence of better HR performance amongst bureaucracy reform-
participating institutions ........................................................................................... 47 Table 10: Selected constraints to restructuring and right-sizing and high level reform options ... 50
LIST OF APPENDIX TABLES
Appendix Table 1: Budget outcomes and projections .................................................................... 55 Appendix Table 2: Balance of Payments ......................................................................................... 55 Appendix Table 3: Indonesia’s historical macroeconomic indicators at a glance ......................... 56 Appendix Table 4: Indonesia’s development indicators at a glance .............................................. 57
LIST OF BOXES
Box 1: China’s proposed ban on low quality coal imports poses a risk to coal exports ................. 21 Box 2: External debt levels remain modest but liquidity risk has risen ......................................... 22

A d j u s t i n g t o p r e s s u r e s I n d o n e s i a E c o n o m i c Q u a r t e r l y
July 2013 THE WORLD BANK | BANK DUNIAvi
Executive summary: Adjusting to pressures
Adjusting to mounting pressures and new events, the second quarter of 2013 saw significant economic, policy and financial market developments in Indonesia
The second quarter of 2013 was an eventful one as Indonesia’s economy, policy settings and financial markets adjusted to pressures which have been mounting over recent quarters and to shifts in the global environment. Following slightly weaker-than-expected growth in the first quarter, there are signs that domestic demand, particularly investment, has continued to moderate. On the fiscal front, the combination of lower revenues and higher subsidy spending continued to pressure public finances. A revised Budget, incorporating a long-awaited increase in subsidized fuel prices, along with a comprehensive compensation package to reduce the impact of higher fuel prices on the poor, was approved on June 17. Meanwhile, international financial markets have reacted strongly to the prospect of quantitative easing in the US winding down in coming quarters, triggering a major sell-off in emerging market assets, including Indonesia, prompting Bank Indonesia (BI) to adjust interest rates higher.
International financial market volatility has increased…
Predicated on the new signals that the US Federal Reserve will likely end its bond purchase program by mid-2014, US Treasury yields rose markedly over the June quarter, with spillovers to international financial markets. This was reinforced by the recent growing signs of a significant divergence in economic momentum between key high income economies, notably the US and Japan, gaining steam, and major developing economies, notably China, growing at a slower pace than expected. These factors triggered a sharp sell-off of emerging market assets and increased market volatility, including in Indonesia. Many emerging market currencies slid against the US Dollar, the value of emerging equities fell by 7.5 percent over the quarter (as measured by the MSCI EM local currency index), and the cost of government financing rose markedly, with emerging market US Dollar bond spreads, for example, up by 50 basis points (as measured by the JP Morgan EMBIG index).
…and Indonesian asset prices have been impacted
Indonesian asset markets have corrected sharply in recent weeks, in line with other emerging markets. Foreign investors turned heavy net sellers of equities and government bonds in the latter part of the quarter, with outflows totaling approximately USD 3.6 billon from the start of May until the end of June. These outflows contributed to the 4 percent fall in Indonesian equities from the start of May through the end of the second quarter and the significant rise in the government bond yield curve, with yields climbing by 150-220 basis points since early

A d j u s t i n g t o p r e s s u r e s I n d o n e s i a E c o n o m i c Q u a r t e r l y
July 2013 THE WORLD BANK | BANK DUNIAvii
May. The Rupiah fell by 2 percent against the Dollar, despite significant intervention by BI, with currency reserves dropping by USD 2 billion in May to USD 105 billion.
External demand is projected to pick up only slowly in coming quarters
The World Bank continues to expect a steady, if gradual, increase in global economic growth in coming quarters. This reflects a projected slow acceleration in activity in high income economies, where growth remains generally sluggish but is on a firming trend, helped by a resilient US private sector recovery and prospects for stronger growth in Japan, while Euro Area economic conditions remain difficult. The growth trajectory of developing countries is also uneven, but is also expected to firm somewhat. Overall, Indonesia’s major trading partners are projected to grow by 3.4 percent in 2013, similar to the rate in 2012, but 0.3 percentage points lower than the March 2013 IEQ projection, reflecting below-expectation first quarter growth outcomes, such as in China. Major trading partner growth is projected to pick up to 4.0 percent in 2014. The still modest global growth outlook, and the strengthening of the US Dollar during the recent period of market turbulence, have also kept downward pressure on commodity prices, with the prices of Indonesia’s most important commodity exports declining significantly over the quarter.
A revised Budget has been approved and subsidized fuel prices have been increased
The revision of Indonesia’s Budget (APBN-P) for 2013 occurred against the backdrop of weaker financial market conditions and signs of disappointing growth momentum amongst some other developing countries. The key features of the revised Budget approved by Parliament were a revision of projected spending on fuel subsidies (to IDR 200 trillion), predicated on a near-term increase in subsidized fuel prices, and a package of compensation measures designed to reduce the impact of higher fuel prices on the poor. The 2013 deficit has been revised upwards by 0.7 percentage points to 2.4 percent of GDP, due to lower projected nominal revenues, in line with weaker anticipated GDP growth, and higher total expenditure (including on fuel subsidies, despite the recent increase in subsidized prices). The rise in subsidized fuel prices was made effective on June 22 with the subsidized petrol price rising by 44 percent to IDR 6,500 per liter and the subsidized diesel price increasing by 22 percent to IDR 5,500 per liter.
Though inherently uncertain, the fiscal savings due to the fuel subsidy reform may be substantial
The sizable increase in subsidized fuel prices is a major reform, and follows the missed opportunity to adjust prices in 2012. In the short-term it helps to cap the likely increase in the 2013 Budget deficit. Longer-term, the reform is part of a needed response to ongoing adjustments in Indonesia’s economy - increasing demand for imported energy due to strong growth coupled with declining domestic oil production and, crucially, the imperative to redirect fiscal spending more efficiently and more equitably in support of Indonesia’s development agenda. The World Bank estimates that the direct fiscal savings from the increase in subsidized fuel prices will be IDR 42 trillion in 2013, rising to IDR 85 trillion in 2014, the first full year in which the higher prices will apply. While significant, the base case estimated savings are inherently uncertain. A rise in global energy prices or continued weakening of the Rupiah could increase the gap between subsidized prices and the market price, pushing subsidy spending higher, notwithstanding the recent price adjustment. Therefore, there continues to be a strong case for building on this reform by increasing the flexibility of subsidized prices and bringing them more into line with market prices.
Higher temporary inflation is the main near-term macroeconomic impact
The macroeconomic impact of the fuel subsidy reform package is expected to be manageable and largely short-term in nature. The reform package is expected to have only a small net negative impact on growth in the near-term, with the negative impact on purchasing power for the poor substantially offset by the compensation package. The higher fuel prices will initially have a large impact on inflation, raising annual average inflation in 2013 by around 1.8 percentage points to 7.2 percent, peaking at around 9 percent year-on-year (yoy) towards the end of the year. However, the adjustment is a one-off shift of the price level, which means the impact on inflation will be unwound by mid-2014, assuming that long-term inflationary expectations are not affected and monetary policy is responsive to any signs of second-round, persistent price pressures. The World Bank estimates that the increase in subsidized fuel prices will narrow the current account deficit by a modest 0.2 percentage points of GDP in 2013, relative to a no-reform scenario. Over the medium-term,
A d j u s t i n g t o p r e s s u r e s I n d o n e s i a E c o n o m i c Q u a r t e r l y
July 2013 THE WORLD BANK | BANK DUNIAvii i
the impact on Indonesia’s external accounts is difficult to quantify but should be broadly positive, by encouraging the more efficient use of fuel imports and by bolstering investor confidence in Indonesia’s fiscal position and policies.
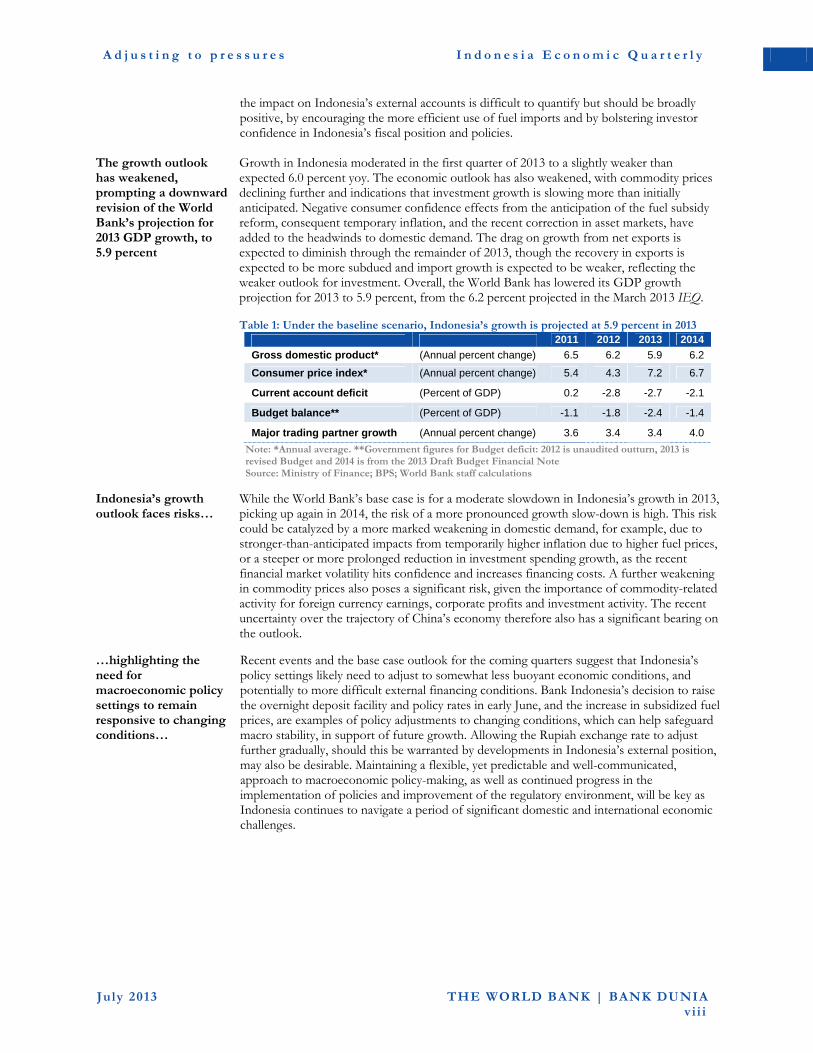
The growth outlook has weakened, prompting a downward revision of the World Bank’s projection for 2013 GDP growth, to 5.9 percent
Growth in Indonesia moderated in the first quarter of 2013 to a slightly weaker than expected 6.0 percent yoy. The economic outlook has also weakened, with commodity prices declining further and indications that investment growth is slowing more than initially anticipated. Negative consumer confidence effects from the anticipation of the fuel subsidy reform, consequent temporary inflation, and the recent correction in asset markets, have added to the headwinds to domestic demand. The drag on growth from net exports is expected to diminish through the remainder of 2013, though the recovery in exports is expected to be more subdued and import growth is expected to be weaker, reflecting the weaker outlook for investment. Overall, the World Bank has lowered its GDP growth projection for 2013 to 5.9 percent, from the 6.2 percent projected in the March 2013 IEQ. Table 1: Under the baseline scenario, Indonesia’s growth is projected at 5.9 percent in 2013
2011 2012 2013 2014
Gross domestic product* (Annual percent change) 6.5 6.2 5.9 6.2
Consumer price index* (Annual percent change) 5.4 4.3 7.2 6.7
Current account deficit (Percent of GDP) 0.2 -2.8 -2.7 -2.1
Budget balance** (Percent of GDP) -1.1 -1.8 -2.4 -1.4
Major trading partner growth (Annual percent change) 3.6 3.4 3.4 4.0
Note: *Annual average. **Government figures for Budget deficit: 2012 is unaudited outturn, 2013 is revised Budget and 2014 is from the 2013 Draft Budget Financial Note Source: Ministry of Finance; BPS; World Bank staff calculations
Indonesia’s growth outlook faces risks…
While the World Bank’s base case is for a moderate slowdown in Indonesia’s growth in 2013, picking up again in 2014, the risk of a more pronounced growth slow-down is high. This risk could be catalyzed by a more marked weakening in domestic demand, for example, due to stronger-than-anticipated impacts from temporarily higher inflation due to higher fuel prices, or a steeper or more prolonged reduction in investment spending growth, as the recent financial market volatility hits confidence and increases financing costs. A further weakening in commodity prices also poses a significant risk, given the importance of commodity-related activity for foreign currency earnings, corporate profits and investment activity. The recent uncertainty over the trajectory of China’s economy therefore also has a significant bearing on the outlook.
…highlighting the need for macroeconomic policy settings to remain responsive to changing conditions…
Recent events and the base case outlook for the coming quarters suggest that Indonesia’s policy settings likely need to adjust to somewhat less buoyant economic conditions, and potentially to more difficult external financing conditions. Bank Indonesia’s decision to raise the overnight deposit facility and policy rates in early June, and the increase in subsidized fuel prices, are examples of policy adjustments to changing conditions, which can help safeguard macro stability, in support of future growth. Allowing the Rupiah exchange rate to adjust further gradually, should this be warranted by developments in Indonesia’s external position, may also be desirable. Maintaining a flexible, yet predictable and well-communicated, approach to macroeconomic policy-making, as well as continued progress in the implementation of policies and improvement of the regulatory environment, will be key as Indonesia continues to navigate a period of significant domestic and international economic challenges.

A d j u s t i n g t o p r e s s u r e s I n d o n e s i a E c o n o m i c Q u a r t e r l y
July 2013 THE WORLD BANK | BANK DUNIAix
…and the importance of redirecting spending towards the most vulnerable, with the fuel subsidy reform compensation package contributing to this
The increase in social spending under the revised Budget, in part to help shield poor households from the impact of higher fuel prices, is significant, and the design of the social compensation package demonstrates the important steps being taken towards developing a more comprehensive, integrated and well-targeted social support system. The approved package of compensation measures totals IDR 29 trillion, or about three-quarters of the estimated total fuel subsidy savings in 2013. The compensation package comprises two main components. First, a Special Compensation Program, which includes an unconditional cash transfer (Bantuan Langsung Sementara Masyarakat, BLSM) for 15.5 million of Indonesia’s poorest households for a period of four months, the provision of additional rice to beneficiaries of the Rice for the Poor (Raskin) program, and additional spending on infrastructure programs. Second, under the Social Protection Acceleration and Expansion Program, spending on financial assistance programs for poor students and on the conditional cash transfer program (Program Keluarga Harapan, PKH), is being expanded. The evidence, based on Indonesia’s past experience with unconditional cash transfers, suggests that these measures can generally be expected to provide adequate, timely and effective assistance for protecting the poor and vulnerable households that are least able to cope with the effect of higher fuel prices, subject to minimizing implementation difficulties by focusing on monitoring and feedback systems and making continued improvements in targeting.
Over the longer-term, the implementation of Indonesia’s new national social security system could bring big improvements but will be challenging…
Social protection in Indonesia is also poised to be strengthened further when the new national social security system (Sistem Jaminan Sosial Nasional, SJSN) starts being implemented in 2014. The SJSN aims to provide all Indonesians with the same health coverage, pension (defined benefit), old-age savings (defined contribution), death benefits and work accident compensation. If well implemented, the SJSN programs can help to reduce vulnerability, protect against economic shocks, facilitate job mobility, reduce elderly poverty, help reduce inequality, and mobilize scarce savings. However, the success of the new system will ultimately depend on how well it is designed, implemented and managed. The Government’s efforts to implement a well-designed, fiscally sustainable, robust and comprehensive national social protection system will prove challenging and will require a series of major actions from the Government and relevant administrative bodies to succeed.
…and will take place against the backdrop of a changing social environment, including as the health needs of Indonesia’s population evolve over future decades
The health coverage programs of the SJSN will be rolled out as Indonesia faces health and nutrition problems of increasing complexity, driven by the processes of rapid development and urbanization. With a third of children under five stunted, not only is the capacity of the nation’s future workforce compromised, but their propensity for becoming overweight and suffering from cardiovascular diseases in later life is also greatly increased. Factors encouraging weight-gain, particularly for the growing share of Indonesians with urban lifestyles, are exacerbating the situation, such that overnutrition problems are already affecting the majority of adults. Unless action is taken now, not only to tackle maternal and child undernutrition, but also to tackle the overnutrition problems in older children and adults, the prevalence of Non-Communicable Diseases might increase dramatically, with negative consequences for economic development and social welfare.
Continuing to improve the efficiency of the civil service will be vital to meet Indonesia’s ambitious development goals
To enhance service delivery and increase the Government’s capacity to successfullyimplement ambitious new programs such as the SJSN, further improvements in the performance of Indonesia’s civil service bureaucracy will be required. Evidence suggests that the existing process of bureaucracy reform has already had a positive impact on human resources dynamics in participating institutions, including recruitment and promotion processes, and on staff productivity. Much more remains to be done, however, to sustain productivity gains while ensuring a sustainable public sector wage bill, and modernizing control systems and organizational design. Right-sizing of the government bureaucracy is a politically sensitive issue but one that has been prioritized by the Government. A number of legal, regulatory and capacity constraints to right-sizing remain to be overcome, but these can be feasibly addressed, and doing so will be an important step forward in the creation of a more efficient and effective civil service.

A d j u s t i n g t o p r e s s u r e s I n d o n e s i a E c o n o m i c Q u a r t e r l y
July 2013 THE WORLD BANK | BANK DUNIA1
A. Economic and fiscal update
1. Emerging market assets fell sharply in recent months
Emerging market assets fell sharply, adjusting to new information on quantitative easing and the global economic outlook…
International financial market developments in the second quarter have provided a stark reminder of the continued vulnerability of emerging markets, including Indonesia, to rapid changes in global financial conditions. The prospect of the unwinding of quantitative easing in the US, and reassessment of the relative economic growth trajectories of major high income and developing economies, triggered a major sell-off in emerging market assets. US Treasury yields began to rise sharply at the start of May, with the 10-year benchmark increasing by 80 basis points to 2.5 percent at the end of June. From the beginning of May through the end of June, the value of emerging market equities fell by 7 percent (as measured by the local currency MSCI EM index, Figure 1), and domestic bond yields and US Dollar bond spreads rose by 120 and 70 basis points, respectively (as measured by benchmark JP Morgan indices). Emerging market and commodity currencies like the Brazilian real, South African rand and Australian Dollar fell on the order of 10 percent.
…and Indonesia has also been significantly impacted
Indonesian asset markets have also corrected sharply in recent weeks, in tandem with other emerging markets. From the start of May through the end of the second quarter, Indonesian equities fell 4 percent, and foreigners were heavy net sellers of over IDR 18 trillion (USD 1.8 billon) in stocks, effectively erasing the substantial inflows seen previously in 2013 (Figure 4). The Government bond yield curve has risen and flattened significantly, with yields climbing by 150-220 basis points since early May. Foreign holdings of Indonesian bonds have also declined sharply, dropping by IDR 14 trillion (USD 1.4 billion) since April (Figure 4). The outflows from the Indonesian equity and bond markets in recent weeks do not appear disproportionate to those seen across other major emerging markets, many of which have also seen heavy outflows. Equity price performance has been comparable but domestic bonds have underperformed relative to many of Indonesia’s peers, with expectations since February of higher inflation due to higher subsidized fuel prices and a wider 2013 Budget deficit contributing to the upward pressure on yields.

A d j u s t i n g t o p r e s s u r e s I n d o n e s i a E c o n o m i c Q u a r t e r l y
July 2013 THE WORLD BANK | BANK DUNIA2
…as markets adjust to global policy changes and diverging economic momentum
The possible reduction of the US Federal Reserve’s bond purchasing program later this year reflects expectations that the US economy will continue to improve, following growth in Q1 of 1.8 percent annualized, up from 0.4 percent in Q4 2012, and most economic data in recent months surprising positively. In contrast, the recent performance of developing economies has been patchy. GDP growth in Brazil was just 2.2 percent in Q1 at an annualized pace and Indian real GDP was 4.7 percent higher than its year-ago level, close to the slowest pace of expansion since 2009. China’s GDP in Q1 was higher by 7.7 percent yoy (yoy) – strong growth, but below consensus expectations. The most recent available economic data point to a continued significant divergence in economic momentum between key high income economies (notably the US, Japan, and Germany) and major developing economies (notably China) (Figure 2).
Figure 1: Emerging markets had a poor Q2, with EM equities further underperforming US stocks… (US and EM benchmark equity indices, Jan 4 2010 = 100)
Figure 2: …coinciding with significant divergence in economic momentum across major economies (GDP growth, seasonally-adjusted annualized rate, percent)
Note: Data to 28 June 2013 Source: CEIC; MSCI; World Bank staff calculations
Source: World Bank
Figure 3: Indonesian equities and domestic government bonds have also weakened sharply since May… (index; yield, percent)
Figure 4: …amidst heavy net offshore selling of bonds and equities (cumulative net offshore purchases, IDR trillion)
Note: Data to 28 June 2013 Source: CEIC; World Bank staff calculations
Note: Bond flow data to 25 June, equities to 28 June 2013 Source: CEIC; World Bank staff calculations
80
90
100
110
120
130
140
150
Jan-10 Mar-11 May-12 Jul-13
S&P 500
MSCI-EM (local currency)
MSCI-EM (US Dollar)-2
0
2
4
6
8
10
Mar-10 Sep-10 Mar-11 Sep-11 Mar-12 Sep-12 Mar-13
Developing High income Global
4.0
4.5
5.0
5.5
6.0
6.5
7.0
3,500
4,000
4,500
5,000
5,500
Jan-12 Mar-12 Jun-12 Sep-12 Dec-12 Mar-13 Jun-13
JCI equity (LHS)
5-year domestic gov. bond yield (RHS)
PercentIndex
Bonds
Equities
-10
0
10
20
30
40
50
60
70
80
90
Jan-12 Mar-12 Jun-12 Sep-12 Dec-12 Mar-13 Jun-13

A d j u s t i n g t o p r e s s u r e s I n d o n e s i a E c o n o m i c Q u a r t e r l y
July 2013 THE WORLD BANK | BANK DUNIA3
The prices of Indonesia’s key commodity exports remain under pressure
The recent uneven performance of the global economy, still modest global growth outlook, and correction in EM asset prices, along with a stronger US Dollar, have kept downward pressure on commodity prices. The export-weighted basket of Indonesia’s major commodity products was broadly flat on the year through the end of May, and 21 percent lower than its post global-financial peak in January 2011, with further significant falls in June for most key commodities (Table 2). Continued weakness in commodity prices is weighing on investment and on exports, and consequently on growth.
Table 2: Commodity prices remain under pressure (US Dollar commodity prices, percentage change; export share, percent)
Change to end-June 2013 from:
Export share*
Jan05 Jun11 Dec12 May13
Coal 53.1 -32.4 -12.6 -7.1 13.8
Natural gas
-39.7 -17.6 12.3 -8.5 10.2
Palm oil 84.9 -34.4 -4.2 -12.5 9.3
Crude oil
129.6 -10.7 -7.3 -1.3 6.5
Rubber 137.2 -43.1 -9.7 -7.6 4.2
Copper 111.5 -26.0 -15.8 -7.5 2.4
Note: Australian coal, World Bank global natural gas index, Malaysia palm oil, Brent crude, Singapore-traded rubber, London-traded copper; *Export share is for 2012 Source: BPS; World Bank and staff calculations
External demand is not expected to pick up strongly in coming quarters
The World Bank continues to expect a steady, if gradual, increase in global economic growth in coming quarters. This reflects a projected slow acceleration in economic activity in high income economies, where growth remains generally sluggish but is on a firming trend, helped by a resilient US private sector recovery and prospects for stronger growth in Japan, while Euro Area economic conditions remain difficult. The growth trajectory of developing countries is also uneven, but developing country growth overall is also expected to firm somewhat. On an annual basis, the economies of Idonesia’s major trading partners are projected to grow by 3.4 percent in 2013, similar to the rate in 2012, and 0.3 percentage points lower than the previous projection in the March 2013 IEQ, reflecting below-expectation growth outcomes amongst major trading partners such as China in Q1. Major trading partner growth is projected to pick up to 4.0 percent in 2014. The recent sell-off across emerging market assets, and its potential impact on financing costs and availability, and investor confidence, keeps the risks to these projections skewed to the downside.
2. The revised Budget: subsidized fuel prices raised and a larger deficit projected
A revised Budget has been approved and subsidized fuel prices have been increased
Against the backdrop of the weakening in international and domestic financial markets, a revised Budget (APBN-P) for 2013 was approved by Parliament on June 17. Its key features were a revision of projected spending on fuel subsidies, predicated on a near-term increase in subsidized fuel prices, a package of compensation measures designed to reduce the impact of higher fuel prices on the poor, and a higher projected Budget deficit for the year, stemming from lower projected nominal revenues, higher total expenditure, and weaker anticipated GDP growth. Accordingly, an increase in fuel prices was announced by the Minister of Energy and Mineral Resources on June 21 (Regulation Permen ESDM No. 18/2013); effective June 22, the price of subsidized petrol was increased by 44 percent to IDR 6,500 per liter and the price of subsidized diesel was increased by 22 percent to IDR 5,500 per liter.
The target budget deficit for 2013 is now 2.4 percent of GDP, up from 1.7 percent previously
The revised Budget deficit target for 2013 is 2.4 percent of GDP, up from 1.7 percent previously (Table 4). The larger anticipated deficit results from a 2 percent downward revision of projected revenues, to IDR 1,502 trillion, and a 3 percent upward revision of expenditures to IDR 1,726 trillion. The primary deficit is projected to reach IDR 112 trillion (1.2 percent of GDP), which is IDR 72 trillion more than in the original Budget for 2013. The lower revenue projection mostly results from lower expected tax revenues in 2013, which are lowered by 4 percent from the original Budget to IDR 1,148 trillion, with the biggest adjustments applying to projected income taxes and taxes on international trade, reduced by 7.9 percent and 17.5 percent, respectively. Behind these downward revisions to

A d j u s t i n g t o p r e s s u r e s I n d o n e s i a E c o n o m i c Q u a r t e r l y
July 2013 THE WORLD BANK | BANK DUNIA4
revenue projections lies a reduction in projected GDP growth from 6.8 to 6.3 percent. Oil lifting for the year is also revised lower, to 840 thousand barrels per day (bpd) from 900 thousand bpd previously, but a USD 8 per barrel increase in the average crude oil price for the year, to USD 108 per barrel, increases targeted oil-related revenues by almost 7 percent compared to the original Budget for 2013.
Targeted expenditures increase relative to the original Budget on the back of higher social spending and energy subsidies
On the expenditure side, fuel subsidy spending is projected to increase by IDR 6.1 trillion versus the original Budget of IDR 193.8 trillion, despite the sizable increase in subsidized fuel prices. This reflects the fact that, in the absence of reform, energy subsidy spending would have significantly outstripped the originally budgeted amount, reflecting fuel consumption and price pressures. Electricity subsidies are targeted to reach IDR 100 trillion (IDR 19.1 trillion more than in the original Budget), so that total energy subsidy spending is projected to be 9.1 percent higher than in the original Budget, at IDR 300 trillion. The other key feature on the expenditure side is an increase in social spending of IDR 7 trillion to IDR 81 trillion, due in part to the compensation package designed to reduce the impact of higher subsidized retail fuel prices. Section B.1 discusses these new social assistance measures in more detail.
The fiscal impact of the fuel subsidy reform is positive but will have only a modest net fiscal impact in 2013…
The World Bank estimates that in the absence of reform, the actual spending on fuel subsidies in 2013 would have overshot the original 2013 Budget target by approximately IDR 25 trillion. With reform, fuel subsidy spending is projected by the World Bank to be IDR 177 trillion – somewhat below the level in the revised Budget of IDR 200 trillion, due to different macroeconomic assumptions for oil prices, GDP growth and the exchange rate (Table 4). The direct fiscal savings for 2013 of having increased the subsidized fuel price at the mid-point of the year are therefore estimated by the World Bank to be IDR 42.1 trillion (or 0.5 percent of projected GDP), and IDR 13 trillion net of the IDR 29 trillion compensation package (or 0.14 percent of GDP). The main fiscal benefit conferred by the subsidy reform in 2013, therefore, is that the Government will avoid significantly overshooting targeted spending on fuel subsidies, which would have placed additional pressure on a fiscal deficit which was already being widened by weaker than expected revenue growth.
…while future fiscal savings, while inherently uncertain, are significant relative to a no-change scenario
Relative to a no-reform, “business as usual” scenario, the fiscal savings over the next few years from the increase in subsidized fuel prices are significant (Figure 5). Using baseline macroeconomic projections and assuming a stable exchange rate and oil prices, fuel subsidy spending is projected by the World Bank to drop to IDR 148 trillion in 2014 from IDR 177 trillion in 2013 and IDR 212 trillion in 2012. This implies a full year fiscal saving of IDR 85.2 trillion in 2014 (0.8 of GDP), relative to having not increased fuel prices. Savings relative to the no-reform scenario are projected to increase in the subsequent two years (IDR 97.7 trillion in 2015, and IDR 112.4 trillion in 2016). However, these multi-year savings estimates are inherently uncertain, as they depend crucially on the future path of unsubsidized fuel prices, which in turn depend on international energy prices and the Rupiah exchange rate. A rise in global energy prices or continued weakening of the Rupiah could increase the gap between subsidized prices and the market price, pushing subsidy spending higher.

A d j u s t i n g t o p r e s s u r e s I n d o n e s i a E c o n o m i c Q u a r t e r l y
July 2013 THE WORLD BANK | BANK DUNIA5
Table 3: In 2013, fiscal savings from the fuel subsidy reform are modest, net of the sizable compensation package (IDR trillion)
Figure 5: In coming years, fiscal savings are substantial, relative to “business as usual” spending on fuel subsidies (IDR trillion)
2013 without reform
2013
with reform
Targeted fiscal outlay on fuel subsidies
193.8* 199.9**
World Bank projected outlay on fuel subsidies
218.7 176.6
World Bank projected direct savings from reform
42.1
Compensation package: 29.1
BLSM (IDR 150,000 for 4 months for 15.5m households)
9.3
Fiscal outlay on other compensatory measures
19.8
World Bank projected net savings from reform
13.1
Note: *original Budget (APBN) **revised Budget (APBN-P) Source: Ministry of Finance; World Bank staff calculations
Source: World Bank staff calculations
Table 4: The World Bank projects a fiscal deficit of 2.1 percent, slightly lower than in the proposed revised Budget (IDR trillion, unless otherwise indicated)
2010
Actual
2011
Actual
2012
Actual (unaudited)
2013
Budget
2013
Revised Budget
2013
WB July IEQ
A. Revenues 995 1,211 1,336 1,530 1,502 1,448
1. Tax Revenues 723 874 980 1,193 1,148 1,131
2. Non Tax Revenues 269 331 352 332 349 313
B. Expenditures 1,042 1,295 1,482 1,683 1,726 1,637
1. Central Government, o/w 697 884 1,001 1,154 1,197 1,108
Personnel 148 176 198 242 233 228
Material 98 125 137 201 203 179
Capital 80 118 140 184 188 166
Subsidies, o/w 193 295 346 317 348 318
Fuel subsidy 82 165 212 194 200 177
Social 69 71 75 74 81 74
2. Transfers to the Regions 345 411 480 529 529 529
C. Primary Balance 42 9.0 -46 -40 -112 -87
D. SURPLUS / DEFICIT -47 -84 -146 -153 -224 -189
Deficit (percent of GDP) -0.7 -1.1 -1.8 -1.7 -2.4 -2.1
E. Net Financing 92 131 180 153 224 n.a
1. Domestic Financing 96 149 199 173 241 n.a
2. Foreign Financing -4.6 -17.8 -19.2 -19.5 -16.9 n.a
Key economic assumptions
Economic growth (percent) 6.1 6.5 6.2 6.8 6.3 5.9
CPI (percent) 7.0 3.8 4.3 4.9 7.2 7.2
Exchange rate (IDR/USD) 9,078 8,779 9,384 9,300 9,600 9,750
Crude oil price (USD/barrel) 79 112 113 100 108 106
Oil production ('000 barrels/day) 954 899 861 900 840.0 840.0
Source: Ministry of Finance; World Bank staff calculations
0
50
100
150
200
250
300
Direct savings
Actual spending
Revised Budget
Spending, without reform
Spending, with reform

A d j u s t i n g t o p r e s s u r e s I n d o n e s i a E c o n o m i c Q u a r t e r l y
July 2013 THE WORLD BANK | BANK DUNIA6
A cumulative budget deficit of IDR 26 trillion was recorded for Jan–May 2013
The first five months of 2013 saw a cumulative budget deficit of almost IDR 26 trillion. This is an unusual result for the early part of the year; with the exception of 2012, when a budget deficit of IDR 4 trillion was recorded, the budget balance is normally positive over this period. The unusual part-year deficit is a result of relatively weak revenue growth and higher spending, adding to the imperative to reduce fuel subsidy spending.
Revenue collection moderated in the first five months of 2013
Total revenues in January-May 2013 grew by 10.1 percent (yoy), which is slightly higher than in the comparable period in 2012 (8.3 percent), but considerably below that in 2011. Relative to the annual projection, revenue collection in the first five months of 2013 has been the lowest in recent years (at 33.4 percent of targeted whole-year revenue), despite significantly improved collection of non-tax revenues (which, however, represent only about 23 percent of total revenues). Moderation in collections growth was recorded for all taxes, in line with weaker nominal GDP growth, and moderation in consumption growth in particular, as discussed in Section 4, as well as lackluster exports and commodity prices. The weakness in income tax revenue growth is largely driven by weaker corporate income tax collection due to slower nominal GDP growth and lower commodity prices, but was also affected by a substantial increase in the taxable income threshold (Penghasilan Tidak Kena Pajak, or PTKP).1
Table 5: Budget execution for Jan – May has improved compared to previous years but remains challenging (IDR trillion, unless otherwise indicated)
Nominal value (Jan – May) Share (Jan – May) of annual
Budget Nominal growth yoy (Jan -
May)
(IDR trillion) (percent) (percent)
2010 2011 2012 2013 2010 2011 2012 2013 2010 2011 2012 2013
State revenue and grants
356 421 456 502 35.9 36.0 33.6 33.4 20.4 18.3 8.3 10.1
Tax Revenues, o/w 275 327 373 397 37.1 37.2 36.8 34.5 14.9 18.6 14.4 6.2
Non-oil & gas income tax
128 150 168 170 41.7 40.9 37.7 36.5 7.9 17.0 12.0 1.0
Value added tax 82 92 121 138 31.3 30.9 36.0 32.5 24.1 12.0 31.1 14.1
Export tax 1 14 9 6 25.2 53.7 39.6 33.9 251.1 893.3 -32.6 -35.2
Non Tax Receipts 80 94 82 105 32.5 33.0 24.0 30.0 44.1 17.5 -13.4 28.2
Expenditure 295 364 460 528 26.2 27.6 29.7 30.6 2.7 23.5 26.3 14.8
C. Government, o/w 175 213 273 317 22.4 23.4 25.5 26.5 1.1 21.3 28.2 16.3
Personnel 56 68 79 89 34.5 37.0 37.0 38.1 8.7 20.5 16.0 13.1
Material 21 24 31 33 18.4 17.0 18.8 16.1 21.4 16.9 26.0 6.9
Capital 12 14 23 25 13.0 9.7 13.0 13.5 -15.6 10.5 67.6 11.1
Energy subsidy 37 54 70 95 25.6 27.8 34.7 31.6 90.8 47.1 29.4 35.2
Social assistance 15 7 22 16 20.6 8.9 25.9 20.3 -10.9 -50.5 207.6 -26.6
Transfers to regions 119 151 187 211 34.7 36.7 39.1 39.8 5.2 26.8 23.5 12.6
Source: Ministry of Finance; World Bank staff calculations
1 On October 22 2012 the Government increased the non-taxable annual income threshold of individual taxpayers from IDR 15.8 million to IDR 24.3 million per year, effective January 1 2013.

A d j u s t i n g t o p r e s s u r e s I n d o n e s i a E c o n o m i c Q u a r t e r l y
July 2013 THE WORLD BANK | BANK DUNIA7
Budget execution in the first five months has slightly improved compared to previous years but remains challenging
On the expenditure side, Budget execution displayed its typical seasonal pattern of moderate disbursements for the beginning of the year, but has slightly improved compared to previous years. By end of May, 30.6 percent of projected annual expenditures in the revised Budget were disbursed, which is the highest in recent years, and even after excluding subsidy spending budget execution was moderately high compared with previous years, at 30.4 percent. Overall, however, budget execution remains a challenge, particularly in light of spending allocation changes as a result of the revised Budget which may complicate budget execution over the remainder of 2013. In addition, ongoing challenges with respect to conditional budget approvals (Bintangs) in the first quarter continue to cause delays in the spending of some line Ministries.
Gross financing needs have risen considerably
Funding conditions, both domestically, and externally in the wake of the rise in global rates since May, have tightened since the previous edition of the IEQ. Following the revised Budget and IDR 70.9 trillion increase in the projected deficit, gross debt financing for 2013 is expected to increase by IDR 52.6 trillion relative to the original 2013 target, to IDR 380.6 trillion, according to the Debt Management Office (DMO). The prospect of this additional supply of debt has been one factor driving the significant correction in the domestic bond market since February, along with anticipation of the inflationary effects of fuel subsidy reform and international market conditions; bond yields have risen on the order of 150-200 basis points across the yield curve to levels last seen in mid-2011 (see Section 3 for more discussion of financial market developments). This presents a somewhat more challenging picture for issuance, with primary market demand weakening during the latter part of Q2 and 56 percent of the revised, higher gross issuance need for 2013 remaining to be met as of June 25.2 Risks to the government finances from higher yields are mitigated by the relatively low proportion of variable rate debt in the total debt stock (approximately 16 percent in 2012, according to DMO figures), and the Government has significant contingent financing and cash reserves in place to draw on in the event of a more severe dislocation in the bond market.
The World Bank projects that the 2013 fiscal deficit will be 2.1 percent of GDP, slightly lower than in the revised Budget
The World Bank projects that overall revenue collection in 2013 will be slightly lower than projected in the revised Budget (Table 4), reflecting moderation in projected nominal GDP and commodity prices (as discussed in Section 4), still challenging resources sector conditions, and a small net negative effect on VAT collections from the fuel subsidy increase. The World Bank also projects that overall expenditure will be slightly below the revised Budget, reflecting continuing challenges in budget execution (particularly for capital and material spending), as well as slightly lower energy subsidy spending due to a lower oil price assumption (USD 106 per barrel against the Budget assumption of USD 108 per barrel). On balance, the World Bank projects a slightly narrower Budget deficit in 2013, of 2.1 percent of GDP, against the revised Budget target of 2.4 percent.
2 See Directorate General of Debt Management, June 2013 Investor Meeting Presentation, available online.

A d j u s t i n g t o p r e s s u r e s I n d o n e s i a E c o n o m i c Q u a r t e r l y
July 2013 THE WORLD BANK | BANK DUNIA8
3. Indonesia’s financial, currency and credit markets: a turbulent quarter
The recent down-turn in markets follows a strong start to Q2
While the adjustment in Indonesian financial markets since May has been severe (Figure 3), this should be placed in the context of a generally robust performance in the first five months of 2013. Indonesian equities performed particularly strongly in the first half of the quarter, building on price gains in the first quarter amidst continued robust corporate profit growth across most sectors and strong net foreign purchases of Indonesian equities, totaling IDR 26 trillion (USD 2.7 billion) in the year to mid-May. Indonesian equities rose 20 percent from the start of 2013 until 21 May, led by property (up 57 percent) and the consumer goods sector (up 38 percent). Bond market performance was more mixed, with higher inflation pushing yields somewhat higher, but foreign investors were still net buyers of IDN 33 trillion worth of domestic bonds over the same period.
The bilateral US Dollar-Rupiah exchange rate has been under pressure, and Bank Indonesia has raised interest rates…
After easing through March and April, aided by robust net foreign purchases of domestic equities and bonds, and by sovereign and state-owned enterprise Dollar bond issuance, onshore US Dollar liquidity conditions have subsequently tightened on the back of heavy portfolio outflows. Official reserves declined in May to USD 105.2 billion despite receiving a boost from sizable external bond issuance. Currency depreciation pressure intensified in late May, reflecting accelerating portfolio outflows, with the onshore Rupiah rate falling to as low as IDR 9,960 per USD in late June for the first time since September 2009, while offshore non-deliverable forward (NDF) rates breached 10,000 in early June. Surprising markets, Bank Indonesia (BI) reacted on June 12 by raising its overnight bank deposit (FASBI) rate by 25 basis points, to 4.25 percent. This was followed by a rise in the reference policy rate of 25 basis points to 6 percent on 13 June – the first increase since 2011.
…but the Rupiah has actually appreciated so far in 2013 on a trade-weighted basis
While the Rupiah has depreciated on a sustained basis against the US Dollar in nominal terms since mid-2011, the currency has in fact appreciated on a trade-weighted basis and in real terms since the start of 2013. This appreciation reflects recent currency depreciation among major trading partners (especially Japan, with the Rupiah appreciating by 10 percent against the Yen so far in 2013), and Indonesia’s higher inflation rate also pressuring its real exchange rate higher. The Rupiah has now appreciated by 3 percent on a trade-weighted basis and by 4 percent on a real basis since the beginning of 2013. Consequently, since the start of 2013 there has been little real adjustment of the exchange rate to Indonesia’s weaker external position, suggesting that a combination of somewhat tighter monetary policy and a continued orderly depreciation of the Rupiah may be appropriate.
Bank credit growth has eased recently, driven by weaker investment lending
Credit growth continued to ease in the second quarter, with nominal credit growth slowing to 22 percent yoy in April, cutting real growth (ex post) to 15 percent yoy in April, its weakest pace since December 2010. Investment lending has led the moderation, easing to 24 percent yoy to April, down from a peak of 30 percent to July 2012, in line with the weakening in real investment activity (Figure 7). Growth in consumption lending slowed to 19 percent to March, while growth in working capital loans has also eased recently. Banking sector system-level prudential indicators remained stable into 2013, with non-performing loans remaining around 2 per cent, while profitability metrics for Indonesian banks remain strong, including relative to regional peers.

A d j u s t i n g t o p r e s s u r e s I n d o n e s i a E c o n o m i c Q u a r t e r l y
July 2013 THE WORLD BANK | BANK DUNIA9
Figure 6: The Rupiah has appreciated on a nominal and real trade-weighted basis so far in 2013 (cumulative change since 1 July 2011, percent)
Figure 7: Investment lending has eased in line with the slowing pace of real investment growth (yoy change, percent)
Note: NEER is 1-month moving average of a daily NEER index calculated using 2012 total trade weights Source: BIS (REER); BPS; World Bank staff calculations
Source: CEIC; World Bank staff calculations
Residential property prices have accelerated at the fastest pace in over a decade, while commercial property shows even stronger growth
Despite a slowing pace of bank lending for construction and residential mortgages in recent months (Figure 8), property price growth has accelerated. Nationwide property price growth was 11.2 percent in the year to March, the fastest pace for a decade. Higher prices were led by strong price growth among smaller homes (with floor space of less than 36 square meters), which are exempt from the stronger loan-to-value requirements introduced for residential mortgages in mid-2012. A new BI survey of the Jakarta secondary market for residential property (excluding apartments) also points to strong price growth, with prices up 3.8 percent quarter-on-quarter in Q1 for medium-sized homes and 3.5 percent for large homes, reflecting strong growth in Jakarta land values.3 Meanwhile commercial property also showed continued robust price growth, with industrial land prices across the Jabodetabek region up 65 percent over the year to the end of the first quarter, while office rental rates are up 15 percent over the same period (Figure 9). Such rapid price growth in pockets of the property sector bears careful monitoring but as noted in the March 2013 IEQ, overall property-related exposures in the financial system remain relatively small with property-related lending accounting for around 14 percent of total bank credit, and 12 percent of corporate bond issuance in the year to March 2013.
3 Bank’s Indonesia’s Residential Property Survey for Secondary Homes was first published on 24 April 2013 with data available to Q2 2012. Medium-sized homes are defined as those between 80sqm and 150sqm, while large homes are defined as those greater than 150sqm. The survey excludes residential apartments.
2.4REER
16.0
NEER
-3
0
3
6
9
12
15
18
Jul-11 Jan-12 Jul-12 Jan-13 Jul-13
IDR-USD spotexchange rate
IDR depreciation
6.0
0
10
20
30
40
50
Apr-05 Apr-07 Apr-09 Apr-11 Apr-13
Investment growth
Investment lending

A d j u s t i n g t o p r e s s u r e s I n d o n e s i a E c o n o m i c Q u a r t e r l y
July 2013 THE WORLD BANK | BANK DUNIA10
Figure 8: Residential house prices continue to accelerate despite slowing property lending growth… (yoy change, percent)
Figure 9: …with commercial property in Jabodetabek recording rapid price growth amid strong demand (year-to-date change, percent)
Source: BI; World Bank staff calculations Source: BI; World Bank staff calculations
4. The outlook for the Indonesian economy has weakened
The outlook for growth has deteriorated..
The rate of growth of the Indonesian economy moderated in the first quarter of 2013 to 6.0 percent yoy, slightly weaker than expected. The outlook for the economy has weakened, with the lagged impact of lower commodity prices bearing down on investment and the economy facing headwinds from the effects of renewed financial market turbulence and higher subsidized fuel prices.
…prompting a downward revision of the World Bank’s projection for 2013 GDP growth, to 5.9 percent
The World Bank has lowered its projection for GDP growth in 2013 to 5.9 percent, down from the 6.2 projection in the March 2013 IEQ, largely as a result of a more subdued outlook for domestic demand. Investment growth has slowed more than initially expected, while confidence effects from the anticipation of the fuel subsidy reform and correction in asset markets have likely weighed on domestic demand. The drag on growth from net exports is expected to diminish through the remainder of 2013, though relative to previous projections the recovery in exports is expected to be more subdued and import growth is expected to be weaker, reflecting the weaker outlook for investment. The net real sector impact of the proposed fuel subsidy reform is expected to be small, with the negative impact on consumption and investment from a higher fuel price likely to be largely offset by the positive impact on growth of the compensation package. However, with the higher outlook for inflation, further monetary tightening may be necessary, which could further slow the pace of growth.
Real GDP growth in the first quarter of 2013 continued to moderate…
Indonesia’s economic activity moderated in the first quarter of 2013, as growth in domestic demand, particularly investment, eased (Figure 10). Real GDP rose by 6.0 percent yoy in Q1, marking the tenth consecutive quarter of 6 percent or higher growth. The Q1 result was lower than the 6.1 percent yoy growth seen in the fourth quarter of 2012, while on a seasonally-adjusted (sa) quarter-on-quarter (qoq) basis the economy grew by 1.3 percent, down from 1.7 percent in the fourth quarter. Nominal GDP growth also continued to ease, to 8.7 percent yoy, the slowest rate in 9 years (Figure 11). The weakness in nominal growth is due mainly to a sharp reduction in GDP deflator growth, with a significant fall in export prices on the back of lower global commodity prices a key contributor.
0
10
20
30
40
0
5
10
15
20
Jun-08 Jun-09 Jun-10 Jun-11 Jun-12 Jun-13
Residential property prices: small (LHS)
Residential property prices: medium (LHS)
Residential property prices:: total (LHS)
Residential property prices: large (LHS)
Credit growth: property (RHS)
0
20
40
60
80
100
Residentialhomes (14
city)
Officespace (Jbk)
Residentialapartments
(Jbk)
Retailspace(rental)(Jbk)
Industrialland (Jbk)
Jun-12 Sep-12 Dec-12 Mar-13

A d j u s t i n g t o p r e s s u r e s I n d o n e s i a E c o n o m i c Q u a r t e r l y
July 2013 THE WORLD BANK | BANK DUNIA11
Figure 10: Real GDP growth continued to ease, with the contribution from investment narrowing further (yoy real GDP growth, percent)
Figure 11: Nominal GDP remains weak, in line with weak growth in the GDP deflator (yoy growth, percent)
Note: The discrepancy includes the statistical discrepancy and inventories Source: BPS; World Bank staff calculations
Source: BPS; World Bank staff calculations
Investment growth continues to moderate, largely driven by weakening investment in foreign transportation, and machinery and equipment
Growth in real investment continued to fall in the first quarter of 2013, increasing by 5.9 percent yoy, well down from 7.3 percent in the fourth quarter and its recent peak of 12.5 percent in the June quarter of 2012. In seasonally adjusted sequential terms, investment was flat in the quarter, following growth of 1.9 percent quarter-on-quarter seasonally adjusted in the fourth quarter of last year. Driving this significant moderation in growth has been foreign transportation, and machinery and equipment, whose combined contribution to aggregate investment growth has fallen from over 6.0 percentage points in the June quarter of 2012, to a zero contribution to overall investment growth in the March quarter of 2013 (Figure 12). This weakness is consistent with the ongoing weakness in commodity-related activity, which draws heavily on foreign capital investment. There was also some moderation in building investment in the quarter (85 percent of total investment), which grew by 7.2 percent yoy, down from 7.8 percent in the fourth quarter of 2012.
Figure 12: The moderation in investment has largely been driven by a sharp drop off in foreign machinery and equipment, and transportation (contributions to real investment growth, percent, yoy)
Source: BPS; World Bank staff calculations
Private consumption saw some moderation, as higher food prices reduced consumers’ purchasing power
Growth in private consumption also moderated in Q1, increasing by 5.2 percent yoy, slightly down from 5.4 percent yoy in Q4 2012. This reflected a moderation in non-food consumption, with the significant increase in food prices in the quarter likely having an adverse impact. On the other hand, government consumption growth strengthened in sequential terms, increasing by 4.6 percent qoq-sa, to be 0.4 percent higher than a year ago, following weak outcomes in late 2012.
-4
-2
0
2
4
6
8
10
12
14
Mar-10 Dec-10 Sep-11 Jun-12 Mar-13
Private cons. Gov cons.
Investment Net Exports
Discrepancy GDP
-10
0
10
20
30
Mar-03 Mar-05 Mar-07 Mar-09 Mar-11 Mar-13
GDP deflator
Nominal GDP
Exports deflator
0
4
8
12
16
Mar-11 Sep-11 Mar-12 Sep-12 Mar-13
OtherForeign transportationForeign machinery and equipmentBuildingTotal

A d j u s t i n g t o p r e s s u r e s I n d o n e s i a E c o n o m i c Q u a r t e r l y
July 2013 THE WORLD BANK | BANK DUNIA12
Net exports made a positive contribution to growth, with a mild pick up in exports and a large fall in imports
Net exports contributed significantly to growth in Q1, contributing around 3.5 percentage points to qoq-sa growth and 1.8 percent to yoy growth. Exports in volume terms (though not in value terms) continued to stage a recovery in the quarter, up 3.0 percent qoq-sa and 3.4 percent yoy. More striking was the large fall in imports of 5.4 percent qoq-sa, down 0.4 percent yoy, which is consistent with weaker growth in domestic demand.
The statistical discrepancy and inventories no longer account for a large proportion of growth
After adding significantly to growth over much of 2012, the statistical discrepancy and inventories subtracted 0.1 percentage points from yoy growth in the March quarter of 2013. As a result, the sizeable gap between GDP and measured real final sales growth (i.e. the sum of measured private consumption, government consumption, fixed investment and net exports), highlighted in recent editions of the IEQ as being indicative of demand-side risks to output growth, has narrowed in line with the moderation in the latter.
On the production side, much of the moderation in growth was driven by the industrial sectors, particularly mining and quarrying
On the production side, the Q1 moderation was largely driven by the industrial sectors, while agriculture, livestock, forestry and fisheries production rebounded and the performance of the services sectors was mixed. In aggregate, industrial sectors’ output increased by 4.9 percent yoy, down from 5.4 percent yoy in Q4 2012, with mining and quarrying continuing to perform poorly, down 0.4 percent when compared to a year ago. The other industrial sectors continued to perform solidly, though there was some moderation in activity in manufacturing, where output growth eased slightly to 5.8 percent yoy, and in the construction sector, where output growth eased to 7.2 percent yoy. Services sectors’ aggregate output increased by 7.6 percent yoy, unchanged from Q4 2012. There was some moderation in trade, hotels and restaurants, which increased by 6.5 percent yoy, well-down from 7.8 percent yoy in Q4. This sector, which is the largest services sector, accounts for close to 15 per cent of nominal GDP and has seen moderating activity growth since late 2011. However, this weakness was offset by strong results from other services sub-sectors such as transport and communication (up 10.0 percent yoy) and financial ownership and business services (up 8.4 percent yoy).
Output in the petroleum and gas sub-sector continues to fall, while growth in other mining activities was weak
The weakness in the mining and quarrying sector has been largely driven by mining, particularly oil and gas. The oil and gas sector has been contracting for the past two years, with output falling by 5.7 percent yoy in the March quarter of 2013, following a contraction of 4.6 percent in the fourth quarter of 2012 (Figure 13). Growth in non-oil and gas mining output has also weakened in recent quarters, to be 3.7 percent yoy in the March quarter, down from 4.4 percent in the fourth quarter of 2012. In nominal terms, non-oil and gas mining output contracted outright, by 4.2 percent yoy in the March quarter. In sequential terms, however, there are some signs of a bottoming-out in non-oil and gas mining output, albeit at levels well off the post global financial crisis highs; non-oil and gas mining output in Q1 increased by 3.3 percent quarter-on-quarter seasonally adjusted in real terms, and by 7.9 percent in nominal terms.
Figure 13: Mining sector output continues to be weak (yoy change in real mining (ex petroleum and gas), crude petroleum and gas output, percent)
Source: BPS; World Bank staff calculations
-10
-5
0
5
10
15
20
Mar-08 Mar-09 Mar-10 Mar-11 Mar-12 Mar-13
Crude petroleum and gas
Mining (ex. petroleum and gas)

A d j u s t i n g t o p r e s s u r e s I n d o n e s i a E c o n o m i c Q u a r t e r l y
July 2013 THE WORLD BANK | BANK DUNIA13
A number of high frequency indicators have eased recently…
High frequency indicators for April and May are suggestive of a continued moderation in growth. Continued falls in capital imports (Figure 14), along with the moderation in lending for investment discussed above, suggest that investment growth will stay weak in the very near-term. Imports of capital goods continued to fall for the fifth consecutive quarter in April, and were down 22.5 percent yoy. Growth in cement sales, a key indicator of building activity, moderated to 13.1 percent yoy in May, down from 16.8 percent in March and has weakened significantly in seasonally-adjusted sequential terms (Figure 15), indicative of a continuation in the moderation in building investment seen in the first quarter. However, continued robust demand in the residential property market, which has resulted in large increases in property prices as reported in Section 3, should lend some support to building investment going forward. While the HSBC PMI, at 51.6 in May, continues to suggest expansionary business conditions in the manufacturing sector, industrial production is showing signs of weaker momentum in seasonally adjusted sequential terms (Figure 15). Indicators of consumption point to some near-term weakness, with retail sales increasing by 9.7 percent yoy, well down from growth of close to 20 percent yoy in late 2012. Measures of consumer confidence continue to trend down, with the BI consumer confidence index lower in both April and May, likely adversely impacted by the anticipation of the announcement Government’s subsidy reform. However, election spending in the lead up to the 2014 presidential elections should provide a boost consumption growth in late 2013 and early 2014, consistent with past experience.
Figure 14: Continued weakness in capital imports points to more weakness in fixed investment growth… (real fixed investment and 3-month moving average of capital goods imports in USD, percent yoy)
Figure 15: …while high frequency economic indicators are suggestive of a continued moderation in growth (3-month change versus previous 3 months, seasonally-adjusted annualized rate, percent)
Source: BPS; World Bank staff calculations Note: Series have been adjusted for Ramadan period Source: BPS; World Bank staff calculations
The net growth impact of fuel subsidy reform is not expected to be large
The increase in subsidized fuel prices may be an additional headwind for investment in the short-term, since it will add directly to the cost of transportation, and indirectly to the cost of intermediate goods, thus increasing both operating and investment costs. On the other hand, the reduction of wasteful spending on fuel subsidies should serve to boost investor confidence in Indonesia’s fiscal position and reform trajectory. The higher price of fuel is also expected to negatively impact private consumption through reduced purchasing power. However, the proposed compensation package (of around IDR 29 trillion), which includes a significant cash transfer to the poor, as discussed in Section B.1, will offset some of the negative impact on consumption. For non-poor households there may be a temporary reduction in consumption but this may be mitigated by a corresponding nominal wage increase as seen in 2008 when manufacturing employees’ nominal wage growth moved up in response to both the rise in fuel price and higher food price inflation. The Government’s compensation package also incorporates some spending on basic infrastructure (of IDR 7.25 trillion), which should have positive flow-on effects to other areas of the economy.
0
4
8
12
16
-80
-40
0
40
80
Apr-09 Apr-10 Apr-11 Apr-12 Apr-13
Real fixed investment (RHS)
Capital goods imports (3mma)
-40
-30
-20
-10
0
10
20
30
40
50
60
May-10 May-11 May-12 May-13
Industrial production
Cement sales

A d j u s t i n g t o p r e s s u r e s I n d o n e s i a E c o n o m i c Q u a r t e r l y
July 2013 THE WORLD BANK | BANK DUNIA14
GDP growth is forecast at 5.9 percent for 2013 and 6.2 percent for 2014
The World Bank’s projection for GDP growth in 2013 is 5.9 percent, lowered from 6.2percent in the December 2012 IEQ (Table 6). Private consumption is expected to be the main driver of growth, supported by pre-election spending towards the end of this year, though there may be some weakness in the near-term. Investment growth is expected to cool further, as indicated by a continued moderation in credit for investment and the sustained slowdown in spending on imported capital goods. Solid growth in building investment, supported by robust growth in the residential construction sector, should provide some offset, given that construction accounts for around 85 percent of total nominal investment spending. Both import and export growth should remain under pressure over 2013, with somewhat weaker than previously-expected major trading partner growth leading to a downgrade in export growth, while growth in imports has also been downgraded, in line with the weaker investment outlook. For 2014, growth is expected to pick up to 6.2 percent, as the global recovery gains some traction, supporting exports and investment.
Table 6: Under the baseline scenario GDP growth of 5.9 percent is projected for 2013, rising to 6.2 percent in 2014 (percentage change, unless otherwise indicated)
Annual Year to December quarter Revision to
Annual
2012 2013 2014 2012 2013 2014 2013 2014
1. Main economic indicators
Total Consumption expenditure 4.8 4.9 5.6 3.9 5.7 5.0 -0.1 -0.2
Private consumption expenditure 5.3 5.0 5.7 5.4 5.2 5.0 -0.5 -0.2
Government consumption 1.2 4.5 4.8 -3.3 8.2 4.9 2.7 -0.8
Gross fixed capital formation 9.8 4.4 6.2 7.3 4.1 6.7 -3.6 -3.4
Exports of goods and services 2.0 5.8 6.1 0.5 6.6 6.8 -0.1 -5.2
Imports of goods and services 6.6 1.0 5.2 6.8 -1.0 5.8 -7.6 -4.2
Gross Domestic Product 6.2 5.9 6.2 6.1 5.9 6.5 -0.3 -0.2
Agriculture 4.0 4.1 3.1 2.0 5.8 3.2 1.3 -0.1
Industry 5.2 4.5 5.0 5.4 4.1 5.3 -0.6 -0.4
Services 7.7 7.5 8.0 7.6 7.4 8.1 -0.4 -0.1
2. External indicators
Balance of payments (USD bn) 0.2 -4.8 5.2 n/a n/a n/a -6.8 0.9
Current account balance (USD bn) -24.1 -25.2 -22.2 n/a n/a n/a -1.5 0.2
Trade balance (USD bn) -2.2 -5.0 -0.6 n/a n/a n/a -5.3 -5.2
Financial account bal. (USD bn) 24.9 20.5 27.4 n/a n/a n/a -5.2 0.7
3. Other economic measures
Consumer price index 4.3 7.2 6.7 4.4 9.0 5.3 1.8 1.5
Poverty basket Index 6.5 7.4 8.0 5.4 9.2 7.3 1.3 1.2
GDP Deflator 4.6 4.3 6.3 2.7 6.5 5.3 -0.6 0.4
Nominal GDP 11.0 10.5 12.9 9.0 12.5 12.2 -0.9 0.2
4. Economic assumptions
Exchange rate (IDR/USD) 9419 9750 9700 9630 9770 9700 150.0 200.0
Indonesian crude price (USD/bl) 113 106 105 108 105 105 -4.0 0.0
Major trading partner growth 3.4 3.4 4.0 3.3 3.8 3.4 -0.3 0.0
Note: 2012 figures subject to revisions. Projected trade flows relate to the national accounts. Revisions are relative to projections in March 2013 IEQ. Source: MoF; BPS; BI; CEIC; World Bank projections

A d j u s t i n g t o p r e s s u r e s I n d o n e s i a E c o n o m i c Q u a r t e r l y
July 2013 THE WORLD BANK | BANK DUNIA15
5. Inflation will increase temporarily following the rise in subsidized fuel prices
The outlook for inflation is dominated by the increase in subsidized fuel prices…
The Government’s move to increase the diesel price by IDR 1,000 per liter and the gasoline price by IDR 2,000 per liter on 22 June 2013 are expected to lead to a large spike in headline inflation and poverty basket inflation, with a more muted increase expected in core inflation. The spike in inflation is expected to be temporary and will be completely phased out over time. Prudent management from BI should help ensure that there is not a persistent rise in inflation expectations and underlying inflation. Unlike past fuel prices increases, these increases have come at a time when inflation is well contained, with headline inflation moderating in line with lower food prices and core inflation relatively low and stable.
Higher subsidized fuel prices should add approximately 1.8 percentage points to average annual inflation…
It is projected that higher subsidized fuel prices will increase inflation by around 1.8 percentage points in 2013 and around 1.5 percentage points in 2014. Consequently, inflation is expected to reach 7.2 percent in 2013 and 6.7 percent in 2014, peaking at around 9 percent yoy at the end of 2013 (Figure 16). This sizable impact reflects a large direct impact from the higher cost of gasoline, but also a large indirect impact as gasoline is an important input for many consumption goods. While the direct CPI weight of diesel for households is low, the indirect impact is large as diesel is used by buses and trucks for public and commercial transport. The once-off nature of this reform means that the impact on annual inflation washes out by the September quarter of 2014, when headline inflation is expected to be 5.2 percent yoy (Figure 16).
Figure 16: Projected headline inflation, with and without fuel subsidy reform (percent, yoy)
Source: BPS; World Bank staff calculations
…as well as pushing up poverty basket inflation…
The higher price of fuel is also expected to push poverty basket inflation significantly higher by around 1.2 percentage points in 2013 and 1.3 percentage points in 2014 to 7.4 percent and 8.0 percent, respectively. While, the average consumer will experience the price increase both at the fuel pump and a generalized increase in prices of other goods, a poor households’ consumer basket, which contains almost no direct consumption of fuel, will be affected largely through the impact of higher transportation costs on the price of food (which represents 60 percent of their consumption basket) and on public transport.
…but core inflation is expected to remain contained
Underlying price pressures are expected to remain contained, with the impact on core inflation expected to be more muted. This is because core inflation excludes administered and volatile items, with services and goods in the core price basket affected only indirectly by rising transportation or other input costs of firms taking the opportunity to reset their prices. Core inflation is expected to be around 0.5 percentage points higher in 2013 and 2014, assuming that there is not a sustained increase in inflation expectations (a reasonable assumption given the one-off nature of associated price increases, but will nevertheless require vigilance on the part of BI to act in the event that higher inflation expectations do set in).
0
2
4
6
8
10
12
14
16
18
20
Dec-04 Dec-06 Dec-08 Dec-10 Dec-12 Dec-14
Without reform
With reform
Forecast

A d j u s t i n g t o p r e s s u r e s I n d o n e s i a E c o n o m i c Q u a r t e r l y
July 2013 THE WORLD BANK | BANK DUNIA16
Headline inflation moderated in April and May…
As mentioned above, the fuel price increases come at a time when headline inflation is easing, driven by lower food inflation, and core inflation is well contained. Headline inflation eased to 5.5 percent yoy in May, down slightly from 5.6 percent in April and its recent peak of 5.9 percent in March. Poverty basket inflation has also moderated, to 6.6 percent in May from 7.0 percent yoy in March. Furthermore, core inflation remains relatively low and stable, at 4.0 percent yoy in May, suggesting that underlying price pressures remain moderate (Figure 17), though also helped by the declining trend of the world gold price. Meanwhile, economy-wide inflation, as measured by the GDP deflator, continued to grow below headline inflation in the first quarter of this year, easing to 2.5 percent yoy.
…due largely to food price disinflation
Food price inflation has eased in recent quarters, to be 11.1 percent yoy in May, following the beginning of the main harvest and the reversal of some import restrictions in March for key staples, such as garlic and onions. Food inflation had risen sharply in the first 3 months of this year, peaking at 12.9 percent yoy in March, and driving a pickup in headline and poverty basket inflation. While this increase partly reflected the increase in food prices that typically occurs in the lead up to the main harvest period, severe flooding in January, as well as changes in trade policy as discussed in the March 2013 IEQ, also drove the price of key food staples up. The reversal of some of these measures has seen price falls for a number of key staples, with the price of garlic now below its level as of December of last year (Figure 18). The price of shallots has continued to come down, however, chili prices have increased recently. The domestic price of rice, another key staple, has seen some declines in recent months, though the gap between domestic and international prices has widened, as large crops produced by major producer countries have reduced international rice prices.
Figure 17: Inflation has moderated in recent months… (inflation, percent)
Figure 18: …as prices for a number of key food staples have fallen (price index, December 2012=100)
Source: BPS; World Bank staff calculations Source: BPS; World Bank staff calculations
-8
0
8
16
24
-1
0
1
2
3
May-09 May-10 May-11 May-12 May-13
Core inflation yoy (RHS)
Headline inflation yoy
(RHS)
Headline inflation mom (LHS)
Food inflation yoy (RHS)Shallots
50
100
150
200
250
300
Dec-12 Feb-13 Apr-13 Jun-13
Small Chili
Red Chili
Garlic

A d j u s t i n g t o p r e s s u r e s I n d o n e s i a E c o n o m i c Q u a r t e r l y
July 2013 THE WORLD BANK | BANK DUNIA17
Economy-wide price growth has been subdued, in line with weakness in export prices
Economy-wide price growth has remained muted, with growth in the GDP deflator moderating significantly from a recent peak of 8.5 percent yoy in Q3 2011, to its current rate of just 2.5 percent. While this moderation partly reflects an easing in underlying consumer inflation, it also stems from a significant easing in the prices of Indonesia’s exports and the mining and quarrying sector. Export prices were 1.3 percent lower yoy in the March quarter, while the aggregate price of mining and quarrying sector output was 1.4 percent lower. This drop-off in prices has coincided with significant falls in the prices of Indonesia’s key commodities since late 2011. There are some signs that economy-wide inflation could be turning around, with sequential growth in the GDP deflator picking up in recent quarters. Furthermore, with consumer prices representing a large share of the GDP deflator, GDP deflator inflation will also be affected by the fuel price adjustment. Accordingly, GDP deflator inflation is projected to rise to be 4.3 percent in 2013 and 6.3 percent in 2014.
…which increased significantly in May…
Consumer expectations of near-term inflation have increased in recent months, in line with the anticipation of fuel subsidy reform and higher fuel prices in the near-term. The BI 3-month price expectation index registered a significant increase in May, up by 14.5 basis points reflecting large increases across all components, particularly Transportation, Communication, and Financial Services. While it is usual to see a large increase in near-term price expectations as Ramadan approaches, this increase was much larger than usual, likely reflecting expectations of the mooted subsidized fuel price increase. Furthermore, the 6-month price expectation index increased by 10.3 basis points in May, following declines over the past two months. In line with the increase in consumer expectations, retailers are also expecting inflationary pressures going forward, with BI’s 3-month retailer price expectation index up 20 basis points in April.
…and will need to be monitored
It will be important to monitor inflation expectations and price-setting behavior over the rest of 2013, given the fuel price increases, but also the large increases in minimum wages granted for 2013. It is not expected that there will be a sustained increase in inflation expectations as a result of the fuel subsidy reform due to the once-off nature of the price increases. In addition, while there is no clear indication that the large increases in minimum wages for 2013 granted by some provinces are materially feeding into higher inflation expectations and wages, wage pressures may yet become more visible and filter into prices as the year progresses. These upside, cost-push risks to the inflation outlook are mitigated by signs of some moderation in domestic demand, which should serve to limit the risks of second-round effects from higher fuel prices or wage pressures.
The inflation outlook is contingent on the movement in the exchange rate and inflation expectations…
A further depreciation in the exchange rate and a sustained increase in inflation expectations following the fuel subsidy reform and minimum wage increases, are key upside risks to the inflation outlook. Pass-through from the higher US Dollar/Rupiah exchange rate into consumer prices has so far been limited. This is in part because, when measured in trade weighted terms, the depreciation of the currency has been mild (see Box 2 in the December 2012 IEQ), and the effective exchange rate has in fact appreciated in recent months, as discussed in Section 3. A further weakening of the Rupiah, however, would present some upside risk to inflation.

A d j u s t i n g t o p r e s s u r e s I n d o n e s i a E c o n o m i c Q u a r t e r l y
July 2013 THE WORLD BANK | BANK DUNIA18
6. Indonesia’s current account deficit persists despite slowing import growth
The current account deficit narrowed in the first quarter of 2013, but the overall balance of payments returned to deficit
Indonesia’s current account deficit narrowed in the first quarter to USD 5.3 billion, or 2.4 percent of GDP, from 3.6 percent of GDP in Q4 2012. This reflected a larger goods trade surplus, of USD 1.6 billion. However, this was due not to an increase in exports, which continued to fall in nominal US Dollar terms, but to generally weak imports. The financial and capital account recorded a deficit of USD 1.4 billion, its first such deficit since Q3 2011, on account of strong reported ‘other investment’ net outflows. The basic balance, or sum of the current account balance and net FDI, narrowed from USD 3.2 billion in Q4 2012 but remained in a deficit, at USD -1.9 billion, (Figure 19), indicating that Indonesia continues to rely on potentially more volatile portfolio and other investment inflows to finance the current account deficit.
Figure 19: The balance of payments returned to deficit in Q1 (USD billion)
Note: basic balance is defined as the sum of the current account and direct investment component of the capital and financial account Source: BI; World Bank staff calculations
The goods trade balance recovered in Q1 as weaker imports offset the continued slowdown in exports
Total imports contracted 1.6 percent yoy in Q1, while exports were 6 percent lower yoy. However merchandise trade data for April show the non-oil and gas goods trade balance slipping back into deficit in April on account of a further weakening in exports, while imports firmed (Figure 20). A sizable oil and gas trade deficit has been a persistent feature of Indonesia’s external balances since mid-2012 (Figure 21), widening to USD 3 billion in Q1 2013 (from USD 2.4 billion in Q4 2012). This reflects declining oil and gas receipts, coupled with generally robust domestic demand for energy imports. Indonesia’s exports continue to be weighed down by the lack of recovery in the global prices of its major commodity exports. The benchmark price of coal, Indonesia’s single largest commodity export by revenue, has weakened due to slowing growth in China, the largest buyer of Indonesian coal, as well as a potential Chinese ban on low value coal imports (Box 1).
-16
-12
-8
-4
0
4
8
12
16
Mar-10 Mar-11 Mar-12 Mar-13
Current accountNet direct investmentNet portfolioNet other capitalOverall balanceBasic balance

A d j u s t i n g t o p r e s s u r e s I n d o n e s i a E c o n o m i c Q u a r t e r l y
July 2013 THE WORLD BANK | BANK DUNIA19
Figure 20: The non-oil and gas trade surplus widened in Q1 2013, before slipping back into a small deficit in April… (non-oil and gas trade balance, billion USD, and 3 month-moving-average of yoy change in non-oil and gas imports and exports, percent)
Figure 21: …while a sizable oil and gas trade deficit has opened up since mid-2012 (oil and gas trade balance, billion USD, and 3 month-moving-average of yoy change in oil and gas imports and exports, percent)
Source: BPS; World Bank staff calculations Source: BPS; World Bank staff calculations
While the decline in nominal imports has been broad-based, capital goods imports has fallen most sharply
Weaker imports during the first quarter were due to across the board declines in capital, intermediate and consumer goods imports (Figure 22). The biggest drag, however, came from shrinking capital goods imports, which account for approximately 16 percent of total imports and which fell 19.2 percent (yoy change in 3-month moving average, April) in line with recent weakening in domestic investment. Consumer goods imports also slowed over the quarter to be down 10.3 percent (yoy change in 3-month moving average, April). Imports of intermediate goods, which account for around 77 percent of total imports, also weakened.
Export revenues remain under pressure..
Indonesia’s export revenues have continued to weaken (Figure 23), weighed down by the lack of recovery in the global prices of its major commodity exports. The nominal US Dollar value of oil and gas exports fell 24.1 percent (yoy change in 3-month moving average, April), while mining and mineral exports fell 1 percent (yoy change in 3-month moving average, April). Among Indonesia’s major commodity exports, only natural gas (which accounts for approximately 10 percent of total exports) has seen a strong recovery in global prices, with benchmark Asian LNG prices up approximately 11 percent in 2013 through May. In coming months, Indonesia’s coal exports may face an additional challenge from reduced Chinese demand (Box 1).
…underperforming due to commodity weakness, while manufactured export revenues have held up better but may be challenged
Indonesia’s total exports have underperformed those of most of its peers in the region (Figure 24), reflecting the greater weighting of commodities in Indonesia’s export basket (61 percent). Malaysian exports, which are also fairly commodity-dependent (with commodities accounting for 37 percent of exports, of which almost 23 percent is fuel) have also underperformed others in the region, registering a 5.9 percent yoy contraction in exports(yoy change in 3-month moving average, April). Compared to commodity exports, Indonesian manufacturing exports have held up relatively well in recent months, and as of April were essentially flat on their year-ago level (up 0.2 percent, yoy change in 3-month moving average). Yet recent data point to a near-term slowing in export growth across the region, reflecting the deepening recession across Europe, as well as slowing Chinese growth; Thai manufacturing export growth slowed to 3.1 percent yoy to April, from 8.1 percent to March (yoy change in 3-month moving average), while reported Chinese exports slowed sharply in May following an official investigation into alleged export over-invoicing to facilitate illicit capital inflows, which is expected to have inflated official export figures through the early months of 2013 (Figure 25).
-100
-50
0
50
100
-1.5
0.0
1.5
3.0
4.5
Oct-10 Apr-11 Oct-11 Apr-12 Oct-12 Apr-13
Balance (LHS)
Imports (RHS)
Exports (RHS)
-100
-50
0
50
100
-1.5
0.0
1.5
3.0
4.5
Oct-10 Apr-11 Oct-11 Apr-12 Oct-12 Apr-13
Balance (LHS)
Imports (RHS)
Exports (RHS)

A d j u s t i n g t o p r e s s u r e s I n d o n e s i a E c o n o m i c Q u a r t e r l y
July 2013 THE WORLD BANK | BANK DUNIA20
Figure 22: Capital goods have led a broad-based decline in imports… (3 month-moving-average, yoy import value growth, percent)
Figure 23: …while Indonesia’s export revenues are still pressured (3 month moving-average, yoy export value growth, percent)
Source: BPS; World Bank staff calculations Source: BPS; World Bank staff calculations
Figure 24: Indonesia’s exports have underperformed most of its regional peers (3 month-moving-average, yoy export value growth, percent)
Figure 25: Manufacturing exports have been flat, amidst recent signs of weaker manufacturing export growth in Asia (3 month-moving-average, yoy import value growth, percent)
Source: CEIC; World Bank staff calculations Source: CEIC; World Bank staff calculations
-20
0
20
40
60
Oct-10 Apr-11 Oct-11 Apr-12 Oct-12 Apr-13
Intermediate CapitalConsumer Total imports
-35
0
35
70
105
Oct-10 Apr-11 Oct-11 Apr-12 Oct-12 Apr-13
Agriculture & forestry ManufacturingMining & minerals Oil & gasTotal exports
-25
0
25
50
75
Nov-10 May-11 Nov-11 May-12 Nov-12 May-13
China Indonesia JapanMalaysia Thailand Vietnam
-25
0
25
50
75
Nov-10 May-11 Nov-11 May-12 Nov-12 May-13
China Indonesia Japan
Malaysia Thailand Vietnam

A d j u s t i n g t o p r e s s u r e s I n d o n e s i a E c o n o m i c Q u a r t e r l y
July 2013 THE WORLD BANK | BANK DUNIA21
Box 1: China’s proposed ban on low quality coal imports poses a risk to Indonesia’s coal exports
China’s National Energy Administration has proposed a ban on low quality coal imports, which if enacted, could detrimentally impact Indonesian coal exports. According to market reports, the ban is expected to apply to coal with a calorific value of less than around 4,500 kcal per kilogram, with market analysts suggesting that roughly 10 percent of Indonesian coal could be affected.4 Coal accounts for 14 percent of Indonesia’s total exports, with low value coal (defined as having a calorific value of less than 5,100 kcal per kg) accounting for around one fifth of Indonesian coal exports, according to government figures for 2011 (Figure 26). China imported 90 million tons of thermal coal from Indonesia in 2012, half of which was lower-rank coal. Meanwhile Indonesian coal production is set to reach 391 million tons in 2013, up from 384 million tons in 2012, according to Government figures.5 Should the Chinese import ban take effect, Indonesian coal producers would attempt to re-direct their sales to other major markets, notably India. Any ban on low value coal imports by China would place further downward pressure on benchmark coal prices, which have already weakened on concerns of a slowdown in the pace of economic activity and energy demand in China, as well as accelerating exports of US coal which has been displaced by natural gas. Indonesian benchmark coal prices are down 6 percent since March to USD 85 per ton.
Figure 26: Low quality coal accounts for 20 percent of Indonesian coal exports and could be hit by a Chinese ban (share of total coal exports, percent)
Note: Bar chart labels refer to export volumes in million tons (MT) Source: Indonesian Ministry of Energy and Mineral Resources; World Bank staff calculations
In Q1, the capital and financial account recorded its first deficit since Q3 2011…
Turning to the financial and capital account, the financial and capital account deficit of USD 1.4 billion in the first quarter was driven by reported strong ‘other investment’ net outflows of USD 7.7 billion. This reflected increased placement of deposits offshore following a buildup in foreign exchange reserves among domestic banks as a result of BI’s move to directly meet much of the foreign exchange needs of state-owned energy companies during the first quarter. BI scaled down its interventions as pressures on the Rupiah subsided from February until late May, resulting in a drawdown in private foreign exchange deposits in recent months, although intervention has likely picked up again in recent weeks on heightened Rupiah depreciation pressures.
…as portfolio capital inflows were robust and FDI inflows slowed
Strong net portfolio inflows of USD 2.9 billion were recorded in Q1, particularly into equities. Monthly portfolio inflows remained elevated through April, led by strong foreign demand for Indonesian government bonds, with net inflows totaling USD 1.8 billion. Net direct investment inflows slowed to USD 3.4 billion (from USD 4.5 billion in Q4 2012), in line with weaker domestic investment.
Recent weeks have seen large foreign portfolio investment outflows
However, as noted above, the recent correction in Indonesian financial markets has seen an acceleration of foreign portfolio investment outflows since mid-May. Combined equity and government bond investment outflows have totaled USD 3.6 billion since the start of May, with foreign inflows into Indonesian equities reversing all cumulative net inflows in the first half of Q2 to be flat on the quarter, while cumulative net inflows into government bonds over the quarter remained positive at USD 0.4 billion, following very strong inflows in April.
4 Platts, ‘Details of China's import ban on low-CV thermal coal’, 22 May 2013. 5 http://www.thejakartaglobe.com/news/indonesia-plans-coal-power-projects-as-china-import-curbs-loom/
(21 mt)
(70 mt)
(13 mt)
(1 mt) -
20
40
60
80
Low(< 5,100kkcal/kg)
Medium(5,100-6,100
kkcal/kg)
High(6,100-7,100
kcal/kg)
Very high(> 7,100kcal/kg)

A d j u s t i n g t o p r e s s u r e s I n d o n e s i a E c o n o m i c Q u a r t e r l y
July 2013 THE WORLD BANK | BANK DUNIA22
Fuel subsidy reform is expected to trim fuel import growth
The World Bank estimates that the increase in subsidized fuel prices will reduce total fuel import growth, narrowing the current account deficit by 0.1- 0.2 percentage points of GDP, relative to a no-reform scenario. While more difficult to quantify, the reduction in fuel subsidies should also be positively received by foreign portfolio and direct investors in Indonesia, supporting capital inflows over the longer-term. However, temporarily higher inflation in the as a result of the reform may add to depreciation pressures on the Rupiah in the near-term
Indonesia’s current account deficit is expected to persist at similar levels to 2012
Looking ahead, the World Bank projects the current account deficit to total USD 25.2 billionin 2013, or 2.7 percent of GDP. This implies a 2013 forecast current account deficit roughly in line with that in 2012 as a share of GDP, of 2.7 percent of GDP. This projection reflects a combination of gradually improving exports and weaker import growth, including due to fuel subsidy reform. The current account is projected to narrow to 2.1 percent of GDP in 2014 as exports recover further. The overall balance of payments is expected to record a deficit of USD 4.8 billion in 2013, on account of the Q1 outcome, anticipated whole-year current account deficit, and the recent deterioration in capital inflows to emerging markets, including Indonesia. As noted in the March 2013 IEQ, the weakening in Indonesia’s balance of payments dynamics and further Rupiah depreciation pressures have occurred against the backdrop of a gross external financing need which has risen significantly in recent years, driven primarily by increased gross private external debt (see Box 2). Indonesia’s ability to sustain strong FDI inflows, attract potentially volatile portfolio capital investment, and navigate the needed adjustments to ensure the balance of its external position will therefore likely remain in focus.
Box 2: External debt levels remain modest but liquidity risk has risen
Indonesia’s gross external stock has been growing since 2006, almost doubling from USD 133 billion to USD 257 billion as of April 2013. In light of the increase in market volatility seen during and since the 2008/9 global financial crisis, including over the last quarter for emerging markets, this sizable increase in external debt in absolute terms merits closer examination to assess Indonesia’s vulnerability to external shocks. At the outset, it is important to note that the sustainability of Indonesia’s external debt position is not in doubt, with the latest (2012) IMF Article IV report, for example, finding that Indonesia’s “…external debt ratio is expected to follow a declining path, and remain at manageable levels, under all standardized-shock scenarios.” While total external debt (owned by non-residents) has risen in absolute terms, as a share of GDP external debt has trended lower, declining from 47.7 percent of GDP in 2005 to 29.7 percent of GDP at end 2012 (Figure 27). This decline in external debt has been driven by a sharp reduction in external public debt, which decreased from 28.4 percent to 14.8 percent of GDP. Conversely, the ratio of private sector external debt to GDP has fallen to 12 percent in 2010 and risen again to 15 percent at end 2012. Private debt now accounts for 50.2 percent of total external debt as of end-April, up from 40.3 percent in 2005. The sustained increase in private sector external debt in recent years has been led by firms across several sectors, particularly those in the mining and drilling, electricity, gas and water, and financial, leasing and business services sectors. The borrowing of the financial sector, driven by foreign banks and joint ventures, accounts for the bulk of the debt increase. Financial sector external debt has almost tripled, climbing from USD 12.9 billion in 2006 to USD 35.2 billion at end-April 2013, or 27.3 percent of total private external debt (Figure 28), surpassing that of the manufacturing sector (down to 20.3 percent from 32.4 percent as a share of total). Firms in the mining and drilling sector have been the next most active source of additional external borrowing, with debt rising four-fold over 2006-2012 and accounting for 16.8 percent of total private external debt at end April 2013 (Figure 28). Finally, the external debt of companies in the utility sector has risen from USD 6.5 billion to USD 16.3 billion. Standard metrics indicate an increase in the liquidity risks associated with Indonesia’s external debt position. Short term external debt (by remaining maturity) has increased significantly since 2006 and now accounts for 21.7 percent of total debt, up from 15.6 percent in 2006, due mainly to the rise in short term private debt, which now accounts of 72.6 percent of total short-term external debt, up from 59.4 percent in 2006. The ratio of private short term debt over exports has grown steadily from 9.9 percent to 17.8 percent over this period, though this ratio has also been affected since 2011 by the decline in exports. As of April 2013, total external short term debt equated to half of Indonesia total currency reserves (Figure 27). Indonesia’s external debt service financing requirement has also risen, increasing as a share of exports from a quarter in 2007 to more than three quarters in 2012 (Figure 27). There is also an increasing reliance on US Dollar-denominated debt, which now accounts for 88 percent of total private external debt, to the relative detriment of the Japanese Yen. Thus, while some firms may enjoy natural US Dollar hedges, such as in the mining and drilling sector, the greater concentration of external debt in US Dollars may imply greater vulnerability to a sharp appreciation of the US Dollar. A number of factors mitigate the risks Indonesia may face from the increased use of external financing by banks and corporations. First, in the non-financial sectors, the bulk of new borrowing has been from parent and affiliated lenders and such inter-company

A d j u s t i n g t o p r e s s u r e s I n d o n e s i a E c o n o m i c Q u a r t e r l y
July 2013 THE WORLD BANK | BANK DUNIA23
loans may be less vulnerable to roll-over risk, and are one component of the strong increase in foreign direct investment into Indonesia experienced in recent years. In fact, if anything, official statistics likely understate the inter-company loan share in the overall external debt, since inter-dependencies between onshore and offshore affiliated companies are not always transparent. Further, since 2011, according to Bank Indonesia, compliance with external debt reporting requirements has also improved, increasing the visibility of private external debt in the official statistics and making it more difficult to interpret the upward trend in reported debt stocks and servicing costs. Over time, ongoing improvements in statistical coverage should facilitate improved monitoring of Indonesia’s private external debt dynamics, including at the more micro level; the top 100 companies in terms of external debt ranking account for around 65 percent of overall debt exposure. Figure 27: External debt solvency metrics have improved but some liquidity risk indicators have increased (percent)
Figure 28: Private external debt is widely distributed across economic sectors (private external debt by sector as of April 2013, percent of total)
Note: *2013 data is April 2013 and applies only to ST debt/reserves Source: BI; World Bank staff calculations
Source: BI; World Bank staff calculations
7. Risks to the outlook remain heightened on domestic and external grounds
The growth outlook faces risks…
The World Bank base case is for economic growth in Indonesia to slow only moderately in 2013, from 6.2 percent in 2012 to 5.9 percent in 2013, before picking up again in 2014. The key risk to this outlook is to the downside, where the recent modest weakening in domestic growth momentum extends and Indonesia experiences a more pronounced slow-down.
… as fuel subsidy reform presents challenges to macroeconomic management in the short-term…
The increase in subsidized fuel prices, while necessary on fiscal grounds and a positive development in terms of meeting Indonesia’s medium-term development goals, presents challenges to macroeconomic management in the near term. Higher fuel prices will initially generate a large one-off increase in the price level. Underlying price pressures are expected to remain contained, yet if temporarily higher inflation shows signs of feeding into higher inflation expectations, and if the Rupiah remains under pressure, further monetary tightening may be necessary, slowing the pace of growth. The resilience of private consumption, the single biggest source of demand in the economy, will be tested over the remainder of 2013 by the higher temporary inflation.
0
10
20
30
40
50
60
70
80
0
10
20
30
40
50
60
70
80
2005 2006 2007 2008 2009 2010 2011 2012 2013*
Private debt/GDP
Public debt/GDP
Short-term debt/reserves
Debt service/exports
27.3
4.8
16.8
20.3
12.6
5.38.13.8
Agriculture,forestry, fishing
Mining and drilling
Manufacturing
Electricity, gas andwater works
Housing andbuilding
Trading, hotel andrestaurants
Transport andcommuncation
Services
Other sectors
Financial
Non-financial

A d j u s t i n g t o p r e s s u r e s I n d o n e s i a E c o n o m i c Q u a r t e r l y
July 2013 THE WORLD BANK | BANK DUNIA24
… while investment growth has continued to weaken
The weakening of investment growth, which began in mid-2012, likely reflects the lagged impact of weaker commodity prices since mid-2011. Commodity sector conditions affect investment directly, as seen by the sharp drop-off in foreign transportation, and machinery and equipment investment, which is a key input in commodity-related activity. The strength of commodity demand also feeds into investment demand indirectly by affecting export earnings, household consumption (through household incomes, especially in regions where commodity production is important), as well affecting investment funding availability (through company profits). Given the complexity of these terms of trade and income effects, the lumpy nature of many investment projects, and the uncertainty surrounding international commodity prices, the future course of investment is difficult to predict and is a key source of uncertainty in the growth projections. Furthermore, should the latest down-turn in international commodity prices persist, investment could prove to be more of a drag on growth than currently expected.
There is renewed uncertainty over external demand…
As set out in the World Bank’s Global Economic Prospects report in June, the tail risks of a sharp slowdown in global economic growth, such as resulting from a renewal of financial market distress in the Euro Area, have lessened since the March 2013 IEQ. However, slowing growth momentum amongst some major middle income economies and the sharp sell-off seen in emerging markets in recent months adds to the uncertainties over the trajectory of the global economy. Further weakening in global commodity prices poses a particular, significant downside risk to the outlook for Indonesia’s economy.
…with Indonesian financial markets facing challenges from weaker demand for emerging market assets globally…
External financing conditions have become more challenging. Indonesian bond and equity markets remain relatively vulnerable to a continued sell-off in emerging market assets compared to regional peers, given the large presence of foreign investors relative to the size of domestic equities and bond markets, though Indonesia’s foreign exchange reserve buffer remains substantial (Figure 29). While the direct wealth effects of falling equities and other asset prices on households’ and firms’ consumption and investment decisions are likely to be small given their small direct exposures to these assets in aggregate, especially given the offsetting impact of ongoing robust property price growth (a sector which is less directly exposed to offshore conditions), consumer and business confidence may be affected, with flow-on impacts to consumption and investment. The confidence of local investors, and their cross-border asset allocations, also remains key to the outlook.
Figure 29: Indonesia’s foreign exchange reserves are substantial but so are external exposures (balance, USD billion)
Note: External debt data to April 2013, all other figures to end-May Source: BPS; World Bank staff calculations
0 25 50 75 100 125 150 175
Total FX Reserves
Short-term external debt
Non-resident equityholdings
Non-resident local gov.securities holdings
Non-resident SBIholdings
Sep 2008 May 2010
Sep 2011 May 2013

A d j u s t i n g t o p r e s s u r e s I n d o n e s i a E c o n o m i c Q u a r t e r l y
July 2013 THE WORLD BANK | BANK DUNIA25
…and highlighting the need to make continued macroeconomic policy adjustments
Recent events and the base case outlook for the coming quarters suggest that Indonesia’s policy settings likely need to adjust to somewhat less buoyant economic conditions, and potentially to more difficult external financing conditions. Bank Indonesia’s decision to raise the overnight deposit facility and policy rates in early June, and the increase in subsidized fuel prices, are examples of policy adjustments to changing conditions, which can help safeguard macro stability, in support of future growth. Allowing the Rupiah exchange rate to adjust further gradually, should this be warranted by developments in Indonesia’s external position, may also be desirable. Maintaining a flexible, yet predictable and well-communicated, approach to macroeconomic policy-making, as well as continued progress in the implementation of policies and improvement of the regulatory environment, will be key as Indonesia continues to navigate a period of significant domestic and international economic challenges.
Although it is too early to quantify the costs, the severe haze caused by forest and peat fires in Sumatra is an added near-term challenge
The current forest and peat fires in Sumatra, which have caused high levels of haze in Sumatra and Kalimantan (as well as neighboring countries), add to the downside risks to the economic outlook. There are likely to be significant economic, health and environmental costs to Indonesia from disruption to commerce, losses to productivity, resources deployed to tackle the fires (including the special task force that has been put in place), negative economic spillover effects from affected neighbors and trading partners, impairment of health and degradation of forest and land assets. The total cost and the risk to the overall economic outlook are not yet known, but are likely to be in the billions of dollars. The 1997/98 haze episode is estimated to have cost USD 9 billion for Southeast Asia (Applegate, 2006) and USD 6.3 billion for Indonesia alone (according to the Asian Development Bank). Today, with more sophisticated agriculture and tourism industries in place and higher population density in these areas, the economic losses could be even higher. On the environmental side, these fires have the potential to eliminate most of the recent progress made on climate change mitigation in the forest sector. In addition, the fires and haze generate tension with Indonesia’s important neighbors, distracts policymakers and generates negative international publicity. The fact that this is a seasonally recurring problem despite the substantial costs highlights the significant governance challenges present in the natural resource sectors. Although the use of fire is illegal (in 2001, Indonesia passed a law [Government Regulation 4/2001] that forbids all forest and land fires), fires are still deliberately started for forest clearance purposes, especially within oil palm and industrial tree plantation concession areas. Enforcement of the existing law and better land use practices require a common effort from the public and private sector, including the plantation companies, many of them from Malaysia and Singapore.

A d j u s t i n g t o p r e s s u r e s I n d o n e s i a E c o n o m i c Q u a r t e r l y
July 2013 THE WORLD BANK | BANK DUNIA26
B. Some recent developments in Indonesia’s economy
1. Examining the fuel subsidy compensation package
To avoid adverse effects of fuel price increases on the poor, the Government will invest in a wide-reaching compensation package…
The reduction of the fuel subsidy is expected to increase inflation, driven primarily by the increase in fuel, food, and transportation prices throughout Indonesia, as discussed in Section 5 of Part A. As food and transport costs comprise a large share of a poor or vulnerable household’s expenditures, any increase in these costs is likely to have a negative impact. World Bank projections estimate that, in the absence of compensation, the increase in fuel prices (to IDR 6,500 per liter for petrol and IDR 5,500 per liter for diesel) would significantly slow the decrease in the poverty rate; without compensation, the official poverty rate would fall from 12 percent in March 2012 to 10.5 percent in March 2014, implying a significantly slower pace of poverty reduction than that seen over recent years. In contrast, with a short-term compensation measure of a cash transfer to poor and vulnerable households for four months, projections suggest that poverty will fall more significantly, to 9.4 percent by March 2014. The compensation package included in the revised Budget is therefore expected to play a key role in helping Indonesia continue to reduce the poverty rate in the short-term despite higher subsidized fuel prices, as well as constituting a significant expansion of social protection over the longer-run. The following Section will review the individual components of the Government’s overall compensation package, and assess the extent to which these programs are expected to provide adequate, timely and effective assistance for protecting poor and vulnerable households that are least able to cope with the negative effects of higher fuel prices.6
… to both cushion households in the short-run and expand the social protection system in the long-run
To avoid a negative impact of higher fuel prices on poor and vulnerable households, two types of responses are required. First, short-term and temporary protection measures are needed to cushion households from the immediate inflationary impact of the fuel price increase. Second, long-term responses can help to support on-going poverty reduction efforts – especially targeting the poorest households – and address rising inequality. 6 This Section draws from research conducted by the World Bank on Indonesia’s social assistance programs. All research reports are available at www.worldbank.org/id/poverty. (See World Bank, 2012. Protecting Poor and Vulnerable Households)

A d j u s t i n g t o p r e s s u r e s I n d o n e s i a E c o n o m i c Q u a r t e r l y
July 2013 THE WORLD BANK | BANK DUNIA27
Reflecting these twin response types, the Government of Indonesia prepared a compensation package that is included in the 2013 Budget revision recently approved by Parliament. The package, totaling IDR 29.05 trillion or about 74 percent of the total fuel subsidy savings, includes two main components: a) the Special Compensation Program (Program Kompensasi Khusus), and b) the Social Protection Acceleration and Expansion Program (Program Percepatan dan Perluasan Perlindungan Sosial, P4S).
Figure 30: Savings support a range of programs (share of savings allocated by program, percent)
Table 7: Compensation will reach 15.5 million households (budget allocations by program, Rupiah)
Components Amount
(IDR trillion)
BLSM (@ IDR 150.000, for 4 months, for 15.5 households)
9.3
Conditional cash transfer (PKH) 0.7
Rice for the poor (Raskin) 4.3
Scholarship for the poor (BSM) 7.5
Basic infrastructure 7.25
Total compensation packages 29.05
Source: Ministry of Finance Source: Ministry of Finance
a. Short-term programs to protect poor and vulnerable households
Short-term programs to cushion poor households from immediate effects have been controversial…
Program Kompensasi Khusus includes three temporary measures to protect poor and vulnerable households from the inflationary shock of the fuel price increase:
a. First, an unconditional cash transfer (Bantuan Langsung Sementara Masyarakat, BLSM) in the amount of IDR 150,000/household/month for a duration of four months will be provided to 15.5 million households in two payments.
b. Second, in addition to the 15kg of rice per poor household per month that is already being distributed through the Rice for the Poor (Beras Miskin, Raskin) program, the Government will provide an additional 45 kilograms (kg) of subsidized rice to the same households that will receive BLSM. This will be provided in 15kg bundles once a month for three months.
c. Third, some of the savings will be re-allocated to three short-term infrastructure programs: community level infrastructure (Percepatan Perluasan Pembangunan Infrastruktur Permukiman, P4-IP), potable water systems (Percepatan Perluasan Pembangunan Sistem Penyediaan Air Minum, P4-SPAM), and irrigation and water source infrastructure (Percepatan Perluasan Pembangunan Infrastruktur Sumber Daya Air, P4-ISDA).
Much of the controversy surrounding the design of the compensatory measures has focused on the proposal to use BLSM as an instrument to buffer poor and vulnerable households from the fuel price increase. Opponents have argued that cash benefits could be easily politicized and used as a means for political parties to garner support in the run-up to general elections scheduled for 2014. In addition, there were many concerns about the effectiveness of using unconditional cash transfers to protect the poor. Critics argued that such programs are not effective; they are more likely to be misspent, not reach those who deserve protection, foster laziness among the poor or create greater dependency on the state.
BLSM; 32%
Conditional cash
transfer (PKH); 2%
Rice for the poor
(Raskin); 15%
Scholarship for the poor
(BSM); 26%
Basic infrastruc-ture; 25%

A d j u s t i n g t o p r e s s u r e s I n d o n e s i a E c o n o m i c Q u a r t e r l y
July 2013 THE WORLD BANK | BANK DUNIA28
…but research shows that cash transfers are most effective in quickly providing protection
Research on Indonesia’s experience with unconditional cash transfers (UCTs) can shed light on the debate about the effectiveness of the upcoming BLSM program.7 Following the increase of fuel prices in 2005, the Government launched the Bantuan Langsung Tunai (BLT), which provided cash compensation totaling IDR 1,200,000, delivered in four installments, to a total of 19 million recipient households. The program was again deployed in 2008 when fuel prices temporarily increased further, and 18.4 million households were compensated with a total of IDR 900,000, divided into three payments. Research conducted by the World Bank on the implementation and effectiveness of UCTs in Indonesia found that:
BLT was effective in preventing poor households from being negatively affected. The transfers, equal to approximately 15 percent of monthly spending, were sufficient to keep targeted households from falling further behind. Moreover, there was also a spill-over effect: the BLT program actually helped to stimulate an increase in spending among non-recipient households. As a consequence, the World Bank has estimated that without the 2008-09 BLT, poverty would have increased in March 2009 to 15.8 percent from 15.4 percent in March 2008, rather than falling as it did with the BLT, to 14.2 percent.
There is no evidence that beneficiary households misspent the transfer. BLT was used to buy basic necessities (especially rice), one-time costs like school fees or clothes for Eid ul-Fitr holidays, or transportation costs. Spending on tobacco and alcohol did not increase in BLT households relative to poor households that did not receive the transfer.
Similarly, there is no evidence that BLT induced laziness or dependency. Heads of households that received BLT were not more likely to leave work. This is most likely because the size of the benefit was not large enough, or sustained enough, to discourage working. In fact, BLT households were more likely (by ten percentage points) to report that they had found new jobs and moved into employment, perhaps using the BLT money for transportation to more distant but better jobs, or to assist with childcare.
BLT funds reached almost all recipients on the beneficiary lists, but local officials increasingly extracted “fees” from beneficiaries. Transfers were made directly from the Ministry of Finance to beneficiary households, through post offices, eliminating opportunities for misdirection of the funds. There were reports, however, that after cash transfers were collected by recipients some post office officials and community officials charged “fees.” This occurred 10 percent of the time in 2005, and 46-54 percent of the time in 2008-09. This was typically done to re-distribute to households that were not included in the list (due to miss-targeting or otherwise) and to subsidize collective transportation and identity card costs.
There is no evidence that shows whether or not BLT undermined social capital. Some critics of cash transfer programs in Indonesia argue that it can erode social capital such as seen through voluntary community work, or gotong royong. No research to date, however, has clearly proven the effects of cash transfers, either negative or positive.
These findings indicate that UCTs are effective in providing temporary assistance to buffer poor households from short-term price shocks. Moreover, the mechanism for disbursing the transfers is the more direct and simple than any of the other existing social assistance programs available in Indonesia, although implementation matters for the benefits to be fully effective.
But the exclusion of many poor indicated a need for better targeting methods
Nevertheless, the BLT still excluded many poor and vulnerable households that were not included on the beneficiary list. With a coverage of 18.5m households, BLT was targeted at approximately the poorest 30 percent of households. Of these, around half were excluded, according to a recent World Bank report, and half of all benefits went to households outside of the poorest 30 percent. Despite this, when targeting was compared across Indonesia’s major social assistance programs, BLT performed the best. In order to be effective as a social assistance instrument, program targeting needs to ensure that benefits are received by poor and vulnerable households.
7 World Bank. 2012. Bantuan Langsung Tunai (BLT) temporary unconditional cash transfer.
A d j u s t i n g t o p r e s s u r e s I n d o n e s i a E c o n o m i c Q u a r t e r l y
July 2013 THE WORLD BANK | BANK DUNIA29
In-kind transfers, however, are shown to be less reliable
In-kind transfers, such as the provision of subsidized rice through Raskin, are another mechanism that can quickly provide protection to at-risk households. Previous research, however, shows that the program faces many delivery challenges.8 In 2010, recipient households reported that they bought an average of 3.8kg per month, far short of the 13-16kg of subsidized rice that should have been provided to poor and vulnerable households (based on public announcements). While some of the rice is re-distributed across communities, up to 30 percent of Raskin allocations (based on estimates between November 2003 and January 2004) went missing in-between the distribution points and Raskin-buying households; in some areas the estimated rate was as high as 75 percent. Furthermore, the Raskin price for households is often higher than the stipulated price. Between November 2006 and January 2007, households reported paying IDR 1,689 per kilogram of Raskin rice, while the official price was IDR 1,000 per kilogram. Efforts, however, are currently underway to improve the targeting, socialization and delivery of Raskin benefits.
Advances in targeting will ensure that benefits are more likely to reach the right households…
Since 2010, the Secretariat of the National Team for the Acceleration of Poverty Reduction (TNP2K), with the assistance of Statistics Indonesia (BPS), has been developing a Unified Database of potential beneficiaries (Basis Data Terpadu, or BDT). This has the important advantage of being a single registry to target all programs, rather than having to rely on a fragmented set of lists held by different programs, as was done in the past.9 As a consequence, poor households are more likely to receive all the programs to which they are entitled, rather than just some. Moreover, the careful design of the database and incorporation of international best practices means that many of the previously excluded poor households will now become program beneficiaries.
…as Indonesia begins to move towards a more integrated social assistance framework…
The BDT includes 25 million households, or just over 40 percent of Indonesians. BDT is now operational and has already been used to select 400,000 new beneficiaries for the 2012 expansion of Indonesia’s pilot conditional cash transfer program, Program Keluarga Harapan (PKH). In addition, 76.4 million names were drawn from the BDT for the new Jamkesmas (health fee waivers for the poor) cards, and 15.5 million households for targeting Raskin. Also, the Ministry of Education has agreed to use the BDT for the selection of beneficiaries for Bantuan untuk Siswa Miskin (BSM), a series of programs that provide financial assistance to poor students. The TNP2K team managing the registry has been working closely with various regional governments at both provincial and district level who have requested the data for local government social assistance and poverty alleviation programs financed by regional budgets. For some of these programs, such as Jamkesda (local health assistance programs, which supplement Jamkesmas), using the Unified Database to select beneficiaries provides the necessary coordination in targeting to avoid overlapping beneficiaries. With the launch of Program Kompensasi Khusus and P4S, the Government is taking the opportunity to issue a Social Protection Card (Kartu Perlindungan Sosial, or KPS) to the poorest 15.5 million households in the database. This card is the basis for receiving BLSM and additional Raskin benefits from the compensation program, as well as for eligibility for an expanded BSM under P4S. The use of a single card for multiple programs marks an important first step towards an integrated social assistance framework in Indonesia. This will be the first time Indonesia has coordinated social assistance programs and beneficiaries using a single registry, and paves the way in the future for integrated delivery of benefits, as well as complaints and grievances.
…and ensures that beneficiary lists are up-to-date
Furthermore, the Government will be coordinating with local communities to help identify poor households which are currently excluded from the BDT database. Recent field research by the Government, the World Bank and the Abdul Latif Jameel Poverty Action Lab (J-PAL, from the Economics Department of the Massachusetts Institute of Technology) has shown that carefully facilitated community involvement can improve targeting outcomes, particularly amongst the poorest. These findings were based on controlled experiments, 8 World Bank 2012. Raskin Subsidized Rice Delivery 9 World Bank 2012. Targeting Poor and Vulnerable Household in Indonesia.

A d j u s t i n g t o p r e s s u r e s I n d o n e s i a E c o n o m i c Q u a r t e r l y
July 2013 THE WORLD BANK | BANK DUNIA30
using trained facilitators. Successful implementation of community targeting methods, however, will depend on designing and delivering methods that can be scaled up and replicated in communities across the country. If successful, not only will community targeting processes help identify additional poor households to receive compensation, it will also contribute to the planned 2014 update and expansion of the database, as these households will be incorporated into the recertification process, which is required to keep the BDT updated over time.
With the provision of the BLSM, poverty reduction is expected to continue
The provision of BLSM to poor and vulnerable households will help Indonesia maintain advances in reducing poverty. With the provision of the unconditional cash transfer for a period of four months, the World Bank estimates that the poverty rate will fall to 9.4 percent by March 2014, instead of a more modest decline to 10.5 percent in the case of a price increases but no BLSM compensation (Figure 31). The anticipated decline in the poverty rate following the increase in subsidized fuel prices accompanied by compensation would be consistent with the experience of the 2008 subsidized fuel price increase.
Figure 31: With BLSM, the poverty rate will continue to drop Indonesia Poverty Rate (percent), actual and forecasted scenarios
Note: 2013 is World Bank estimate, 2014 are World Bank estimates under each scenario Source: BPS, World Bank estimates
b. Long-term programs to promote poor and vulnerable households
The fuel subsidy reform has provided a unique opportunity for Indonesia to scale-up and enhance its emerging social protection system…
The Government is also re-allocating the savings from subsidy reduction towards two of the permanent household-based social protection programs:
d. Bantuan untuk Siswa Miskin (BSM). The coverage of BSM will almost double from 8.7 million to 16.6 million beneficiaries. The benefit levels will also significantly increase: primary school (SD) benefits will increase from IDR 360,000 to IDR 450,000 per year per student, while junior secondary (SMP) benefits will increase from IDR 550,000 to IDR 750,000 per year per student.
e. Program Keluarga Harapan (PKH), the conditional cash transfer program. This program will also be expanded from the current level of 1.5 million households to 2.4 million households in 2013 and 3.2 million households in 2014. At the same time, average benefit levels will increase from IDR 1.4 million to IDR 1.8 million per year per household.
By re-allocating fuel subsidy savings to its long-term social programs, Indonesia is effectively using this opportunity to both scale up and reform its emerging social assistance system. This is much needed. In 2010, Indonesia spent almost IDR 30 trillion on its social assistance programs, equivalent to 0.5 percent of GDP. This is low in comparison to other East Asian countries that spend, on average, 1 percent of GDP, or Latin American countries that spend an average of 1.3 percent of GDP. Although there is still a need to deepen investments in social protection as Indonesia transitions to more sophicated systems that are appropriate for a middle-income economy, the reallocation of fuel subsidy savings this year is a significant step in the right direction.
8
10
12
14
16
18
2007 2008 2009 2010 2011 2012 2013* 2014*
No price increasePrice increase, no BLSMPrice increase, BLSM

A d j u s t i n g t o p r e s s u r e s I n d o n e s i a E c o n o m i c Q u a r t e r l y
July 2013 THE WORLD BANK | BANK DUNIA31
Figure 32: Programs will significantly increase coverage of poor and vulnerable households… (coverage levels by program, millions)
Figure 33: …and benefit levels are increasing (benefit levels by program, million IDR per year)
Note: * Millions of students (BSM) or households (PKH) Source: TNP2K
Source: TNP2K
P4S includes significant reforms that will improve the effectiveness of Indonesia’s education assistance program
By expanding financial assistance for poor students and increasing benefit levels, the subsidy savings can help to mitigate the problem of rising inequality in Indonesia by improving the mobility of the next generation. Benefit level increases and advances in program targeting address some of the main program challenges identified in the World Bank’s review of this social assistance program.10 Improvements in the adequacy of BSM assistance. In the past, assistance was not adequate for poor families to keep their children in school. Typically, the benefit levels were equal to approximately 30 percent of education out-of-pocket costs faced by families. Also, BSM amounts were not indexed to inflation; therefore, beneficiaries saw the value of the transfers erode over time. By increasing the benefit levels through the P4S program, it is more likely that households will be able to afford to keep their children in school for the mandatory levels of primary and junior senior secondary. Improvements in the targeting of BSM assistance. The P4S program continues the Government’s overhaul of the methods used to target BSM. As mentioned above, the Ministry of Education and Culture and the Ministry of Religious Affairs have been working closely with the TNP2K Secretariat to use the Unified Database to target BSM beneficiaries. Previously, the distribution of assistance was carried out by school-based committees based on local quotas that were not aligned with regional poverty rates. The targeting performance was poor; a student from the richest 60 percent of households was equally likely to receive assistance as a student from the bottom 40 percent of households. In addition to using the unified database to identify student beneficiaries, major changes have been made in how benefits are claimed. Students from eligible families can now approach schools, carrying their Social Protection Card and supporting documentation, to claim their entitled assistance. By empowering beneficiaries in this way, it is expected that the expansion of BSM through the P4S program will help to ensure that a greater share of assistance will reach students who are at the greatest risk of dropping out.
… and more effective social protection for very poor households
PKH is a social assistance program that has proven to be effective in tackling chronic and extreme poverty. An impact evaluation of the program conducted by the World Bank in 2011 found that beneficiaries were significantly more likely to use local health services and
10 World Bank, 2012. Bantuan Siswa Miskin Cash Transfers for Poor Students.
0
4
8
12
16
20
BSM PKH
Currently Expanded
0.0
0.5
1.0
1.5
2.0
BSM - SD BSM - SMP PKH
Currently Expanded

A d j u s t i n g t o p r e s s u r e s I n d o n e s i a E c o n o m i c Q u a r t e r l y
July 2013 THE WORLD BANK | BANK DUNIA32
that are targeted by PKH
adopt healthy behaviors including: pre-natal care, birth deliveries at health facilities, post-natal care, immunizations, and growth monitoring check-ups for babies and infants.11 Program impact on improving school enrollment and time spent in school, however, was statistically insignificant (with the exception of hours spent in school, which only saw a 5 percent improvement over baseline values). As with BSM, given existing PKH implementation issues identified in the World Bank’s review of Indonesia’s social assistance programs, the reforms that will be carried out through the P4S program are also likely to increase the effectiveness of the PKH program. Improvements in the adequacy of PKH benefits. It is likely that the full impact of the program was not realized because the benefit levels did not match the expenses faced by families in order to afford health and education services. For example, benefit levels were sufficient to cover the total expenditures for one year of junior secondary education, but less than half (43 percent) if transportation costs were included. Similarly, mid-wife delivery charges range between IDR 200,000 – 800,000 (based on a 2008 SMERU study), which at the high end is equivalent to the previous PKH transfer for pregnant mothers. Also, the benefit levels have not been adjusted for inflation, which has eroded the real value of the cash transfers over time; this resulted in a 22 percent decline in the real value of the benefit levels between 2007 and 2010 (adjusted using poverty basket inflation). Under the P4S program, minimum benefit levels will increase from IDR 600,000 to IDR 800,000 per year per family, and the maximum benefit level will increase from IDR 2,200,000 to IDR 2,800,000 (the calculation is based on number of number and age of children, and the inclusion of pregnant or lactating women in the family). In addition, by receiving the Social Protection Card, PKH beneficiary families will automatically have access to the BSM program, BLSM and Raskin allocations. This will be the first time that individual programs in Indonesia are deployed as a system to provide comprehensive support to extremely and chronically poor households. Taken together, this assistance will allow them to better afford to invest in health and education services, increasing the chance that their children can better help themselves escape poverty.
Attention is needed to ensure that programs are properly delivered and monitored
The design of the compensation package is a major advance in the evolution of Indonesia’s emerging social protection system, similar to the pathway followed by more advanced middle-income economies. The success of the program, however, will depend on efficient and effective delivery of the individual components of the program. In the past, implementation problems have undermined the efficacy of these programs. In the BSM program, for example, 83 percent of students who reported receiving assistance in 2009 reported receiving only 39-50 percent of stated benefit levels. Although it takes time to build effective delivery systems, there are immediate actions that the government can undertake to monitor and improve the delivery of P4S programs. First, focus on improving beneficiary awareness of entitled benefits under the compensation package. In
the past, the delivery of social assistance programs has been undermined by limited beneficiary knowledge about the program or how to claim benefits. A vast majority of interviewed Jamkesmas cardholders, for example, did not know what hospital outpatient services their card entitled them to. An experiment conducted by J-PAL in cooperation with the TNP2K Secretariat on innovations in Raskin delivery, found that beneficiaries received more subsidized rice when awareness raising activities informed them about how much rice they were entitled to. Therefore, communication materials and strategies prepared by the TNP2K Secretariat for P4S play an important role in the implementation of the program, but responsibility still falls on implementing agencies to use the materials to improve awareness of beneficiaries and their communities.
Second, conduct in-time monitoring of the program in order to fix problems during implementation and ensure accountability for P4S delivery. Program monitoring is typically carried out by local-
11 World Bank 2012. Programa Keluarga Harapan Conditional Cash Transfer.

A d j u s t i n g t o p r e s s u r e s I n d o n e s i a E c o n o m i c Q u a r t e r l y
July 2013 THE WORLD BANK | BANK DUNIA33
level implementers and delegated with limited financial or technical support, and no response systems to resolve identified issues. The P4S program provides an opportunity to test innovations to monitor program delivery. The possibilities include: third party monitoring of implementation (university and NGO networks, for example, are both credible and widespread), monitoring through national survey instruments implemented by BPS, and piloting with mobile technology and complaint centers. While central coordination agencies, such as the TNP2K Secretariat and Bappenas will play a major role in designing and executing monitoring systems, the cooperation of central implementing agencies and local governments is critical.
Finally, conduct comprehensive evaluations to assess program effectiveness. Learning from this experience, the Government can improve the design and performance of its social protection programs by learning what works and what does not work. If possible, the findings for the evaluation can be linked to future budget allocations of implementing agencies to encourage improvements in program delivery.

A d j u s t i n g t o p r e s s u r e s I n d o n e s i a E c o n o m i c Q u a r t e r l y
July 2013 THE WORLD BANK | BANK DUNIA34
2. Indonesia’s challenge: implementing the new social security system
Indonesia is implementing a new social security system…
The Government of Indonesia is in the process of implementing a new National Social Security System (Sistem Sosial Nasional, or SJSN). Programs under the new system are mandatory and will cover all Indonesians, including both formal and informal sector workers, for five benefits – health, pension, old-age savings, death benefits and work accident – and provide the same benefits for all. Contributions to the SJSN programs are set at levels that are sufficient to finance expected expenditures; each fund should be self-sustaining. The legal bases for the new system are Law No. 40/2004 on National Social Security System and Law No. 24/2011 on Social Security Administrative Bodies (Badan Penyelenggara Jaminan Sosial, or BPJS). This Section provides a brief overview of the ambitious task of implementing the SJSN system, focusing on key challenges and factors to consider for successful implementation of the new and comprehensive social security system.
…which may bring big benefits for the country and its citizens
The national social security system will help Indonesia mobilize the population’s increasing disposable income to strengthen the coverage and depth of the health system, protect against premature death and work injuries, and provide income security following exit from the labor force. The SJSN programs are consistent with the government’s pro-poor, pro-jobs, pro-growth agenda, and will play a major role in supporting the government’s macroeconomic policies, in the medium- and long-term. They are also part of the programs to ensure human rights and individual dignity for all Indonesians. If implemented well, the SJSN programs can help reduce vulnerability, protect against economic shocks, facilitate job mobility, reduce poverty among the elderly, help reduce inequality, and mobilize scarce savings.
Fulfillment of the SJSN vision depends on future decisions and actions
The success of the new system will ultimately depend on how well it is designed, implemented and managed. The Government’s efforts to implement a well-designed, fiscally sustainable, robust and comprehensive national social protection system will prove challenging and will require a series of major actions from the Government and the BPJS to succeed. Collaboration among implementation working group members from multiple ministries will be needed to ensure collective agreement on the broad strategy for the implementation and operation of the new system.
a. Putting the change in context: Where Indonesia is now
Social security coverage is currently fragmented and incomplete…
Indonesia currently has social insurance schemes covering separate segments of the labor market. A different social security administrator manages each scheme. These administrators are for-profit state-owned enterprises that report to the Ministry of State-Owned Enterprises and are supervised by a variety of different Ministries. Only about 12 percent of workers are covered by a pension scheme, almost entirely in the formal sector, and about 60 percent of the entire Indonesian population are covered by health insurance.
…with coverage for civil servants, the military and police
The administrator PT Taspen manages the pension and endowment insurance programs for civil servants and PT Asabri manages the pension and endowment insurance for military and police personnel. Civil servants receive a lifetime pension annuity financed by the state budget and paid through PT Taspen. They are also eligible for an endowment insurance program that pays a lump sum at retirement and death benefits before and after retirement. Military personnel have very similar benefits to those of civil servants, but PT Asabri manages those programs. Only civil servants, the military and those covered by voluntary employer-sponsored defined benefit pension plans are currently eligible for lifetime monthly annuity benefits.
… but limited coverage for formal sector workers…
PT Jamsostek provides social insurance for formal sector workers. Almost every enterprise is obliged to register itself and its workers with PT Jamsostek and provide social security benefits to its employees. Unfortunately, compliance is poor and only about 10 million out of an estimated 40 million formal sector workers are active contributors. One of the social insurance programs is an old age savings fund, referred to as Jaminan Hari Tua (JHT).
…and very limited The bulk of informal sector workers have no social protection. There is a small pilot

A d j u s t i n g t o p r e s s u r e s I n d o n e s i a E c o n o m i c Q u a r t e r l y
July 2013 THE WORLD BANK | BANK DUNIA35
informal sector, and health, coverage
program for informal workers sponsored by Jamsostek that includes old age savings benefits. The progress in expanding coverage through the Jamsostek pilot project, however, has been slow. The total number of members was only about 400,000 by the end of 2010. The turnover of members is also very high, as members can sign up and leave the program at any given time. In terms of health insurance coverage, PT Askes provides insurance primarily to civil servants and their families and covers about 16.4 million people. PT Jamsostek provides health insurance to about 5.5 million people, while another 10 million are covered by employers who opted out of Jamsostek coverage and established their own programs. The Jamkesmas fee-waiver program sponsored by the Ministry of Health provides coverage to about 86.4 million poor and vulnerable people while Jamkesda programs (financed by local government budgets and generally complementary to the national Jamkesmas program) cover about 32 million, though some of these may also be covered by Jamkesmas. Finally, about 5 million individuals have purchased private health insurance. Consequently, the total covered is about 150 million, or about 60% of the population.
Implementation of SJSN, starting with the health system, is now underway…
The SJSN program implementation began in earnest with the passage of the BPJS Law in November 2011. The law reduces the number of social security administrators, introduces a new legal and governance structure and a simpler system of supervision, increases system transparency and provides more open public information. In addition, decrees issued by the Coordinating Ministry of People’s Welfare in February and March 2012, established the bureaucratic structure and responsibilities for SJSN implementation. The SJSN health system will begin on January 1, 2014. The Government has already issued a regulation defining the benefit package for the health program. The required contribution rates for the poor, informal sector and formal sector, however, are still under discussion. The health benefit package is comprehensive and covers almost all types of medically-required interventions. This is consistent with the requirements of the SJSN Law. It also maintains the high level of coverage that is currently provided under the Jamkesmas program, which has the richest benefit package of any program in the country today. Even expensive procedures such as open heart surgery, organ transplants, hemodialysis and cancer treatment are covered. This will put a tremendous strain on Indonesia’s health system, as it will likely take the government years to increase the supply side – facilities, equipment, medical supplies and health care professionals – to sufficiently handle the expected demand for sophisticated health services. The SJSN employment programs – including pension (defined benefit), old-age savings (defined contribution), death benefits and work accident – will not begin until July 1, 2015 and consequently, they are at an earlier stage of development. A roadmap to guide the implementation is expected to be issued shortly. Active discussion on the design and financing of the SJSN employment programs, the rules for investment of pension plan assets, and the rules for asset-liability management of the pension program have also begun.
…including institutional transformation
Based on the BPJS law, there will be only two administrators: one for health and one for the employment programs. The two BPJS will be not-for-profit public legal entities operated in the best interest of all participants. Both PT Askes and PT Jamsostek – the BPJS Health and BPJS Employment, respectively – are actively working on their transformations, with a focus on those activities that must be completed by December 31, 2013. These include the impending shutdown of both companies, the calculation of plan liabilities, the transfer of assets to the new BPJS and to the appropriate social insurance funds, and the starting financial statements for BPJS Health and BPJS Employment. There is also on-going discussion about the governance structure, internal audit procedures, oversight and supervision of the two new entities.

A d j u s t i n g t o p r e s s u r e s I n d o n e s i a E c o n o m i c Q u a r t e r l y
July 2013 THE WORLD BANK | BANK DUNIA36
b. Coverage, cost and fiscal sustainability considerations
Universal coverage promotes labor mobility and stabilizes program financing
The national social security system is a bold effort to transform Indonesia’s social protection system. One of the main goals is to achieve universal coverage – that is, to cover all Indonesians in the new system regardless of whether they work in the formal or informal sector. With the new programs beginning in 2014 and 2015, the government plans to reach universal coverage by 2019. International experience, however, suggests that it will likely take a decade or more to expand coverage to the entire population. For example, in Japan and Korea it took more than 20 years to achieve full coverage. Nonetheless, if it is done well, everyone will participate and receive benefits from the programs and the costs of the programs will be equitably shared to achieve social solidarity. Universal coverage will also allow workers to change jobs without losing coverage, and will create a more dynamic labor market.
A successful system will require attractive benefits at a fair and affordable price
The nationwide SJSN programs will differ in both design and coverage from the existing programs and will include a new defined benefit pension program. There are two fundamental ways to think about designing the SJSN programs. The first method – the social policy perspective – is to determine the desired level of benefits and then calculate the costs and required contribution rates. The second method is to start by determining the amount that employers, labor and the government are willing and able to contribute and then work backward to determine the affordable level of benefits. In practice, it is best to use a combination of both methods to produce optimal results. The goal is to find a combination of benefits and contributions that are both meaningful and affordable even in the face of adverse experience. The process of defining benefits and setting contribution rates for the SJSN programs will need to take into account different characteristics, needs, and ability and willingness to pay between formal and informal sector workers. Programs must be designed with workers’ wants and needs in mind, but at the same time the required contribution rates must be actuarially determined and set at a reasonable level for workers, employers and government. Workers must be able to afford the contributions and the contribution rate must not create an unreasonable burden on employers. In the end, workers and employers should contribute because they want to, not because they are forced to. Reasonable benefit levels and modest contribution rates will also allow the government to pay for the poor without jeopardizing the country’s fiscal position. The SJSN health program provides a good illustration of these challenges. The SJSN law requires a comprehensive medical package and this has been incorporated into the implementing regulations. The contribution rates for the poor, informal sector not poor and the formal sector are still under discussion, as are the methods that will be used to reimburse medical personnel and facilities for their services. Although the new system begins on January 1, 2014, it will take time for the system to be able to fully deliver on its promises. Some of the many challenges facing government include raising members’ awareness of the program and it eligibility conditions and benefits, managing participant expectations, building a network of public and private providers and facilities, and improving the capacity and quality of the medical system. All these activities, as well as population aging will increase the demand for high quality, sophisticated medical services. It will be challenging for the government to provide these comprehensive medical services while keeping costs at a level that participants can afford.
Programs must be fiscally sustainable in the short and long-term…
In this respect, it is important to formulate and implement policies and procedures to ensure the fiscal sustainability of the SJSN social insurance funds and to ensure that the financial risks of the social insurance programs are properly managed. Financial analysis, complex actuarial calculations and sophisticated computer models are needed to quantify the financial impact of proposed designs and ensure that contributions are sufficient to pay promised benefits.

A d j u s t i n g t o p r e s s u r e s I n d o n e s i a E c o n o m i c Q u a r t e r l y
July 2013 THE WORLD BANK | BANK DUNIA37
…with sustainability considerations applying to each fund
Another reason for caution in setting contribution rates is that the SJSN Law does not allow the net assets from one SJSN social insurance fund to be used to subsidize deficits in another fund. Rather, each fund must have its own contribution rate and be self-sustaining. Although the BPJS and the social insurance funds are not-for-profit, the social insurance funds will require some net asset, set at a sufficient level to cover claim reserves and to cover random fluctuations in claims. Without some net asset, the funds would need to turn to the government for additional funds every time claims were higher than expected. The amount of net asset required will vary by fund, as the risk of adverse claim fluctuations is greater for some funds than others. For example, the risk of higher than expected claims is greater in the health fund than in the death benefit fund. Although not required by law, to the extent possible, within any one fund the contribution rates for the formal sector, informal sector who are not poor and the informal sector poor should be properly calculated so that there are minimal subsidies among the three groups. Otherwise, the groups that are paying too much will resent being forced to subsidize the benefits of the groups that are paying too little.
The SJSN pension program poses particular challenges
The SJSN pension program presents several additional challenges because the cost will increase over time as the pension system matures and as the population ages. This program must be carefully monitored, managed and adjusted to keep it fiscally sustainable over time. Pension programs have particularly long time horizons. Workers may begin making contributions at age 20, may not retire for another 40 years, and then may receive benefits for another 30 years. Consequently, the time frame for planning, financing and investing is very long. Pension plans take decades to fully mature and are significantly impacted by long-term trends such as population aging. For this reason, pension models often make projections over 75 to 100 years. Especially for pensions, the short-term impact of program introduction or changes is normally very different from the long-term impact.
c. Administration, governance and capacity considerations
Robust administrative systems are needed, particularly for the unique IDs required…
In order to properly administer the social security programs, it is important to ensure everyone receives a unique identification number and that there is no duplication of identification numbers. The SJSN and BPJS laws make each BPJS responsible for issuing unique ID numbers to its members. Since using different ID numbers for the health and employment programs is inefficient, the two BPJS will need to work together to issue a common identification number for use in all five SJSN programs. The unique ID number has two distinct purposes. It will allow individuals to prove their identity when requesting services or receiving payments. And it will be used to track individual salary, service credits and contribution history in the social insurance funds. The unique identification numbers for SJSN members could be the same as the national identification number (Nomor Induk Kependudukan, NIK) or it could be a different number that is mapped to the NIK. Assessment should be done on the adequacy of the NIK and any potential enhancements that could be made to help facilitate its effective use in SJSN program administration.
…and for collection of contributions from both formal and informal sector workers…
Another key administrative task is to collect and properly credit contributions for all workers. While contribution collection mechanisms for formal sector workers are already available today in Jamsostek’s mandatory social insurance programs, there is still widespread evasion. The current participation rate in Jamsostek’s old age savings program (Jaminan Hari Tua, JHT) is below 30 percent, in large part because Jamsostek lacks enforcement authority. Unlike formal sector workers, there is no effective contribution collection mechanism available for informal sector workers. Consequently, it is crucial to develop an effective contribution collection model for the informal sector now. Otherwise, there will undoubtedly be low informal sector participation. This will have two negative consequences.

A d j u s t i n g t o p r e s s u r e s I n d o n e s i a E c o n o m i c Q u a r t e r l y
July 2013 THE WORLD BANK | BANK DUNIA38
Informal sector workers will not be entitled to benefits from the SJSN programs, and the financial stability of the SJSN system will be undermined. When evasion is widespread, it negatively impacts the financial solvency of the insurance programs, because only the poorer risks will choose to join while the better risks will choose to evade. This is known as adverse-or anti-selection and it can easily threaten the financial stability of the social insurance scheme.
…which will need to be piloted and tested
The Government will need to study a wide range of possible collection mechanisms, examine other countries’ experiences and pilot test possible options for collecting contributions from both formal and informal sector workers. The choice of contribution collection strategy combined with effective enforcement and proper program design is needed to ensure program stability and continued political support. One important part of any solution will be the maximum use of integrated IT systems to automate administration, reduce errors and control costs.
Proper governance and supervision are needed to ensure system integrity
Good governance and oversight of the SJSN system and BPJS operations is critical given the large amounts of money that will flow into the five SJSN social insurance funds and the critical role the two BPJS play in the social protection system. The BPJS must be held accountable for properly administering the SJSN programs and performing their assigned responsibilities. Performance benchmarks are needed and there should be a system of checks and balances in place that ensures transparency and accountability so the public will have trust in the system. International accounting standards (accrual accounting) should also be implemented to present a clear picture of the financial status of the BPJS and the social insurance funds that it manages. It is important to have separate accounting for the BPJS and for each of the social insurance funds, as fund assets and liabilities are not BPJS assets and liabilities, and the assets of each of the social insurance funds must be kept separate. The two BPJS must operate the programs in the best interest of participants, and participants' complaints should be promptly heard and addressed. The BPJS Law requires the BPJS to establish a quality control unit to handle complaints and respond within specified time periods. By law, the BPJS will be supervised internally by their Board of Commissioners and by an internal audit department. In addition, they will be supervised externally by the National Social Security Council (Dewan Jaminan Sosial Nasional, DJSN), the new Financial Services Authority (Otoritas Jasa Keuangan, OJK) and the State Financial Audit Board (Badan Pemeriksa Keuangan, BPK). It is important for the specific roles and responsibilities of all these parties to be clearly defined and understood, and these arrangements should be agreed to and documented in writing.
Government capacity to manage risks is needed to protect the financial integrity of the system
Risk management and overall capacity building are needed to ensure that the SJSN programs are properly managed. The Ministry of Finance needs the human resources and IT systems to properly monitor the financial status of the SJSN programs and make adjustments to design features and contribution rates to ensure their long-term fiscal sustainability. The responsible unit will need to include actuaries, statisticians, mathematicians, demographers and experts in computer modeling to properly gather and manage needed data, maintain financial and actuarial models to project plan costs and periodically adjust contribution rates to maintain long-term solvency of the programs. Personnel in the supervisory organizations must be knowledgeable and ensure there is an effective structure for external supervision and control of BPJS operations, and an effective internal audit department within the BPJS. If this is not done properly, it could result in a large liability for the state budget. This could happen if programs become underfunded and the state budget must make up for any shortfalls. Therefore, it is in the Government’s best interest to develop an effective computer modeling and risk management capability, and effective external supervision.

A d j u s t i n g t o p r e s s u r e s I n d o n e s i a E c o n o m i c Q u a r t e r l y
July 2013 THE WORLD BANK | BANK DUNIA39
d. Communication is key as part of a lengthy implementation process
Proper socialization is needed to ensure the public understand the benefits and importance of the SJSN system
Effective communication within the Government and to the public, media and Parliament are important for program success. If all Indonesians understand the programs and their benefits, they are more likely to appreciate the program. If they know how to access the services they are entitled to, know their rights and responsibilities, and know the institutions responsible for operating the programs, they will have more trust in the system and are more likely to participate without being compelled to do so. This will be particularly true for informal sector workers. While their participation in the program is mandatory, it will be harder to enforce payment. The BPJS Law relies on informal workers coming to the nearest BPJS office to pay contributions, making it important to raise their awareness of program benefits.
e. Summary: a long journey towards comprehensive social security coverage
Implementation is a complex task and will require time and consensus among stakeholders to fully implement
Ensuring a successful system will require attention to key implementation issues that include reaching political consensus among stakeholders; development of a roadmap and monitoring program implementation; developing a national retirement income strategy and assuring the SJSN programs support that strategy; determining the financing strategy; and building financial and actuarial models and government capacity to ensure the fiscal sustainability of the SJSN programs. As discussed in this Section, particular attention should be paid to the program design features and the proper calculation of required payroll contributions. Carefully designed and implemented administrative systems and procedures will be needed to issue unique identification numbers, collect contributions, maintain individuals’ accounts, and pay benefits properly and in a timely fashion. All of the above will need to be supported by the required regulations and decrees, and by outreach and awareness building of the program (that is, program “socialization”). The implementation will likely be challenging and take longer than expected to fully achieve the stated goals. However, the new programs, even if they do not fully achieve all their lofty goals, will still be a significant improvement over the current system, and there will be opportunities to further improve the programs and the overall system over time.

A d j u s t i n g t o p r e s s u r e s I n d o n e s i a E c o n o m i c Q u a r t e r l y
July 2013 THE WORLD BANK | BANK DUNIA40
C. Indonesia 2014 and beyond: A selective look
1. Indonesia: Facing up to the Double Burden of Malnutrition
Nutrition problems pose a significant risk to Indonesia’s development…
Household incomes have increased significantly in recent years but, partly due to this success, Indonesia is faced with multiple nutrition problems of increasing complexity, a topic that this Section explores. With a third of children under five stunted (that is, shorter than expected for their age), not only is the future capacity of the nation’s workforce compromised, but their propensity for becoming fat and suffering from cardiovascular diseases in later life is also greatly increased. Changing consumption patterns and lifestyles associated with increasing urbanization are exacerbating the situation, such that overnutrition problems are already affecting the majority of adults. Unless action is taken now, not only tackling maternal and child undernutrition but also tackling the overnutrition problems in older children and adults, the prevalence of non-communicable diseases (NCD) will increase dramatically, undermining Indonesia’s economic progress in coming decades.12
a. The nature and serious consequences of the Double Burden of Malnutrition
… including both overnutrition and undernutrition
The Double Burden of Malnutrition13 (DBM) refers to the coexistence of both undernutrition and overnutrition of macronutrients and micronutrients14 across the course of life in the same population, community, family or even individual. Of particular concern is 12 This section summarizes findings and policy recommendations from a recent technical assessment of the DBM problem in Indonesia (financed by the Millennium Challenge Corporation with technical inputs from UNICEF), by Roger Shrimpton (International Nutrition Expert) and Claudia Rokx (World Bank), with contributions from the Indonesia Scaling Up Nutrition (SUN) working group, and Leslie Elder, Puti Marzoeki, Darren Dorkin Rebekah Pinto, Eko Pambudi and Megha Kapoor (World Bank). Additional technical papers on this topic are available at www.worldbank.org.
13 Shrimpton, R. and Rokx, C. 2012. The Double Burden of Malnutrition: A Review of the Global Evidence. World Bank. Washington. Forthcoming 2013.
14 Macronutrients include carbohydrates, proteins, and fats that provide energy for our body to function. Micronutrients are substances that enable the body to produce enzymes, hormones and other substances essential for proper growth and development, and are only needed in very small amounts.

A d j u s t i n g t o p r e s s u r e s I n d o n e s i a E c o n o m i c Q u a r t e r l y
July 2013 THE WORLD BANK | BANK DUNIA41
the life course dimension of DBM, or the link between maternal and fetal undernutrition and increased susceptibility to overnutrition and diet-related NCDs later in life.
Malnutrition is most commonly assessed by measuring body weight and length
Undernutrition and overnutrition are most commonly assessed by comparing height and weight with a reference growth pattern, and provide a measurement of adequacy of food intake. Underweight is the most common measure of undernutrition, but does not take height into consideration, which limits its utility as an indicator. Stunting occurs primarily due to poor length growth during the period from conception to two years of age. Wasting is a measure of short-term food adequacy and, unlike stunting, can be reversed. Undernutrition of micronutrients is also common and can contribute to growth failure as well as other body dysfunctions, such as anaemia in cases of iron deficiency and goitre resulting from iodine deficiency. Overnutrition is most commonly measured in terms of overweight and obesity, caused by eating more food than is needed and leading to accumulation of body fat. Obesity is recognized as a disease condition and in adults is commonly measured by the Body Mass Index (BMI) which is weight divided by height squared.
Indicators Definition
Underweight Weight is less than expected for age
Stunting Height is less than expected for age
Wasting Weight is less than expected for height
Overweight and
obesity Weight is greater than expected/desirable for height
Overnutrition is increasing at a faster pace than the decrease in undernutrition
The DBM is a global problem that affects rich and poor countries alike: 25 percent of the world’s population is overweight, while 17 percent of pre-school children are underweight and 28.5 percent are stunted. 40 percent of women of reproductive age have anemia and one-third of the global population still suffers from iodine deficiency. Most lower-middle income countries (LMICs) are considered to be affected by the DBM, with overweight increasing faster than underweight is decreasing in most of them. While globally obesity has doubled in the last three decades, it has tripled in LMICs in just two decades.
Stunting compromises the capacity, as well as the health, of the future workforce
Stunting has multiple and serious consequences measureable across the course of one’s life. The process of stunting, which starts in-utero, also causes damage to the developing brain, with negative effects on the intelligence and school performance of stunted children. It also negatively affects the work performance of stunted adults. This “leading indicator” is recognized as one of the best measures of the quality of human resources of a nation. Furthermore, constrained fetal growth causes “metabolic programming” with extra fat tissue laid down in preparation for a scarce environment in life outside the womb. If stunted children have accelerated weight growth later in childhood, there is an increased risk for obesity and other diet-related NCDs, such as Type 2 diabetes and cardiovascular diseases (CVD). For this reason, the cut-offs for defining overweight and obesity, which are based on the risk of developing CVD, are lower among stunted populations in Asia.15
b. The Double Burden of Malnutrition is a serious and urgent problem in Indonesia
DBM is worse in Indonesia than any other ASEAN country
The DBM problem in Indonesia is well established, with both overnutrition and undernutrition existing to a considerable degree in young children as well as in adults. Indeed, the DBM situation of Indonesia is one of the worst in ASEAN (Table 8). With a third of children aged under-five years being stunted, Indonesia has higher stunting rates than other poorer countries such as Vietnam and the Philippines, and is on a par with much poorer countries such as Myanmar, Cambodia and Laos PDR. Indonesia also has high wasting rates, being second only to Timor Leste, and higher than other poorer ASEAN countries such as Cambodia, Laos PDR, Vietnam, Papua New Guinea, and the Philippines. But Indonesia also has the highest overweight rates among its young children, worse than Malaysia, for example, which has three times its level of income.
15 World Health Organization 2004. Appropriate body-mass index for Asian populations and its implications for policy and intervention strategies. Lancet 363 (9403): 157-63.

A d j u s t i n g t o p r e s s u r e s I n d o n e s i a E c o n o m i c Q u a r t e r l y
July 2013 THE WORLD BANK | BANK DUNIA42
The problem of adult overnutrition has almost doubled in the last two decades
Although data on maternal nutrition is not as comprehensive as for child nutrition, there is evidence that one in five Indonesian women of reproductive age are “gemuk” (overweight and/or obese based on a BMI of greater than 25). The Indonesian Family Life Surveys, representative of 85 percent of the population, indicate that over a fifteen year period, the proportion of thin men and women decreased considerably while the proportion of gemuk men and women nearly doubled (Figure 34). The financial costs of the DBM in Indonesia are likely to be considerable. In terms of lost productivity, the cost of child undernutrition in Asia has conservatively been estimated at 2-3 percent of GDP.16 The cost of treating NCDs in stunted adult populations will be expensive. In South Africa, for example, the cost of treating CVD alone was taking up a quarter of health spending a decade ago. NCDs are already responsible for the majority of deaths worldwide, and are disproportionately high in LMICs, where nearly 80 percent of all NCD deaths occur. The World Economic Forum suggests that globally NCDs will cost more than USD 30 trillion over the next 20 years, representing 48 percent of global GDP in 2010. This will undermine economic growth in LMICs especially unless mitigation measures are taken.17 In Indonesia, DBM is likely to seriously undermine efforts to reduce poverty as well as erode economic growth, thus impeding progress towards achieving the first priorities of the 2010-2014 RPJMN.
Figure 34: A growing proportion of middle-aged Indonesians are overweight (percentage of overweight and underweight in men and women over 45 years of age)
Source: Indonesian Family Life Surveys; see Straus et al (2011), Indonesian Family Life Survey Results. Washington: Rand Corporation
Table 8: The DBM situation of Indonesia is one of the worst in ASEAN
Country Child
Wasting (percent)*
Child Overweight
(percent)*
Child Stunting
(percent)*
Maternal anemia
(percent)**
Women BMI <18.5
(percent)**
Women BMI >25
(percent)*
GNI per capita
(PPP USD)*
Cambodia 10.8 1.9 40.9 57.1 20.3 9.6 2,040 Indonesia 13.3 12.2 36.8 - - 21.4 4,300 Laos 7.0 2.0 44.0 14.5 17.0 2,300 Malaysia - 6.0 17.0 38.3 - - 14,360 Myanmar 7.9 3.0 35.0 - - - - Papua New 4.4 3.4 43.9 - - - 2,390 Philippines 6.9 3.3 32.0 43.9 14.2 33.0 3,930 Thailand 5.0 8.0 16.0 22.0 6.9 47.3 8,240 Timor Leste 19.9 5.8 57.7 37.7 3.1 3,570 Vietnam 4.4 4.6 23.3 32.2 28.3 6.8 2,910
Source: *UNICEF State of the World’s Children Report 2012 and **WHO Nutrition Landscape Information System
16 Horton S. 1999. Opportunities for investments in nutrition in low-income Asia. Asian Development Review 17(1-2(:246-273. See also: Food and Agriculture Organization 2013. The State of Food and Agriculture. Rome.
17 Bloom, D.E., Cafiero, E.T., Jané-Llopis, E., Abrahams-Gessel, S., Bloom, L.R., Fathima, S., Feigl, A.B., Gaziano, T., Mowafi, M., Pandya, A., Prettner, K., Rosenberg, L., Seligman, B., Stein, A.Z., & Weinstein, C. 2011. World Economic Forum. The Global Economic Burden of Noncommunicable Diseases. Geneva.
0
5
10
15
20
25
30
35
underweightmen
overweightmen
underweightwomen
overweightwomen
1993 1997 2000 2007

A d j u s t i n g t o p r e s s u r e s I n d o n e s i a E c o n o m i c Q u a r t e r l y
July 2013 THE WORLD BANK | BANK DUNIA43
The poor are more affected by overweight and obesity than the rich
However, despite the evidence showing that obesity is on the rise, misperceptions of the issue tend to cloud its urgency. For example, in many circles, it is assumed that obesity is exclusively a problem of the rich. But this is not the case in Indonesia. The Basic Health Survey (Riskesdas) of 2010 showed that although overweight/obesity increased with income, peaking at 32 percent in the upper wealth quintile, the lower wealth quintiles were also affected (about 20 percent). The greatest number of overweight and obese individuals is found in the poorer segments of the population, and conditioned by increasing obesogenic (i.e., obesity-causing) urban environments. The poorest adults in these environments, who are also the most stunted, are particularly vulnerable.
Indonesians may be unhealthy even if they do not appear to be “fat”
Another misperception concerns the physical nature of obesity, as this often calls to mind someone who appears “fat.” Overweight and obesity, however, is a hidden problem in Indonesia. Even those that do not appear “fat” may be carrying significant amounts of hidden fat in their bodies. This is in part a result of constrained growth in the first 1,000 days, followed by the accelerated growth during childhood perpetuated by urban lifestyles. Further, for Indonesians, the health risks associated with having excess body fat – whether visible or not - begin at a BMI lower than that in other parts of Asia, and certainly lower than the international standard.18 That this excess fat is not always physically evident contributes to an underestimation of the urgency of the problem in an increasingly inactive and urbanizing population.
c. Understanding the causes of DBM in Indonesia
The causes of DBM are divided into four thematic areas
While the causes of DBM across the course of one’s life are complex, a useful way to analyze DBM in Indonesia is to adopt the system map of obesity developed by the Foresight Project in the UK. This map groups more than 100 variables into four thematic areas: health and biological environment; economic and food environment; physical and built environment; and socio-cultural environment.
Health and biological environment: NCDs are already the leading cause of death
Indonesia is well on its way in its demographic transition. Deaths due to communicable diseases have been reduced, most likely due to Indonesia’s health policies in the 1980s and 1990s that increased expenditures and led to better distribution of health facilities throughout the country. At the same time, life expectancy has improved. Today, NCDs account for the majority of disability and mortality in Indonesia. CVD is the leading cause of death, accounting for 30 percent of all NCD deaths, followed by cancer, chronic obstructive pulmonary disease, and diabetes.
The health system has little capacity to support nutritional programs
The health infrastructure, however, is still deficient in many ways. Sanitation coverage has not proceeded apace, and gastrointestinal parasites are very common. The health system is not well-equipped to implement nutrition interventions, due in part to health workers’ lack of training in nutrition and a perception that stunting and obesity/overweight are not significant problems, or linked to NCDs. Few health facilities measure nutritional status routinely and many lack the equipment to do so. Indonesia’s strong commitment to achieve universal health coverage (UHC) for its population, however, combined with launching its Scaling Up Nutrition initiative, represent excellent opportunities to improve nutrition.
High blood pressure and diabetes are highly prevalent in adults
Survey data shows elevated levels of the underlying risk factors that contribute to CVDs. The 2007 Riskesdas survey found one in ten men and two in ten women over 45 years had high cholesterol levels. Diabetes was affecting 6 percent of the adult population, and 19 percent were pre-diabetic. The Indonesia Family Life Surveys detected a high prevalence of hypertension, which is worse in women and increases with age, such that about half of adults over 45 are affected (Figure 35). Two-thirds of respondents did not know they have a problem, however, and 90 percent were not getting treatment. 18 Soegondo S. 2005. Atherogenic dyslipidaemia and the metabolic syndrome. Acta Med Indonesia 37(3): 177-183; and WHO 2004.

A d j u s t i n g t o p r e s s u r e s I n d o n e s i a E c o n o m i c Q u a r t e r l y
July 2013 THE WORLD BANK | BANK DUNIA44
Figure 35: Hypertension is a significant problem amongst Indonesian adults… (hyper-tensive in age category, percent)
Figure 36: …and a high proportion of Indonesians do not get enough physical exercise (insufficient physical activity in age category, percent)
Source: 2007 Indonesia Family Life Surveys Source: 2007 Riskesdas Survey
The economic and food environment has seen decreasing poverty and increasing westernization of the diet
Indonesia’s increase in national wealth has been accompanied by declines in poverty and an increase in food availability as energy per capita, mostly coming from the doubling of fat consumption. In the past four decades, rice availability has remained mostly stable, while energy coming from meat and fish doubled, from milk tripled, and from wheat increased seven-fold. Simultaneously, the increased global trading of foods has led to greater amounts of processed food imports in LMICs, which are distributed mainly through growing supermarket chains and multinational fast-food companies. Urban areas are particularly affected by these new commercial outlets.
Poor infant feeding practices are contributing to both under and over nutrition
A growing body of evidence suggests that food consumption patterns during early life affect the health and development across the rest of one’s life. Unfortunately, infant and young child feeding practices in Indonesia are far from adequate and contribute both to undernutrition early in life as well as to an increased risk for overnutrition later in life. Harmful patterns include declining rates of exclusive breastfeeding and the early introduction of complementary foods. In 2010, only 15 percent of babies were breastfed exclusively for 6 months – half of the 32 percent that was reported in 2007 and much less than the 40 percent, which was reported in 2002. Breast milk substitutes are still commonly promoted in health care facilities to both health care professionals and mothers.
Family food consumption has increased more in quantity than in quality
Food consumption patterns later in the life course are difficult to evaluate, but available datasuggests that food intake has increased, particularly from meat, fish, eggs, and prepared foods. Vegetable and fruit consumption, on the other hand, has remained stable and low. Indonesia is the second largest consumer of instant noodles globally, with nearly 13.7 billion packs consumed in 2008 and, consequently, daily wheat flour consumption rose to 52g per person in 2008, making Indonesia one of the top five wheat importing countries globally.
Increased consumption of processed foods is likely contributing to overnutrition
It is likely that the increased consumption of ultra-processed foods is contributing toIndonesia’s obesity problem as it is around the world. Ultra-processed foods are energy dense and full of refined grains, sugars and fats. As such, they are well recognized by consumers as the lowest purchase price option. Provoking prolonged and high glucose levels in the blood after ingestion, they contribute to the gradual accumulation of extra body fat. The most consumed ultra-processed food in Indonesia is instant noodles which are made from wheat flour and fried in palm oil.
The environment is increasingly obesity-causing
An assessment of Indonesia’s physical environment reveals an urban environment that is unfriendly to pedestrian physical activity. With limited access to healthy foods in many urban environments, those traveling to and from school and work have few options other than
0
10
20
30
40
50
60
70
80
25-44 45-54 55-64 65-74 75+
men women
0
10
20
30
40
50
60
70
80
90
10-14 15-24 25-34 35-44 45-54 55-64 65-74 75+

A d j u s t i n g t o p r e s s u r e s I n d o n e s i a E c o n o m i c Q u a r t e r l y
July 2013 THE WORLD BANK | BANK DUNIA45
ready-made foods outside of their homes. At present, and particularly given the low public awareness of the DBM problem, schools are not yet a venue for preventing child obesity. Urban planning and local government have an important role to play in increasing options for pedestrian physical activity as the majority of the population does not get enough exercise to help prevent CVD (Figure 36). Riskesdas survey data from 2007 show school-aged children are one of the most inactive age groups.
The socio-cultural environment is also increasingly obesity-causing
Indonesia continues to retain its traditional cultures even while immersing itself in all forms of modern media. Traditional customs influence maternal and early child undernutrition, and social norms dictate that many women get married at young age: 25 percent of all women of reproductive age are married before age 18, and 10 percent before age 16. The age of the mother at first birth is a key correlate of child health outcomes, where the risks of stunting, diarrhoea, and anaemia diminish significantly as a woman delays her first birth through to age 27-29 years, regardless of socioeconomic status.19 At the same time, children watch around 4 hours of television a day, and the advertising of processed food dominates the media, with advertisements targeted toward children. The majority of parents report that their purchases are influenced by their children’s choice more than advertisements, suggesting the need to curb these external influences, as recommended by the World Health Assembly.
d. Addressing DBM in Indonesia
An overarching policy framework is needed
The actions needed to strengthen the response to nutrition issues are well-established and recognized under the global Scaling Up Nutrition (SUN) Movement, which Indonesia joined in September 2012 alongside 39 other countries. Indonesia also plays a strong role in the Movement’s Lead Group. Focusing on maternal and child undernutrition, the Government is progressing on its SUN policy framework and planning guidelines. Indonesia should build on the SUN framework as it considers how to further enhance its responses to the DBM problem across the life course. An overarching DBM policy framework is needed to increase coordination among government ministries in four policy pillars: food security, food safety, healthy lifestyles, and nutrition. Most of these focus areas are included in the SUN platform established under the Coordinating Minster of Peoples Welfare. Some of these policies and strategies are already contemplated in the National Action Plan for Food and Nutrition, 2011-2015, developed by the National Development Planning Agency (Bappenas). As the plan for 2016-2020 is developed, the other elements in the framework should also be considered.
Existing interventions need to be scaled up, while addressing gaps
Many of the necessary interventions are already being implemented in Indonesia and the firm commitments underpinning Indonesia’s plans for universal health care and the SUN Movement are laying the groundwork for future improvements in nutrition. But while there has been progress in covering some areas, gaps remain. For example, implementation of direct interventions during early life, especially breastfeeding, still need to be improved. Similarly, despite advances through food fortification with micronutrients, maternal anemia also needs greater attention. Finally, social welfare programs have helped ensure food security among the poorest of the poor, but a greater emphasis is needed on food quality as well as quantity. Schools are critically important venues for enabling healthy lifestyles that will help mitigate the effects of DBM, but have not yet been utilized for this purpose. Health professionals need better training in nutrition, so that stunting is perceived as an issue, and that overweight and obesity are recognized as problems to be prevented, not just treated.
19 Finlay JE, Ozaltin E, Canning D. 2011. The association of maternal age with infant mortality, child anthropometric failure, diarrhoea and anaemia for first births: evidence from 55 low-and middle-income-countries. BMJ Open 2: e000226.

A d j u s t i n g t o p r e s s u r e s I n d o n e s i a E c o n o m i c Q u a r t e r l y
July 2013 THE WORLD BANK | BANK DUNIA46
2. Bureaucracy reform in Indonesia: progress and pitfalls
Indonesia has embarked on an ambitious bureaucratic reform process that began in 2006
Indonesia’s civil service is one of the largest in the world, with around 4.7 million civil servants. The quality of services delivered, however, has not consistently improved with the size of the civil service. To address this challenge, the Government of Indonesia has embarked on a radical reform process known as bureaucracy reform (BR), which was introduced in 2006 starting with the Ministry of Finance (MOF). The objectives of the reform are to streamline business processes, improve the policies and practices of human resource management and reduce corruption in the Ministry of Finance. Since then, the BR agenda has been rolled out across ministries and other government agencies. As of 2012, around 56 ministries and agencies were involved in BR, which will extend to another 22 in 2013 and 2014.
A key feature of the reform is the introduction of an extra allowances based on job analyses and grading
One of the key features of this reform initiative, as designed by MOF, was the introduction of an extra BR allowance tied to job type. This is different from the basic salaries and allowances that are tied to rank and seniority. An evaluation of current jobs was carried out and new job descriptions were then developed, determining the complexity, scope and accountability of jobs. Based on this evaluation, allowances of different sizes were introduced for each job type. This Section will review the BR allowance initiative and the evidence on the impact of the allowances on performance. It will also discuss current bureaucracy reform priorities, particularly the importance of restructuring and right-sizing.
a. Impact of bureaucracy reform
BR allowances have led to improvements in the modernization of human resource practices...
While BR allowances have increased wage bills in participating institutions, independent evaluations – such as the annual Public Service Integrity Survey issued by Indonesia’s Corruption Eradication Committee (Komisi Pemberantasan Korupsi, or KPK) – have indicated that BR has had positive impacts in MOF. These positive changes include improved recruitment processes, which ensure that recruits are adequately qualified. BR also supported the establishment of Assessment Centers used to assess current employees’ competencies and potential for promotion. Performance evaluations of units and individuals has also improved using approaches such as the Balanced Scorecard methodology. In addition, training has become more technically focused. These modernized human resource practices imply that BR is supporting the professionalization of civil servants in key institutions.
…as indicated by a recent pay and performance survey
These positive outcomes are confirmed in a pay and performance survey that was recently undertaken by the Ministry of Administrative and Bureaucracy Reform (MenPAN-RB) and the World Bank. The survey was conducted in 2012 and covered more than 4,000 Jakarta-based civil servants, in lower ranks20, drawn from fourteen government ministries and agencies. In the survey, ministries and agencies were divided into four categories: (1) those that have received BR allowances; (2) those that were approved but had not yet received BR allowances; (3) those that had applied to participate in the BR program; and, (4) those that had not applied to participate in the BR program. The aim of the survey was to provide an assessment of progress to date in Bureaucracy Reform.
… indicating that participating institutions have better recruitment and promotion systems
The survey indicates that staff in ministries and agencies that have undertaken bureaucracy reform are more likely to agree that their colleagues contribute more than expected (Table 9). Promotion and regulatory decisions in participating institutions appear significantly less likely to be unpredictable and the product of favoritism. In addition, surveyed staff believe that institutions that have undergone BR are better at identifying the best candidates for jobs and can recruit high quality staff more easily.
20 Lower ranks, in this context, refers to civil servants that are categorized as Echelon IVA, IIID and IIIA. Echelon 4 staff have worked in the civil service for approximately 8 years, while Echelon III staff have worked in the civil service for approximately 8-13 years.

A d j u s t i n g t o p r e s s u r e s I n d o n e s i a E c o n o m i c Q u a r t e r l y
July 2013 THE WORLD BANK | BANK DUNIA47
Table 9: There is survey evidence of better HR performance amongst bureaucracy reform-participating institutions
BR reform status
Others contribute more than is expected
of them
Promotions met formal
qualifications
Recruitment identifies the
best candidates for the job
Agency easily recruits quality
staff
Proportion of respondents who agreed or strongly agreed percent
Have received BR allowance 64 91 88 77
BR allowance approved, not received 48 80 81 61
Applied for BR allowance 42 61 63 45
Have not applied for BR allowance 41 62 66 52
Source: Pay Reform in the Indonesian Civil Service: Key Issues and Options for Reform (Hasnain, et.al., 2013)
b. Sustainability of bureaucracy reform
The Government of Indonesia has made considerable progress in bureaucratic reform…
Bureaucracy Reform has extended beyond the initial reform that was started in the MOF. The reform is extending downwards to field offices such as those of the Directorate General of Taxes and the Directorate General of Treasury. In addition, a report from the National Development Planning Agency (Bappenas) and MenPAN-RB showed that the share of central ministries and agencies that were considered accountable increased from 83 percent in 2011 to 95 percent in 2012.21 Furthermore, the share of central agencies that received a satisfactory “reasonable without exception” opinion on their financial reports increased from 63 percent in 2011 to 77 percent in 2012.
… but continued efforts are needed to improve productivity and ensure the sustainability of civil service pay…
Despite significant progress in reforming the bureaucracy, further efforts are needed to improve productivity while ensuring that spending on civil service pay remains sustainable. This is especially crucial given the rollout of BR to the national level since 2008, and to the sub-national level in 2013. In addition, it will be important to maintain the sustainability of reforms. To achieve these goals, bureaucracy reforms should continue to be scaled up in Indonesia, building on the current BR implementation at the institutional level, and also encompassing the modernization of national policies. In particular, in addition to the Personnel Expenditure Management Reform and Pay and Grading Reform22, there are three other priority areas for reform that the Government of Indonesia could consider.
.. including organizational modernizing and right-sizing…
First, further improvements in policies regarding control, organizational design, staffing and right-sizing may be effective. Limited flexibility in current national regulations and vetting processes limit the scope for restructuring and reform. Reforming establishment control, modernizing organizational structures, and adopting “right-sizing” policies can help in making personnel budgets part of sub-program or activity budgets. It would also help in making budget managers responsible for staffing and accountable for personnel expenditures. This would allow for better control of the size and cost of the civil service, and for the flexibility required to improve efficiency and get better value for money.
…reform of the national regulatory framework
Second, there could be sizeable benefits from reform of the national regulatory framework and of the central institutional set-up for civil service policy-making, regulation and management. These reforms could help increase flexibility at the institutional level while modernizing and strengthening the capacity for relevant central civil service policy-making. At the same time, it would help to move the responsibility for implementation of civil service policies and regulations to the employing institutions. Ultimately, central agencies (MenPAN-RB, BKN) should supply policies, provide guidance and monitor implementation; implementation, however, should be the responsibility of the respective employers.
21 Based on findings from the Government Performance Accountability Reports (Laporan Akuntabilitas Kinerja Instansi Pemerintah, or LAKIP)
22 Highlighted in the October 2012 edition of the World Bank’s Indonesia Economic Quarterly.

A d j u s t i n g t o p r e s s u r e s I n d o n e s i a E c o n o m i c Q u a r t e r l y
July 2013 THE WORLD BANK | BANK DUNIA48
…and reform of the civil service pension and endowment savings programs
A third priority area is reform of the civil service pension and endowment savings program (Tabungan Hari Tua, THT).23 The goal in this area would be to move current pension policies to a modernized, defined benefit pay-as-you-go system. Such a reform process would need to provide for fairness and equity based on thorough analyses and with appropriate transitional arrangements.
Restructuring and right-sizing are priorities for the Government in the near term
Restructuring and right-sizing initiatives are becoming a priority for the leading authority for bureaucracy reform, MenPAN-RB, until the end of the current administration. MenPAN-RB has requested sixteen ministries and government institutions to conduct internal reviews in order to streamline their current organizational structures. All the selected ministries and government agencies will submit their restructuring/right-sizing plans by September 2013 as instructed by the Vice President. In this regard, MenPAN-RB is expecting to see how ministries and agencies are able to reduce the number of Echelon I and II structures within their organization.24 Turning to the longer-term reform agenda, MenPAN-RB plans to issue a white book on the new organizational structure of the Government, along with the number of ministries and agencies, for the next administration.
c. Restructuring and rightsizing in the Government of Indonesia
Restructuring government agencies faces regulatory and operational constraints
Restructuring in Indonesian agencies faces specific regulatory and operational constraints. The current civil service regulatory framework, based on Law 8/1974 (amended by Law 43/1999), was a codification of the New Order regime’s concept of the Indonesian civil service. This is based on a centralistic, highly detailed approach, which is inspired by military practices that gave little flexibility for line ministries and agencies. The guiding principle could be characterized as “one size fits all.”
Many agencies suffer from fragmentation of tasks and decision making, as well as overstaffing and redundancy
Within this system, civil service organizational structures and staff establishments are based on symmetric rather than operational considerations. This places a focus on balanced numbers of units and sub-units and a certain number of positions at each level, rather than on what is needed operationally. As a result, many government agencies suffer from fragmentation of tasks as well as of decision-making powers, since these are distributed among a large number of pre-defined sub-units. Another result of the current regulations is overstaffing in most institutions, implying both quantitative (too many units and sub-units and too many positions) and qualitative (unqualified position holders) redundancies.
The need for “right-sizing” is driven by affording and retaining staff needed for enhanced service delivery
In addition to the restructuring imperative, there are two other key drivers for right-sizing. Firstly, the BR allowance will have significant fiscal implications. Spending on personnel has grown more rapidly than most other public spending categories, driven by the Government’s wage bill and the lack of clear and transparent productivity benchmarks, along with the introduction of BR allowances.25 This problem could be partly assuaged by a reduction in staffing levels. Secondly, there are significant numbers of poor performers in the civil service who lack the knowledge, skills and abilities to deliver the enhanced service delivery that BR is working towards. For these individuals, right-sizing could offer a socially and politically acceptable exit strategy.
… which requires defining the organization, removing staff and appointing new staff
Successful right-sizing requires efficient and effective processes that help in the transition from the existing “as is” structure to the desired “to be” structure (i.e., the “right size”). These include three basic processes: define the new organization structure, including jobs and staffing levels; remove staff who do not have a place within the new structure; and appoint staff and new joiners to positions in the new structure. 23 Indonesia’s civil service pension program and endowment savings program (Tunjangan Hari Tua, THT) are stand-alone retirement programs, providing benefits solely to civil servants and distinct from retirement income program covering other segments of the labor force. The pension and THT programs are sponsored by the government and administered by PT Taspen, a State-Owned Enterprise dedicated to this sole purpose.
24 See “Right-sizing in the Indonesian Civil Service: Opportunities and Constraints”, which provides a comparative analysis of the topic.
25 For more on this topic, see the October 2012 edition of the IEQ.

A d j u s t i n g t o p r e s s u r e s I n d o n e s i a E c o n o m i c Q u a r t e r l y
July 2013 THE WORLD BANK | BANK DUNIA49
d. Streamlining government agencies
Streamlining of government is possible, especially through retirement…
There are a number of legal and regulatory “windows” that could provide severance options for surplus staff, that is, those who do not have a place within the new organizational structures of government agencies. The basic civil service law (Art 23, Law No. 43/1999) permits termination due to “streamlining of government” – but there appears to be reluctance to use this provision, and some uncertainty about how it would be applied in practice as implementing regulations are still missing. A more tractable option is likely to be retirement – either at the normal retirement age of 56 years, or using the provisions for early retirement at 50 years of age, plus 20 years of service (Pensions Law No. 11/1969).
…but a reliance on early retirement will burden civil service pensions
There are a number of constraints to successful and cost-effective severance of surplus staff. Reliance on early retirement will impose substantial additional burdens on the civil service pension scheme, which itself should be undergoing a fundamental reform. While the future pension costs of regular retirement at 56 or 60 years should already be factored into pension reform models, significant additional early retirements at 50 years (which is currently rare) are not. While financing this additional investment raises a challenge, it is important to note that the expense is a one-off increase in pension liabilities, not a higher expense trajectory.
There is a need to develop government-wide standards on severance
With no guidance from MenPAN-RB on the development of severance programs, there is a risk that institution-specific schemes will proliferate, with different terms and conditions. For political and equity reasons it would be reasonable for civil servants to expect at least as good a severance deal as the previous best on offer – hence a costly “leveling up” dynamic is likely to occur in the absence of a government-wide standard. Ministry-level schemes may also fall prey to moral hazard, as the programs’ designers will be closer to their beneficiaries and may be tempted to choose more expensive packages (“golden handshakes”), rather than allowing aged-based retirement to deliver results more cheaply.
‘Revolving door’ problems can be avoided by introducing incentives for reduced headcounts
Despite a detailed and inflexible regulatory framework for determining organizational structures and for workforce planning, Indonesia’s civil service lacks effective controls to prevent a “revolving door” problem. With its increased focus on the quality of spending, the Government is giving increasing attention to the effectiveness of its operations and whether these are being conducted at least cost. The focus of spending reviews will vary but they may examine whether line ministries have the right number and mix of staff to perform their operations - with right-sizing a possible option. Unless there are rigorous headcount controls – ideally with a position-based personnel management system which integrates structural considerations, special functions and staff – it is highly likely that the “revolving door” will undermine severance efforts..
e. Appointing staff to new structures
Internationally, the trend is towards more open, merit-based appointment and promotion systems
Internationally, the trend is towards more open, merit-based appointment and promotion systems, but this is still subject to significant limitations in Indonesia. Agencies have a high degree of delegated authority to fill posts using their own staff. This is subject to restrictions, however, which limit certain positions to certain ranks,26 potentially preventing the best person from being hired for the job.27 In fact, the civil service operates as a closed system, with external recruitment permitted only at entry levels. While lateral entry from outside the civil service to the higher grades is not permitted (Civil Service Law No. 43/1999 article 12), transfers between agencies are possible, though the system for doing so is opaque. As a result, there is no internal market for recruitment and transfers within the civil service. Such a market would enable appropriately qualified and skilled civil servants to respond to the incentives created by the differential performance allowances now in place, or being put in place, across government agencies.
26 For example, Echelon II posts can only be filled by an individual of rank 4B or above 27 Refer to Government Regulation (PP) No. 100/2000 on the Appointment of Civil Servants to Structural Position as further detailed in the Head of BKN Regulation No. 13/2002.

A d j u s t i n g t o p r e s s u r e s I n d o n e s i a E c o n o m i c Q u a r t e r l y
July 2013 THE WORLD BANK | BANK DUNIA50
f. Constraints and reform options for right-sizing
Restructuring and right-sizing efforts face legal, regulatory and capacity constraints
As the above discussion makes clear, a number of specific legal, regulatory and capacity constraints impede the efficient implementation of key right-sizing processes in the Indonesian civil service. These argue for the need for further reforms to build on the significant progress, such as the introduction of job-specific pay allowances, already made through bureaucracy reform initiatives in Indonesia. Some of the key elements are summarized in Table 10, along with high-level suggestions for reforms. Continued progress in this area will depend, in part, on the provisions of the new civil service law, which is currently being prepared.
Table 10: Selected constraints to restructuring and right-sizing and high level reform options
Constraint Reform options
Agencies lack clear direction on purpose of restructuring and associated processes
Expand BR Guidelines to include clear focus on rationales and methodologies to be followed; expand the role of BPK to review and advise Agencies on value for money organizational structures
Agencies lack authority to determine own structures and jobs
Replace prescriptive central control over structures with good practice guidelines, combined with appropriate fiscal controls
Approval of line ministries’ and agencies’ restructuring proposals and job requirements by HR can be slow and uncertain
Strengthen capacity of MenPAN-RB HR to approve structures and job requirements rapidly, and introduce a single combined approval process, requiring approvals only for quality and efficiency assurance
Weak incentives and systems for Agencies to develop and maintain efficient structures; risk of “revolving doors”
Introduce fiscal incentives such that Agencies retain a share of wage bill savings; develop position-based personnel management and control systems to avoid “over-hiring” and inefficient rehiring
Lack of guidance on severance options and procedures
Develop best-practice guidelines for Agencies on severance of surplus staff
Unclear rules on compulsory termination of civil servants when needed
Politically sensitive and awaiting clarification under the new Civil Service Law
Early retirement provisions of pensions scheme may be unsuitable for right-sizing
Better co-ordination of pensions reform, pay reform and right-sizing design
Prohibition of lateral entry limits access to high caliber staff from outside civil service
New law should address lateral entry restriction; consider a web-based internal job market across the civil service to improve job matching
Source: Extracted from Pay Reform in the Indonesian Civil Service: Key Issues and Options for Reform (Hasnain, et.al., 2013)

APPENDIX: A SNAPSHOT OF INDONESIAN ECONOMIC INDICATORS
Appendix Figure 1: Quarterly and annual GDP growth (real GDP growth, percent)
Appendix Figure 2: Contributions to GDP expenditures (contribution to quarter-on-quarter seasonally-adjusted real GDP growth, percent)
Note: *Average QoQ growth between Q1 2003 – Q1 2013 Source: BPS; World Bank seasonal adjustment
Source: BPS; World Bank staff calculations
Appendix Figure 3: Contributions to GDP production (contribution to quarter-on-quarter seasonally-adjusted real GDP growth, percent)
Appendix Figure 4: Motor cycle and motor vehicle sales (monthly sales, 000 units)
Source: BPS; World Bank staff calculations Source: CEIC
Appendix Figure 5: Consumer indicators (index)
Appendix Figure 6: Industrial production indicators (3 month average, yoy growth, percent)
Source: BI Source: CEIC
0.0
2.0
4.0
6.0
8.0
0
1
2
3
4
Mar-06 Dec-07 Sep-09 Jun-11 Mar-13
QoQ seas. adjust (LHS)
Yoy (RHS)
Average (LHS)*
-4
-2
0
2
4
Mar-10 Dec-10 Sep-11 Jun-12 Mar-13
Private cons. Gov cons. Investment
Net Exports Discrepancy GDP
-1
0
1
2
Mar-10 Dec-10 Sep-11 Jun-12 Mar-13
Agriculture Mining and ConstManufacture Comm and Trans.Trade, Hotel, & Rest. Other (incl services)
30
50
70
90
110
130
100
300
500
700
900
May-10 May-11 May-12 May-13
Motor cycles (LHS)
Motor vehicles (RHS)
60
80
100
120
140
160
May-10 May-11 May-12 May-13
BI Retail sales index
BI Consumer Survey Index
-10
-2
6
14
22
30
-10
-5
0
5
10
15
Jan-10 Jan-11 Jan-12 Jan-13
Cement sales (RHS)
Manufacturing production index (LHS)

July 2013 THE WORLD BANK | BANK DUNIA52
Appendix Figure 7: Real trade flows (quarter-on-quarter real growth, percent)
Appendix Figure 8: Balance of payments (USD billion)
Source: BPS Source: BI
Appendix Figure 9: Goods exports (USD billion)
Appendix Figure 10: Goods imports (USD billion)
Source: BPS Source: BI; CEIC; World Bank staff calculations
Appendix Figure 11: Reserves and portfolio capital inflows (USD billion)
Appendix Figure 12: Inflation and monetary policy (month-on-month and yoy growth, percent)
Source: BI; CEIC; World Bank staff calculations Source: BPS; World Bank staff calculations
-20
-10
0
10
20
Mar-10 Mar-11 Mar-12 Mar-13
Exports
Imports
-10
-5
0
5
10
15
Mar-10 Mar-11 Mar-12 Mar-13
Capital and financial Current accountErrors and omissions Overall BoP inflows
0
4
8
12
16
20
Apr-10 Oct-10 Apr-11 Oct-11 Apr-12 Oct-12 Apr-13
Agriculture & forestry
Mining & mineralsOil & gas
Manufacturing
Total Exports
0
4
8
12
16
20
Apr-10 Oct-10 Apr-11 Oct-11 Apr-12 Oct-12 Apr-13
Intermediate
Consumer
CapitalOil & gas
Total Imports
-7.5
-5.0
-2.5
0.0
2.5
5.0
25
50
75
100
125
150
May-10 May-11 May-12 May-13
Equities SUN SBINon-resident portfolio inflows, (RHS):
Reserves (LHS)
-4
0
4
8
12
-1
0
1
2
3
May-09 May-10 May-11 May-12 May-13
Core inflation, YoY (RHS)
Headline inflation, YoY (RHS)
Headline inflation MoM (LHS)
BI policy rate(RHS)

July 2013 THE WORLD BANK | BANK DUNIA53
Appendix Figure 13: Monthly breakdown of CPI (percentage point contributions to monthly growth)
Appendix Figure 14: Inflation comparison across countries (yoy, May 2013)
Source: BPS; World Bank staff calculations *April is latest available month Source: National statistical agencies via CEIC; BPS
Appendix Figure 15: Domestic and international rice prices (percent LHS, wholesale price, in IDR per kg RHS)
Appendix Figure 16: Poverty and unemployment rate (percent)
Source: PIBC; FAO; World Bank Source: BPS
Appendix Figure 17: Regional equity indices (daily index January 2009=100)
Appendix Figure 18: Dollar index and Rupiah exchange rate (daily index, LHS and levels IDR/USD, RHS)
Source: CEIC; World Bank staff calculations Source: CEIC; World Bank staff calculations
-0.6
0.0
0.6
1.2
1.8
May-10 May-11 May-12 May-13
Core AdministeredVolatile Headline
-1 0 1 2 3 4 5 6
Japan*
Malaysia*
Korea*
USA
Philippines*
China
Singapore*
Thailand
Indonesia
1,000
4,000
7,000
10,000
-50
0
50
100
May-09 May-10 May-11 May-12 May-13
Domestic rice, IR-III (RHS)Vietnamese rice 25% broken
(RHS)
Percentage spread (LHS)
Domestic rice, IR-III (RHS)Vietnamese rice 25% broken
(RHS)
Percentage spread (LHS)
0
5
10
15
20
0
15
30
45
60
2006 2007 2008 2009 2010 2011 2012
Unemployment rate, LHSFormal employment rate, LHS
Poverty rateRHS
50
100
150
200
250
300
350
400
Mar-09 Aug-10 Jan-12 Jun-13
Shanghai
JCI
BSE
SGX
SET
8,000
9,000
10,000
11,000
12,00080
90
100
110
120
Mar-09 Aug-10 Jan-12 Jun-13
IDR/USD (RHS)
Dollar Index (LHS)
IDR Appreciation

July 2013 THE WORLD BANK | BANK DUNIA54
Appendix Figure 19: 5-year local currency government bond yields (daily, percent)
Appendix Figure 20: Sovereign USD Bond EMBI spreads (daily, basis points)
Source: CEIC; World Bank staff calculations Source: JP Morgan; World Bank staff calculations
Appendix Figure 21: International commercial bank lending (monthly, index January 2009=100)
Appendix Figure 22: Banking sector indicators (monthly, percent)
Source: CEIC; World Bank staff calculations Source: BI
Appendix Figure 23: Government debt (percent of GDP; USD billion)
Appendix Figure 24: External debt (percent of GDP; USD billion)
Source: MoF; BI; World Bank staff calculations Source: BI; World Bank staff calculations
0
3
6
9
12
Jun-09 Jun-10 Jun-11 Jun-12 Jun-13
Indonesia
Philippines
Malaysia
Thailand
United States-240
-180
-120
-60
0
60
120
100
175
250
325
400
475
550
Jun-09 Oct-10 Feb-12 Jun-13
Indonesia EMBIG bond spreads (LHS)
Indonesia spreads less overall EMBIG Index spreads (RHS)
80
100
120
140
160
180
200
220
India
Malaysia
Singapore
Thailand
United States
Indonesia
0
2
4
6
8
10
0
20
40
60
80
100
Apr-09 Apr-10 Apr-11 Apr-12 Apr-13
Capital Adequacy Ratio (LHS)
Return on Assets Ratio (RHS)
Loan Deposit Ratio (LHS)
Non-Performing Loans (RHS)
0
100
200
300
0
20
40
60
2005 2007 2009 2011 2013External debt, RHSDomestic debt, RHS
Government debt ratio to GDP (LHS)
March
0
100
200
300
0
20
40
60
2005 2007 2009 2011 2013Private external debt, RHSPublic external debt, RHS
External debt ratio to GDP (LHS)
March

July 2013 THE WORLD BANK | BANK DUNIA55
Appendix Table 1: Budget outcomes and projections (IDR trillion)
2009 2010 2011 2012 2013
2013 revised
Actual Actual Actual
Actual (unaudited)
Budget Budget
A. State revenue and grants 849 995 1,211 1,336 1,530 1,502
1. Tax revenue 620 723 874 980 1,193 1,148
2. Non-tax revenue 227 269 331 352 332 349
B. Expenditure 937 1,042 1,295 1,482 1,683 1,726
1. Central government 629 697 884 1,001 1,154 1,197
2. Transfers to the regions
309 345 411 480 529 529
C. Primary balance 5 42 9 -46 -40 -112
D. SURPLUS / DEFICIT -89 -47 -84 -146 -153 -224
(percent of GDP) -1.6 -0.7 -1.1 -1.8 -1.7 -2.4
Source: MoF
Appendix Table 2: Balance of Payments (USD billion)
2010 2011 2012
2011 2012 2013
Q3 Q4 Q1 Q2 Q3 Q4 Q1
Balance of Payments 30.3 11.9 0.2 -4.0 -3.7 -1.0 -2.8 0.8 3.2 -6.6 Percent of GDP 4.3 1.4 0.0 0.0 0.0 0.0 0.0 0.0 0.0 -0.1
Current Account 5.1 1.7 -24.1 0.8 -2.3 -3.1 -8.0 -5.3 -7.6 -5.3 Percent of GDP 0.7 0.2 -2.8 0.0 0.0 0.0 -0.1 -0.1 -0.1 -0.1
Trade Balance 21.3 24.2 -2.2 7.1 3.5 1.7 -2.1 0.7 -2.5 -0.7 Net Income & Current Transfers -16.2 -22.5 -21.9 -6.4 -5.8 -4.8 -5.9 -6.0 -5.1 -4.6
Capital & Financial Accounts 26.6 13.6 24.9 -3.1 0.2 2.1 5.1 5.9 11.9 -1.4 Percent of GDP 3.8 1.6 2.8 0.0 0.0 0.0 0.1 0.1 0.1 0.0
Direct Investment 11.1 11.5 14.3 2.1 3.1 1.6 3.8 4.5 4.5 3.4 Portfolio Investment 13.2 3.8 9.2 -4.6 0.2 2.6 3.9 2.5 0.2 2.9 Other Investment 2.3 -1.8 1.4 -0.7 -3.2 -2.1 -2.5 -1.2 7.2 -7.7
Errors & Omissions -1.5 -3.4 -0.7 -1.6 -1.6 0.0 0.1 0.3 -1.0 0.0
Foreign Reserves* 96.2 110.1 112.8 114.5 110.1 110.5 106.5 110.2 112.8 104.8
Note: * Reserves at end-period Source: BI; BPS
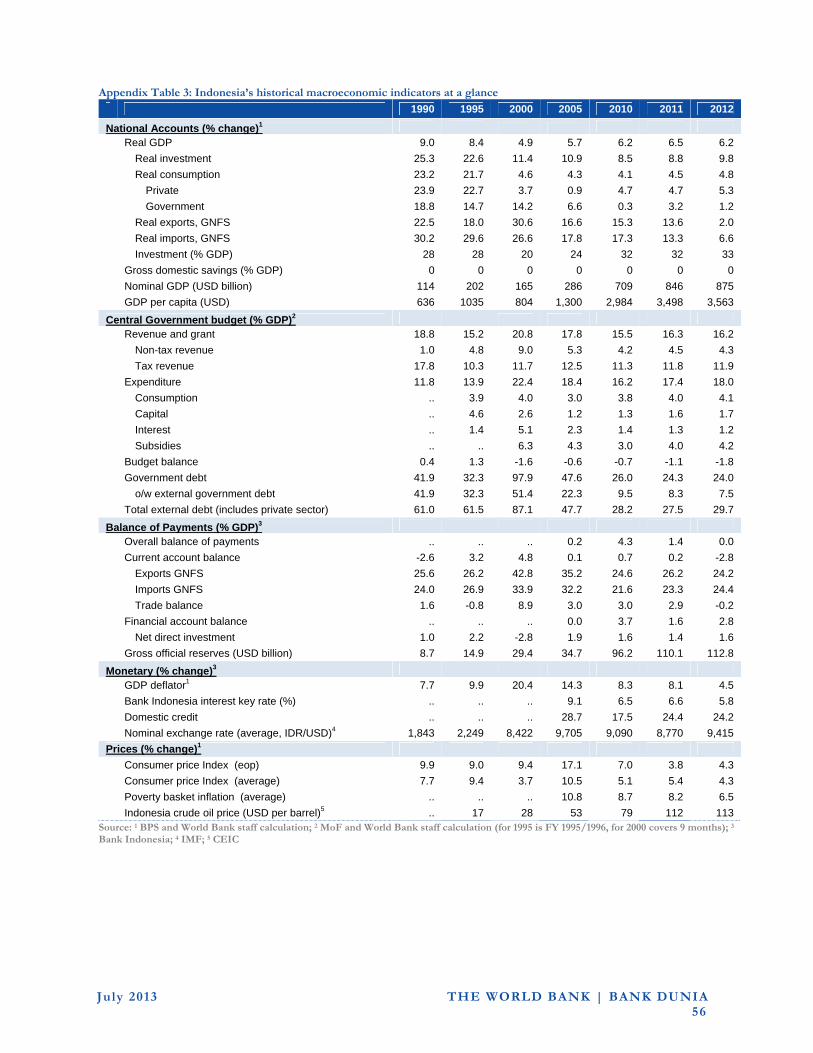
July 2013 THE WORLD BANK | BANK DUNIA56
Appendix Table 3: Indonesia’s historical macroeconomic indicators at a glance
1990 1995 2000 2005 2010 2011 2012
National Accounts (% change)1
Real GDP 9.0 8.4 4.9 5.7 6.2 6.5 6.2
Real investment 25.3 22.6 11.4 10.9 8.5 8.8 9.8
Real consumption 23.2 21.7 4.6 4.3 4.1 4.5 4.8
Private 23.9 22.7 3.7 0.9 4.7 4.7 5.3
Government 18.8 14.7 14.2 6.6 0.3 3.2 1.2
Real exports, GNFS 22.5 18.0 30.6 16.6 15.3 13.6 2.0
Real imports, GNFS 30.2 29.6 26.6 17.8 17.3 13.3 6.6
Investment (% GDP) 28 28 20 24 32 32 33
Gross domestic savings (% GDP) 0 0 0 0 0 0 0
Nominal GDP (USD billion) 114 202 165 286 709 846 875
GDP per capita (USD) 636 1035 804 1,300 2,984 3,498 3,563
Central Government budget (% GDP)2
Revenue and grant 18.8 15.2 20.8 17.8 15.5 16.3 16.2
Non-tax revenue 1.0 4.8 9.0 5.3 4.2 4.5 4.3
Tax revenue 17.8 10.3 11.7 12.5 11.3 11.8 11.9
Expenditure 11.8 13.9 22.4 18.4 16.2 17.4 18.0
Consumption .. 3.9 4.0 3.0 3.8 4.0 4.1
Capital .. 4.6 2.6 1.2 1.3 1.6 1.7
Interest .. 1.4 5.1 2.3 1.4 1.3 1.2
Subsidies .. .. 6.3 4.3 3.0 4.0 4.2
Budget balance 0.4 1.3 -1.6 -0.6 -0.7 -1.1 -1.8
Government debt 41.9 32.3 97.9 47.6 26.0 24.3 24.0
o/w external government debt 41.9 32.3 51.4 22.3 9.5 8.3 7.5
Total external debt (includes private sector) 61.0 61.5 87.1 47.7 28.2 27.5 29.7
Balance of Payments (% GDP)3
Overall balance of payments .. .. .. 0.2 4.3 1.4 0.0
Current account balance -2.6 3.2 4.8 0.1 0.7 0.2 -2.8
Exports GNFS 25.6 26.2 42.8 35.2 24.6 26.2 24.2
Imports GNFS 24.0 26.9 33.9 32.2 21.6 23.3 24.4
Trade balance 1.6 -0.8 8.9 3.0 3.0 2.9 -0.2
Financial account balance .. .. .. 0.0 3.7 1.6 2.8
Net direct investment 1.0 2.2 -2.8 1.9 1.6 1.4 1.6
Gross official reserves (USD billion) 8.7 14.9 29.4 34.7 96.2 110.1 112.8
Monetary (% change)3
GDP deflator1 7.7 9.9 20.4 14.3 8.3 8.1 4.5
Bank Indonesia interest key rate (%) .. .. .. 9.1 6.5 6.6 5.8
Domestic credit .. .. .. 28.7 17.5 24.4 24.2
Nominal exchange rate (average, IDR/USD)4 1,843 2,249 8,422 9,705 9,090 8,770 9,415
Prices (% change)1
Consumer price Index (eop) 9.9 9.0 9.4 17.1 7.0 3.8 4.3
Consumer price Index (average) 7.7 9.4 3.7 10.5 5.1 5.4 4.3
Poverty basket inflation (average) .. .. .. 10.8 8.7 8.2 6.5
Indonesia crude oil price (USD per barrel)5 .. 17 28 53 79 112 113 Source: 1 BPS and World Bank staff calculation; 2 MoF and World Bank staff calculation (for 1995 is FY 1995/1996, for 2000 covers 9 months); 3 Bank Indonesia; 4 IMF; 5 CEIC
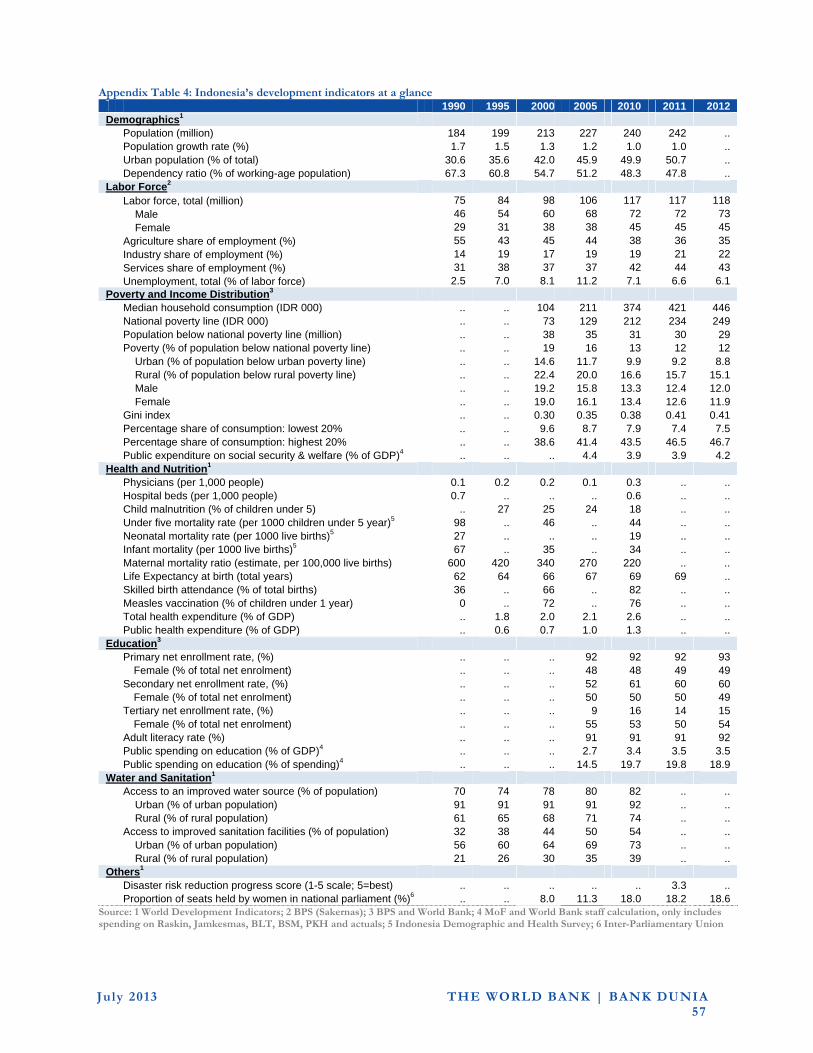
July 2013 THE WORLD BANK | BANK DUNIA57
Appendix Table 4: Indonesia’s development indicators at a glance 1990 1995 2000 2005 2010 2011 2012 Demographics1
Population (million) 184 199 213 227 240 242 .. Population growth rate (%) 1.7 1.5 1.3 1.2 1.0 1.0 .. Urban population (% of total) 30.6 35.6 42.0 45.9 49.9 50.7 .. Dependency ratio (% of working-age population) 67.3 60.8 54.7 51.2 48.3 47.8 ..
Labor Force2 Labor force, total (million) 75 84 98 106 117 117 118 Male 46 54 60 68 72 72 73 Female 29 31 38 38 45 45 45 Agriculture share of employment (%) 55 43 45 44 38 36 35 Industry share of employment (%) 14 19 17 19 19 21 22 Services share of employment (%) 31 38 37 37 42 44 43 Unemployment, total (% of labor force) 2.5 7.0 8.1 11.2 7.1 6.6 6.1
Poverty and Income Distribution3 Median household consumption (IDR 000) .. .. 104 211 374 421 446 National poverty line (IDR 000) .. .. 73 129 212 234 249 Population below national poverty line (million) .. .. 38 35 31 30 29 Poverty (% of population below national poverty line) .. .. 19 16 13 12 12 Urban (% of population below urban poverty line) .. .. 14.6 11.7 9.9 9.2 8.8 Rural (% of population below rural poverty line) .. .. 22.4 20.0 16.6 15.7 15.1 Male .. .. 19.2 15.8 13.3 12.4 12.0 Female .. .. 19.0 16.1 13.4 12.6 11.9 Gini index .. .. 0.30 0.35 0.38 0.41 0.41 Percentage share of consumption: lowest 20% .. .. 9.6 8.7 7.9 7.4 7.5 Percentage share of consumption: highest 20% .. .. 38.6 41.4 43.5 46.5 46.7 Public expenditure on social security & welfare (% of GDP)4 .. .. .. 4.4 3.9 3.9 4.2
Health and Nutrition1 Physicians (per 1,000 people) 0.1 0.2 0.2 0.1 0.3 .. .. Hospital beds (per 1,000 people) 0.7 .. .. .. 0.6 .. .. Child malnutrition (% of children under 5) .. 27 25 24 18 .. .. Under five mortality rate (per 1000 children under 5 year)5 98 .. 46 .. 44 .. .. Neonatal mortality rate (per 1000 live births)5 27 .. .. .. 19 .. .. Infant mortality (per 1000 live births)5 67 .. 35 .. 34 .. .. Maternal mortality ratio (estimate, per 100,000 live births) 600 420 340 270 220 .. .. Life Expectancy at birth (total years) 62 64 66 67 69 69 .. Skilled birth attendance (% of total births) 36 .. 66 .. 82 .. .. Measles vaccination (% of children under 1 year) 0 .. 72 .. 76 .. .. Total health expenditure (% of GDP) .. 1.8 2.0 2.1 2.6 .. .. Public health expenditure (% of GDP) .. 0.6 0.7 1.0 1.3 .. ..
Education3 Primary net enrollment rate, (%) .. .. .. 92 92 92 93
Female (% of total net enrolment) .. .. .. 48 48 49 49 Secondary net enrollment rate, (%) .. .. .. 52 61 60 60
Female (% of total net enrolment) .. .. .. 50 50 50 49 Tertiary net enrollment rate, (%) .. .. .. 9 16 14 15
Female (% of total net enrolment) .. .. .. 55 53 50 54 Adult literacy rate (%) .. .. .. 91 91 91 92 Public spending on education (% of GDP)4 .. .. .. 2.7 3.4 3.5 3.5 Public spending on education (% of spending)4 .. .. .. 14.5 19.7 19.8 18.9
Water and Sanitation1 Access to an improved water source (% of population) 70 74 78 80 82 .. .. Urban (% of urban population) 91 91 91 91 92 .. .. Rural (% of rural population) 61 65 68 71 74 .. .. Access to improved sanitation facilities (% of population) 32 38 44 50 54 .. .. Urban (% of urban population) 56 60 64 69 73 .. .. Rural (% of rural population) 21 26 30 35 39 .. ..
Others1 Disaster risk reduction progress score (1-5 scale; 5=best) .. .. .. .. .. 3.3 ..
Proportion of seats held by women in national parliament (%)6 .. .. 8.0 11.3 18.0 18.2 18.6 Source: 1 World Development Indicators; 2 BPS (Sakernas); 3 BPS and World Bank; 4 MoF and World Bank staff calculation, only includes spending on Raskin, Jamkesmas, BLT, BSM, PKH and actuals; 5 Indonesia Demographic and Health Survey; 6 Inter-Parliamentary Union

July 2013
Time of adjustment