ies 331 quality control chapter 6 control charts for attributes week 7-8 july 19-28, 2005
TRANSCRIPT

IES 331 Quality Control Chapter 6 Control Charts for Attributes
Week 7-8 July 19-28, 2005

2
Dr. Karndee Prichanont IES331 1/2005
Attribute Data If item does not conform to standard on
one or more of these characteristics, it is classified as nonconforming Conforming / Nonconforming units
Non-defective / Defecting units
Good / Bad
Pass / Fail
Nonconforming unit will contain at least on nonconformity
Nonconformities / Defects Each specific point at which a specification
is not satisfied
ex: scratch, chip, dirty spots, accident

3
Dr. Karndee Prichanont IES331 1/2005
6-2 Control Chart for Fraction Nonconforming Fraction of Nonconforming: Ratio of the
number of nonconforming items in a population to the total number of items in that population
Fraction of nonconforming ~ Binomial Distribution
p Probability that any unit will not conform to specificationsn Random sample of n unit. Sample sizeD The number of units of products that are nonconforming

4
Dr. Karndee Prichanont IES331 1/2005
The Control Chart for Fraction Nonconforming
Sample fraction nonconforming: ratio of the number of nonconforming units in the sample, D, to the sample size n
Mean and Variances

5
Dr. Karndee Prichanont IES331 1/2005
The Control Chart for Fraction Nonconforming
With specified standard value
6
Dr. Karndee Prichanont IES331 1/2005
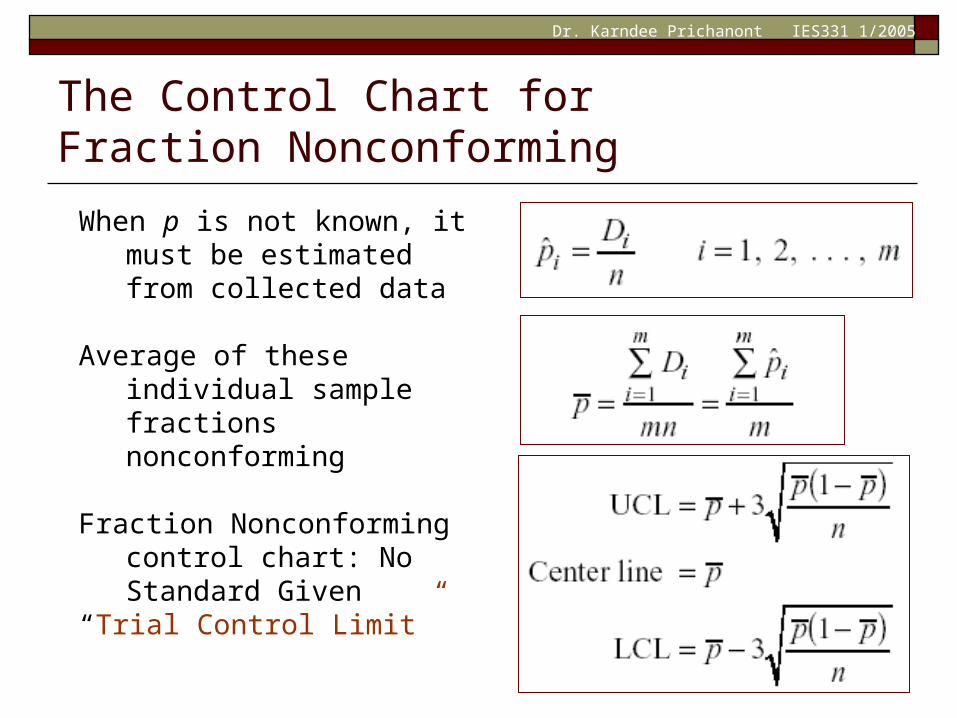
When p is not known, it must be estimated from collected data
Average of these individual sample fractions nonconforming
Fraction Nonconforming control chart: No Standard Given
“Trial Control Limit”
The Control Chart for Fraction Nonconforming

7
Dr. Karndee Prichanont IES331 1/2005
Ex 1 (Exercise 6-1)
Also see Example 6-1
The data that follow give the number of nonconforming bearing and seal assemblies in sample size of 100
Construct a fraction nonconforming control chart for these data.
If any points plot out of control, assume that assignable causes can be found and determine the revised control limits
Sample #Number of
Noncomforming Assemblies
1 7
2 4
3 1
4 3
5 6
6 8
7 10
8 5
9 2
10 7
11 6
12 15
13 0
14 9
15 5
16 1
17 4
18 5
19 7
20 12
8
Dr. Karndee Prichanont IES331 1/2005
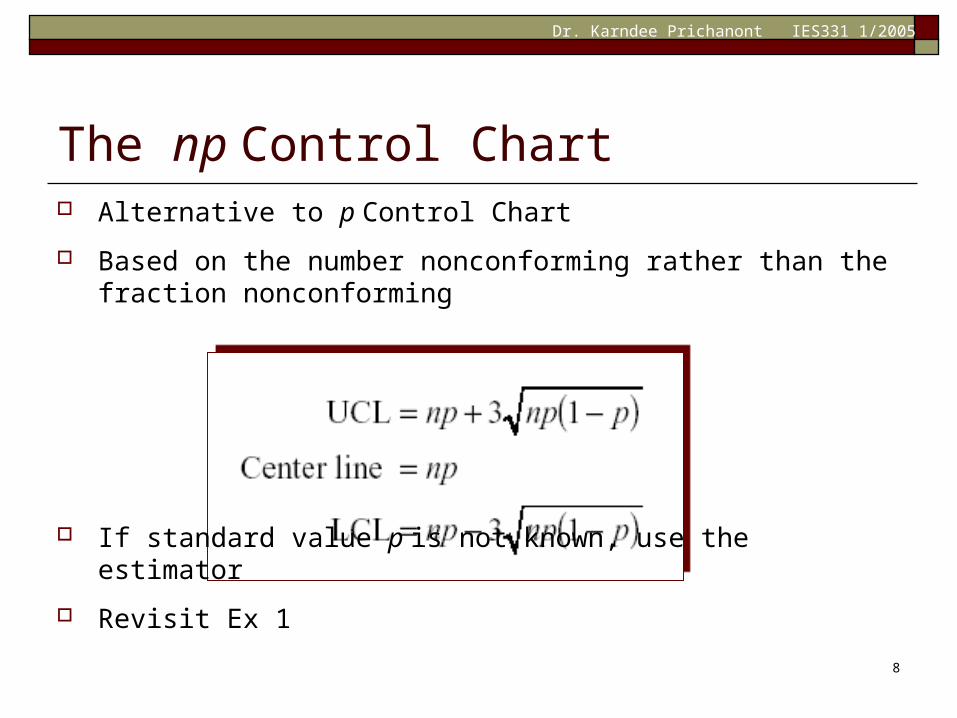
The np Control Chart Alternative to p Control Chart
Based on the number nonconforming rather than the fraction nonconforming
If standard value p is not known, use the estimator
Revisit Ex 1

9
Dr. Karndee Prichanont IES331 1/2005
Variable Sample Size3 approaches to deal with variable sample size
1. Variable-width control limits: to determine control limits for each individual sample that are based on specific sample size
2. Control limits based on average sample size: to obtain an approximate set of control limits (constant control limits)
3. The standardized control chart:
The points are plotted in standard deviation units
Center line at zero
Upper and lower control limits +3 and - 3

10
Dr. Karndee Prichanont IES331 1/2005
Ex 2 (Exercise 6-3)
Also see Example 6-2
Day
Units Inspecte
d
Nonconforming units
Fraction Nonconforming
1 80 4 0.050
2 110 7 0.064
3 90 5 0.056
4 75 8 0.107
5 130 6 0.046
6 120 6 0.050
7 70 4 0.057
8 125 5 0.040
9 105 8 0.076
10 95 7 0.074
The following data represent the results of inspecting all units of a personal computer produced for the last 10 days.
Does the process appear to be in control?

11
Dr. Karndee Prichanont IES331 1/2005
The Operating-Characteristic Function OC curve provides a measure
of the sensitivity of the control chart
Ability to detect the shift in the process fraction nonconforming from the nominal value to some other value
Probability of incorrectly accepting the hypothesis of statistical control (i.e., type II or β-error)
}|{}|{
}|ˆ{}|ˆ{
pnLCLDPpnUCLDP
pLCLpPpUCLpP
}|{}|{
}|ˆ{}|ˆ{
pnLCLDPpnUCLDP
pLCLpPpUCLpP

12
Dr. Karndee Prichanont IES331 1/2005

13
Dr. Karndee Prichanont IES331 1/2005
Average Run Length (ARL) ARL for any Shewhart
control chart
If the process in control, ARL0
If the process is out of control, ARL1
control) ofout plotspoint sample(
1ARL
P
control) ofout plotspoint sample(
1ARL
P
1
ARL0 1
ARL0
1
1ARL1
1
1ARL1

14
Dr. Karndee Prichanont IES331 1/2005
6-3 Control Charts for Nonconformities (Defects) We can develop control
charts for Total number of
nonconformities in a unit, or
Average number of nonconformities per unit
Defects or nonconformities ~ Poisson Distribution
Where x is the number of nonconformities and C > 0
c chart: same sample size

15
Dr. Karndee Prichanont IES331 1/2005
Ex 3 (Exercise 6-41)
Also see Example 6-3
The data represent the number of nonconformities per 1000 meters in telephone cable.
From analysis of these data, would you conclude that the process is in control?
Sample Number
Number of Nonconformities
1 1
2 1
3 3
4 7
5 8
6 10
7 5
8 13
9 0
10 19
11 24
12 6
13 9
14 11
15 15
16 8
17 3
18 6
19 7
20 4
21 9
22 20

16
Dr. Karndee Prichanont IES331 1/2005
Choice of Sample Size:u chart
It may requires several inspection units in the sample
u chart: setting up the control chart based on the average number of nonconformities per inspection unit
Average number of nonconformities per inspection unit
17
Dr. Karndee Prichanont IES331 1/2005
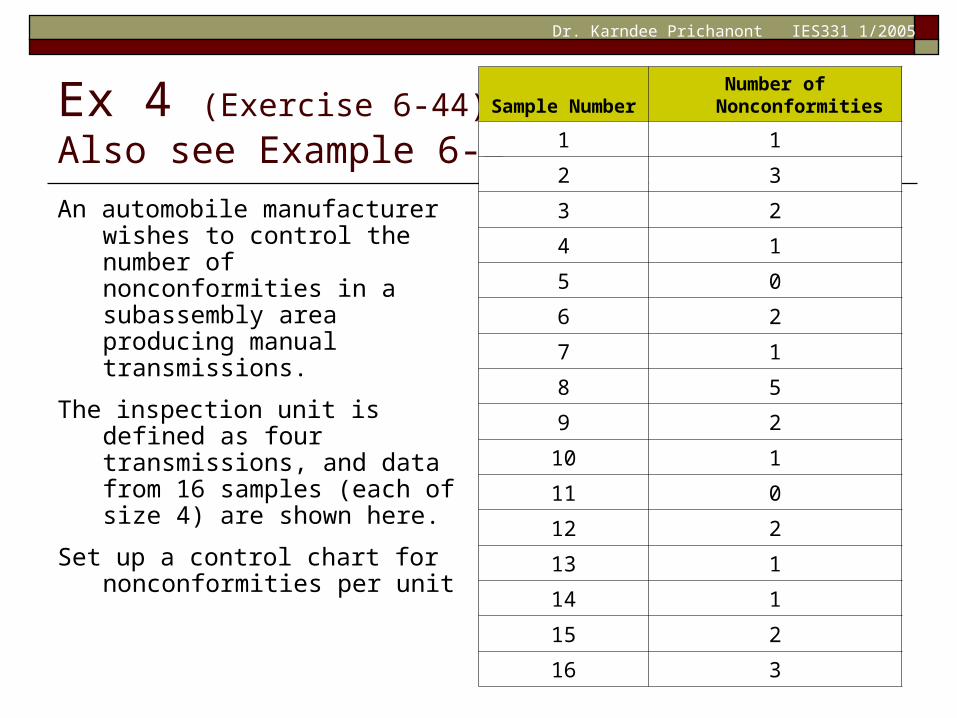
Ex 4 (Exercise 6-44)
Also see Example 6-4
An automobile manufacturer wishes to control the number of nonconformities in a subassembly area producing manual transmissions.
The inspection unit is defined as four transmissions, and data from 16 samples (each of size 4) are shown here.
Set up a control chart for nonconformities per unit
Sample Number
Number of Nonconformities
1 1
2 3
3 2
4 1
5 0
6 2
7 1
8 5
9 2
10 1
11 0
12 2
13 1
14 1
15 2
16 3

18
Dr. Karndee Prichanont IES331 1/2005
Control charts for nonconformities with variable sample size c chart will be difficult to interpret –
varying center line and control limits
Alternative approaches are:
1. u chart (nonconformities per unit)
Constant center line
Control limit will vary inversely with the n1/2
2. Use control limits based on an average sample size
3. Use a standardized control chart (preferred)

19
Dr. Karndee Prichanont IES331 1/2005
Demerit Systems for Defects

20
Dr. Karndee Prichanont IES331 1/2005
The Operating Characteristic Function OC curves for c and u charts
can be obtained from the Poisson distribution

21
Dr. Karndee Prichanont IES331 1/2005
Action taken to improve a process