iestoc and lielioods spotlit kenya - home | food and
TRANSCRIPT
Financial support provided by the United States Agency for International Development (USAID)
Livestock and livelihoods spotlight
KENYACattle andpoultry sectors
Republic of Kenya

1
Livestock and Livelihoods Spotlight
Cattle and Poultry in Kenya
1. Introduction
Livestock contributes to people’s livelihoods through numerous channels such as income, food,
employment, draft power, hauling services, manure, social status, savings, insurance and so on.
Quantifying these outputs and services as well as their value is challenging, both because of
insufficient data and lack of standard methodologies. However, appreciating the role livestock play
in the household economy it is critical to understand how future growth and transformation of
the livestock sector will impact societal welfare.
In this brief the contribution of cattle and poultry to household livelihoods has been summarised,
based on available information, including government and research reports and papers. The fact
that cattle and poultry contribute differently to household livelihoods in the different production
systems has been differentiated. The production systems were selected and characterized by
stakeholders, including the Ministry of Agriculture, Livestock and Fisheries, the Ministry of
Environment and Natural Resources and the Ministry of Health, as part of the implementation of
a One-Health approach assessing the current and long-term impact of livestock production
systems on the economy and people’s livelihoods, on public health and on the environment. The
production systems include intensive, semi-intensive and extensive dairy production systems (table
1); pastoralism, agro-pastoralism, ranching and feedlots for beef production (table 5); and free-
range, semi-intensive and intensive poultry meat production systems (table 7).
Data on the contribution of dairy production systems to households’ livelihoods are discussed and
presented first, while the following two sections focus on the beef and poultry production systems,
respectively. Conclusions are drawn at the end of this brief.
2. Dairy production systems and livelihoods
Kenya has a vibrant dairy sector, estimated to be the second largest contributor to livestock value
added. The country produced over 4.48 billion litres of milk in 2014, valued at KES 243 billion.
Dairy cows contributed with 76 percent of the total milk production, with the remaining coming
from camels and goats (FAOSTAT, 2017). Smallholders in all production systems contribute with
about 90 percent to the national milk supply (Nassuima and Nyoike, 2014). Per capita milk
consumption averages 117 litres per year, one of the highest in Africa (FAOSTAT, 2017; SDP,
2004; GoK, 2010). The sector is fast-growing: milk production, processing capacity and per capita
consumption growth rates average 5.3, 7 and 5.8 per year, respectively (GoK, 2010; GoK, 2015).
Table 1. Kenya dairy production systems
Animal population: 4.5 million dairy cows
Intensive (zero grazing) dairy system
In intensive dairy systems, farmers keep stall fed exotic cattle and sell most of the milk produced to the market. While the average herd size varies, in most cases farmers keep few dairy animals and also a few acres of land, which allow a close livestock-crop (mainly maize) integration. Intensive dairy farms are concentrated in the mid- and high-altitude agro-ecological zones, where cereal and cash crops are grown. The farms are particulary predominant in Mount Kenya and central Rift Valley regions, and present in many urban and peri-urban zones in humid and sub-humid areas of the country.

2
Semi-intensive (semi-grazing)
This is the most popular dairy system. Farmers let the animal graze during daytime and provide feeding at night, including supplements during milking. Farmers keep crosses of the dairy breed of cattle, and dairy animals are part of a larger herd, including other animals such as chicken, sheep, goats, donkeys and, occasionally, pigs. Semi-intensive dairy systems are concentrated in Mount Kenya, the central and north Rift Valley and in the coastal regions, but presently in all areas where crop farming is practiced, such as the western and Nyanza regions.
Extensive (controlled and uncontrolled)
This is a pasture/based production system and practiced in large farms (controlled grazing with large herds) and in marginal and communal grazing lands (uncontrolled grazing smaller herds). Animals are both exotic and improved. Under controlled grazing, animals are placed on natural and improved pastures using paddocks or strip grazing and supplemented with high quality fodder, mineral licks and commercial concentrates. Uncontrolled grazing is characterized by free grazing in natural pastures. This system is found in North and South Rift Valley, Eastern and Coast Regions.
Source: ASL2050, FAO, 2017
2.1. Population depending on dairy cattle
The Kenya dairy sector plays a critical role in the livelihood of many Kenyans. About 1.3 million
households are estimated to keep dairy cattle, a figure arrived at by combining expert opinions
with livestock population data (FAO, 2017; GoK, 2016). Small-scale farmers represent 95 percent
of all households keeping dairy animals but keep about 6 percent of the dairy population with an
average herd size of 3 cows (Table 2). The 2 percent of farmers that raise animals in intensive or
extensive (controlled) systems keep about 40 percent of the national dairy herd, with an average
of 20 cattle per herd (GoK, 2015; Bebe et al., 2016).
Table 2. Households keeping dairy cattle
Production system Number of dairy cattle per
production system1
Herd sizes 2
Number of dairy cattle keeping households3
Share %
Intensive (zero grazing) small scale 1 555 354 3 518 451 40 Intensive (zero grazing) large scale 303 116 20 15 156 1 Semi Intensive (semi-grazing) 2 141 791 3 713 930 55 Extensive (controlled) 266 650 20 13 332 1 Extensive (uncontrolled) 238 823 5 47 765 4 Total 4 505 733
1 308 634
Note: (1, 2) Source: ASL2050 FAO (2017) and GoK (2016); (3) No. dairy cattle /herd size
2.2. Household income
Dairy cattle contribute to household cash income through milk consumption and sale of liquid
milk or processed products, such as cheese. They are also a source of meat (culled cows and
fattened bull calves), though animals are largely kept for producing milk.
Table 3 and figure 1 show the different income sources for households keeping dairy cows in the
different dairy production systems. These include livestock and crop income, off-farm self-
employment, wage employment (salaries) and transfers (including public and private, international
and domestic). Livestock income includes revenues from raising all types of animals; self-
employment refers to off and non-farm businesses, such as petty craft and trade. Livestock income
is estimated as cash income (revenues from sale of live animals and livestock products), plus the
value of self-consumed livestock products, minus operating costs such as feed, water and
3
veterinary expenses. The value of non-tradable, such as the provision of hauling services and
insurance, is not estimated due to lack of data.
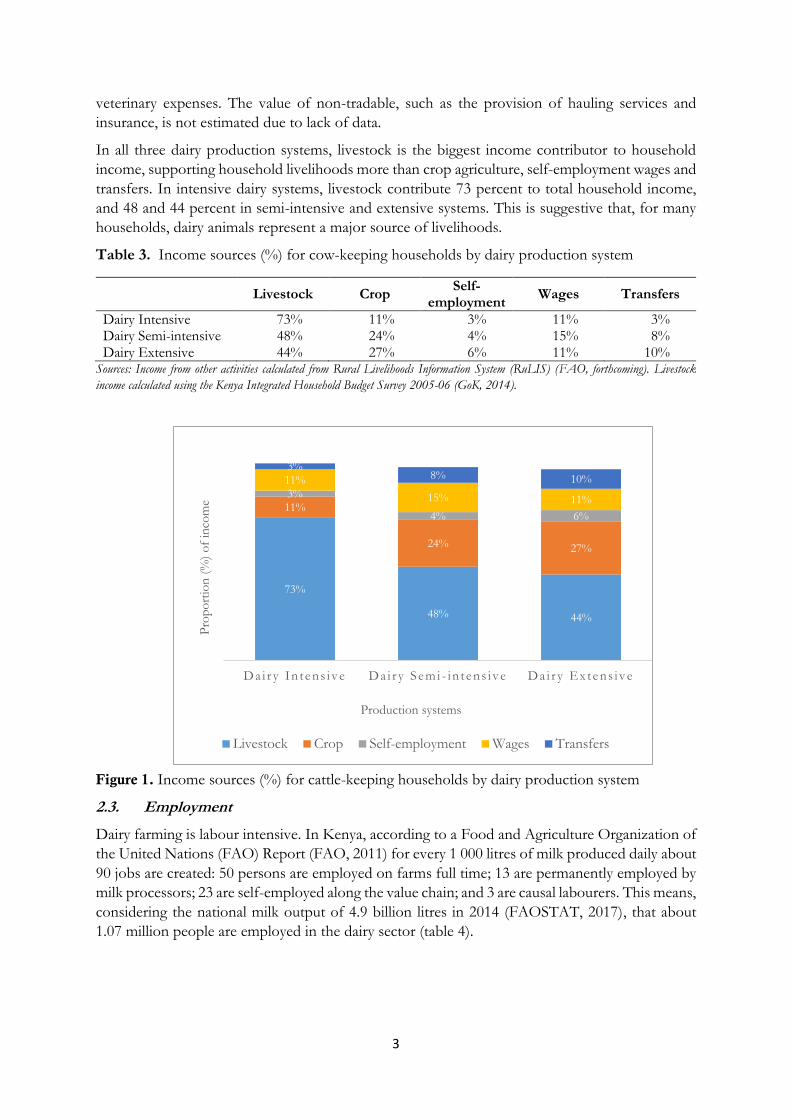
In all three dairy production systems, livestock is the biggest income contributor to household
income, supporting household livelihoods more than crop agriculture, self-employment wages and
transfers. In intensive dairy systems, livestock contribute 73 percent to total household income,
and 48 and 44 percent in semi-intensive and extensive systems. This is suggestive that, for many
households, dairy animals represent a major source of livelihoods.
Table 3. Income sources (%) for cow-keeping households by dairy production system
Livestock Crop
Self-employment
Wages Transfers
Dairy Intensive 73% 11% 3% 11% 3% Dairy Semi-intensive 48% 24% 4% 15% 8% Dairy Extensive 44% 27% 6% 11% 10%
Sources: Income from other activities calculated from Rural Livelihoods Information System (RuLIS) (FAO, forthcoming). Livestock
income calculated using the Kenya Integrated Household Budget Survey 2005-06 (GoK, 2014).
Figure 1. Income sources (%) for cattle-keeping households by dairy production system
2.3. Employment
Dairy farming is labour intensive. In Kenya, according to a Food and Agriculture Organization of
the United Nations (FAO) Report (FAO, 2011) for every 1 000 litres of milk produced daily about
90 jobs are created: 50 persons are employed on farms full time; 13 are permanently employed by
milk processors; 23 are self-employed along the value chain; and 3 are causal labourers. This means,
considering the national milk output of 4.9 billion litres in 2014 (FAOSTAT, 2017), that about
1.07 million people are employed in the dairy sector (table 4).
73%
48% 44%
11%
24% 27%
3%
4% 6%
11%
15% 11%
3%8% 10%
Da i r y In t ens i ve Da i r y Semi - in t ens i ve Da i r y Ex tens i ve
Pro
po
rtio
n (
%)
of
inco
me
Production systems
Livestock Crop Self-employment Wages Transfers

4
Table 4. Employment in the dairy sector
Milk output (litres)
Category of employment
Self-employed
Full time on farm
jobs
Casual laborers
Full time jobs in
processing
Milk production (2014) 4 900 000 000
Milk processed 1 470 000 000
Jobs created per 1 000 litres/day
23 50 3 13
Jobs
308 767 671 233 40 274 52 356
Total no. of jobs
1 072 630
Source: Authors’ calculation based on FAO (2011)
2.4. Nutrition
Milk and dairy products are nutrient-dense foods supplying energy and significant amounts of
protein and micronutrients including calcium, magnesium, selenium, riboflavin, vitamins B5 and
B12, which are essential to reduce hunger and malnutrition particularly amongst the most
vulnerable (e.g. pregnant women and children). In Kenya, out of the 4.5 billion litres of milk
produced in 2010, 65 percent was marketed, 27 percent self-consumed with the remaining 8
percent given to calves (Figure 2). This indicates that a large share of the Kenyan population
consumes milk, and that milk represents a major source of nutrients for households keeping dairy
cows, even when they have limited access to market and/or purchasing power.
Figure 2. Proportion of milk marketed, consumed at home and fed to calves.
Source: GoK (2010)
3. Beef production systems and livelihoods
The beef industry is the largest contributor to livestock value added (Kosgey et al., 2011; Otieno et
al., 2012) as well as a major contributor to income and employment (Alarcon et al., 2017). Its
contribution to societal welfare is particularly relevant in arid and semi-arid lands (ASALs), where
beef production is the main economic activity (Kahi et al., 2006; Kinyamario and Ekeya, 2001).
The four major beef production systems in Kenya are pastoralism, ranching, agro-pastoralism
systems, and feedlots (FAO, 2017).
Marketed Domesticmarket)
Familyconsumption (
livetock keepers )Calfs consumption Total milk ouput
litres ( millions)in 2014 2 925 1 215 360 4 500
65%
27%
8%
0
500
1 000
1 500
2 000
2 500
3 000
3 500
4 000
4 500
5 000
Milk
Co
nsu
mp
tio
n (
LiT
)
5
Table 5. Kenya beef production systems
Animal population: 14 million beef cattle
Pastoralism (extensive system)
Pastoralism is a low-input low-output subsistence system, with indigenous cattle relying entirely on communal grazing areas and water sources. Pastoralism, including transhumance and nomadic pastoralism, is practices in arid and semi-arid areas. Livestock density in pastoral areas is low, at about 11 Tropical Livestock Unit.
Ranching (extensive)
Ranches are made up of large land areas and have large herds, including local, crossed and exotic breeds. Most ranches have infrastructure for disease control, feeding and water storage. It is a highly commercial system targeting prime local niche markets and export markets and, as such, contributes to the Kenya export revenue.
Agro pastoralism (semi-intensive)
Agro-pastoralists keep a mixed herd, including beef cattle, and feed animals with crop residues and other products. They make use of animal manure and draft power to increase crop productivity. Agro-pastoralism is a low input low output system, subsistence oriented, and mainly practiced in semi-arid areas. Animal densities range from 20 tropical livestock unit per km2 in the lowlands to 50 in the highlands.
Feed lot (intensive)
This is a commercially-oriented system in which animals are kept for a short period (about 3 months) during which they are fattened and sold to niche/prime beef markets. It is both a capital and labour-intensive system, with significant investments in feeding and animal health. There are two different feed lot systems – one focusing on fattening dairy culls and dairy bull calves, the other fattening beef breeds.
Source: ASL2050, FAO (2017)
3.1. Population depending on beef cattle
There are no accurate statistics on the Kenyan population who depend partly or fully on beef cattle
for their livelihoods. However, beef is largely produced in arid and semi-arid areas, where about
13 million people or about 36 percent of the Kenyan population live (GoK, 2009). About 64
percent of these are pastoralists and 16 percent agro-pastoralists (Oxfam, 2008).
Overall, one can conclude that about 8 million people in Kenya directly depend on beef cattle for
their livelihoods.
3.2. Household income
There are no statistics available to estimate the benefits households keeping beef cattle derive from
their animals. However, using livestock population data from GoK (2016) and African Sustainable
Livestock 2050 (ASL2050) FAO (2017) one can estimate the value of beef production for the
different production systems, which can then be used as proxy to assess the contribution of beef
to household livelihoods. The total value of beef production in Kenya, estimated by using standard
parameters for offtake, dressing weight, and offal proportion, can be estimated to over 106 billion
KES (table 6).
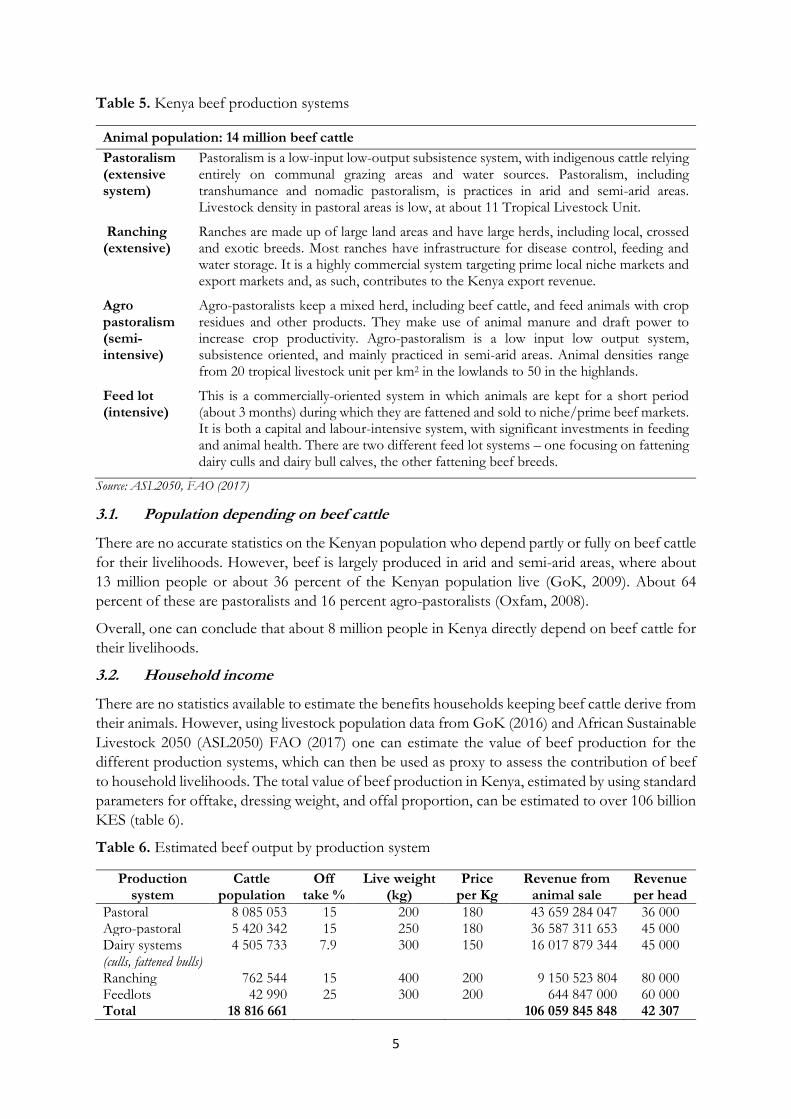
Table 6. Estimated beef output by production system
Production system
Cattle population
Off take %
Live weight (kg)
Price per Kg
Revenue from animal sale
Revenue per head
Pastoral 8 085 053 15 200 180 43 659 284 047 36 000 Agro-pastoral 5 420 342 15 250 180 36 587 311 653 45 000 Dairy systems (culls, fattened bulls)
4 505 733 7.9 300 150 16 017 879 344 45 000
Ranching 762 544 15 400 200 9 150 523 804 80 000 Feedlots 42 990 25 300 200 644 847 000 60 000 Total 18 816 661
106 059 845 848 42 307

6
Sources: Gross output calculated using estimated proportions of herd number in the different production systems (FAO, 2017) based on
KNBS livestock figures (GoK, 2016) and offtake percentages (USAID, 2012) and prices provided by experts from State Department of
Livestock.
Pastoralism is the largest contributor to beef output, accounting for about 46.3 percent of all
production value. Agro-pastoralism follows, with 31 percent of all production value. Culls and
fattened bulls from dairy systems, ranching systems and feedlot contribute to about 14, 8 and 1
percent of all the beef production value.
As 36 percent of the Kenyan population live in pastoral and agro-pastoral areas that jointly account
for 76 percent of all beef production value, it implies that beef systems play a major role in
supporting the livelihoods of people living in arid and semi-arid areas. However, the revenue per
head of cattle is lower in pastoral and agro-pastoral systems than in ranching and feedlots systems,
suggesting that households, on average, derive only marginal benefits from their cattle (Kahi et al,
2006).
4. Poultry production systems and livelihoods
Poultry contributes 8 percent to agricultural value added, with the country producing over 25 000
tons of poultry meat and 1.3 billion eggs per year, jointly valued at KES 28.5 billion (FAOSTAT,
2017). Per capita consumption is approximately 0.56 kg of poultry meat and 45 eggs per year
(FAOSTAT, 2017). The sector is highly heterogeneous, comprising of a large number of small
scale free-range and backyard indigenous chicken producers; a good number of small scale
commercial layers and broiler farms; and few industrial integrated layer and broiler farms. Chickens
constitute about 98 percent of the total poultry raised in Kenya and 65 percent of Kenyan
households are estimated to keep at least one bird. The three major poultry production systems in
Kenya are free range, semi-intensive and intensive systems. Table 7 presents a succinct description
of major chicken production systems, excluding layer farms.
Table 7. Kenya chicken production systems
Bird population: 39 million meat or dual purpose chickens
Intensive production system (broiler farming)
Broiler farming in Kenya is practised in urban and peri-urban areas, such as around Nairobi, Mombasa, Nakuru and Kisumu. This system requires little space and exotic birds – mainly sourced locally or imported from Uganda – kept in large hangars and fed compounded feed. This system is market-oriented. It is estimated that over 3 million broiler chickens are raised in Kenya, in small, medium and large farms. Flock sizes per cycle vary from 50–500 (small scale) through 500-10 000 (medium) to over 10 000 (large and integrated farms). The system is market-oriented.
Semi-intensive production system
Farmers keep flocks of 30 to 100 birds confined in simple structures. The birds are both indigenous and exotic, and provided with feed supplements. Farmers sell most of the birds, though some are self-consumed. Semi-intensive production system is a practiced throughout the country, the exact number of semi-intensive farms is not known, though experts estimate they likely keep up to a third of all chickens in the country.
Extensive system (free-range)
This is a low input low output system where birds are left to freely roam for feed. Farmers keep flock ranging from 5 to 30 local birds, often managed by women and children. It is a subsistence-oriented system, with little and opportunistic informal marketing. Although popular throughout the country free ranging is predominant in western Kenya regions, some parts of lower eastern, north Rift areas and coastal areas.
Source: ASL2050, FAO (2017)
7
4.1. Population depending on poultry
Most households across the 47 counties in Kenya keep poultry, including the poor and the landless.
For instance, FAO (2007) reports that about 75 percent of rural households keep poultry in rural
areas, as well as a good share of households in Nairobi, Muranga, Nyeri, Nakuru, Thika, Mombasa,
Kisumu and Eldoret. In Nyanza and Western Kenya, over 96 percent of the rural households are
estimated to keep indigenous chicken in extensive or semi semi-intensive systems (Okitoi et al.,
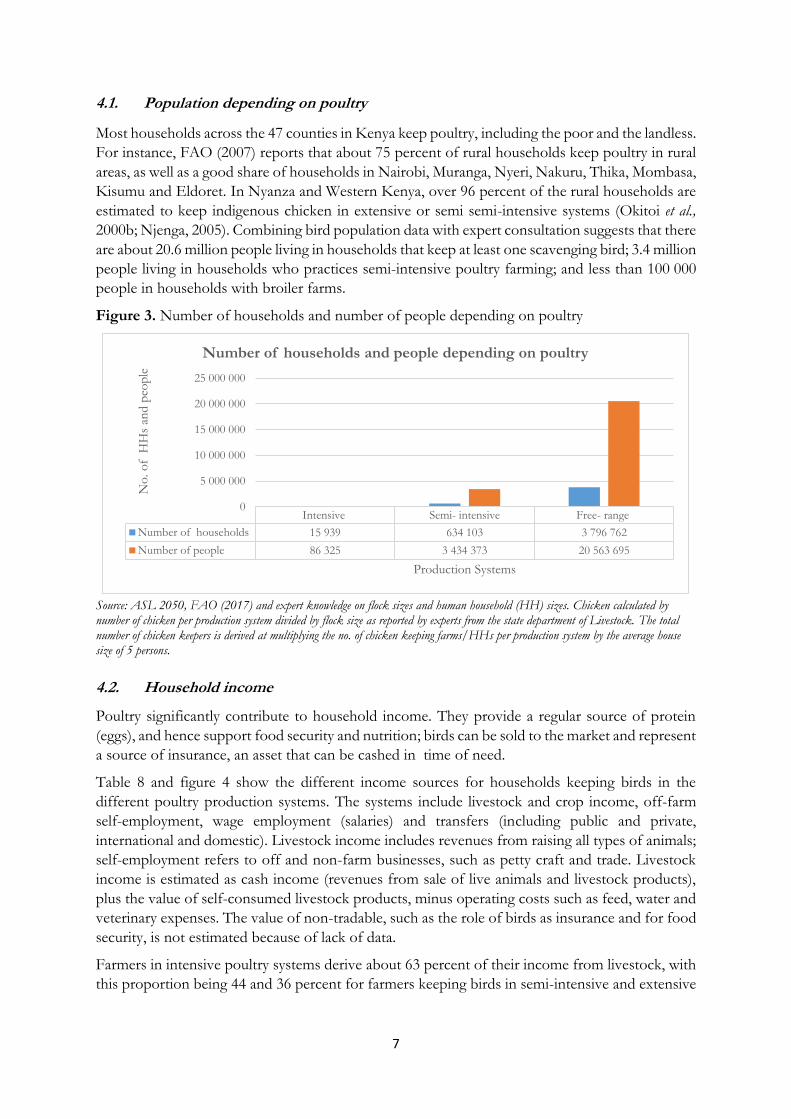
2000b; Njenga, 2005). Combining bird population data with expert consultation suggests that there
are about 20.6 million people living in households that keep at least one scavenging bird; 3.4 million
people living in households who practices semi-intensive poultry farming; and less than 100 000
people in households with broiler farms.
Figure 3. Number of households and number of people depending on poultry
Source: ASL 2050, FAO (2017) and expert knowledge on flock sizes and human household (HH) sizes. Chicken calculated by number of chicken per production system divided by flock size as reported by experts from the state department of Livestock. The total number of chicken keepers is derived at multiplying the no. of chicken keeping farms/HHs per production system by the average house size of 5 persons.
4.2. Household income
Poultry significantly contribute to household income. They provide a regular source of protein
(eggs), and hence support food security and nutrition; birds can be sold to the market and represent
a source of insurance, an asset that can be cashed in time of need.
Table 8 and figure 4 show the different income sources for households keeping birds in the
different poultry production systems. The systems include livestock and crop income, off-farm
self-employment, wage employment (salaries) and transfers (including public and private,
international and domestic). Livestock income includes revenues from raising all types of animals;
self-employment refers to off and non-farm businesses, such as petty craft and trade. Livestock
income is estimated as cash income (revenues from sale of live animals and livestock products),
plus the value of self-consumed livestock products, minus operating costs such as feed, water and
veterinary expenses. The value of non-tradable, such as the role of birds as insurance and for food
security, is not estimated because of lack of data.
Farmers in intensive poultry systems derive about 63 percent of their income from livestock, with
this proportion being 44 and 36 percent for farmers keeping birds in semi-intensive and extensive
Intensive Semi- intensive Free- range
Number of households 15 939 634 103 3 796 762
Number of people 86 325 3 434 373 20 563 695
0
5 000 000
10 000 000
15 000 000
20 000 000
25 000 000
No
. o
f H
Hs
and
peo
ple
Production Systems
Number of households and people depending on poultry
8
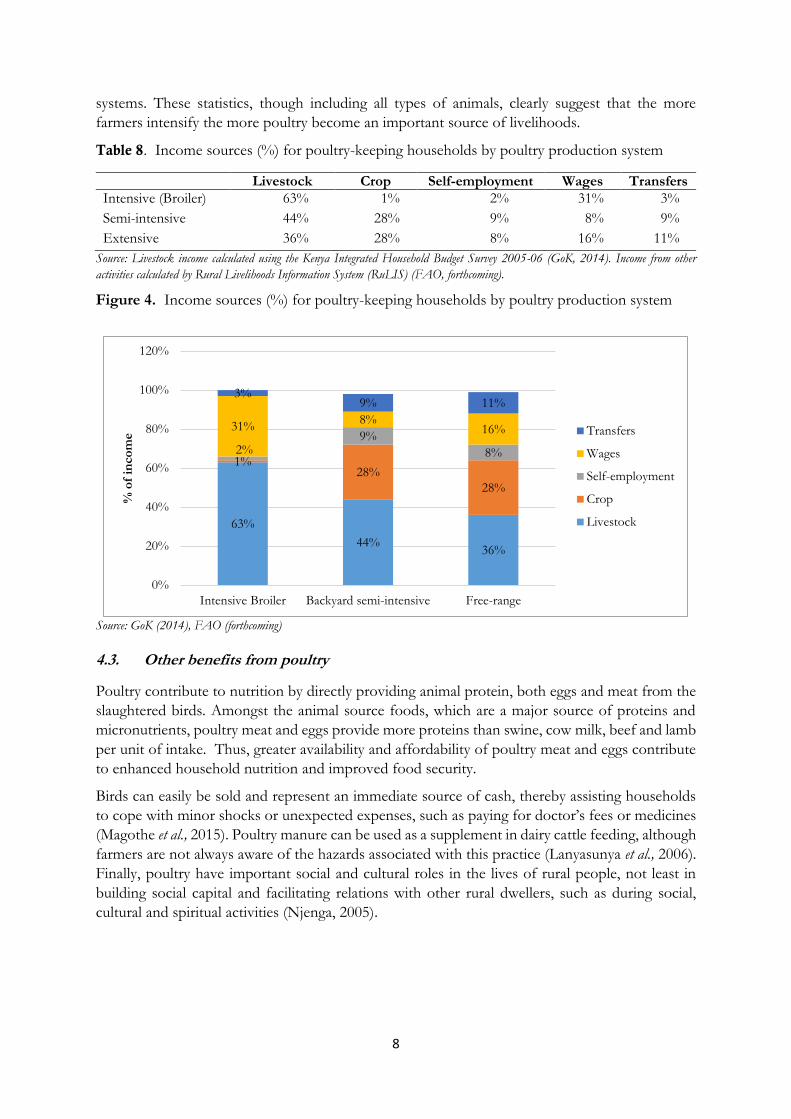
systems. These statistics, though including all types of animals, clearly suggest that the more
farmers intensify the more poultry become an important source of livelihoods.
Table 8. Income sources (%) for poultry-keeping households by poultry production system
Livestock Crop Self-employment Wages Transfers
Intensive (Broiler) 63% 1% 2% 31% 3%
Semi-intensive 44% 28% 9% 8% 9%
Extensive 36% 28% 8% 16% 11%
Source: Livestock income calculated using the Kenya Integrated Household Budget Survey 2005-06 (GoK, 2014). Income from other
activities calculated by Rural Livelihoods Information System (RuLIS) (FAO, forthcoming).
Figure 4. Income sources (%) for poultry-keeping households by poultry production system
Source: GoK (2014), FAO (forthcoming)
4.3. Other benefits from poultry
Poultry contribute to nutrition by directly providing animal protein, both eggs and meat from the
slaughtered birds. Amongst the animal source foods, which are a major source of proteins and
micronutrients, poultry meat and eggs provide more proteins than swine, cow milk, beef and lamb
per unit of intake. Thus, greater availability and affordability of poultry meat and eggs contribute
to enhanced household nutrition and improved food security.
Birds can easily be sold and represent an immediate source of cash, thereby assisting households
to cope with minor shocks or unexpected expenses, such as paying for doctor’s fees or medicines
(Magothe et al., 2015). Poultry manure can be used as a supplement in dairy cattle feeding, although
farmers are not always aware of the hazards associated with this practice (Lanyasunya et al., 2006).
Finally, poultry have important social and cultural roles in the lives of rural people, not least in
building social capital and facilitating relations with other rural dwellers, such as during social,
cultural and spiritual activities (Njenga, 2005).
63%
44%36%
1%28%
28%
2%9%
8%
31%8%
16%
3%9% 11%
0%
20%
40%
60%
80%
100%
120%
Intensive Broiler Backyard semi-intensive Free-range
% o
f in
co
me Transfers
Wages
Self-employment
Crop
Livestock

9
5. Conclusion
Livestock are a popular asset in Kenya and a major contributor to household livelihoods, both in
terms of income as well as food. However, there is heterogeneity between households in the
different production systems. It was described in this brief how cattle and poultry contribute and
contribute differently to the livelihoods of households in dairy, beef and poultry production
systems. In all cattle and poultry production systems, livestock – including all animals – contribute
with between 36 and 73 percent to total household income. As expected there are large differences
between and within systems, with large ruminants contributing more to total household income
than poultry on average. Households in all systems also benefit from consuming animal source
foods, including milk, beef and poultry meat.
When creating policies to support livestock sector growth it is necessary to take into consideration
that any transformation of the livestock sector will have direct implications on the livelihoods of
a large part of the Kenyan population. Decision-makers should not only use production and
productivity as the metrics to assess the impact of their livestock sector policies, but also examine
their impact on household income, consumption of animal source foods, and poverty and food
security overall.
January 2018. This brief was written by Stephen Gikonyo (FAO) and Ana Felis (FAO) under the
guidance of the Members of the Africa Sustainable Livestock 2050 (ASL2050) Kenya Steering
Committee. ASL2050 is a USAID-funded policy initiative implemented under the umbrella of the
FAO Emerging Pandemic Threat Program.
6. References
Alarcon, P., Fèvre, E. M., Murungi, M. K., Muinde, P., Akoko, J., Dominguez-Salas, P., ...
& Rushton, J. 2017. Mapping of beef, sheep and goat food systems in Nairobi—A framework for policy making
and the identification of structural vulnerabilities and deficiencies. Agricultural Systems, 152, 1-17
Bebe, B.O., Rademaker, C., Van De Lee, V., Kilelu, C. & Tonui, C. 2016. Sustainable growth
of the Kenyan dairy sector - A quick scan of robustness, reliability and resilience.
http://edepot.wur.nl/413390
FAO. 2007. Poultry sector review in Kenya. Rome: Food and Agriculture Organization of the United
Nations.
FAO. 2011. Dairy development in Kenya. Rome: Food and Agriculture Organization of the United
Nations.
FAO. 2017. ASL2050 Livestock production systems spotlight: Kenya. Cattle and poultry sectors. African
Sustainable Livestock 2050. FAO, Nairobi, Kenya.
FAO. Forthcoming. RuLIS - Rural Livelihoods Information System, Forthcoming. Rome.
FAOSTAT. 2017. Livestock Primary (data for 2014) http://www.fao.org/faostat/en/#data/QL
GoK. 2009. Population and housing census 2009. Kenya National Bureau of Statistics (KNBS), Ministry
of Planning and National Development, Nairobi. Government of Kenya.
GoK. 2010. Kenya National Dairy Master Plan. A situational analysis of the dairy sub-sector. Volume I.
Nairobi: Ministry of Agriculture, Livestock and Fisheries (MoALF), Government of Kenya.

10
GoK. 2014. Kenya integrated household and budget survey 2005/06. Kenya National Bureau of statistics
(KNBS). Ministry of Devolution and Planning, Nairobi. Government of Kenya.
GoK. 2015. Kenya Dairy Board Annual Report and Financial Statements for the year ended 30 June 2014.
Kenya Dairy Board (KDB). http://kdb.co.ke/press/publications/reports/21-kdb- 2014-annual-
report/file.
GoK, 2016. County summaries for livestock products for year 2016. Kenya National Bureau of statistics
(KNBS). Ministry of Devolution and Planning, Nairobi. Government of Kenya
Kahi, A. K., Wasike, C. B. & Rewe, T. O. 2006. Beef production in the arid and semi-arid lands of
Kenya: constraints and prospects for research and development. Outlook on Agriculture, 35(3), 217-225.
Kinyamario, J. I. & Ekeya, W. N. 2001. Mechanisms of drought management by African pastoralists. In
Proceedings of animal production society of Kenya symposium (pp. 117-122).
Kosgey, I. S., Mbuku, S. M., Okeyo, A. M., Amimo, J., Philipsson, J. & Ojango, J. M. 2011.
Institutional and organizational frameworks for dairy and beef cattle recording in Kenya: a review and opportunities
for improvement. Animal Genetic Resources/Resources génétiques animales/Recursos genéticos
animales, 48, 1-11.
Lanyasunya, T.P., Rong, W. H., Abdulrazak, S.A., Kaburu, P.K., Makori, J.O., Onyango,
T.A. & Mwangi D.M. 2006. Factors Limiting Use of Poultry Manure as Protein Supplement for Dairy
Cattle on Smallholder Farms in Kenya. International Journal of Poultry Science 5 (1): 75-80, 2006. ISSN
1682-8356 © Asian Network for Scientific Information, 2006
Magothe, T.M., Okeno, T.O., Muhuyi, W.B. & Kahi, A.K. 2015. Indigenous chicken production
in Kenya: Current status. World's Poultry Science Journal · March 2012. DOI:
10.1017/S0043933912000128
Nassuima, D. & Nyoike N. 2014. Milk production and marketing in Kenya: a Preliminary survey
report 2013.
Njenga, S.K. 2005. Production and socio-cultural aspects of local poultry phenotypes in coastal Kenya. MSc
Thesis, Danish Institute of Agricultural Sciences, Tjele, Denmark.
Okitoi, L.O., Ondwasy, H.O., Obali, M., Linyonyi, A., Mulamula, H., Otieno, K.,
Murekefu, F., Soita, J., Ndege, J., Kahai, R., Rotich, D. & Wekesa, A. 2000. An appraisal of
local poultry production in western Kenya, in: De Jong, R. & Mukisira, E.A. (Eds) Testing of Livestock
technologies on smallholder mixed farms in Kenya, pp. 157-178 (Nairobi, Kenya Agricultural Research
Institute).
Otieno, D. J., Hubbard, L. & Ruto, E. 2012. Determinants of technical efficiency in beef cattle production
in Kenya. In Selected Paper prepared for presentation at the International Association of
Agricultural Economists (IAAE) Triennial Conference (pp. 18-24).
Oxfarm international. 2008. Climate Wrongs and Human Rights Putting people at the heart of climate-
change policy. Oxfarm briefing paper. https://www.oxfam.org/sites/www.oxfam.org/files/bp117-
climate-wrongs-and-human-rights-0809.pdf.
SDP. 2004. The Demand for Dairy Products in Kenya. Small-holder Dairy Project. Retrieved
http://cgspace.cgiar.org/handle/10568/1915.
USAID. 2012. End market analysis of Kenyan livestock and meat: A desk study.
https://microlinks.org/sites/microlinks/files/resource/files/Kenya_Livestock_End_Market_St
udy.pdf

© FAO, 2018I8978EN/1/05.18