ieua wastewater facilities master plan tm 3 regional · pdf fileieua wastewater facilities...
TRANSCRIPT
1
D R A F T T E C H N I C A L M E M O R A N D U M
IEUA Wastewater Facilities Master Plan TM 3 Regional Trunk Sewer Analysis PREPARED FOR: Inland Empire Utilities Agency
PREPARED BY: Carollo Engineers, Inc.
REVIEWED BY: CH2M HILL
DATE: August 18, 2014
Executive Summary In accordance with the goals of the master planning effort, the Consultant Team evaluated the capacity of IEUA’s collection system and developed flow diversion alternatives to optimize the use of recycled water within the service area for groundwater recharge. To achieve this goal, four flow diversion alternatives were developed as part of the WFMP that would allow IEUA to optimize recharge groundwater opportunities in the north.
As part of this analysis, the Consultant Team updated the IEUA collection system hydraulic model. This updated model was used to conduct an evaluation of the regional trunk sewer system under existing and projected future flow conditions. Results of the analysis indicate that IEUA’s collection system generally maintains adequate capacity to convey peak flows. However, capacity limitations were identified in the Montclair pipeline reach that conveys flow to RP‐1 from the Montclair diversion structure.
Flow diversion alternatives were evaluated using both monetary and non‐monetary evaluation criteria and a benefit‐cost analysis to identify the most suitable alternative for meeting IEUA’s objectives. Alternative 2, which utilizes the existing Whispering Lakes and Haven Pump Stations to divert flows from RP‐5 to RP‐1 was identified as IEUA’s preferred flow diversion alternative because it has a lower capital cost, is easier to implement and provides a relatively high benefit related to diverting additional flows to RP‐1 for groundwater recharge. Alternative 2 also provides flexibility in that flows could still be conveyed to RP‐5 by gravity should the need arise.
1.0 Background and Objectives The Inland Empire Utilities Agency (IEUA) contracted with CH2M HILL and Carollo Engineers (Consultant Team) to develop a Wastewater Facilities Master Plan (WFMP). The objective of the WFMP is to plan IEUA’s wastewater treatment and conveyance improvements and develop a capital program. The capital program will guide IEUA in the development of major improvements to their treatment and conveyance facilities.
As part of the WFMP effort, the Consultant Team worked with IEUA to develop a series of flow diversion alternatives. The diversion alternatives were developed as a way to convey wastewater to Reclamation Plant (RP)‐1 in an effort to maximize groundwater recharge opportunities in the northern portions of IEUA’s service area. The flow diversion alternatives are described in Technical Memorandum (TM) No. 2. In conjunction with the analysis of the diversion alternatives, IEUA’s existing conveyance system was evaluated to determine its ability to convey current and projected flows based on specified evaluation criteria. The purpose of this TM 3 is to summarize the analysis of IEUA’s conveyance system and the results of the evaluation of the flow diversion alternatives presented in TM 2.
DRAFT
IEUA WASTEWATER FACILITIES MASTER PLAN TM 3 REGIONAL TRUNK SEWER ANALYSIS
2
2.0 Evaluation and Planning Criteria Evaluation criteria were established as a means to provide a framework for the analysis of the conveyance system and the evaluation of the flow diversion alternatives. The evaluation included the criteria to evaluate the collection system using the hydraulic model and the criteria used to evaluate the flow diversion alternatives. The evaluation of the flow diversion alternatives used a qualitative non‐monetary approach called the Simple Multi‐Attribute Rating Technique (SMART). The conveyance system criteria and the SMART system are summarized in this section of TM 3.
2.1 Collection System Evaluation Criteria 2.1.1 Gravity Conveyance System Gravity sewer pipe capacities are dependent on many factors. The factors include roughness of the pipe, the chosen maximum allowable depth of flow downstream, and limiting velocity and slope. The following sections describe the factors that account for the determination of existing and future pipeline capacities in IEUA’s collection system.
ManningCoefficient(n)The manning coefficient 'n' is a friction coefficient that varies with respect to pipe material, size of pipe, depth of flow, smoothness of joints, root intrusion, and other factors. For sewer pipes, the manning coefficient typically ranges between 0.011 and 0.017, with 0.013 being a representative value used for system planning purposes. For this study, a manning “n” factor of 0.013 was assigned to all existing sewer collection system lines in the hydraulic model, and then refined as necessary during model verification to accurately simulate field measured levels and velocities.
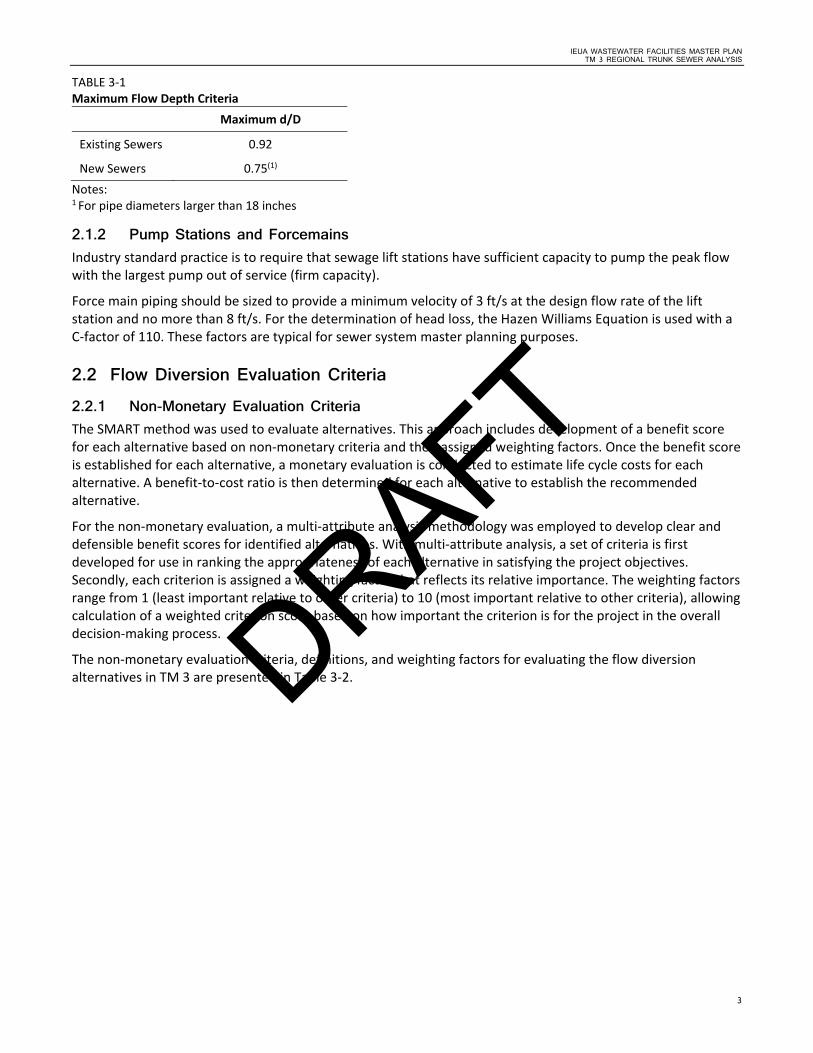
PeakFlowCriteriaThe primary criteria used to identify capacity deficient sewers or to size new sewer improvements is the maximum flow depth to pipe diameter ratio (d/D). The d/D value is defined as the depth of flow (d) in a pipe during peak (design) flow conditions divided by the pipe’s diameter (D). Based on the Consultant Team’s experience, IEUA staff input, and industry standards, the following criteria were used and are summarized in Table 3‐1 for existing and new sewers:
Flow Depth for Existing Sewers. Peak flow criteria for existing sanitary sewers are established based on a number of factors, including the acceptable risk tolerance of the utility, local standards and codes, and other factors. Using a conservative criterion for evaluating existing sewers may lead to unnecessary replacement of existing pipelines. Conversely, a lenient criterion could increase the risk of sanitary sewer overflows (SSOs). Ultimately, the maximum allowable peak flow criterion should be established to be as cost effective as possible while at the same time reducing the risk of SSOs to the greatest extent possible.
For IEUA, it was decided that a maximum d/D ratio of 0.92 would be used to identify capacity deficient sewers.
Flow Depth for New Sewers. When designing sewer pipelines, it is common practice to adopt variable flow depth criteria for various pipe sizes. Design d/D ratios typically range from 0.5 to 0.92, with the lower values typically used for smaller pipes, which may experience flow peaks greater than design flow or blockages from debris, paper, or rags. Since IEUA collects wastewater flow from multiple agencies, IEUA’s collection system primarily consists of larger diameter interceptors (i.e., greater than 18 inches in diameter). Therefore, sewer interceptor projects will be sized to a d/D of 0.75.
DRAFT
IEUA WASTEWATER FACILITIES MASTER PLAN TM 3 REGIONAL TRUNK SEWER ANALYSIS
3
TABLE 3‐1 Maximum Flow Depth Criteria
Maximum d/D
Existing Sewers 0.92
New Sewers 0.75(1)
Notes: 1 For pipe diameters larger than 18 inches
2.1.2 Pump Stations and Forcemains Industry standard practice is to require that sewage lift stations have sufficient capacity to pump the peak flow with the largest pump out of service (firm capacity).
Force main piping should be sized to provide a minimum velocity of 3 ft/s at the design flow rate of the lift station and no more than 8 ft/s. For the determination of head loss, the Hazen Williams Equation is used with a C‐factor of 110. These factors are typical for sewer system master planning purposes.
2.2 Flow Diversion Evaluation Criteria 2.2.1 Non-Monetary Evaluation Criteria The SMART method was used to evaluate alternatives. This approach includes development of a benefit score for each alternative based on non‐monetary criteria and their assigned weighting factors. Once the benefit score is established for each alternative, a monetary evaluation is conducted to estimate life cycle costs for each alternative. A benefit‐to‐cost ratio is then determined for each alternative to establish the recommended alternative.
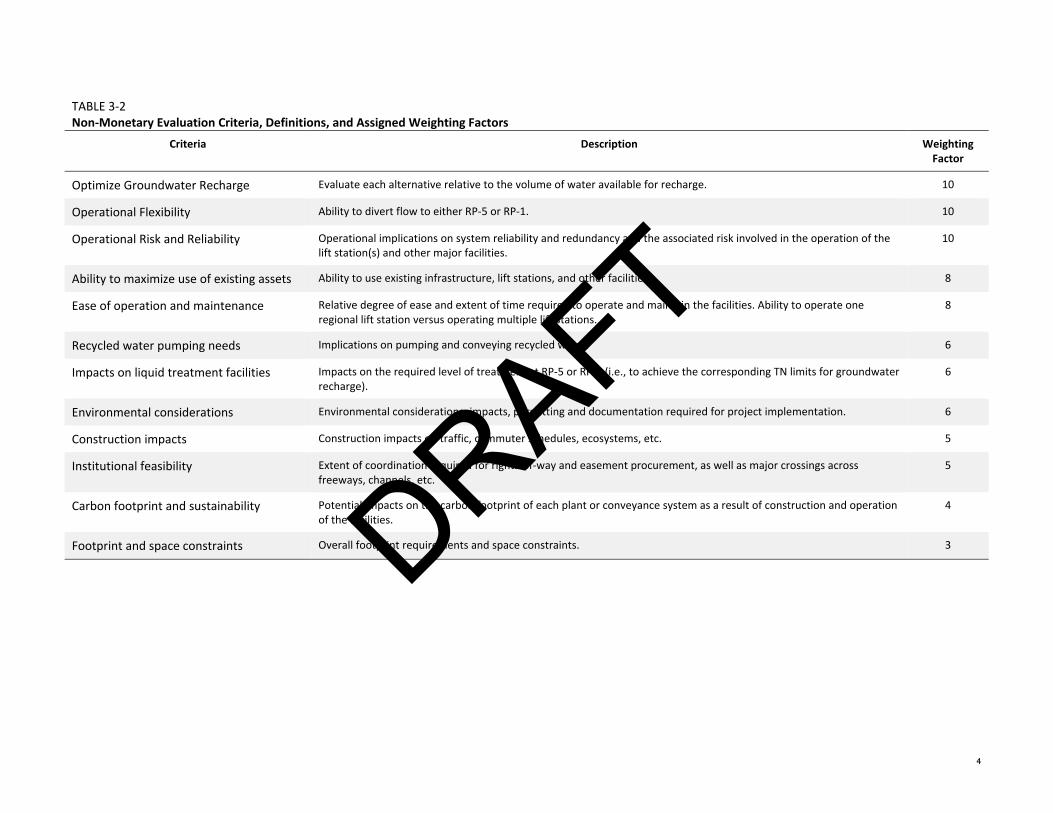
For the non‐monetary evaluation, a multi‐attribute analysis methodology was employed to develop clear and defensible benefit scores for identified alternatives. With multi‐attribute analysis, a set of criteria is first developed for use in ranking the appropriateness of each alternative in satisfying the project objectives. Secondly, each criterion is assigned a weighting factor that reflects its relative importance. The weighting factors range from 1 (least important relative to other criteria) to 10 (most important relative to other criteria), allowing calculation of a weighted criterion score based on how important the criterion is for the project in the overall decision‐making process.
The non‐monetary evaluation criteria, definitions, and weighting factors for evaluating the flow diversion alternatives in TM 3 are presented in Table 3‐2. DRAFT
4
TABLE 3‐2 Non‐Monetary Evaluation Criteria, Definitions, and Assigned Weighting Factors
Criteria Description Weighting Factor
Optimize Groundwater Recharge Evaluate each alternative relative to the volume of water available for recharge. 10
Operational Flexibility Ability to divert flow to either RP‐5 or RP‐1. 10
Operational Risk and Reliability Operational implications on system reliability and redundancy and the associated risk involved in the operation of the lift station(s) and other major facilities.
10
Ability to maximize use of existing assets Ability to use existing infrastructure, lift stations, and other facilities. 8
Ease of operation and maintenance Relative degree of ease and extent of time required to operate and maintain the facilities. Ability to operate one regional lift station versus operating multiple lift stations.
8
Recycled water pumping needs Implications on pumping and conveying recycled water. 6
Impacts on liquid treatment facilities Impacts on the required level of treatment at RP‐5 or RP‐1 (i.e., to achieve the corresponding TN limits for groundwater recharge).
6
Environmental considerations Environmental considerations, impacts, permitting and documentation required for project implementation. 6
Construction impacts Construction impacts on traffic, commuter schedules, ecosystems, etc. 5
Institutional feasibility Extent of coordination required for rights‐of‐way and easement procurement, as well as major crossings across freeways, channels, etc.
5
Carbon footprint and sustainability Potential impacts on the carbon footprint of each plant or conveyance system as a result of construction and operation of the facilities.
4
Footprint and space constraints Overall footprint requirements and space constraints. 3
DRAFT
IEUA WASTEWATER FACILITIES MASTER PLAN TM 3 REGIONAL TRUNK SEWER ANALYSIS
5
3.0 Evaluation of Existing Collection System The hydraulic model developed for the WFMP was used to conduct an analysis of the capacity of IEUA’s existing conveyance system. The analysis was conducted under the peak flow scenario.
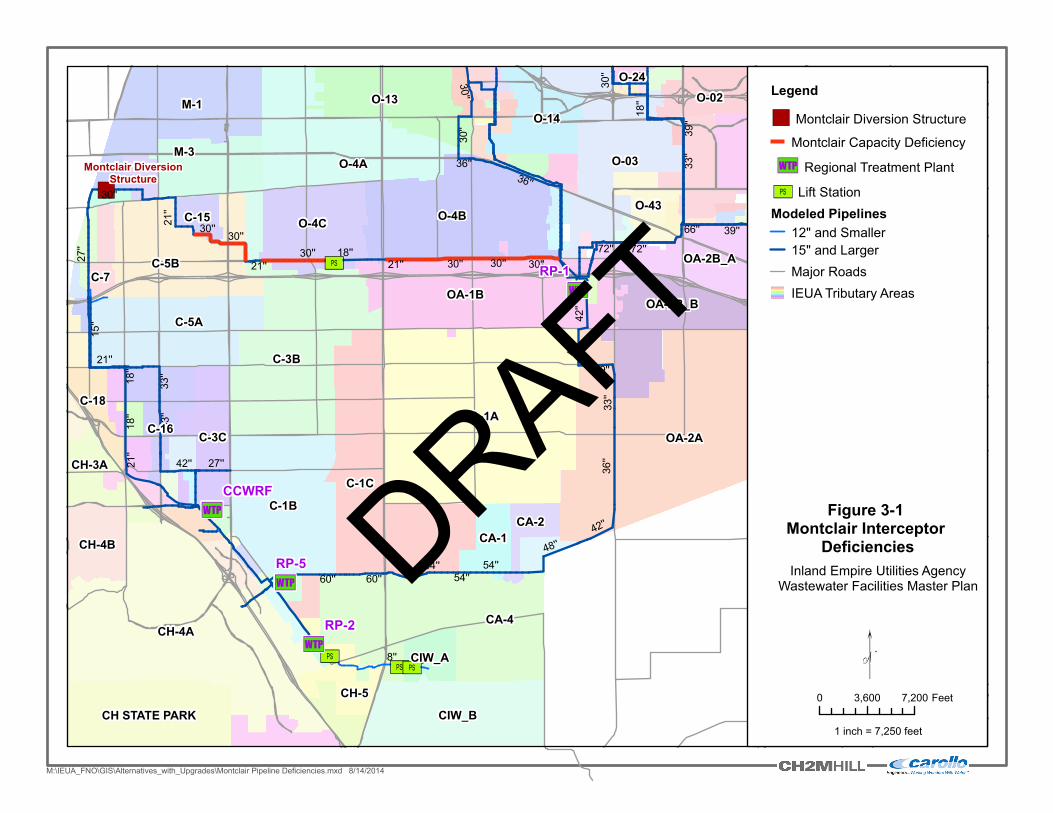
In general, IEUA’s collection system has adequate capacity to convey peak wastewater flows. The one facility that is currently lacking adequate capacity to convey existing flows is the 30‐inch pipeline downstream of the Montclair diversion. The sections of pipeline that are currently deficient are illustrated on Figure 3‐1.
The deficient reach of the Montclair pipeline includes approximately 24,000 linear feet of 36‐inch diameter sewer. The hydraulic model was run under future system conditions as part of the analysis of the diversion alternatives discussed in the following sections of this memorandum. It was determined that in order to mitigate the capacity deficiencies the pipeline would need to be upsized to a 36‐inch diameter sewer to convey peak buildout flows.
It is recommended that IEUA staff conduct further flow monitoring of this reach of pipeline to determine the extent of the deficiency. IEUA staff should conduct a focused flow monitoring effort on this reach to develop a clear picture of the flow conditions during peak flow periods to verify the modeling results and help size the pipeline during preliminary and final design of mitigation alternatives. While upsizing the pipeline is a viable alternative, other options may exist such as constructing parallel reaches of conveyance trunk lines.
4.0 Evaluation of Flow Diversion Alternatives One of the goals of the WFMP is to plan the efficient use of IEUA’s wastewater treatment plants and optimize the use of recycled water within IEUA’s service area for groundwater recharge. One of the tasks in the project is to develop and evaluate flow diversion alternatives given an understanding of the constraints and goals of the treatment evaluations and plans for RWRP expansion. For instance, consideration of treatment plant expansions at RP‐1 and RP‐5 took into account nitrogen concentration limits at the groundwater recharge basin and the treatment plants.
Per the Waste Discharge Order No. R8‐2009‐0021 (NPDES No. CA8000409) and Water Recycling Order No. R8‐2007‐0039 (and subsequent amendments), the 12‐month flow weighted running average Total Inorganic Nitrogen (TIN) concentration shall not exceed 8 mg/L. This limitation may be met on an agency‐wide basis using flow weighted averages of discharges from RP‐1, RP‐4, RP‐5, and CCWRF. Per the CDPH regulations for groundwater recharge and in accordance with Water Recycling Order No. R8‐2007‐0039, Total Nitrogen (TN) concentration of the recycled water used for recharge prior to reaching the regional groundwater table must not exceed 5 mg/L. The organic nitrogen content in plant effluent is typically in the range of 1.5 to 2.0 mg/L. Therefore, a plant effluent TIN of 8 mg/L corresponds to a TN of about 9.5 to 10 mg/L at the basins. In comparison, a plant effluent TIN of 5 mg/L corresponds to a TN of about 6.5 to 7 mg/L at the basins. To be conservative, this analysis assumes a plant effluent TIN of 5 mg/L for recharge. Therefore, RP‐1 expansion needs are based on a plant effluent TIN of 5 mg/L. Similarly, for Alternatives 4A and 4B where flow from RP‐5 is pumped to the north for groundwater recharge, the RP‐5 expansion needs are based on a plant effluent TIN of 5 mg/L, reducing the overall plant capacity and causing expansions to occur sooner. For the capacity analysis of each RWRP in later TMs, capacities will be developed based on the permitted plant effluent TIN of 8 mg/L as confirmed by IEUA.
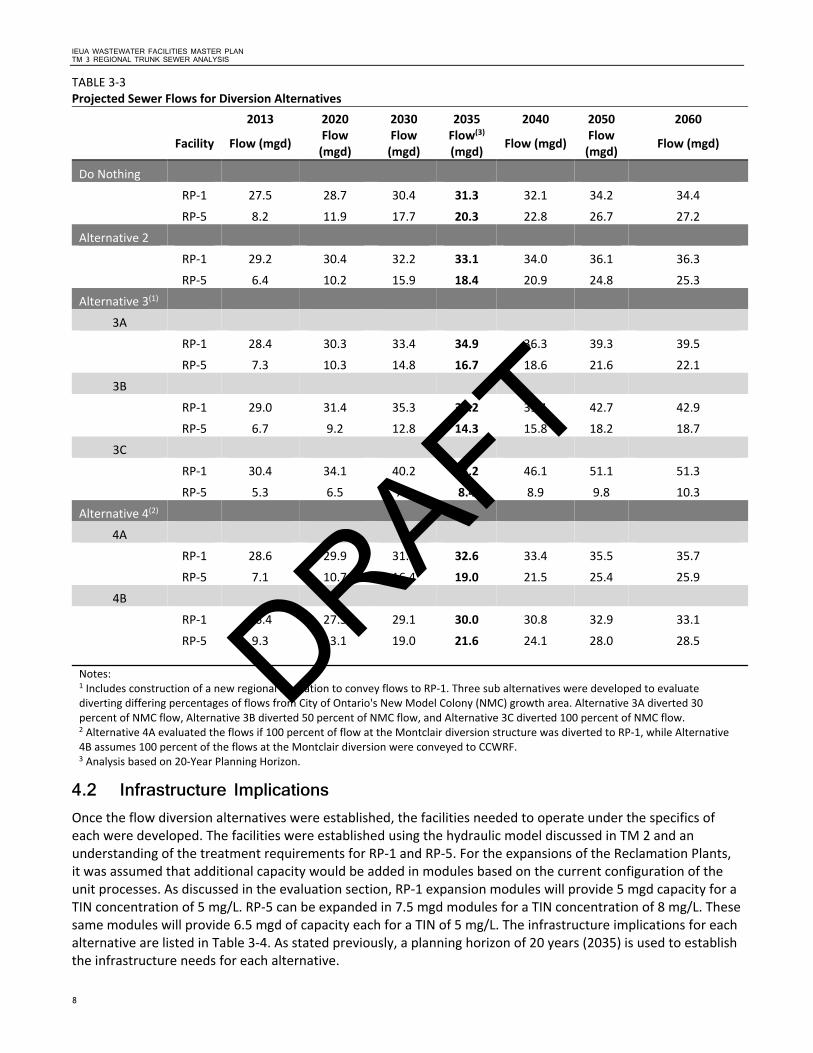
This section provides a summary of the proposed flow diversion alternatives, and details the results of the non‐monetary evaluation of the flow diversion alternatives. The flow diversion alternatives are described in detail in Technical Memorandum TM 2 and are summarized below. The analysis is based on a planning horizon of 20 years (2035), which is then used to establish the infrastructure needs for each alternative. The flows diverted in each alternative are summarized in Table 3‐3.
DRAFT
[Ú[Ú
[Ú
[Ú
3Q
3Q
3Q
3Q
")
Montclair DiversionStructure
48''
72''
33''
24' '
42''
15''
2 7''
60''
66''
8''
78''
30''
18''
54''
10''
36''
39''
21'' 30''
21''
36''
18''
27''
60''
66''
21''
33''
42''
54''
30''
36''
18''
33''39''
30''
21''
30''30''
33''
54''
33''
27'' 30''
24''
42''
33''
48''
21''
54''
30''72''
39''
33''
54''
18''
36'' 78''30''
42''
30''
RP-5
RP-2
RP-1
OA-1A
CH-4A
OA-2A
CA-4
C-1C
C-3B
O-4B
M-1
C-1B
O-4A
OA-1B
O-03
C-5B
C-5A
O-13
O-46
CIW_B
O-4C
M-3
OA-2B_A
O-14
O-02
F-12FT
C-3C
O-26
OA-2B_B
C-16
F-6
CH-5
CH-4B
CH STATE PARK
CH-3A
F-13
O-43
CA-1
C-18
C-7
F-5A
CA-2
CW-08
O-19
CIW_A
C-15
O-24
CCWRF
Legend
") Montclair Diversion Structure
Montclair Capacity Deficiency
3Q Regional Treatment Plant
[Ú Lift StationModeled Pipelines
12" and Smaller15" and LargerMajor RoadsIEUA Tributary Areas
M:\IEUA_FNO\GIS\Alternatives_with_Upgrades\Montclair Pipeline Deficiencies.mxd 8/14/2014
Figure 3-1 Montclair Interceptor
DeficienciesInland Empire Utilities Agency
Wastewater Facilities Master Plan
0 3,600 7,200 Feet
"1 inch = 7,250 feet
DRAFT
IEUA WASTEWATER FACILITIES MASTER PLAN TM 3 REGIONAL TRUNK SEWER ANALYSIS
7
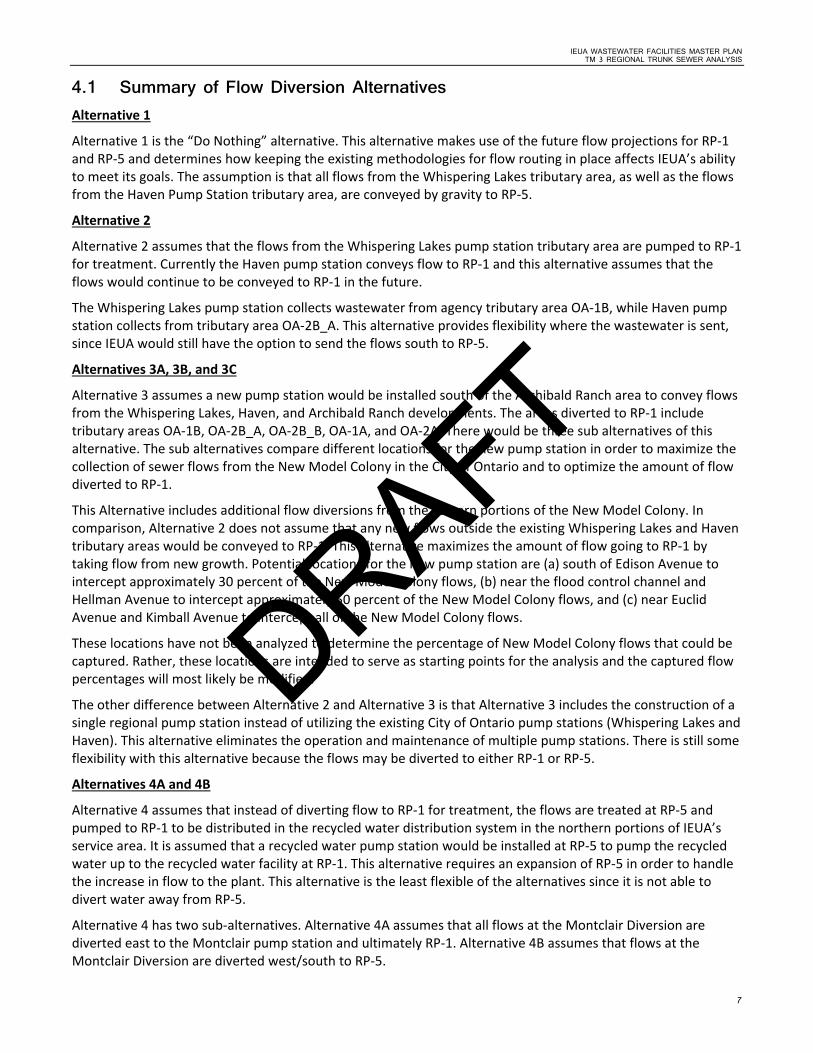
4.1 Summary of Flow Diversion Alternatives Alternative 1
Alternative 1 is the “Do Nothing” alternative. This alternative makes use of the future flow projections for RP‐1 and RP‐5 and determines how keeping the existing methodologies for flow routing in place affects IEUA’s ability to meet its goals. The assumption is that all flows from the Whispering Lakes tributary area, as well as the flows from the Haven Pump Station tributary area, are conveyed by gravity to RP‐5.
Alternative 2
Alternative 2 assumes that the flows from the Whispering Lakes pump station tributary area are pumped to RP‐1 for treatment. Currently the Haven pump station conveys flow to RP‐1 and this alternative assumes that the flows would continue to be conveyed to RP‐1 in the future.
The Whispering Lakes pump station collects wastewater from agency tributary area OA‐1B, while Haven pump station collects from tributary area OA‐2B_A. This alternative provides flexibility where the wastewater is sent, since IEUA would still have the option to send the flows south to RP‐5.
Alternatives 3A, 3B, and 3C
Alternative 3 assumes a new pump station would be installed south of the Archibald Ranch area to convey flows from the Whispering Lakes, Haven, and Archibald Ranch developments. The areas diverted to RP‐1 include tributary areas OA‐1B, OA‐2B_A, OA‐2B_B, OA‐1A, and OA‐2A. There would be three sub alternatives of this alternative. The sub alternatives compare different locations for the new pump station in order to maximize the collection of sewer flows from the New Model Colony in the City of Ontario and to optimize the amount of flow diverted to RP‐1.
This Alternative includes additional flow diversions from the eastern portions of the New Model Colony. In comparison, Alternative 2 does not assume that any new flows outside the existing Whispering Lakes and Haven tributary areas would be conveyed to RP‐1. This alternative maximizes the amount of flow going to RP‐1 by taking flow from new growth. Potential locations for the new pump station are (a) south of Edison Avenue to intercept approximately 30 percent of the New Model Colony flows, (b) near the flood control channel and Hellman Avenue to intercept approximately 50 percent of the New Model Colony flows, and (c) near Euclid Avenue and Kimball Avenue to intercept all of the New Model Colony flows.
These locations have not been analyzed to determine the percentage of New Model Colony flows that could be captured. Rather, these locations are intended to serve as starting points for the analysis and the captured flow percentages will most likely be modified.
The other difference between Alternative 2 and Alternative 3 is that Alternative 3 includes the construction of a single regional pump station instead of utilizing the existing City of Ontario pump stations (Whispering Lakes and Haven). This alternative eliminates the operation and maintenance of multiple pump stations. There is still some flexibility with this alternative because the flows may be diverted to either RP‐1 or RP‐5.
Alternatives 4A and 4B
Alternative 4 assumes that instead of diverting flow to RP‐1 for treatment, the flows are treated at RP‐5 and pumped to RP‐1 to be distributed in the recycled water distribution system in the northern portions of IEUA’s service area. It is assumed that a recycled water pump station would be installed at RP‐5 to pump the recycled water up to the recycled water facility at RP‐1. This alternative requires an expansion of RP‐5 in order to handle the increase in flow to the plant. This alternative is the least flexible of the alternatives since it is not able to divert water away from RP‐5.
Alternative 4 has two sub‐alternatives. Alternative 4A assumes that all flows at the Montclair Diversion are diverted east to the Montclair pump station and ultimately RP‐1. Alternative 4B assumes that flows at the Montclair Diversion are diverted west/south to RP‐5.
DRAFT
IEUA WASTEWATER FACILITIES MASTER PLAN TM 3 REGIONAL TRUNK SEWER ANALYSIS
8
TABLE 3‐3 Projected Sewer Flows for Diversion Alternatives
2013 2020 2030 2035 2040 2050 2060
Facility Flow (mgd) Flow (mgd)
Flow (mgd)
Flow(3)
(mgd) Flow (mgd)
Flow (mgd)
Flow (mgd)
Do Nothing
RP‐1 27.5 28.7 30.4 31.3 32.1 34.2 34.4
RP‐5 8.2 11.9 17.7 20.3 22.8 26.7 27.2
Alternative 2
RP‐1 29.2 30.4 32.2 33.1 34.0 36.1 36.3
RP‐5 6.4 10.2 15.9 18.4 20.9 24.8 25.3
Alternative 3(1)
3A
RP‐1 28.4 30.3 33.4 34.9 36.3 39.3 39.5
RP‐5 7.3 10.3 14.8 16.7 18.6 21.6 22.1
3B
RP‐1 29.0 31.4 35.3 37.2 39.1 42.7 42.9
RP‐5 6.7 9.2 12.8 14.3 15.8 18.2 18.7
3C
RP‐1 30.4 34.1 40.2 43.2 46.1 51.1 51.3
RP‐5 5.3 6.5 7.9 8.4 8.9 9.8 10.3
Alternative 4(2)
4A
RP‐1 28.6 29.9 31.7 32.6 33.4 35.5 35.7
RP‐5 7.1 10.7 16.4 19.0 21.5 25.4 25.9
4B
RP‐1 26.4 27.5 29.1 30.0 30.8 32.9 33.1
RP‐5 9.3 13.1 19.0 21.6 24.1 28.0 28.5 Notes: 1 Includes construction of a new regional lift station to convey flows to RP‐1. Three sub alternatives were developed to evaluate diverting differing percentages of flows from City of Ontario's New Model Colony (NMC) growth area. Alternative 3A diverted 30 percent of NMC flow, Alternative 3B diverted 50 percent of NMC flow, and Alternative 3C diverted 100 percent of NMC flow. 2 Alternative 4A evaluated the flows if 100 percent of flow at the Montclair diversion structure was diverted to RP‐1, while Alternative 4B assumes 100 percent of the flows at the Montclair diversion were conveyed to CCWRF. 3 Analysis based on 20‐Year Planning Horizon.
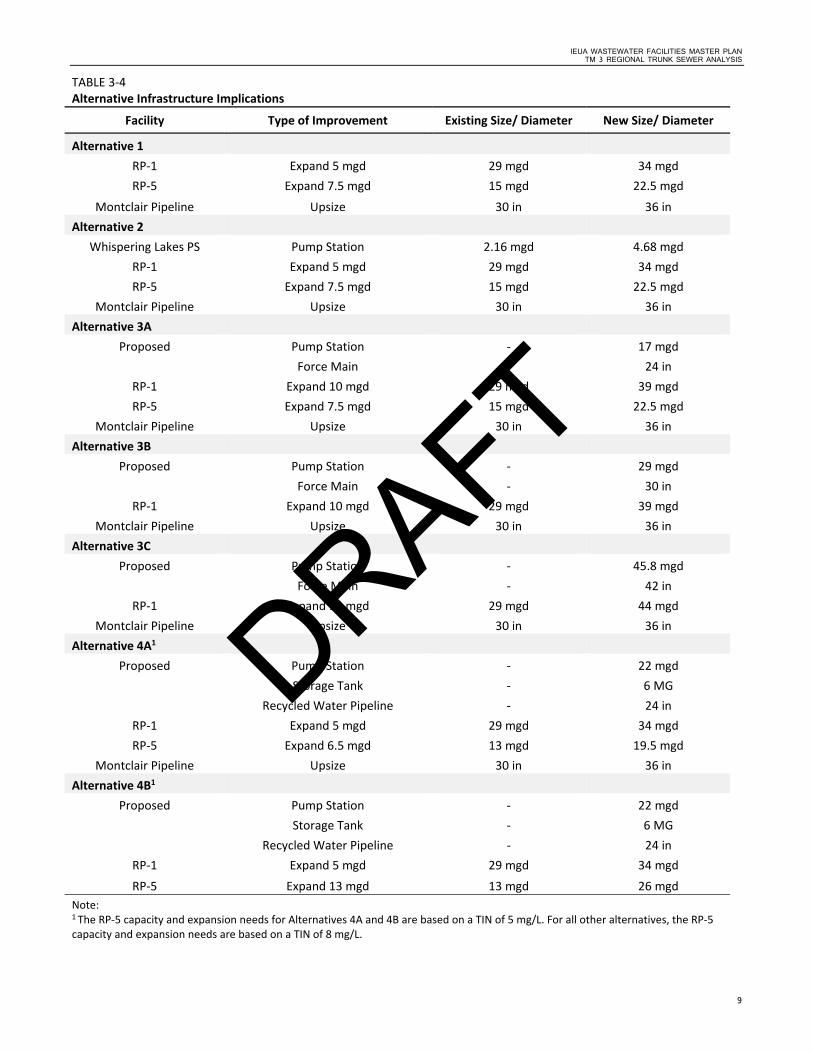
4.2 Infrastructure Implications Once the flow diversion alternatives were established, the facilities needed to operate under the specifics of each were developed. The facilities were established using the hydraulic model discussed in TM 2 and an understanding of the treatment requirements for RP‐1 and RP‐5. For the expansions of the Reclamation Plants, it was assumed that additional capacity would be added in modules based on the current configuration of the unit processes. As discussed in the evaluation section, RP‐1 expansion modules will provide 5 mgd capacity for a TIN concentration of 5 mg/L. RP‐5 can be expanded in 7.5 mgd modules for a TIN concentration of 8 mg/L. These same modules will provide 6.5 mgd of capacity each for a TIN of 5 mg/L. The infrastructure implications for each alternative are listed in Table 3‐4. As stated previously, a planning horizon of 20 years (2035) is used to establish the infrastructure needs for each alternative.
DRAFT
IEUA WASTEWATER FACILITIES MASTER PLAN TM 3 REGIONAL TRUNK SEWER ANALYSIS
9
TABLE 3‐4 Alternative Infrastructure Implications
Facility Type of Improvement Existing Size/ Diameter New Size/ Diameter
Alternative 1
RP‐1 Expand 5 mgd 29 mgd 34 mgd
RP‐5 Expand 7.5 mgd 15 mgd 22.5 mgd
Montclair Pipeline Upsize 30 in 36 in
Alternative 2
Whispering Lakes PS Pump Station 2.16 mgd 4.68 mgd
RP‐1 Expand 5 mgd 29 mgd 34 mgd
RP‐5 Expand 7.5 mgd 15 mgd 22.5 mgd
Montclair Pipeline Upsize 30 in 36 in
Alternative 3A
Proposed Pump Station ‐ 17 mgd
Force Main ‐ 24 in
RP‐1 Expand 10 mgd 29 mgd 39 mgd
RP‐5 Expand 7.5 mgd 15 mgd 22.5 mgd
Montclair Pipeline Upsize 30 in 36 in
Alternative 3B
Proposed Pump Station ‐ 29 mgd
Force Main ‐ 30 in
RP‐1 Expand 10 mgd 29 mgd 39 mgd
Montclair Pipeline Upsize 30 in 36 in
Alternative 3C
Proposed Pump Station ‐ 45.8 mgd
Force Main ‐ 42 in
RP‐1 Expand 15 mgd 29 mgd 44 mgd
Montclair Pipeline Upsize 30 in 36 in
Alternative 4A1
Proposed Pump Station ‐ 22 mgd
Storage Tank ‐ 6 MG
Recycled Water Pipeline ‐ 24 in
RP‐1 Expand 5 mgd 29 mgd 34 mgd
RP‐5 Expand 6.5 mgd 13 mgd 19.5 mgd
Montclair Pipeline Upsize 30 in 36 in
Alternative 4B1
Proposed Pump Station ‐ 22 mgd
Storage Tank ‐ 6 MG
Recycled Water Pipeline ‐ 24 in
RP‐1 Expand 5 mgd 29 mgd 34 mgd
RP‐5 Expand 13 mgd 13 mgd 26 mgd
Note: 1 The RP‐5 capacity and expansion needs for Alternatives 4A and 4B are based on a TIN of 5 mg/L. For all other alternatives, the RP‐5 capacity and expansion needs are based on a TIN of 8 mg/L.
DRAFT
IEUA WASTEWATER FACILITIES MASTER PLAN TM 3 REGIONAL TRUNK SEWER ANALYSIS
10
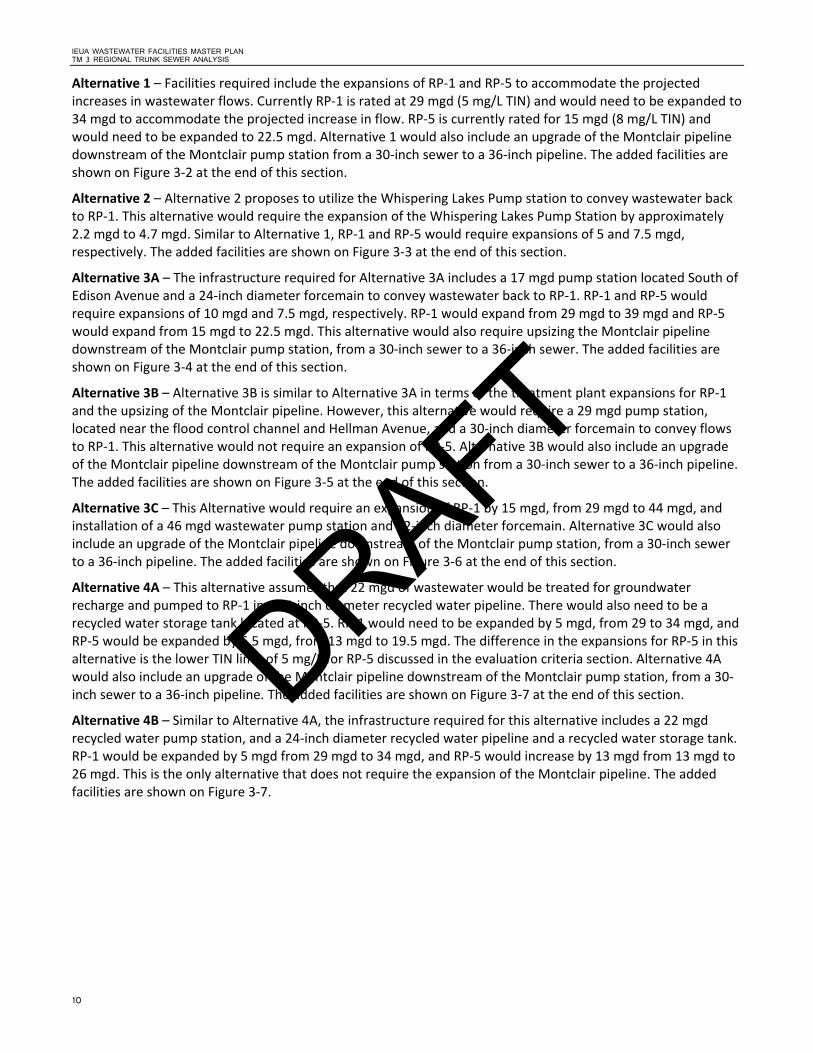
Alternative 1 – Facilities required include the expansions of RP‐1 and RP‐5 to accommodate the projected increases in wastewater flows. Currently RP‐1 is rated at 29 mgd (5 mg/L TIN) and would need to be expanded to 34 mgd to accommodate the projected increase in flow. RP‐5 is currently rated for 15 mgd (8 mg/L TIN) and would need to be expanded to 22.5 mgd. Alternative 1 would also include an upgrade of the Montclair pipeline downstream of the Montclair pump station from a 30‐inch sewer to a 36‐inch pipeline. The added facilities are shown on Figure 3‐2 at the end of this section.
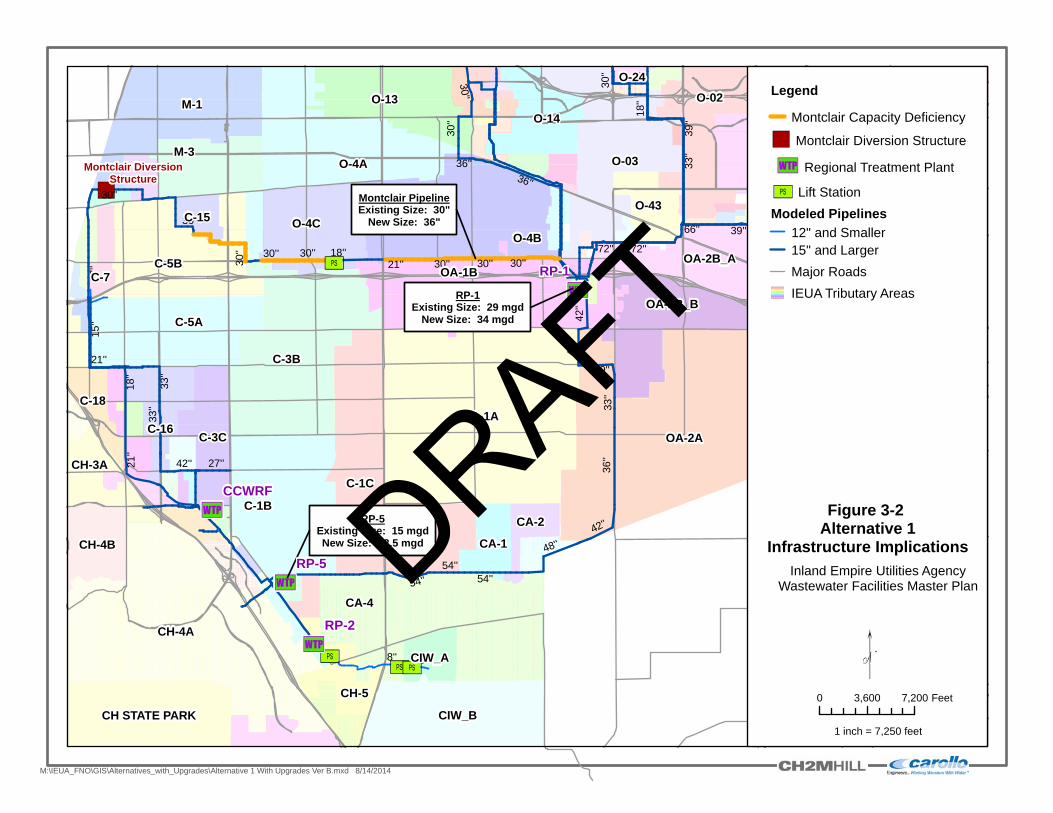
Alternative 2 – Alternative 2 proposes to utilize the Whispering Lakes Pump station to convey wastewater back to RP‐1. This alternative would require the expansion of the Whispering Lakes Pump Station by approximately 2.2 mgd to 4.7 mgd. Similar to Alternative 1, RP‐1 and RP‐5 would require expansions of 5 and 7.5 mgd, respectively. The added facilities are shown on Figure 3‐3 at the end of this section.
Alternative 3A – The infrastructure required for Alternative 3A includes a 17 mgd pump station located South of Edison Avenue and a 24‐inch diameter forcemain to convey wastewater back to RP‐1. RP‐1 and RP‐5 would require expansions of 10 mgd and 7.5 mgd, respectively. RP‐1 would expand from 29 mgd to 39 mgd and RP‐5 would expand from 15 mgd to 22.5 mgd. This alternative would also require upsizing the Montclair pipeline downstream of the Montclair pump station, from a 30‐inch sewer to a 36‐inch sewer. The added facilities are shown on Figure 3‐4 at the end of this section.
Alternative 3B – Alternative 3B is similar to Alternative 3A in terms of the treatment plant expansions for RP‐1 and the upsizing of the Montclair pipeline. However, this alternative would require a 29 mgd pump station, located near the flood control channel and Hellman Avenue, and a 30‐inch diameter forcemain to convey flows to RP‐1. This alternative would not require an expansion of RP‐5. Alternative 3B would also include an upgrade of the Montclair pipeline downstream of the Montclair pump station from a 30‐inch sewer to a 36‐inch pipeline. The added facilities are shown on Figure 3‐5 at the end of this section.
Alternative 3C – This Alternative would require an expansion of RP‐1 by 15 mgd, from 29 mgd to 44 mgd, and installation of a 46 mgd wastewater pump station and 42‐inch diameter forcemain. Alternative 3C would also include an upgrade of the Montclair pipeline downstream of the Montclair pump station, from a 30‐inch sewer to a 36‐inch pipeline. The added facilities are shown on Figure 3‐6 at the end of this section.
Alternative 4A – This alternative assumes that 22 mgd of wastewater would be treated for groundwater recharge and pumped to RP‐1 in a 24‐inch diameter recycled water pipeline. There would also need to be a recycled water storage tank located at RP‐5. RP‐1 would need to be expanded by 5 mgd, from 29 to 34 mgd, and RP‐5 would be expanded by 6.5 mgd, from 13 mgd to 19.5 mgd. The difference in the expansions for RP‐5 in this alternative is the lower TIN limit of 5 mg/L for RP‐5 discussed in the evaluation criteria section. Alternative 4A would also include an upgrade of the Montclair pipeline downstream of the Montclair pump station, from a 30‐inch sewer to a 36‐inch pipeline. The added facilities are shown on Figure 3‐7 at the end of this section.
Alternative 4B – Similar to Alternative 4A, the infrastructure required for this alternative includes a 22 mgd recycled water pump station, and a 24‐inch diameter recycled water pipeline and a recycled water storage tank. RP‐1 would be expanded by 5 mgd from 29 mgd to 34 mgd, and RP‐5 would increase by 13 mgd from 13 mgd to 26 mgd. This is the only alternative that does not require the expansion of the Montclair pipeline. The added facilities are shown on Figure 3‐7.
DRAFT
[Ú[Ú
[Ú
[Ú
3Q
3Q
3Q
3Q
")
Montclair DiversionStructure
Montclair PipelineExisting Size: 30"
New Size: 36"
RP-1Existing Size: 29 mgd
New Size: 34 mgd
RP-5Existing Size: 15 mgdNew Size: 22.5 mgd
48''
72''
33''
24' '
42''
15''
2 7''
66''
8''
78''
30''
18''
54''
10''
36''
39''
21''
33''
36'' 33''
36''
30''
54''
18''
21''
21''
30''
39''
36''
39''
27''
42''
42''
33''
54''
30''30''
36''
30''
30''33''
33''
48''
30''
30''18''
78''
27''
33''
30''
24''
3 0''
36''
54''
72''
42''
54''
RP-2
RP-1
OA-1A
CH-4A
OA-2A
CA-4
C-1C
C-3B
O-4B
M-1
C-1B
O-4A
OA-1B
O-03
C-5B
C-5A
O-13
O-46
CIW_B
O-4C
M-3
OA-2B_A
O-14
O-02
F-12FT
C-3C
O-26
OA-2B_B
C-16
F-6
CH-5
CH-4B
CH STATE PARK
CH-3A
F-13
O-43
CA-1
C-18
C-7
F-5A
CA-2
CW-08
O-19
CIW_A
C-15
O-24
RP-5
CCWRF
Legend
Montclair Capacity Deficiency
") Montclair Diversion Structure
3Q Regional Treatment Plant
[Ú Lift Station
Modeled Pipelines
12" and Smaller15" and Larger
Major Roads
IEUA Tributary Areas
M:\IEUA_FNO\GIS\Alternatives_with_Upgrades\Alternative 1 With Upgrades Ver B.mxd 8/14/2014
Figure 3-2 Alternative 1
Infrastructure Implications
Inland Empire Utilities AgencyWastewater Facilities Master Plan
0 3,600 7,200 Feet
"1 inch = 7,250 feet
DRAFT
[Ú[Ú
[Ú
[Ú
3Q
3Q
3Q
3Q
")
XÚ
XÚ
Montclair DiversionStructure
Montclair PipelineExisting Size: 30"
New Size: 36"
RP-1Existing Size: 29 mgd
New Size: 34 mgd
RP-5Existing Size: 15 mgdNew Size: 22.5 mgd
Whispering Lakes PSExisting Size: 2.16 mgd
New Size: 4.68 mgd
Whispering Lakes PS
Haven PS
I 15
I 10
Mission Blvd
Riverside Dr
Chino Ave
Holt Blvd
Stat
e H
wy
83
Cen
tral A
ve
Gro
ve A
ve
E tiw
anda
Av e
State Hwy 71 S
tate
Hw
y 31
Edison Ave
Schaefer Ave
Jurupa St
Mou
ntai
n Av
e
Pine Ave
Ram
ona
Ave
6th St
Bai
n St
Hav
en A
ve
Limonite Ave
Arc
hiba
ld S
t
Airport Dr
Arch
ibal
d Av
e
Eucalyptus Ave
Bellegrave Ave
Phillips Blvd
Trot
h S
t
G St
Mill
iken
Ave
El Prado Rd
Pip
elin
e Av
e
Hel
lman
Ave
54th St
50th St
Cloverdale Rd
Norco Dr
Slover Ave
Valley Blvd
Merrill Ave
Jurupa Ave
Van Buren Blvd
Citrus St
Arlington Ave
Cal
iforn
ia A
ve
68th St
Mills
Ave
State Hwy 142
Har
rison
Ave
D St
State Hwy 71
Pip
elin
e Av
e
Edison Ave
I 15
Riverside Dr
Milli
k en
Ave
Sta
te H
wy
83
Cen
tral A
ve
Jurupa St
Ram
ona
Ave
Bai
n S
t
Holt Blvd
48''
72''
33''
24' '
42''
27''
66''
8''
30''
18''
54''
10''
36''
39''
21''
27''
36''
54''
27''
33''
33''
30''
39''
30''
21''
33''
21''
30''
33''
30''
36''
30''
54''
33''
30''
24''
27''
42''
48''
30''
72''
42''
36''30''
36''
RP-2
RP-1
OA-1A
CH-4A
OA-2A
CA-4
C-1C
C-3B
O-4B
M-1
C-1B
O-4A
OA-1B
O-03
C-5B
C-5A
O-13
O-46
CIW_B
M-3
OA-2B_A
O-14
O-02
F-12FTO-26
F-6
CH-5
CH STATE PARK
F-13
CA-1
C-7
F-5A
CA-2
O-19
CIW_A
O-24
RP-5
CCWRF
Legend
[Ú Existing Lift StationAlternative 2 PipelinesMontclair Capacity Deficiency
") Montclair Diversion Structure
3Q Regional Treatment Plant
[Ú Lift StationModeled Pipelines
12" and Smaller15" and LargerMajor RoadsIEUA Tributary Areas
M:\IEUA_FNO\GIS\Alternatives_with_Upgrades\Alternative 2 With Upgrades Ver B.mxd 8/14/2014
Figure 3-3Alternative 2
Infrastructure ImplicationsInland Empire Utilities Agency
Wastewater Facilities Master Plan
0 3,600 7,200 Feet
"1 inch = 7,250 feet
DRAFT
[Ú[Ú
[Ú
[Ú
[Ú
3Q
3Q
3Q
3Q
")
XÚ
Montclair DiversionStructure
Montclair PipelineExisting Size: 30"
New Size: 36"
RP-1Existing Size: 29 mgd
New Size: 39 mgd
RP-5Existing Size: 15 mgdNew Size: 22.5 mgd
24" Force Main
17 mgd Lift Station
OA-2B_AI 15
I 10
4th St
Mission Blvd
Riverside Dr
Chino Ave
Holt BlvdSta
te H
wy
83
Ce n
t ral A
ve
State Hwy 71
Etiw
anda
Ave
Gro
ve A
ve
Sta
te H
wy
31
Edison Ave
Mou
ntai
n Av
e
Schaefer Ave
Jurupa St
Pey
ton
Dr
Pine Ave
5th St
Phillips Blvd
Hav
en A
ve
Ram
ona
Ave
Limonite Ave
6th St
Arc
hiba
ld S
t
Bain
St
Bellegrave Ave
Airport Dr
Arc
hiba
ld A
ve
Eucalyptus Ave
Trot
h S
t
Holt Ave
G StTo
wne
Ave
Res
ervo
ir S
t
Mill
iken
Ave
Philadelphia St
Pip
elin
e Av
e
Grand Ave
Phillips St
Jurupa Rd
Slover Ave
Valley Blvd
Jurupa Ave
Hel
lman
Ave
Van Buren Blvd
Bea
ch S
t
Norco Dr
Mills
Ave
50th St
Cloverdale Rd
Arlington Ave
Citrus St
Cal
iforn
ia A
ve
68th St
San Bernardino Ave
Har
rison
Ave
Ram
ona
Ave
Holt Blvd
I 10
Cen
tral A
ve
Mission Blvd
Holt Ave
I 15
Mission Blvd
4th St
Edison Ave
Jurupa St
Bai
n S
t
Riverside Dr
Pip
elin
e Av
e
48''
72''
33''
24''
42''
27' '
66''
8''
30''
54''
10''
36''
21''
33''
24' '
27''
48''
33''
30''
30''
30''
42''
33''
27'' 30''
36''
54''
33''
21''
42''
36''
RP-2
RP-1
CH-4A
OA-1A
OA-2A
M-1
CA-4
C-1C
C-3B
O-4B
O-4AO-03
CIW_B
C-1B
OA-1B
O-13
C-5B
CH-3A
C-5A
O-46
O-4C
M-3
O-02
CH STATE PARK
F-12FT
OA-2B_A
O-14
CH-7
O-26
OA-2B_B
CH-4B
F-6
CH-5
F-5A
F-13
O-43
CA-1
C-18
C-1N
CA-2
O-19
CIW_A
O-24
RP-5
CCWRF
Legend
[Ú Proposed Lift StationAlternative 3A PipelineMontclair Capacity Deficiency
") Montclair Diversion Structure
3Q Regional Treatment Plant
[Ú Lift StationModeled Pipelines
12" and Smaller15" and LargerMajor RoadsIEUA Tributary Areas
M:\IEUA_FNO\GIS\Alternatives_with_Upgrades\Alternative 3A With Upgrades Ver B.mxd 8/14/2014
Figure 3-4Alternative 3A
Infrastructure ImplicationsInland Empire Utilities Agency
Wastewater Facilities Master Plan
0 3,000 6,000 Feet
"1 inch = 8,123.13 feet
DRAFT
[Ú
[Ú[Ú
[Ú
[Ú
3Q
3Q
3Q
Montclair PipelineExisting Size: 30"
New Size: 36"
RP-1Existing Size: 29 mgd
New Size: 39 mgd
30" Force Main
29 mgd Lift Station
I 15
State Hwy 60
Mission Blvd
Riverside Dr
Sta
te H
wy
83
Chino AveG
rove
Ave
Edison Ave
Sta
te H
wy
31
Etiw
and a
Ave
Jurupa St
Pine Ave
Limonite Ave
Mou
ntai
n Av
e
Bellegrave Ave
6th St
Bai
n S
t
Schaefer Ave
Arc
hiba
ld A
veA
rchi
bald
St
Trot
h S
t
Jurupa Rd
Jurupa Ave
Hav
en A
ve
Van Buren Blvd
Arlington Ave
State Hwy 71 B
each
St
54th St
58th St
Cherry Ave
50th St
Cloverdale Rd
Eucalyptus Ave
Mill
iken
Ave
Merrill Ave
Citrus St
Norco Dr
68th St
Fels
par S
t
Cal
iforn
ia A
ve
La Sierra Ave
Chandler St
North Dr
Sta
te H
wy
83
Edison Ave
Bai
n S
t
Mission Blvd
I 15
Riverside Dr
Jurupa St
Mission Blvd
48''
72''
36''
33''
54''
42''
27''
60''
66''
8''
78''
30''
18''
10''
24''
39''
21''
48''
33''
30''
36''
66''
36''
36''
54''
30''
27''
54''
24''
30''
33''
72''
60''
42''
8''
42''
42''
36''
54''
RP-5
RP-2
RP-1
OA-1AOA-2A
CA-4
C-1C
C-3B
O-4B
OA-1B
C-1B
O-4A
O-4C
O-03
OA-2B_A
CIW_B
CH-4A
O-46
OA-2B_B
F-5AF-6
CH-5
O-43
CA-1
O-33A
O-26F-12FT
CA-2
F-A
O-19
F-13
CIW_A
F-3
O-14 O-33B
CA-3
O-48
F-1DTO-17O-15Legend
[Ú Proposed Lift Station
Alternative 3B Pipeline
Montclair Capacity Deficiency
3Q Regional Treatment Plant
[Ú Lift Station
Modeled Pipelines
12" and Smaller15" and Larger
Major Roads
IEUA Tributary Areas
M:\IEUA_FNO\GIS\Alternatives_with_Upgrades\Alternative 3B With Upgrades Ver C.mxd 8/14/2014
Figure 3-5Alternative 3B
Infrastructure Implications
Inland Empire Utilities AgencyWastewater Facilities Master Plan
0 2,500 5,000 Feet
"1 inch = 6,378.85 feet
DRAFT
[Ú
[Ú[Ú
[Ú
[Ú
3Q
3Q
3Q
3Q
42" Force Main
45.8 mgd Lift Station
RP-1Existing Size: 29 mgd
New Size: 44 mgd
Montclair PipelineExisting Size: 30"
New Size: 36"
OA-2B_A
OA-2B_B
I 15
State Hwy 60
Riverside Dr
Chino AveS
tate
Hw
y 83
Cen
tral A
ve
Mission Blvd
Gro
ve A
ve
Edison Ave
Jurupa St
Sta
te H
wy
31
Pine Ave
Schaefer Ave
Mou
ntai
n Av
e
Arc
hiba
ld A
ve
Hav
en A
ve
El Prado Rd
Eucalyptus Ave
Phillips St
State Hwy 71
Arc
hiba
ld S
t
Philadelphia St
Cloverdale Rd Limonite Ave
Bellegrave Ave
Merrill Ave
Citrus St
68th St
Mill
iken
Ave
Phillips Blvd
Vine
yard
Ave
Butterfield Ranch Rd Cle
vela
nd A
v e
Jurupa St
I 15
Edison Ave
Arc
hiba
ld A
ve
Riverside Dr
Cen
tral A
ve
Sta
te H
wy
83
Hav
en A
ve
State Hwy 71
48''
18''
36'' 33''
54''
27''
42''
60''
66''
8''
78''
30''
10''
39''
27''
30''
30''
42''
60''
42''
30''
30''
36'' 36''
30'' 66''
48''
39''
78''
18''
60''36
''
36''
18''30''
RP-5
RP-2
OA-1A
OA-2A
CA-4
C-1C
C-3B
O-4B
C-1B
OA-1B
O-4C
CH-4A
OA-2B_A
OA-2B_B
C-3C
C-5B
O-03
C-5A
O-43
O-4A
CA-1
O-46
CA-2
O-33AO-19
CIW_ACH-5
CA-3
O-48C-15
O-26
O-25
O-33BO-17
RP-1
CCWRF
Legend
[Ú Proposed Lift StationAlternative 3C PipelineMontclair Capacity Deficiency
3Q Regional Treatment Plant
[Ú Lift StationModeled Pipelines
12" and Smaller15" and LargerMajor RoadsIEUA Tributary Areas
M:\IEUA_FNO\GIS\Alternatives_with_Upgrades\Alternative 3C With Upgrades Ver B.mxd 8/14/2014
Figure 3-6Alternative 3C
Infrastructure ImplicationsInland Empire Utilities Agency
Wastewater Facilities Master Plan
0 2,500 5,000 Feet
"1 inch = 5,400 feet
DRAFT
!(
!(
!(
[Ú[Ú
[Ú
[Ú
")
UTXÚ
3Q
3Q
3Q
3Q
Montclair DiversionStructure 4A - Divert 100% of
flow East to RP-1
4B - Divert 100% of flow West to CCWRP
22 mgdRecycled waterpump station
Ex. 930/800 PRV
Euclid Ave
6 MG Recycled waterstorage tank
Montclair Pipeline (4A)Existing Size: 30"
New Size: 36"
24" recycled waterpipeline
RP-1Existing Size: 29 mgd
New Size: 34 mgd
RP-5Existing Size: 13 mgd
New Size: 26 mgd
I 15
I 10
Mission BlvdRiverside Dr
Chino Ave
Holt Blvd
Sta
te H
wy
83
Cen
tral A
ve
State Hwy 71
Etiw
anda
Ave
Sta
te H
wy
31
Edison Ave
Schaefer Ave
Jurupa St
Mou
ntai
n Av
e
Pine Ave
5th St
Pey
ton
Dr
6th St
Arc
hiba
ld S
t
Ram
ona
Ave
Bain
St
Phillips Blvd
Hav
en A
ve
Limonite Ave
Airport Dr
Arc
hiba
ld A
ve
Eucalyptus AveBellegrave Ave
Trot
h S
t
Res
ervo
ir S
t
Mill
iken
Ave
Pip
elin
e Av
e
Philadelphia St
Holt Ave
Norco Dr
54th St
50th St
Cloverdale Rd
Grand Ave
Merrill Ave
Slover Ave
Jurupa Ave
Citrus St
Van Buren Blvd
Cal
iforn
ia A
ve
68th St
Har
r ison
Ave
D St
Edison Ave
Pip
elin
e Av
e
Ram
ona
Ave
I 15
Holt Blvd
Cen
tral A
ve
Jurupa St
Bai
n S
t
Mi l l
i ken
Ave
48''
72''
33''
42''
27''
60''
66''
8''
30''
54''
10''
36''
39''
21''
33''36''
30''
54''
33''
30''30''
42''
33''
30''
30' '
54''
30''
21''
48''42''
33''30
''
27''
36''
39''
36''
72''
RP-2CH-4A
OA-1AOA-2A
CA-4
C-1C
C-3B
O-4B
M-1
C-1B
OA-1B
CIW_B
O-4A
O-03
C-5B
O-46
O-4C
M-3
O-13
OA-2B_A
CH-3A
CH STATE PARKCH-7
O-14 O-26
OA-2B_B
F-12FT
CH-4B
F-6
O-02
CH-5
CA-1
C-1N
CA-2
F-5A
O-19
CIW_A
SARI
RP-5
RP-1
CCWRF
Legend
UT Proposed Storage Tank
[Ú Proposed Lift StationMontclair Capacity Deficiency
!( Potential Terminating Location
") Montclair Diversion Structure
3Q Regional Treatment Plant
[Ú Lift StationModeled Pipelines
12" and Smaller15" and LargerMajor RoadsIEUA Tributary Areas
M:\IEUA_FNO\GIS\Alternatives_with_Upgrades\Alternatives 4A and 4B With Upgrades Ver B.mxd 8/14/2014
Figure 3-7Alternative 4A and 4B
Infrastructure ImplicationsInland Empire Utilities Agency
Wastewater Facilities Master Plan
0 3,000 6,000 Feet
"1 inch = 7,511.83 feet
DRAFT
IEUA WASTEWATER FACILITIES MASTER PLAN TM 3 REGIONAL TRUNK SEWER ANALYSIS
17
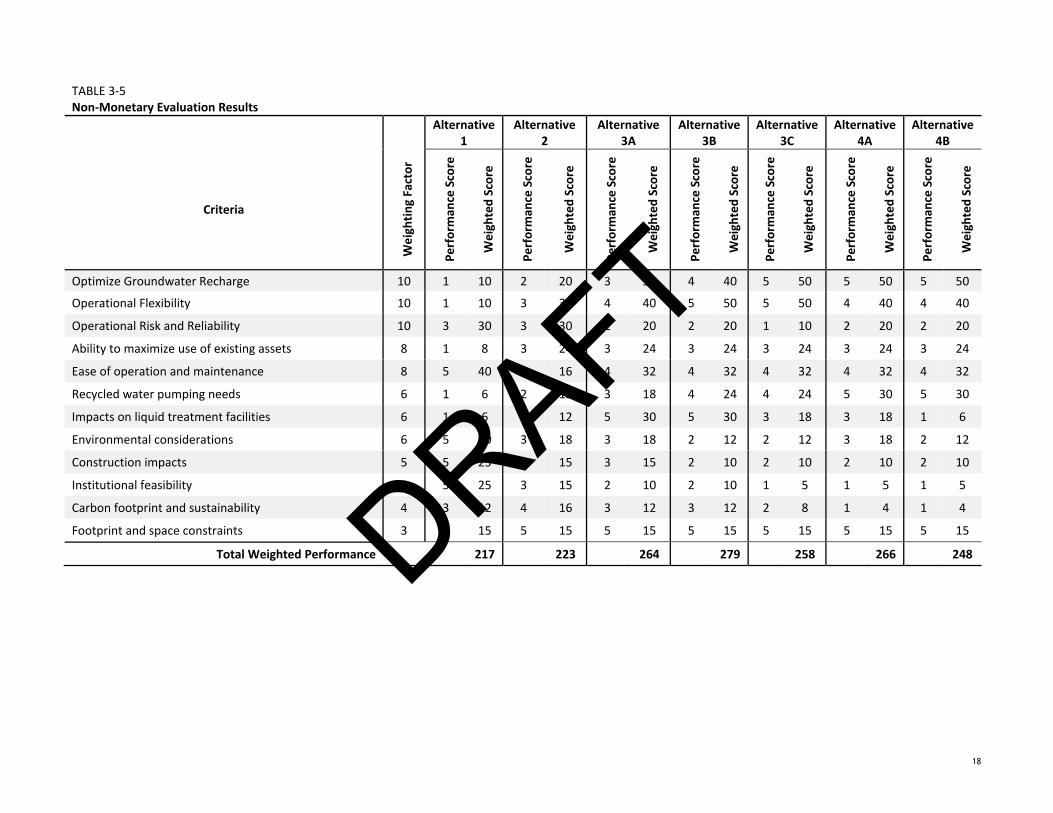
4.3 Evaluation of Proposed Flow Diversion Alternatives The Consultant Team used the SMART evaluation approach described above to conduct a non‐monetary evaluation of the flow diversion alternatives. The non‐monetary and monetary evaluations are summarized in this section of this technical memorandum. The non‐monetary and monetary evaluations are ultimately combined as a means to develop a cost benefit analysis of the alternatives.
4.3.1 Non-monetary Evaluation Each alternative was evaluated relative to one another using the SMART criteria described previously in this memorandum. Each evaluation criterion for each alternative was given a performance score between one (1) and five (5). The performance score was multiplied by the weighting factor for each criterion to develop a weighted score that criterion. The total weighted performance for each alternative was then determined by summing the weighted scores for each alternative. The results of the evaluations are summarized in Table 3‐5.
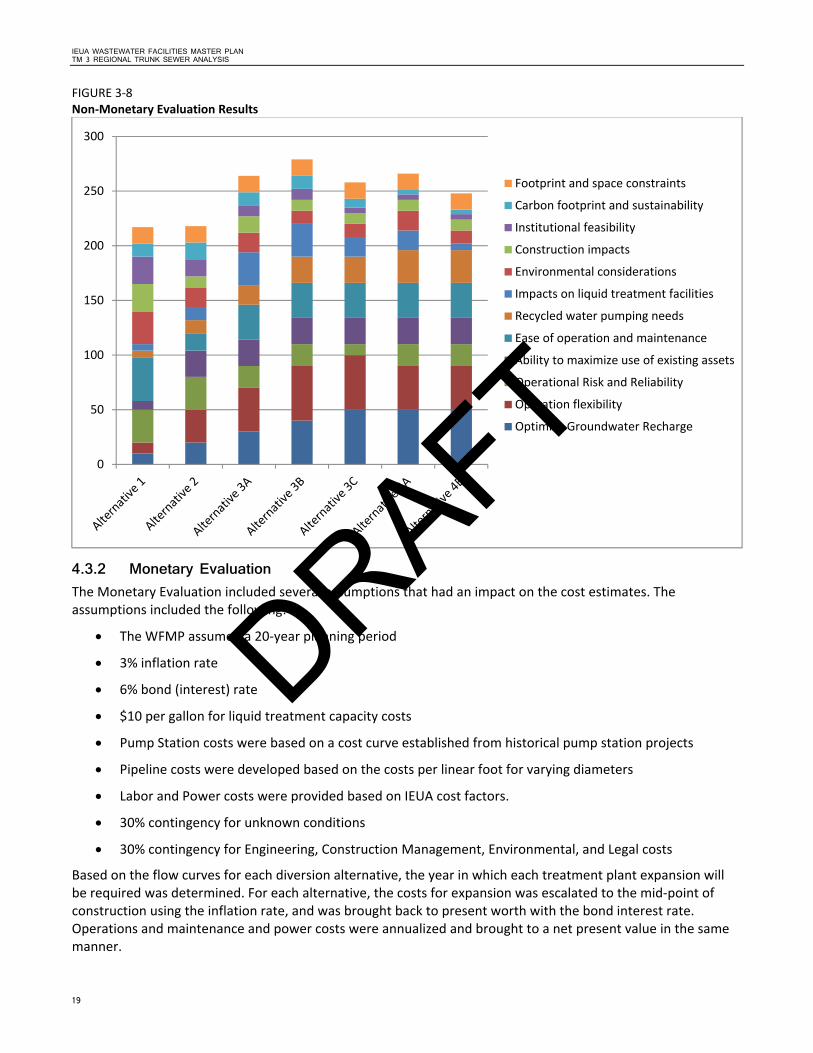
As illustrated in Table 3‐5, the scores ranged from a low for Alternative 1 of 217 to a high of 279 for Alternative 3B. Figure 3‐8 depicts a summary of the relative weights of each criterion for each alternative. The bars show the contribution of each weighted score towards the total score for each alternative. As shown in the chart, Operational Flexibility, Optimizing Groundwater Recharge, and Ease of Operation and Maintenance had the biggest impact of the total performance scores for each alternative.
DRAFT
18
TABLE 3‐5 Non‐Monetary Evaluation Results
Alternative
1 Alternative
2 Alternative
3A Alternative
3B Alternative
3C Alternative
4A Alternative
4B
Criteria
Weighting Factor
Perform
ance Score
Weighted Score
Perform
ance Score
Weighted Score
Perform
ance Score
Weighted Score
Perform
ance Score
Weighted Score
Perform
ance Score
Weighted Score
Perform
ance Score
Weighted Score
Perform
ance Score
Weighted Score
Optimize Groundwater Recharge 10 1 10 2 20 3 30 4 40 5 50 5 50 5 50
Operational Flexibility 10 1 10 3 30 4 40 5 50 5 50 4 40 4 40
Operational Risk and Reliability 10 3 30 3 30 2 20 2 20 1 10 2 20 2 20
Ability to maximize use of existing assets 8 1 8 3 24 3 24 3 24 3 24 3 24 3 24
Ease of operation and maintenance 8 5 40 2 16 4 32 4 32 4 32 4 32 4 32
Recycled water pumping needs 6 1 6 2 12 3 18 4 24 4 24 5 30 5 30
Impacts on liquid treatment facilities 6 1 6 2 12 5 30 5 30 3 18 3 18 1 6
Environmental considerations 6 5 30 3 18 3 18 2 12 2 12 3 18 2 12
Construction impacts 5 5 25 3 15 3 15 2 10 2 10 2 10 2 10
Institutional feasibility 5 5 25 3 15 2 10 2 10 1 5 1 5 1 5
Carbon footprint and sustainability 4 3 12 4 16 3 12 3 12 2 8 1 4 1 4
Footprint and space constraints 3 5 15 5 15 5 15 5 15 5 15 5 15 5 15
Total Weighted Performance 217 223 264 279 258 266 248 DRAFT
IEUA WASTEWATER FACILITIES MASTER PLAN TM 3 REGIONAL TRUNK SEWER ANALYSIS
19
FIGURE 3‐8 Non‐Monetary Evaluation Results
4.3.2 Monetary Evaluation The Monetary Evaluation included several assumptions that had an impact on the cost estimates. The assumptions included the following:
The WFMP assumed a 20‐year planning period
3% inflation rate
6% bond (interest) rate
$10 per gallon for liquid treatment capacity costs
Pump Station costs were based on a cost curve established from historical pump station projects
Pipeline costs were developed based on the costs per linear foot for varying diameters
Labor and Power costs were provided based on IEUA cost factors.
30% contingency for unknown conditions
30% contingency for Engineering, Construction Management, Environmental, and Legal costs
Based on the flow curves for each diversion alternative, the year in which each treatment plant expansion will be required was determined. For each alternative, the costs for expansion was escalated to the mid‐point of construction using the inflation rate, and was brought back to present worth with the bond interest rate. Operations and maintenance and power costs were annualized and brought to a net present value in the same manner.
0
50
100
150
200
250
300
Footprint and space constraints
Carbon footprint and sustainability
Institutional feasibility
Construction impacts
Environmental considerations
Impacts on liquid treatment facilities
Recycled water pumping needs
Ease of operation and maintenance
Ability to maximize use of existing assets
Operational Risk and Reliability
Operation flexibility
Optimize Groundwater Recharge
DRAFT
IEUA WASTEWATER FACILITIES MASTER PLAN TM 3 REGIONAL TRUNK SEWER ANALYSIS
20
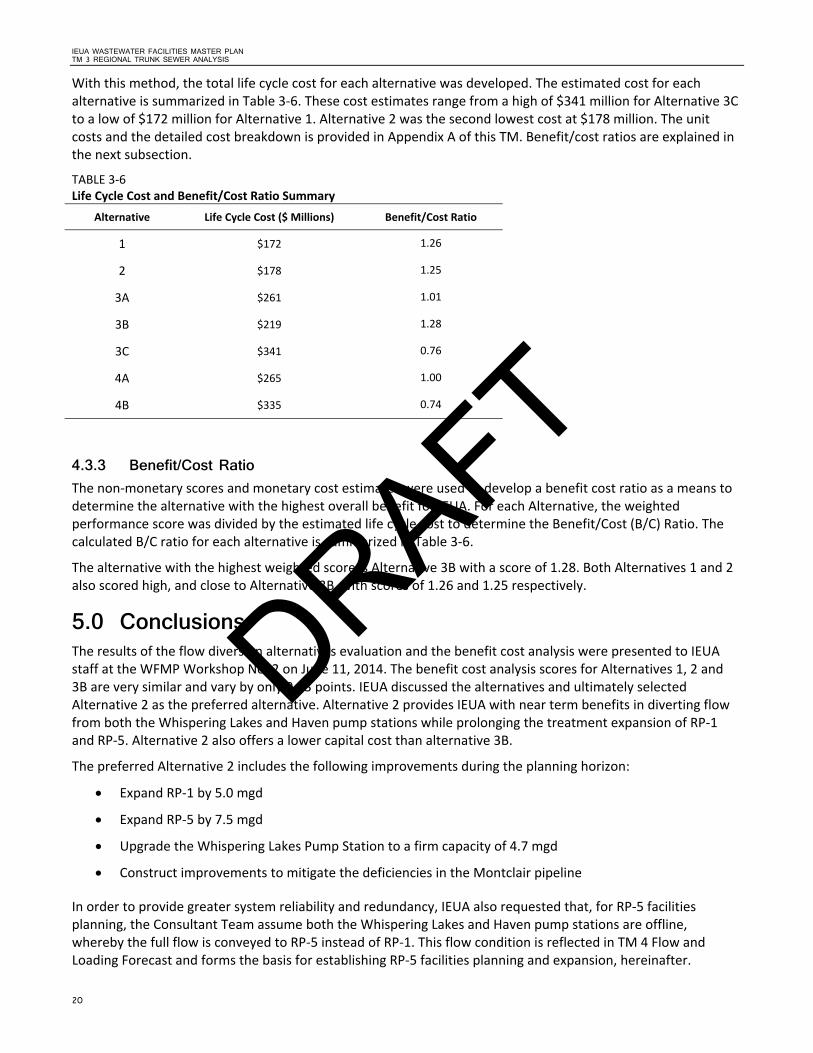
With this method, the total life cycle cost for each alternative was developed. The estimated cost for each alternative is summarized in Table 3‐6. These cost estimates range from a high of $341 million for Alternative 3C to a low of $172 million for Alternative 1. Alternative 2 was the second lowest cost at $178 million. The unit costs and the detailed cost breakdown is provided in Appendix A of this TM. Benefit/cost ratios are explained in the next subsection.
TABLE 3‐6 Life Cycle Cost and Benefit/Cost Ratio Summary
Alternative Life Cycle Cost ($ Millions) Benefit/Cost Ratio
1 $172 1.26
2 $178 1.25
3A $261 1.01
3B $219 1.28
3C $341 0.76
4A $265 1.00
4B $335 0.74
4.3.3 Benefit/Cost Ratio The non‐monetary scores and monetary cost estimates were used to develop a benefit cost ratio as a means to determine the alternative with the highest overall benefit for IEUA. For each Alternative, the weighted performance score was divided by the estimated life cycle cost to determine the Benefit/Cost (B/C) Ratio. The calculated B/C ratio for each alternative is summarized in Table 3‐6.
The alternative with the highest weighted score is Alternative 3B with a score of 1.28. Both Alternatives 1 and 2 also scored high, and close to Alternative 3B, with scores of 1.26 and 1.25 respectively.
5.0 Conclusions The results of the flow diversion alternatives evaluation and the benefit cost analysis were presented to IEUA staff at the WFMP Workshop No. 2 on June 11, 2014. The benefit cost analysis scores for Alternatives 1, 2 and 3B are very similar and vary by only 0.03 points. IEUA discussed the alternatives and ultimately selected Alternative 2 as the preferred alternative. Alternative 2 provides IEUA with near term benefits in diverting flow from both the Whispering Lakes and Haven pump stations while prolonging the treatment expansion of RP‐1 and RP‐5. Alternative 2 also offers a lower capital cost than alternative 3B.
The preferred Alternative 2 includes the following improvements during the planning horizon:
Expand RP‐1 by 5.0 mgd
Expand RP‐5 by 7.5 mgd
Upgrade the Whispering Lakes Pump Station to a firm capacity of 4.7 mgd
Construct improvements to mitigate the deficiencies in the Montclair pipeline
In order to provide greater system reliability and redundancy, IEUA also requested that, for RP‐5 facilities planning, the Consultant Team assume both the Whispering Lakes and Haven pump stations are offline, whereby the full flow is conveyed to RP‐5 instead of RP‐1. This flow condition is reflected in TM 4 Flow and Loading Forecast and forms the basis for establishing RP‐5 facilities planning and expansion, hereinafter.
DRAFT
IEUA WASTEWATER FACILITIES MASTER PLAN TM 3 REGIONAL TRUNK SEWER ANALYSIS
21
Appendix A Cost Estimates
DRAFT

DRAFT
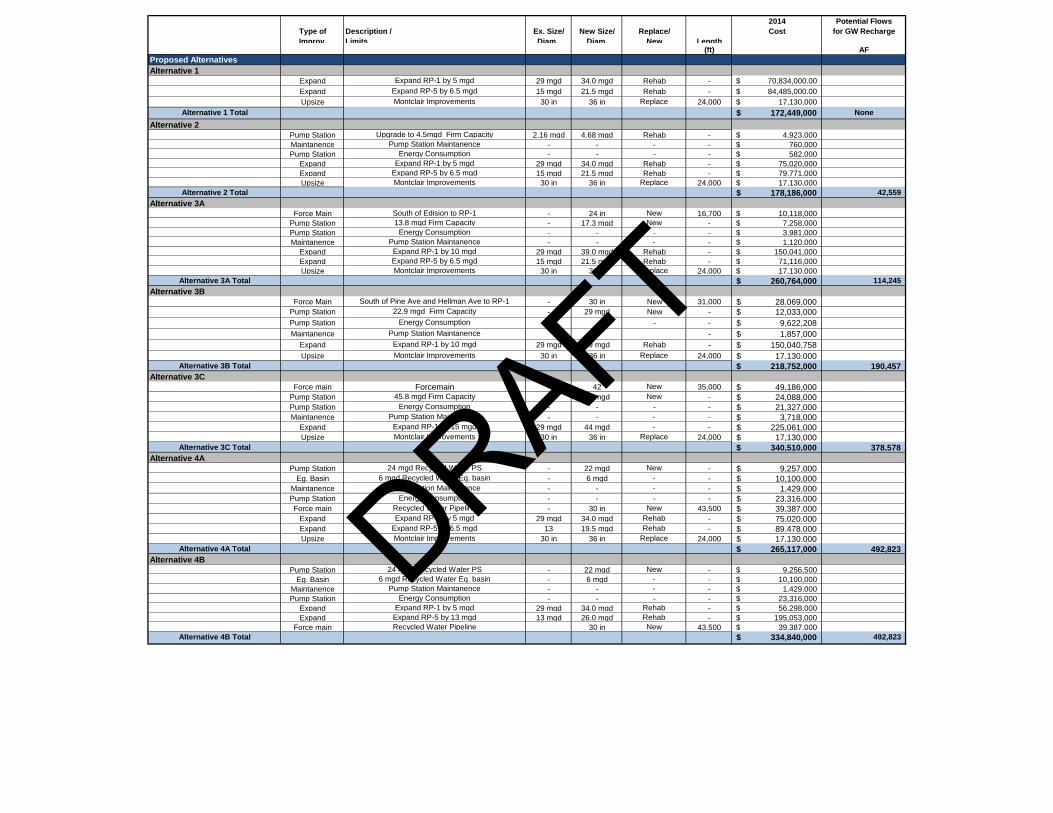
2014 Potential Flows
Type of Description / Ex. Size/ New Size/ Replace/ Cost for GW Recharge
Improv. Limits Diam. Diam. New Length(ft) AF
Proposed Alternatives
Alternative 1
Expand Expand RP-1 by 5 mgd 29 mgd 34.0 mgd Rehab - 70,834,000.00$
Expand Expand RP-5 by 6.5 mgd 15 mgd 21.5 mgd Rehab - 84,485,000.00$
Upsize Montclair Improvements 30 in 36 in Replace 24,000 17,130,000$
Alternative 1 Total 172,449,000$ None
Alternative 2
Pump Station Upgrade to 4.5mgd Firm Capacity 2.16 mgd 4.68 mgd Rehab - 4,923,000$
Maintanence Pump Station Maintanence - - - - 760,000$
Pump Station Energy Consumption - - - - 582,000$
Expand Expand RP-1 by 5 mgd 29 mgd 34.0 mgd Rehab - 75,020,000$
Expand Expand RP-5 by 6.5 mgd 15 mgd 21.5 mgd Rehab - 79,771,000$
Upsize Montclair Improvements 30 in 36 in Replace 24,000 17,130,000$
Alternative 2 Total 178,186,000$ 42,559
Alternative 3A
Force Main South of Edision to RP-1 - 24 in New 16,700 10,118,000$
Pump Station 13.8 mgd Firm Capacity - 17.3 mgd New - 7,258,000$
Pump Station Energy Consumption - - - - 3,981,000$
Maintanence Pump Station Maintanence - - - - 1,120,000$
Expand Expand RP-1 by 10 mgd 29 mgd 39.0 mgd Rehab - 150,041,000$
Expand Expand RP-5 by 6.5 mgd 15 mgd 21.5 mgd Rehab - 71,116,000$
Upsize Montclair Improvements 30 in 36 in Replace 24,000 17,130,000$
Alternative 3A Total 260,764,000$ 114,245
Alternative 3B
Force Main South of Pine Ave and Hellman Ave to RP-1 - 30 in New 31,000 28,069,000$ Pump Station 22.9 mgd Firm Capacity - 29 mgd New - 12,033,000$
Pump Station Energy Consumption - - - - 9,622,208$
Maintanence Pump Station Maintanence - 1,857,000$
Expand Expand RP-1 by 10 mgd 29 mgd 39 mgd Rehab - 150,040,758$
Upsize Montclair Improvements 30 in 36 in Replace 24,000 17,130,000$ Alternative 3B Total 218,752,000$ 190,457
Alternative 3C
Force main Forcemain - 42 New 35,000 49,186,000$ Pump Station 45.8 mgd Firm Capacity - 57 mgd New - 24,088,000$ Pump Station Energy Consumption - - - - 21,327,000$ Maintanence Pump Station Maintanence - - - - 3,718,000$
Expand Expand RP-1 by 15 mgd 29 mgd 44 mgd - - 225,061,000$ Upsize Montclair Improvements 30 in 36 in Replace 24,000 17,130,000$
Alternative 3C Total 340,510,000$ 378,578
Alternative 4A
Pump Station 24 mgd Recycled Water PS - 22 mgd New - 9,257,000$ Eg. Basin 6 mgd Recycled Water Eq. basin - 6 mgd - - 10,100,000$
Maintanence Pump Station Maintanence - - - - 1,429,000$ Pump Station Energy Consumption - - - - 23,316,000$ Force main Recycled Water Pipeline - 30 in New 43,500 39,387,000$
Expand Expand RP-1 by 5 mgd 29 mgd 34.0 mgd Rehab - 75,020,000$ Expand Expand RP-5 by 6.5 mgd 13 19.5 mgd Rehab - 89,478,000$ Upsize Montclair Improvements 30 in 36 in Replace 24,000 17,130,000$
Alternative 4A Total 265,117,000$ 492,823
Alternative 4B
Pump Station 24 mgd Recycled Water PS - 22 mgd New - 9,256,500$
Eg. Basin 6 mgd Recycled Water Eq. basin - 6 mgd - - 10,100,000$
Maintanence Pump Station Maintanence - - - - 1,429,000$
Pump Station Energy Consumption - - - - 23,316,000$
Expand Expand RP-1 by 5 mgd 29 mgd 34.0 mgd Rehab - 56,298,000$
Expand Expand RP-5 by 13 mgd 13 mgd 26.0 mgd Rehab - 195,053,000$
Force main Recycled Water Pipeline 30 in New 43,500 39,387,000$
Alternative 4B Total 334,840,000$ 492,823
DRAFT